Article

Comparing Sensor-Based Adjustment of Weed Harrowing Intensity with Conventional Harrowing under Heterogeneous Field Conditions

Department of Weed Science, University of Hohenheim, 70599 Stuttgart, Germany
*
Author to whom correspondence should be addressed.
Agronomy 2021, 11(8), 1605; https://doi.org/10.3390/agronomy11081605
Submission received: 16 July 2021 / Revised: 9 August 2021 / Accepted: 10 August 2021 / Published: 12 August 2021
(This article belongs to the Special Issue Application of Sensors for Mechanical Weed Control)

Abstract

:
Setting the right intensity is crucial for the success of post-emergence weed harrowing in cereals. The percentage of crop soil cover (CSC) correlates with the selectivity of weed harrowing. Therefore, real-time camera-based measurements of CSC offer a novel approach to automatically adjust the intensity of harrowing. The intensity of harrowing is varied by hydraulic steering of the tine angle. Five field experiments in cereals were conducted at three locations in southwestern Germany in 2019 and 2020 to measure the effect of camera-based harrowing (2020) and conventional harrowing on weed control efficacy (WCE), crop density, and grain yield. For this purpose, pair-wise comparisons of three fixed harrowing intensities (10°, 40°, and 70° tine angle) and three predefined CSC thresholds (CSC of 10%, 20%, and 60%) were realized in randomized complete block designs. Camera-based intensity adjustment resulted in more homogeneous CSC across the whole plot (6–16% less standard deviation variation) compared to conventional fixed settings of the tine angle. Crop density, WCE, crop biomass, and grain yield were significantly higher for camera-based harrowing than for conventional harrowing. WCE and yields of all automatic adjusted harrowing treatments were equal to the herbicide control plots. Camera-based harrowing provides a robust technology for effective weed management with a lower risk of crop damage than conventional harrowing.

Graphical Abstract

1. Introduction

The current problems with herbicide resistant weeds [1], the adverse effects of herbicides on the environment, their residues in the food chain [2], and the decline of agrobiodiversity [3] can be associated with the frequent use of herbicides. Mechanical weed control methods including harrowing and hoeing can reduce the reliance on chemical weed control and provides an efficient alternative to herbicides.
Among the mechanical weed control treatments, harrowing achieves a high labor-efficiency and up to 90% weed control efficacy (WCE) can be achieved against annual dicotyledonous weed species, if weed plants are relatively small compared to crops and soil is dry during and after harrowing [4]. However, WCE can also be as low as 40% if the environmental conditions are less favorable and mostly grass weeds and perennial species occur [5]. Under less favorable conditions, maximum WCE reached 62% if pre- and post-emergence harrowing were combined [5].
The working mechanism of harrowing implies a whole field cultivation within and between crop rows, and therefore, it needs to be balanced between maximum weed control and minimal crop damage. The selectivity, described as the ratio between the percentage of WCE and the percentage of crop soil cover (CSC) immediately after harrowing [6,7], is a suitable parameter to evaluate the success of post-emergence harrowing. If the intensity of weed harrowing is too low, WCE and CSC are both low and consequently, selectivity is also low. If the intensity is too high, WCE and CSC are high, which again causes a low selectivity. A high selectivity in cereals is only achieved if CSC remains constantly in the range around 20%, which the crop can compensate for by higher growth rates after harrowing [8,9]. The intensity of weed harrowing can be varied by changing the tine angle, tine diameter, driving speed, and the number of passes across the field [7,10,11]. The problem of conventional harrowing is that the intensity is usually set once at the beginning of the treatment. The initial intensity is then kept constant for the whole field. Under heterogenous field conditions, however, conventional harrowing with a fixed intensity may cause crop damage at locations with light soils and less crop coverage and low WCE in areas with high crop coverage and heavy soils. Therefore, harrow intensity needs to be adjusted continuously to achieve high selectivity over the entire field.
Several studies have been conducted to develop sensor-based technologies for the automatic adjustment of the harrowing intensity [12,13,14,15]. Peteinatos et al. [14] selected weed density measured by bi-spectral cameras to define the optimum harrowing intensity. Rueda-Ayala et al. [16] assessed the soil resistance and plant coverage with ultrasonic sensors to adjust the harrowing intensity. Rueda-Ayala et al. and Engelke [12,13] showed that crop damage in winter wheat and spring barley were reduced, while WCE and crop biomass were increased by continuously adjusting harrowing intensity to variable field conditions. In a recent study, Gerhards et al. [9] implemented an online control system based on real-time RGB-cameras to realize a constant CSC by hydraulic adjustment of the harrow tine angle.
The objectives of this study were to evaluate WCE, CSC, crop density, crop biomass, and grain yield of harrowing treatments with a continuous regulation of intensity and fixed intensities in winter wheat and spring oats. It was investigated whether camera-based harrowing can compensate for field heterogeneity and realize a preset CSC value across the whole plot. It was also studied as to what extent spring oats and winter wheat can tolerate different CSC values directly after harrowing without yield loss. The hypotheses tested were that camera-based harrow adjustment (i) reduces variations in CSC across the plots; (ii) increases WCE and selectivity compared to conventional harrowing with a fixed intensity; and (iii) results in similar yields to the standard herbicide treatments.

2. Materials and Methods

2.1. Experimental Site and Design

Three field experiments, two in winter wheat (Triticum aestivum) cv. Porthus and one in spring oats (Avena sativa) cv. Apollon, were conducted in 2019. The experiments were located in southwestern Germany in Hirrlingen (48.4° N, 8.89° E) at an elevation of 423 m above sea level and in Klein Hohenheim (KHH) (48.73° N, 9.20° E) with an altitude of 400 m above sea level. In 2020, two additional trials were performed in winter wheat cv. Patras and in spring oats cv. Armani at Hirrlingen and Oberer Lindenhof in Eningen (48.47° N, 9.30° E) at an altitude of 720 m above sea level.
Hirrlingen and Oberer Lindenhof are conventional farms and KHH is managed as an ecological farm. The average annual rainfall for Hirrlingen is 796 mm, 690 mm in KHH, and 790 mm in Eningen. The average yearly temperature for Hirrlingen is 8.6 °C, in KHH 10.1 °C, and in Eningen 6.8 °C (due to higher altitude). In 2019, KHH received 140 mm less rainfall than the average and temperature was 0.9 °C higher than the mean. Precipitation in Hirrlingen 2019 were slightly higher than the average (823 mm) and temperature was almost equal to the long-term average (10.2 °C). In 2020, average temperature at Eningen was 2.1 °C higher than the long-term mean and annual rainfalls were 20 mm higher than the mean.
Tillage before sowing was repeated within all experiments. First, the soil was ploughed (30 cm), followed by a seedbed preparation with a rotary hoe. Cereals were sown in conventional densities and row distance was 150 mm in all five field trials (Table 1). The soil texture was classified as a silty loam at all three locations. Silt content was slightly higher in KHH (Table 1).
All five trials were set up as a randomized complete block design with four repetitions. In 2019, the three experiments contained five treatments and in 2020, eight treatments were tested in both experiments. The plot size in all trials was 6 × 25 m, with the longer side of the plots in the sowing direction of the crop. The treatments consisted of an untreated control (CON), a herbicide control treatment (HERB) (Hirrlingen and Eningen) or manual weeding (KHH), three conventional (2019 and 2020), and three automatic harrowing treatments (2020). The tine angle in the automatic treatments were adjusted continuously during harrowing according to three pre-set CSC values of 10%, 20%, or 60%. The conventional treatments had three fixed levels of tine angles (Man_I = low tine angle 10°, Man_II = medium tine angle 40°, and Man_III = strong tine angle 70°) that were adjusted once by hand in a strip next to the experimental plots and were not changed during the treatment. A tine angle of 10° corresponded to 10% CSC, a tine angle of 40° corresponded to 20% CSC, and the most aggressive conventional tine angle of 70° was related to 60% CSC. That allowed a pair-wise comparison of conventional and camera-based harrowing. Table 2 summarizes the treatments in the harrowing experiments in cereals with their different levels of intensity.
The control plots were left untreated for the entire growing season. However, it was ensured that the untreated control also received the same number of passes with the tractor wheels as the mechanical and herbicide treatments. Manual weeding in KHH was performed by pulling out weeds by hand several times until the cereals started shooting. During weeding, the person walked along the tractor tracks in order to avoid crop plant damage. Therefore, soil disturbance was reduced to a minimum. Weed harrowing in winter wheat and spring oats was done in one pass during tillering of the crop (BBCH 21–24) in early March. Harrowing was performed parallel to the crop rows with a driving speed of 8 km h−1. At the time of harrowing, the majority of the weed species had developed 2–4 true leaves. Soil conditions were dry and dusty during and at least three days after harrowing without any rainfall in this period. Due to the sunlight and the high temperatures (>25 °C), weeds were damaged almost completely immediately after treatment. There was also no rain one-week before or after the treatments in both years. The herbicides were applied shortly before tillering at crop growth stage BBCH 14–18. The herbicide application in Hirrlingen and Eningen was carried out with a plot sprayer (Schachtner-Fahrzeug- und Gerätetechnik, Ludwigsburg, Germany) equipped with flat jet nozzles (Lechler, AD 120-02) at a pressure of 2.4 bar and a speed up to 6.0. In spring oats, metsulfuron and thifensulfuron (Concert SX, 38.4 g a.i. kg−1 + 384.5 g a.i. kg−1, WG, Cheminova plc) at the recommended field rate of 0.1 kg ha−1 was sprayed. In winter wheat, florasulam and tritosulfuron (Biathlon 4D + 1.0 kg ha−1 Dash E.C., 54 g kg−1 + 714 g kg−1, WG, BASF plc) at the recommended field rate of 0.07 kg ha−1 and propoxycarbazone and mesosulfuron (Atlantis Flex + 0.6 L ha−1 Biopower, 67.5 g a.i. kg−1 and 43.8 g a.i. kg−1, WG, Bayer CropScience plc) at the recommended field rate of 0.2 L ha−1 were applied.

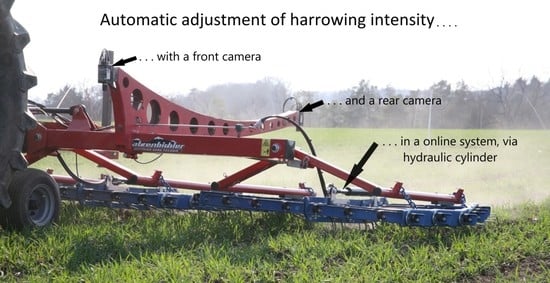
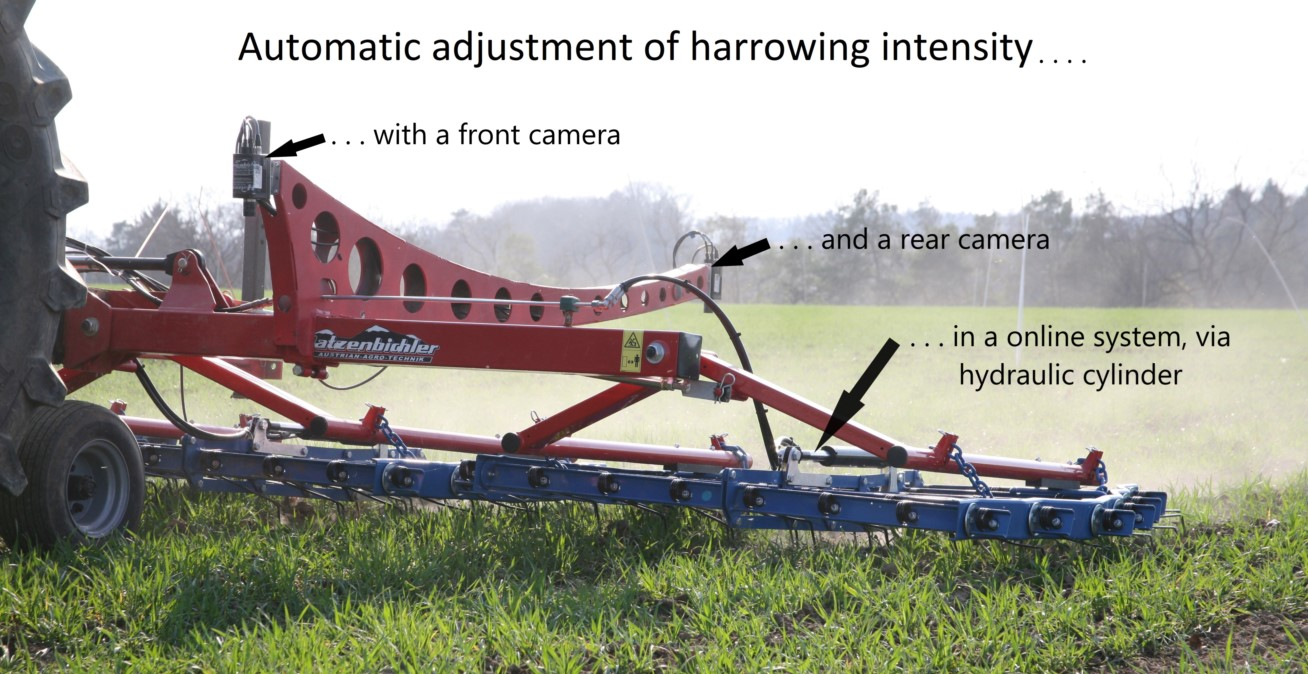
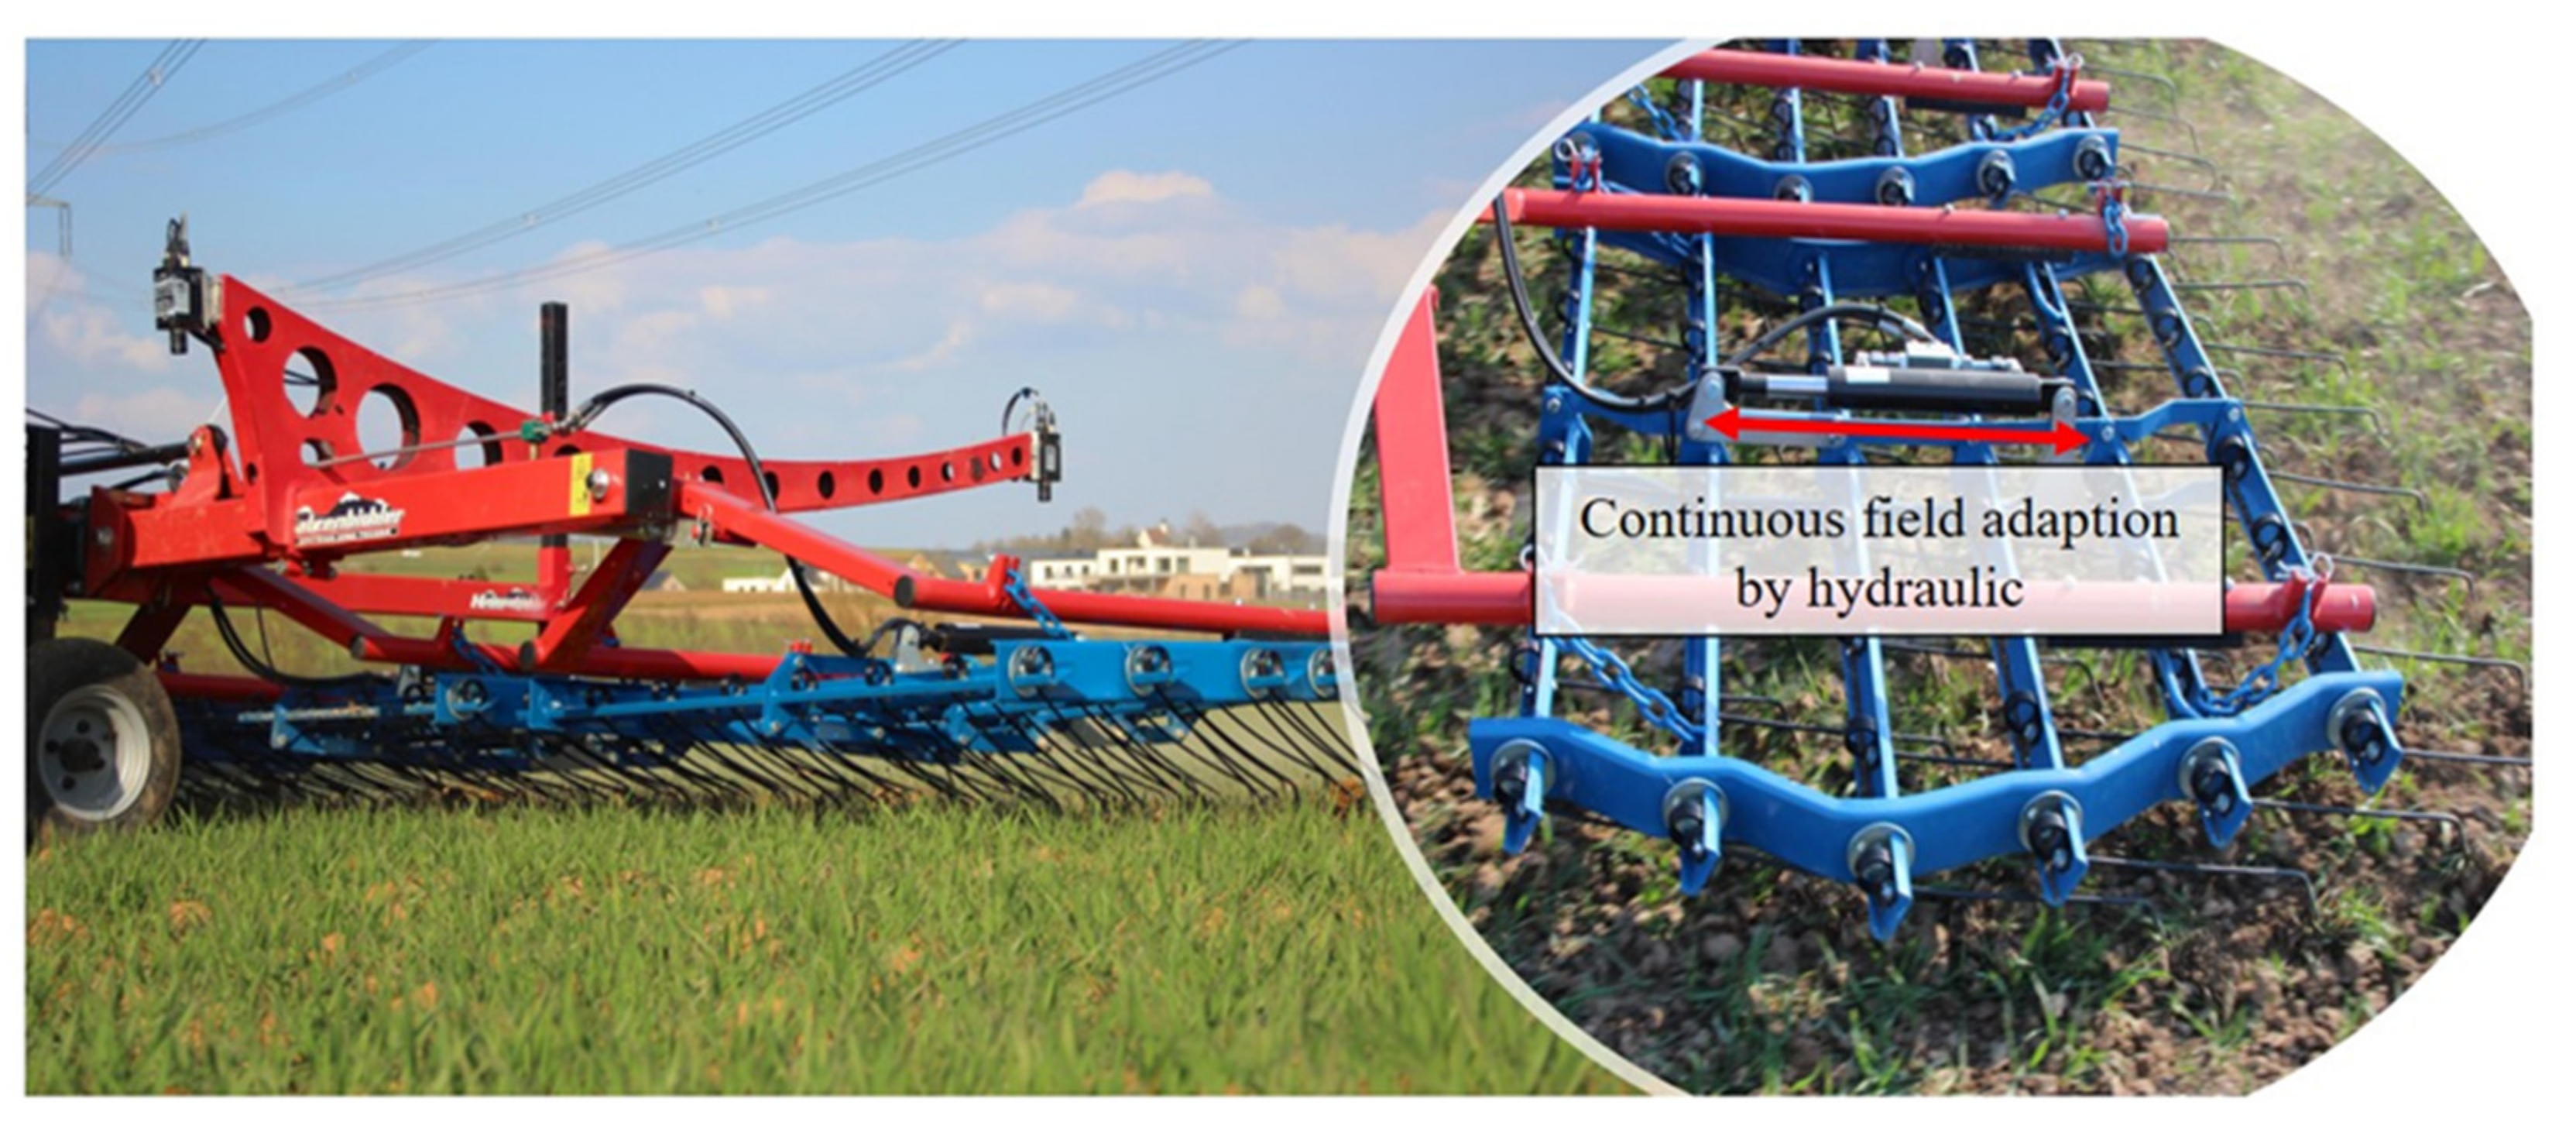
2.2. Camera-Controlled Harrowing Technology

The conventional and automatic harrow treatments were performed with a 6 m wide harrow (Hatzenbichler, St. Andrä, Austria) with flexible tines (6 mm tine diameter, 25 mm distance between the tines, six tine rows, 380 mm tine length, and protected spring winding). The adjustment of the harrowing intensity was achieved by a hydraulic regulation of the tine angle. In automatic mode, the hydraulic cylinder is regulated by a controller containing a decision support system for the continuous adjustment of tine angle based on a threshold value for CSC. Tine angle is increased if the actual CSC is lower than the threshold to increase WCE, and tine angle is decreased if the actual CSC is higher than the threshold to avoid crop damage. CSC is measured online using two RGB cameras mounted before and behind the harrow calculating crop coverage [14] (Figure 1).
The CSC (%) was calculated in accordance with [8] as:
CSC = (100 ∙ (L0 − L))/L0
where L0 represents crop coverage before harrowing and L is the crop coverage measured after harrowing.

2.3. Data Collection

Data assessment was performed identically in all field experiments. Weed density, crop density, CSC, and crop biomass were measured only in the 10 center rows, in order to avoid border effect outliers.
CSC for pair-wise comparison of harrowing treatments were calculated by taking five images at random positions in the plots before harrowing and at the same position directly after harrowing with a digital RGB camera (Panasonic DMC-TZ41). The CSC value was calculated, according to the Equation (7) in [14]. Images were taken from a height of 80 cm, providing a field of view of 100 × 83 cm.
Weed density was counted four random times per plot using a quadrate frame of 0.1 m2. Weed counts were taken one day before treatment, immediately after harrowing, three and 14 days after treatment. WCE was calculated according to [6] as:
WCE = 100% − ds/(0.01 ∙ du)
where ds is the weed density (weeds m−2) directly after application and du is the weed density in the same plot before the application. WCE for the herbicide application was calculated using the counts before and 14 days after treatment. Crop density was counted four times at random positions in each plot along one meter of crop row directly after treatment.
The above-ground plant biomass of 1 m2 in each plot was cut shortly before flowering. The plants were separated into crops and weeds and then placed in a drying chamber for 48 h at 80 °C. Only data for dry crop biomass are shown, because weed biomass was close to zero in all treatments and locations.
Grain yield was recorded in sub-plots of 10 m × 1.25 m using a plot combine harvester (Wintersteiger, Ried im Innkreis, Austria). Similar to the biomass cut, in order to avoid marginal effects, the harvest was focused on the center eight lines of every treatment. The grain yield data presented have been corrected for 86% dry weight.

2.4. Data Analysis

Data were analyzed with the statistical software R (Version 3.4.3, R Foundation for Statistical Computing, Vienna, Austria). Prior to analysis, the data were tested for homogeneity of variance and normal distribution of the residuals by utilizing residual plots (“residual vs. predicted” plot and quantile-quantile plot). An analysis of variance (ANOVA) was performed according to the following linear model:
Yik = μ + ai + bk + eik
where Yik is the measured result (grain yield, dry biomass and WCE) of treatment i at block k. µ denotes the general mean and ai represents the fixed effects of treatment i, while bk and eik represent the random effects of the kth block and the residual error for each plot, respectively. Due to the significant interactions between year and treatments, and between location and treatments, the factors year and location were analyzed separately. For each experiment (location per year), the model was then calculated separately. Means of fixed effects were compared with a Tukey-HSD test at α ≤ 0.05. Standard deviations of CSC were used to demonstrate the effect of camera-based adjustment of the tine angle.

3. Results

3.1. The Five Most Abundant Weed Species at Each Trial Site

Average weed densities before treatments ranged from 35 plants m−2 in winter wheat to 275 plants m−2 in spring oats both in Hirrlingen 2019, representing medium to high infestation levels in cereals (Table 3). The most abundant weed species with their dominance are listed in Table 3. Lamb’s quarters (Chenopodium album L.), the perennial creeping thistle (Cirsium arvense L.), and common knotgrass (Polygonum aviculare L.) were most abundant in spring oats. Cleavers (Galium aparine L.), birdeye speedwell (Veronica persica L.) and shepherd’s purse (Capsella bursa-pastoris L.) occurred in spring oats and winter wheat (Table 3).

3.2. WCE, Crop Dry Mass, and Grain Yield in Hirrlingen and KHH in 2019

The highest WCE was recorded for the herbicide treatments (98–99%). Harrowing was less efficient than chemical weed control at both sites. WCE significantly increased with higher harrowing intensity (Table 4). The lowest intensity (Man_I) resulted in 19–32% WCE, Man_II 59–66%, and Man_III even 73–88% WCE, which was not significantly different from the herbicide treatments.
The highest crop dry mass was observed for Man_II with 291–482 g m−2 at both locations and for the herbicide treatment in Hirrlingen. The highest intensity of harrowing (Man_III) reduced crop dry biomass in spring oats at KHH and winter wheat in Hirrlingen. However, spring oats in Hirrlingen tolerated even higher harrowing intensity and produced equal amounts of dry biomass as Man_II. In the untreated controls, lowest crop dry mass was observed. Man_I ranged between the untreated controls and Man_II.
The highest grain yields with 6.0–10.6 t ha−1 were always recorded in the herbicide plots and in the Man_II treatments. These were significantly higher than the untreated controls (5.0–9.0 t ha−1), the low intensity (Man_I) with 5.5–10.4 t ha−1 and the highest intensity (Man_III) with 5.0–10.1 t ha−1. Winter wheat yielded higher than spring oats in Hirrlingen (Table 4).

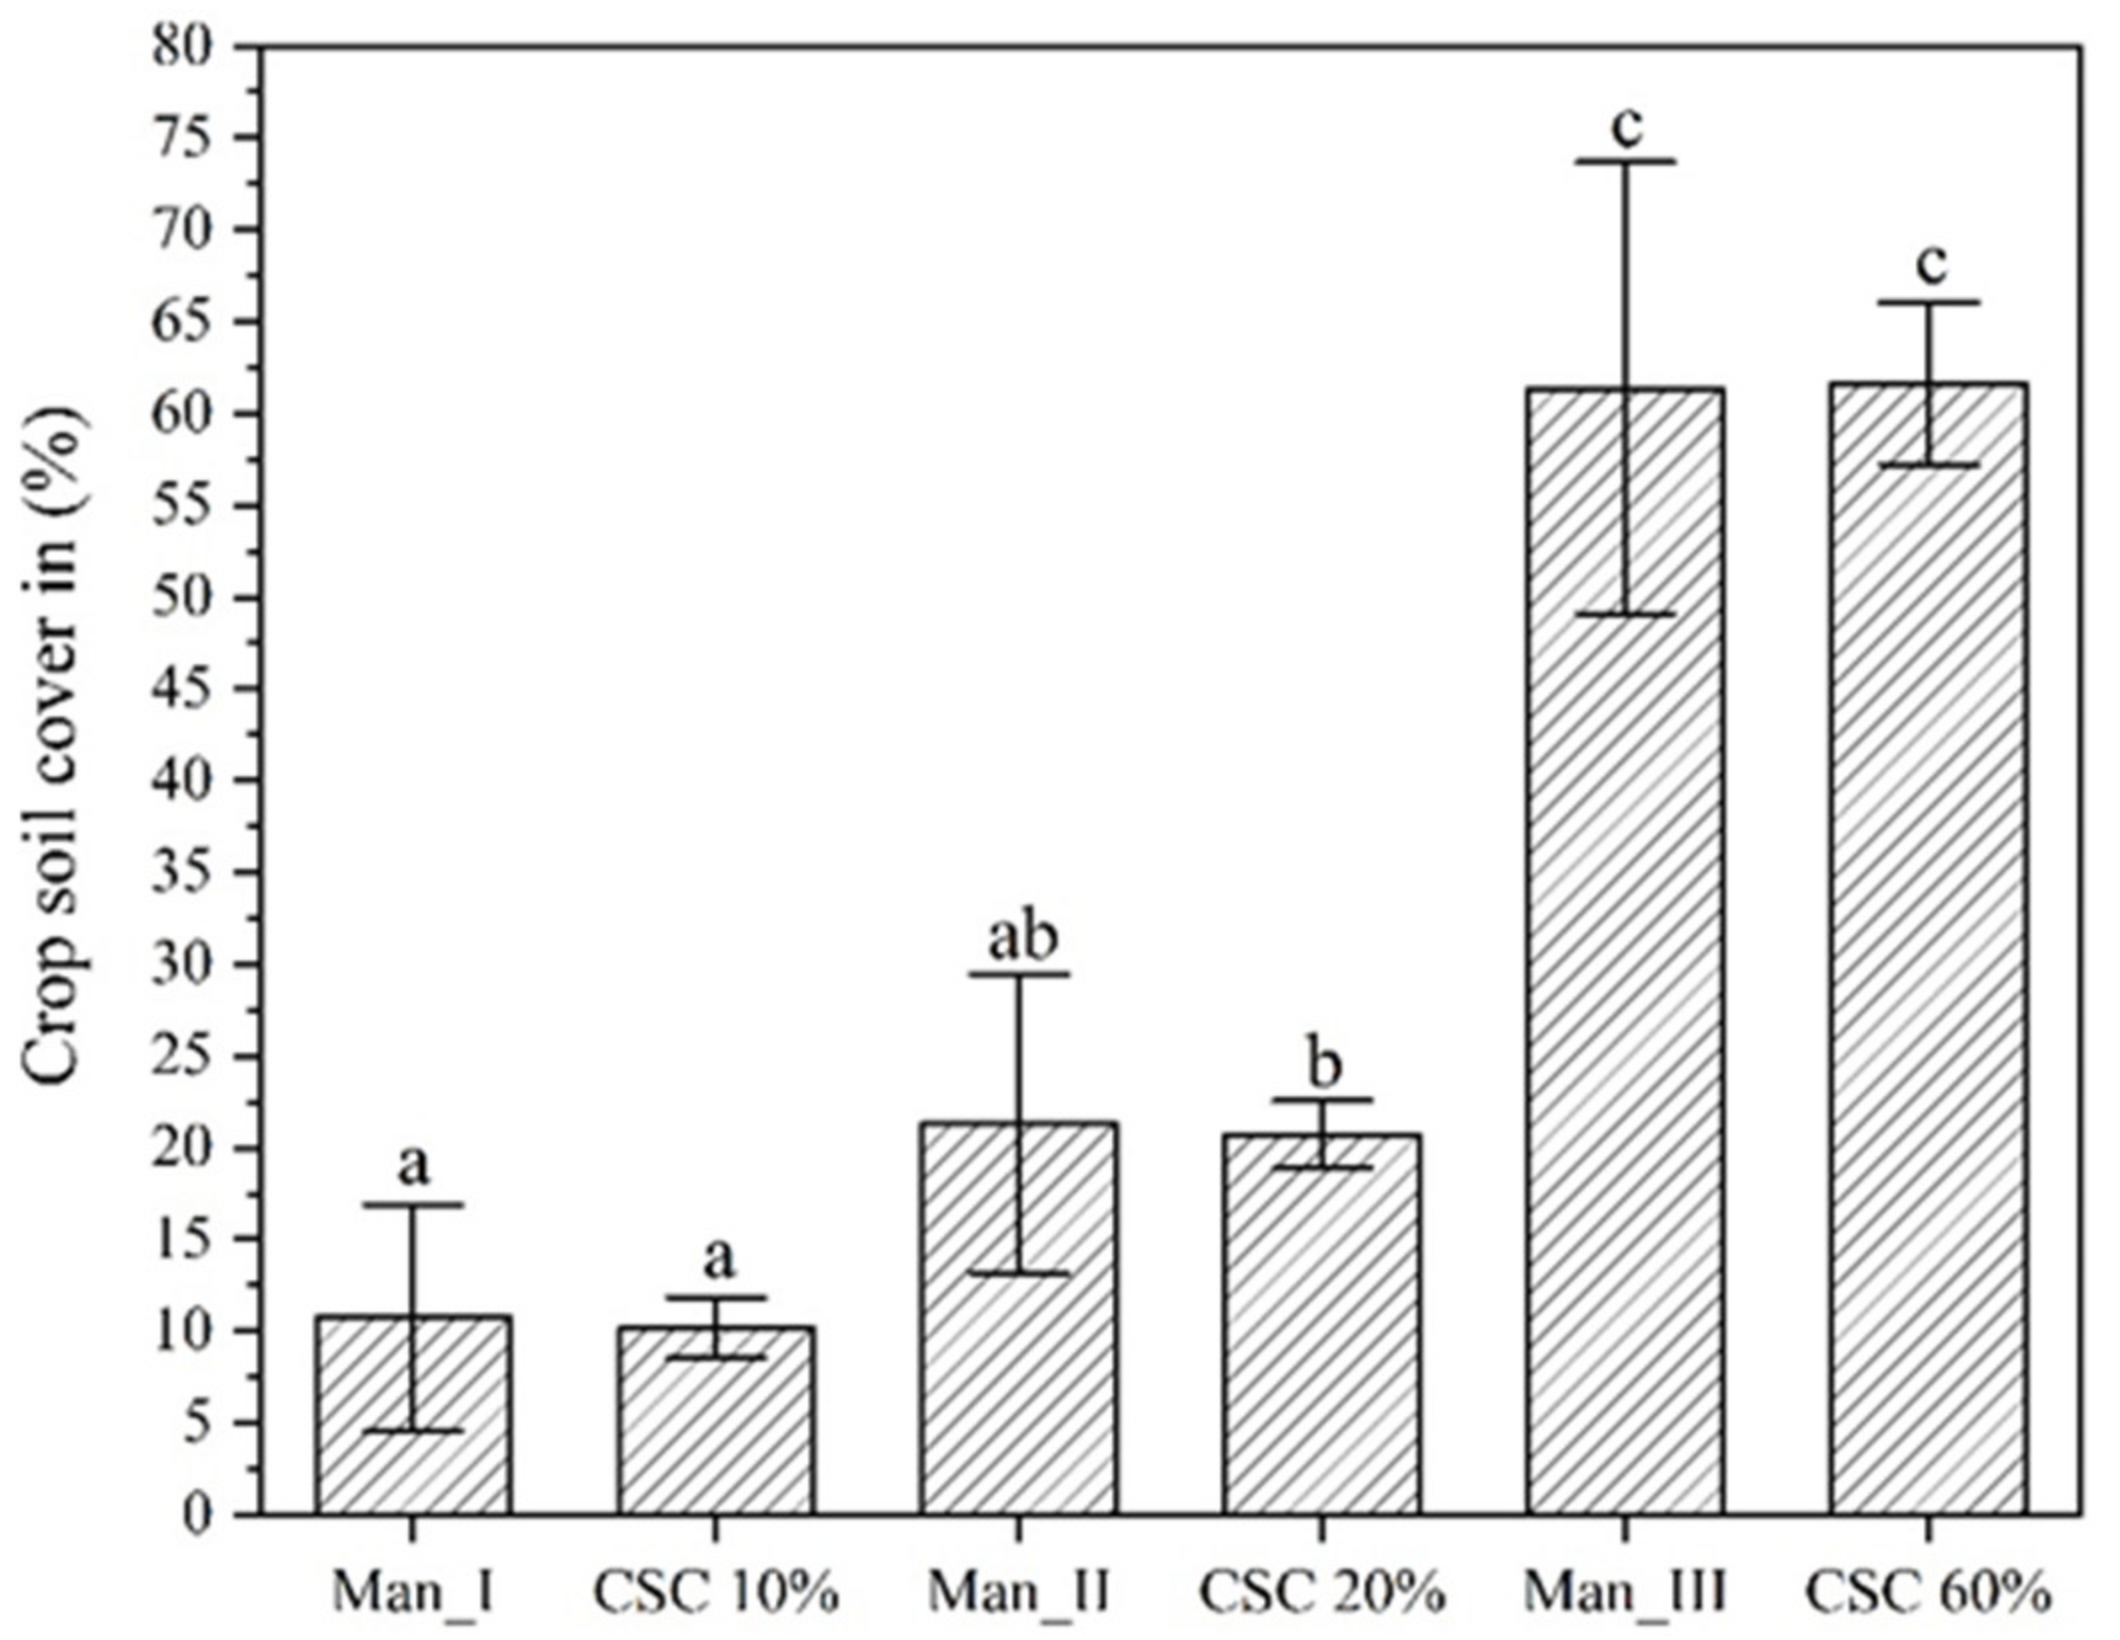
3.3. Mean CSC and Standard Deviation for Conventional and Automatic Settings in Hirrlingen and Eningen in 2020

Standard deviations of CSC were generally higher for conventional harrowing than for camera-controlled harrowing. For the automatic adjustment, standard deviations varied from 3% (CSC 10%) to 9% (CSC 60%), while the standard deviations of the conventional settings varied from 12% (Man_I) to 25% (Man_III). Average CSC, however, were equal for Man_I and CSC 10%, Man_II and CSC 20%, and Man_III and CSC 60% (Figure 2).

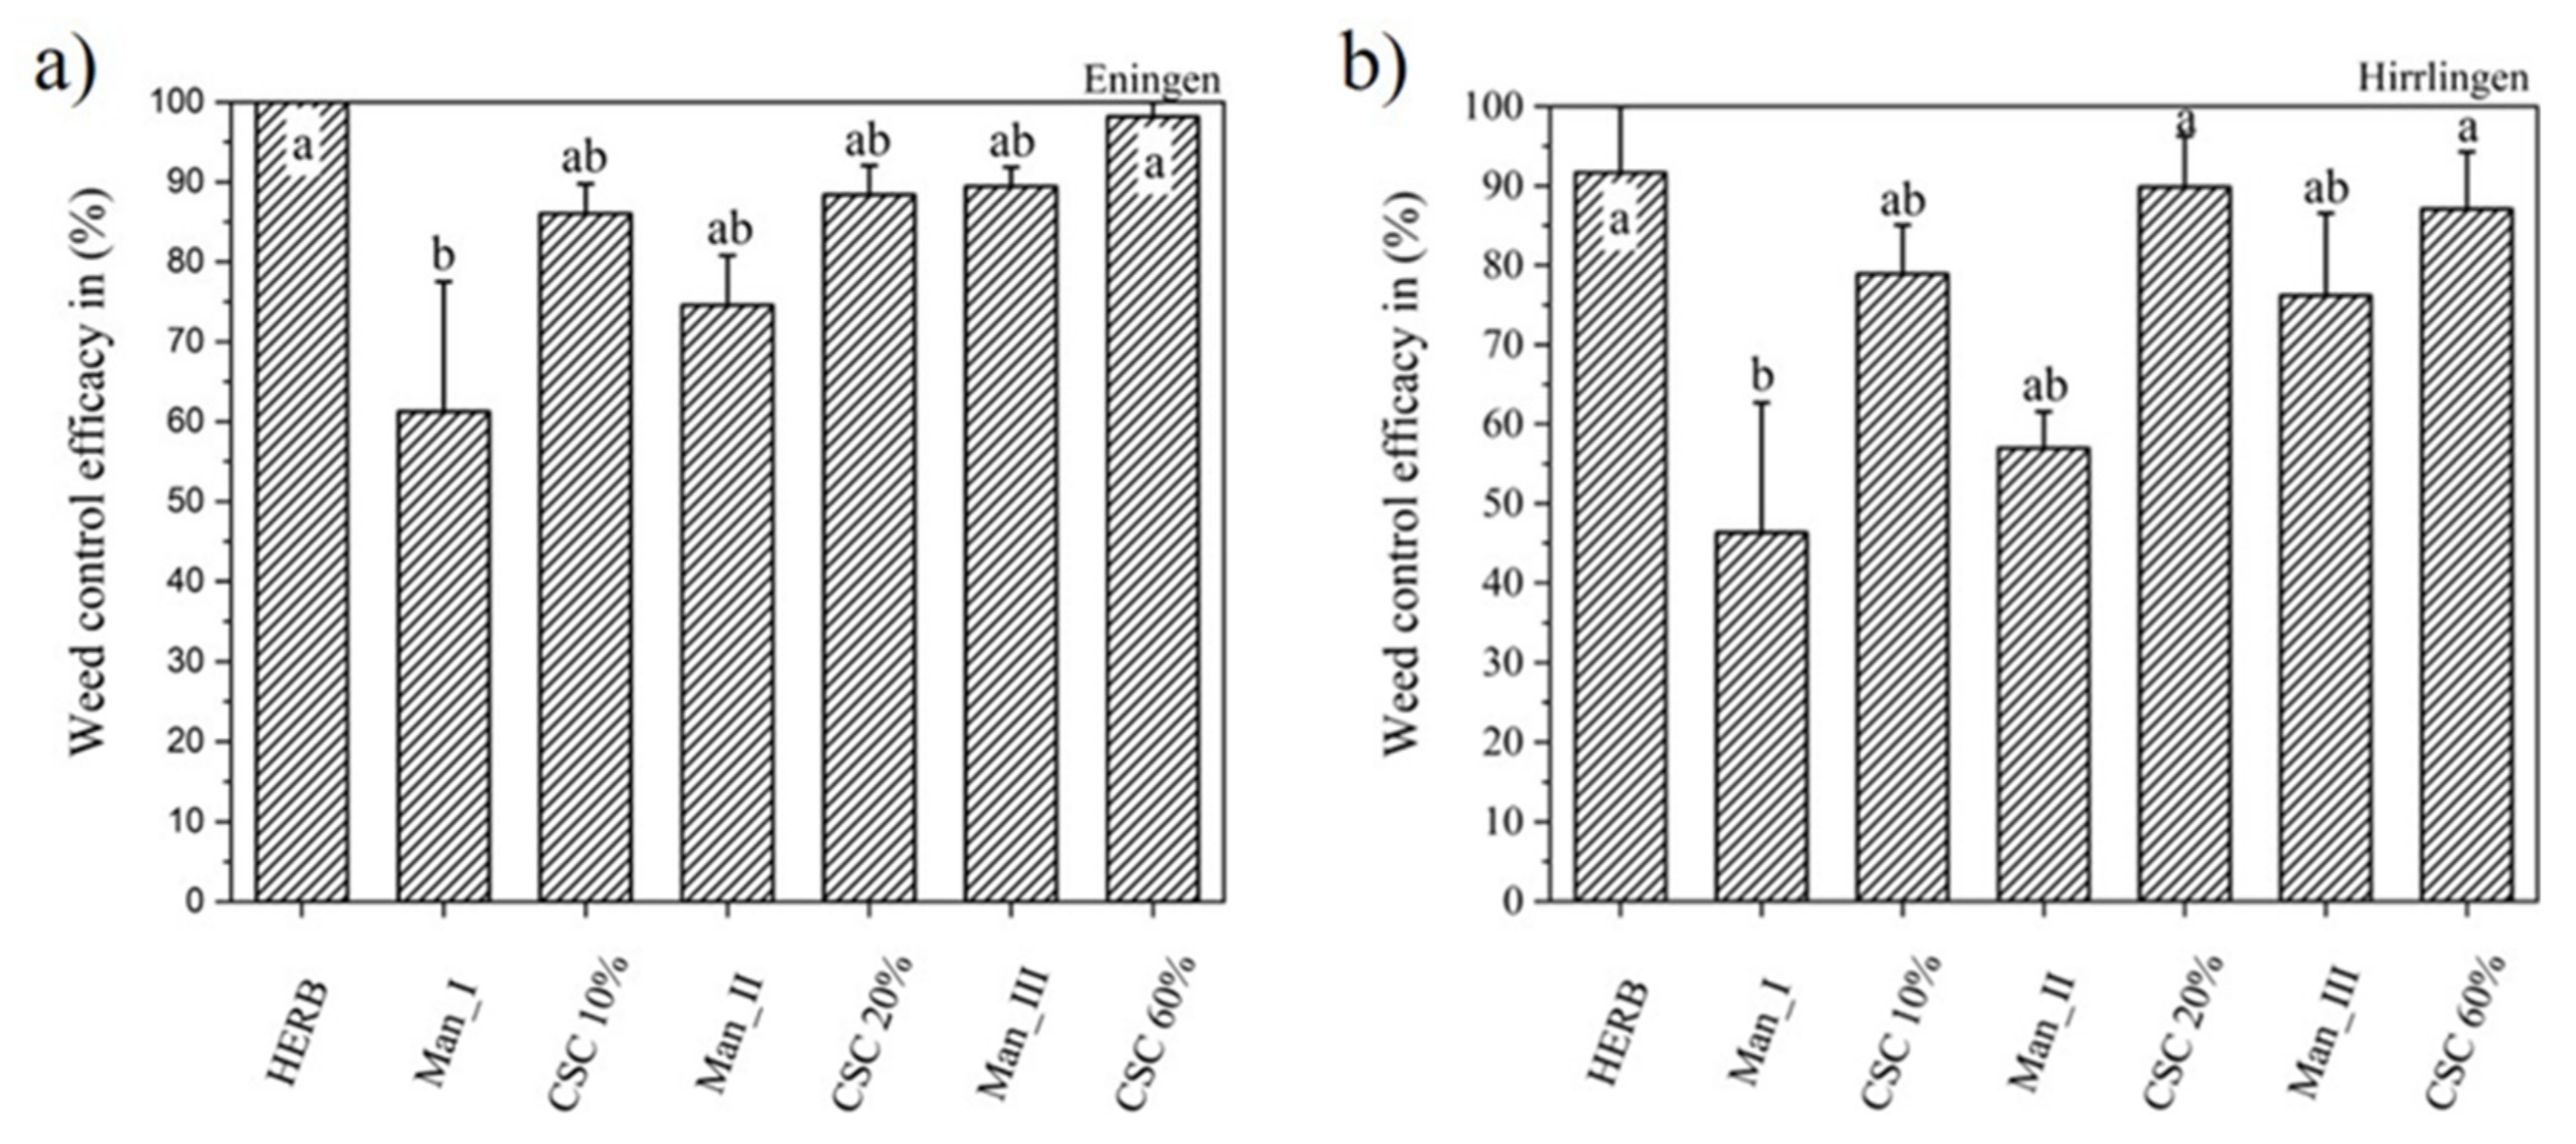
3.4. WCE in Spring Oats and Winter Wheat in Eningen and Hirrlingen in 2020

In 2020, WCE was high for chemical and mechanical treatments at both locations. Highest WCEs were recorded for the herbicide treatments with 98 and 100%, followed by CSC 60% with 98% WCE (Figure 3a,b). WCE of Man_I was significantly lower than all other treatments. In general, camera-controlled harrowing resulted in slightly higher WCEs than conventional harrowing. For CSC 10%, WCE was 25–35% higher than for Man_I. In the medium intensity, WCE for CSC 20% was 13–25% higher than for Man_II and for CSC 60%, WCE was 9–10% higher than for Man_III (Figure 3).

3.5. Crop Density after Treatment and Weed Density at Harvest Time at Eningen and Hirrlingen in 2020

Crop density was reduced by conventional harrowing in both experiments and by the herbicide treatment in winter wheat in Hirrlingen compared to the untreated control and all camera-controlled harrowing treatments (Table 5). Conventional harrowing reduced crop density by up to 20% compared to the untreated plots and the camera-controlled harrowing.
Weed infestation in 2020 was relatively low shortly before harvest with 29–33 plants m−2 in the untreated control. In conventional harrowing, higher densities were found with up to 8–18 weeds m−2 than in the camera-controlled treatments and the herbicide plots with only 0–1 plants m−2. The comparison of the lowest intensity pair (Man_I, CSC of 10%) showed significantly lower weed densities for the camera-controlled plots. At higher intensities, type of harrowing showed no significant differences in both experiments (Table 5).

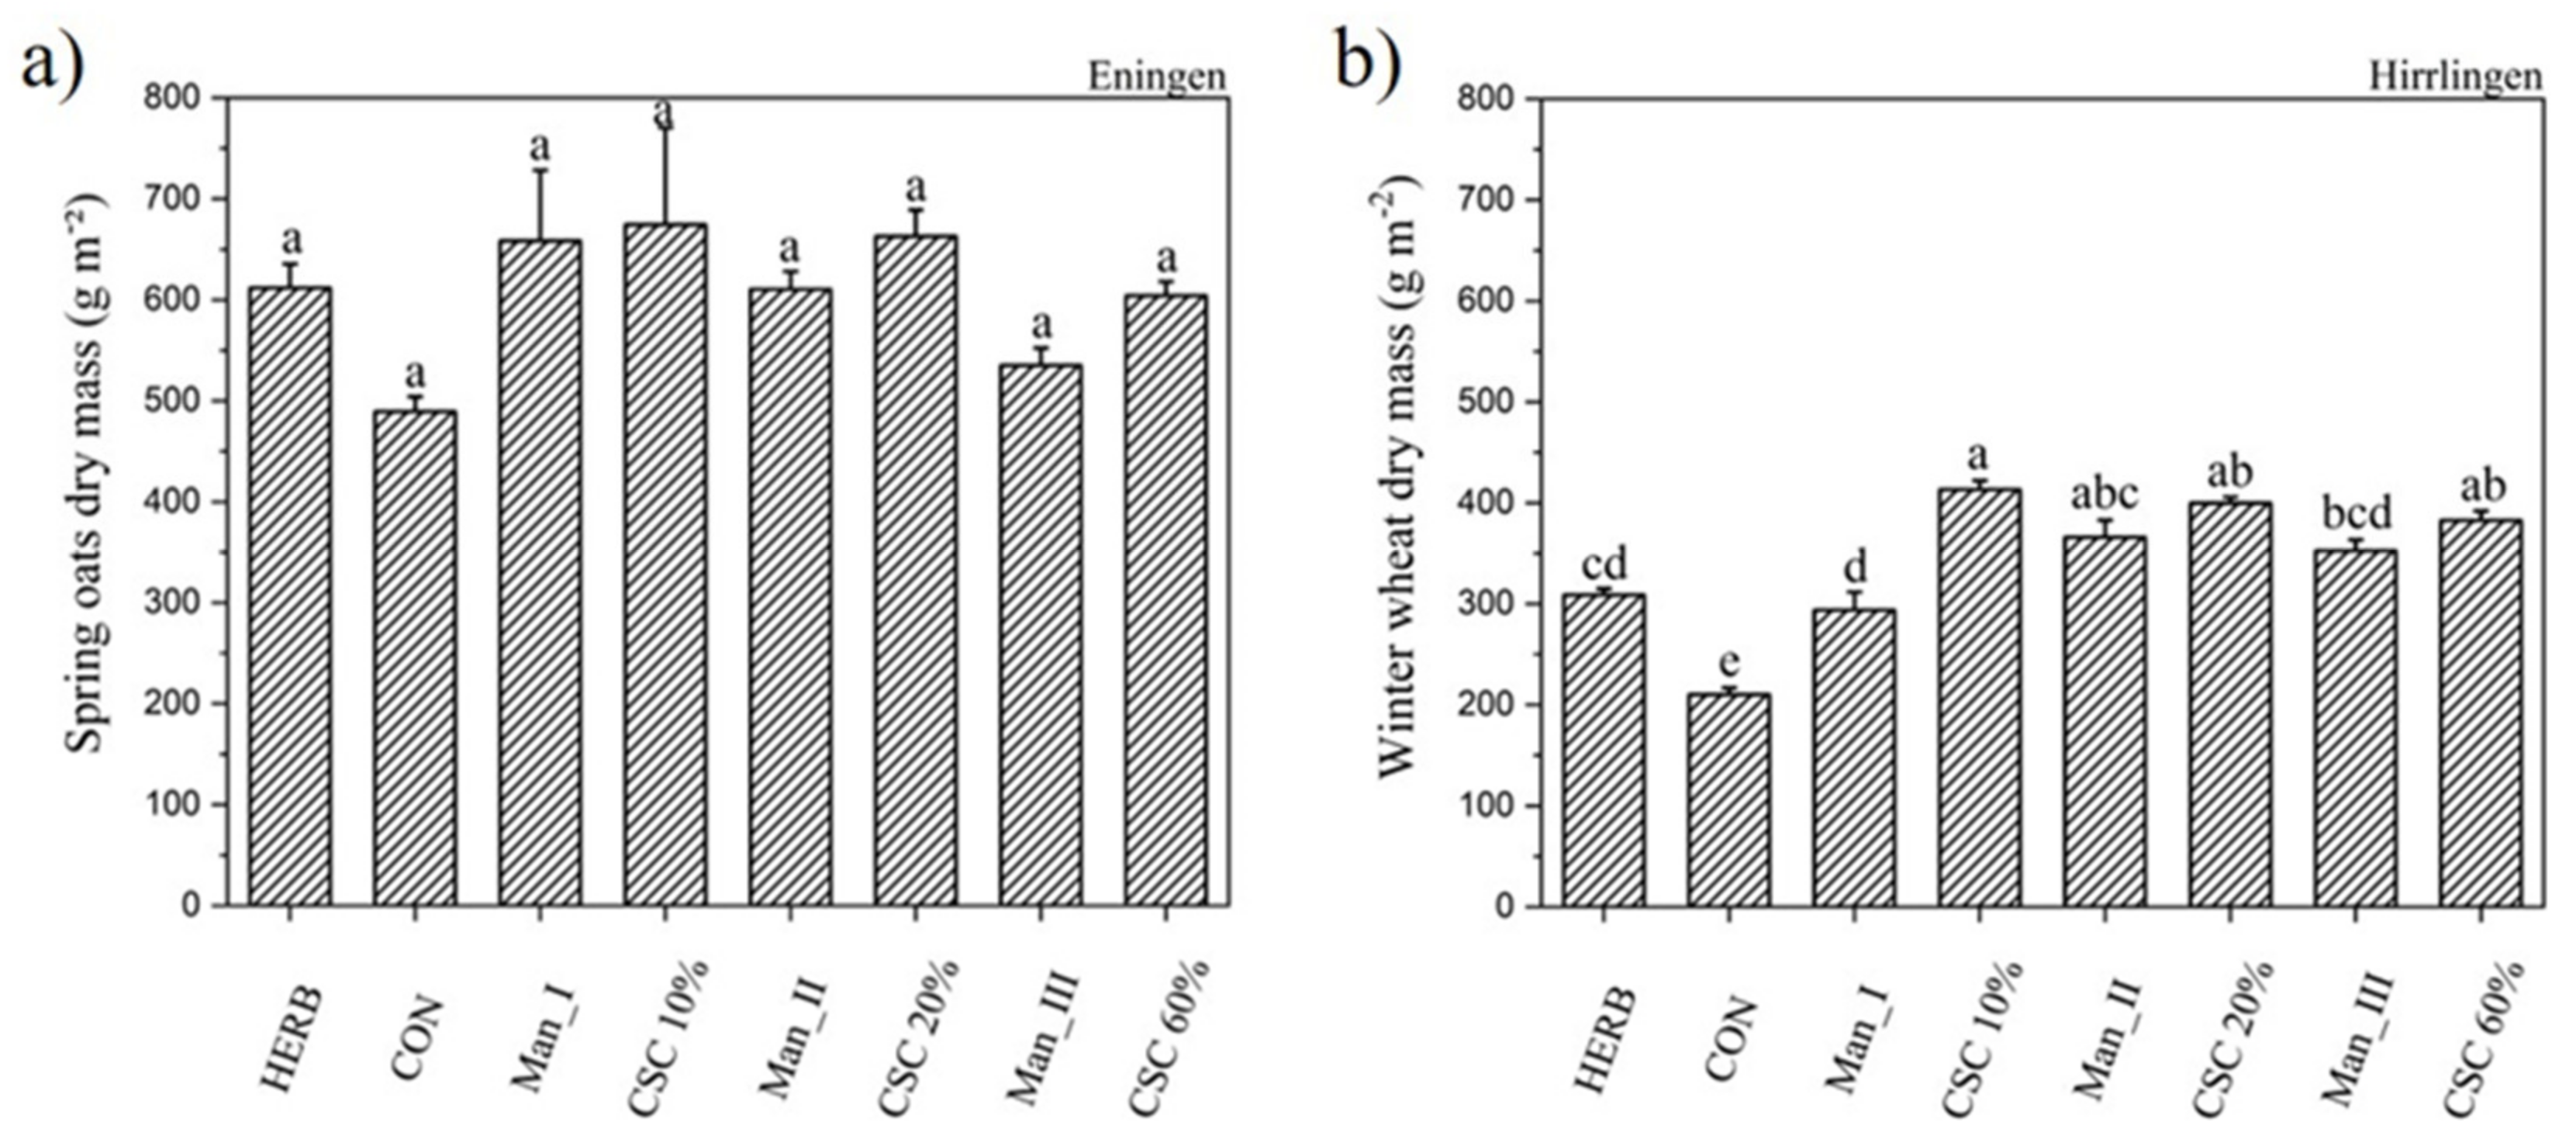
3.6. Crop Dry Mass in Spring Oats and Winter Wheat at Eningen and Hirrlingen in 2020

The highest dry mass was achieved in the sensor-based treatment CSC of 10% with a value of 674 g m−2 for Eningen and 413 g m−2 for Hirrlingen compared to the untreated control with 489 g m−2 in spring oats and 210 g m−2 in winter wheat (Figure 4a,b). In Eningen, the analysis showed no significant differences between chemical and mechanical treatments. In Hirrlingen, the lowest intensity CSC of 10% was, with 100 g m−2 of dry mass more, significantly higher than the conventional Man_I. Within the medium and strongest intensity pairs, no significant differences were found in Hirrlingen. All sensor-based treatment had a significantly higher dry mass then the herbicide application in Hirrlingen.

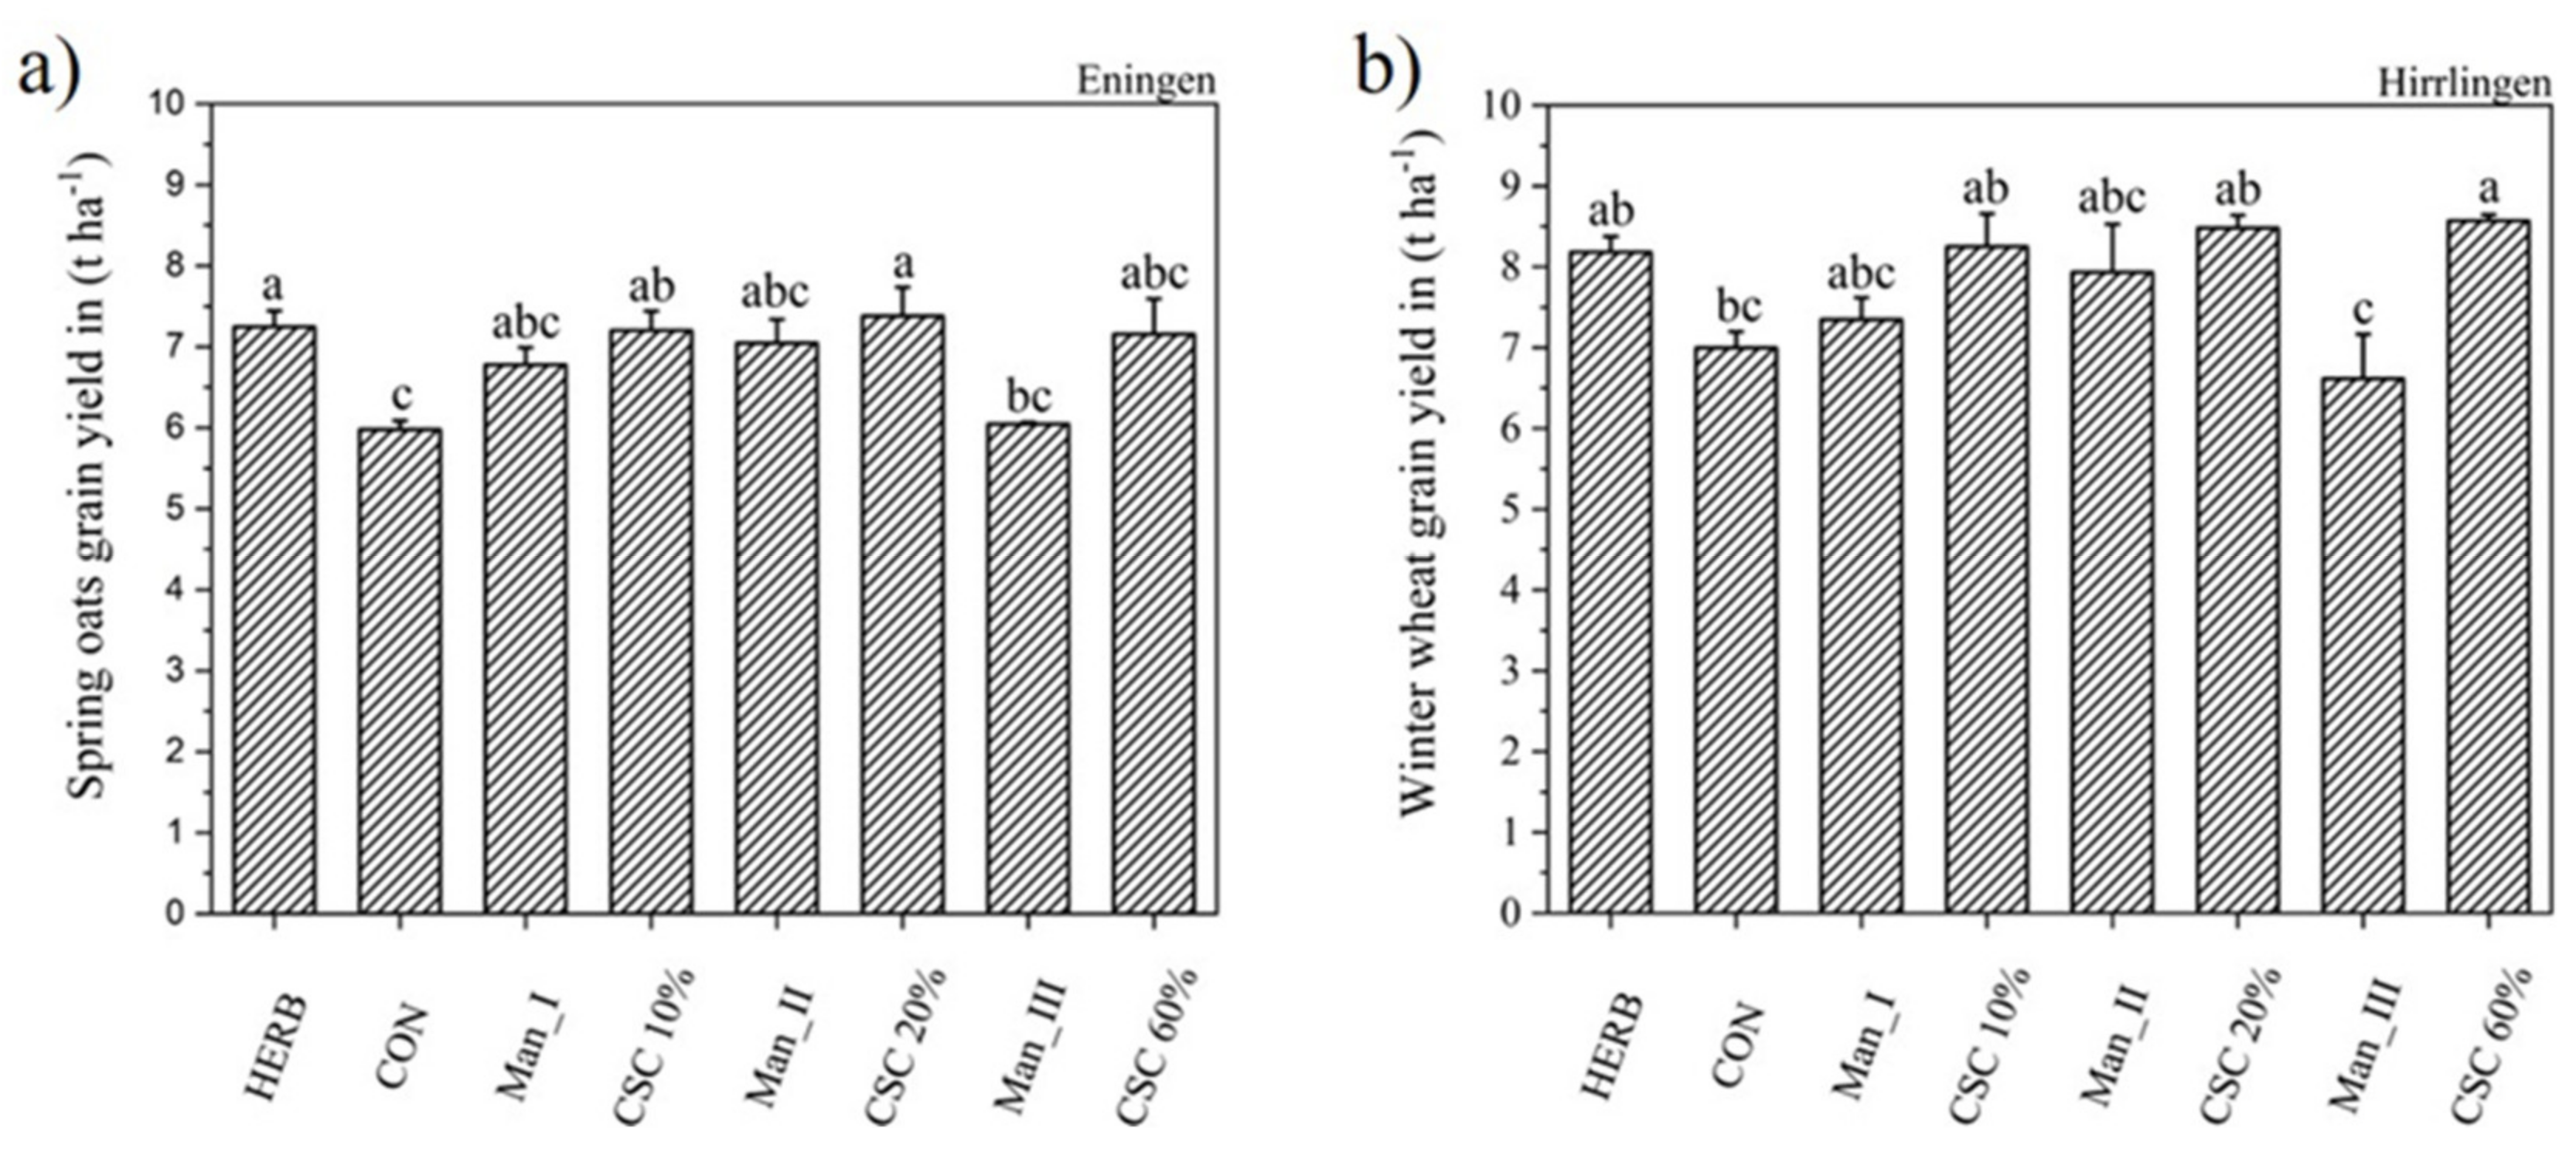
3.7. Grain Yield in Spring Oats and Winter Wheat at Eningen and Hirrlingen in 2020

The highest grain yields were achieved in the camera-based treatment CSC 20% (7.4 t ha−1) in Eningen and in the CSC 60% (8.6 t ha−1) in Hirrlingen (Figure 5a,b). The untreated control exhibited the lowest grain yield (5.9 t ha−1) in Eningen and Man_III (6.5 t ha−1) in Hirrlingen. There were no significant differences for grain yield between all camera-based and chemical treatments. Additionally, no significant differences were measured between all conventional and untreated control plots. In Hirrlingen, the strongest intensity (Man_III, CSC of 60%) differed significantly with up to 2 t ha−1 higher yield for the automatic adjustment. All other harrowing pairs did not differ significantly from each other at both locations.

4. Discussion

This study presents a pair-wise comparison of conventional harrowing with camera-based harrowing using a decision-support-system based on crop soil cover (CSC) [9]. Results revealed the benefits of the new camera-based harrowing system in terms of higher WCE, crop density, crop biomass, and grain yield.
WCE in the present study was considerably high for camera-based and conventional harrowing and both for spring oats and winter wheat. Even at the lowest conventional intensity, on average, 61% WCE was achieved. It increased to 89% WCE for the strongest intensity. Conventional harrowing could achieve a high amount of WCE but only in combination within a high crop damage. High WCE in the present study can be attributed to relatively small weeds at time of harrowing, the tilled soil with a rotary hoe, a high proportion of annual broadleaved weed species in the fields, dry soil conditions before and after harrowing, and a fine seedbed. Similar results regarding WCE, soil tillage, optimal weather and field conditions, and crop damage for conventional harrowing were achieved in previous studies [11,17,18,19]. However, the sensor-based system can achieve a more precise fine tuning, thus improving the result with minimal crop damage. In other studies, the combinations of pre- and post-emergence harrowing resulted only in a maximum 62% WCE [5]. Rasmussen et al. [8] observed similar WCE of 80% in spring cereals in Denmark. In this study, automatic adjustment of harrowing intensity could avoid excessive crop damage and simultaneously increase WCE, which is in line with [12]. WCE by automatic intensity control for spring oats was up to 89% and for winter wheat 98% without crop damage in this study. Rasmussen et al. [8] found a correlation between crop recovery and weather conditions. In their study, CSC of approx. 40% resulted in total crop recovery in dry years. In our case, a total crop recovery was even achieved with CSC of 60% in the automatic treatments, but not with fixed intensity under dry weather and good growth conditions. Furthermore, crop dry mass and grain yield even increased by automatic adjustment up to 10% and 6% compared to the fixed intensity, respectively. Rueda-Ayala et al. and Spaeth et al. [12,15] even achieved similar results with automatic intensity control. They showed an increase in crop biomass and WCE compared to untreated- and herbicide control in spring cereals in their studies. [8] reported that harrowing selectivity decreased from autumn to spring cereal cultivation. With the presented automatic harrowing system, there were no differences between winter and spring cereals in these experiments regarding selectivity.
Favorable field conditions during and after harrowing could also explain the high crop recovery of spring oats and winter wheat of up to 60% CSC for the camera-based treatment in the present study without significant yield losses compared to lower intensities. In previous studies, optimum CSC for conventional harrowing were observed in the range of 2–33% [8,10]. Above approx. 40% CSC, significant yield losses were observed, especially under moist soil conditions [8]. Rydberg and Rueda-Ayala et al. [10,17] reported 80% WCE was associated with CSC variation of 13–16% around an average of 15% CSC in spring barley. Camera-based harrowing resulted in lower variations of CSC and crop losses than conventional harrowing. Additionally, camera-based harrowing did not use an equally strong tine angle such as conventional harrowing to achieve a CSC of 60% under optimum soil condition. If CSC is lower than the optimum, mainly in areas with high crop coverage and heavy soils, WCE decreases with the fixed setting of the tine angle. In areas with lower weed density and light soils, the tine angle becomes flatter with camera-based settings to achieve the decrease in pre-set CSC and crop losses. Rydberg, Rueda-Ayala et al., Krustjens et al., and Rueda-Ayala et al. [10,17,18,20] also reported that incorrect intensities in mechanical weeding increased crop and yield losses. This explains the higher yield and lower crop losses of camera-based harrowing compared to conventional harrowing. Therefore, it is important that harrow intensity needs to be adjusted continuously to achieve high selectivity over the entire field.
However, the efficacy of mechanical weed control by harrowing is also dependent on the weed species and growth stages as well as on the soil texture [21,22,23]. The presented automatic harrow adjustment works depending on all these factors simultaneously, because they are comprised with the CSC. If there are difficult-to-control weed species or heavy soil conditions, the system adjusts to a stronger tine angle to generate the preset CSC. If there are non-difficult-to-control and small weed species, the system adjusts to a lower tine angle to generate the preset CSC. This flexibility facilitates the practical use of the new system. In previous works [12,13,14,24], several parameters were included in the decision algorithm, which made automatic adjustment more complicated.

5. Conclusions

The present study shows that camera-based adjustment of harrowing intensity increased WCE, crop biomass, and grain yield compared to conventional harrowing with a fixed intensity. The implementation of camera-based real-time adjustment of tine angle into a commercial harrow is rather simple and does not require substantial costs, training, and maintenance for the user. The hydraulic regulation of the tine angle is based on continuous measurements of the CSC and the comparison to a pre-set threshold for tolerable CSC. This decision algorithm guarantees that the threshold for CSC is not exceeded during harrowing. Therefore, crop damage was lower for camera-based harrowing compared to conventional harrowing. Camera-based weed harrowing may help to accomplish the targets to reduce pesticide use in European Union member countries. However, further investigations are needed to determine crop and weed response to harrowing under different field conditions.

Author Contributions

All authors contributed extensively to this work. M.S. (Michael Spaeth) organized the setup of the experiment, analyzed the data, evaluated the results, and drafted the manuscript. M.S. (Matthias Schumacher) and R.G. helped in the concept of the manuscript and in drafting and revision of the paper. All authors have read and agreed to the published version of the manuscript.

Funding

This research received no external funding.

Institutional Review Board Statement

Not applicable.

Informed Consent Statement

Not applicable.

Data Availability Statement

Data is contained within the article.

Acknowledgments

The authors thank Marcus Saile for setting up and conducting the experiments in Hirrlingen. The authors also acknowledge the technical support of Hatzenbichler in providing a commercial 6 m wide harrow with hydraulic adjustment of tine angle for our studies. We are also grateful to Tobias Konrad and Oliver Hübner for their technical support in the experiments in Eningen and Klein Hohenheim.

Conflicts of Interest

The authors declare no conflict of interest.

References

  1. Busi, R.; Vila-Aiub, M.M.; Beckie, H.J.; Gaines, T.A.; Goggin, D.E.; Kaundun, S.S.; Lacoste, M.; Neve, P.; Nissen, S.J.; Norsworthy, J.K.; et al. Herbicide-resistant weeds: From research and knowledge to future needs. Evol. Appl. 2013, 6, 1218–1221. [Google Scholar] [CrossRef] [PubMed]
  2. Hillocks, R.J. Farming with fewer pesticides: EU pesticide review and resulting challenges for UK agriculture. Crop Protection 2012, 31, 85–93. [Google Scholar] [CrossRef]
  3. Marshall, E.J.P. Biodiversity, herbicides and non-target plants. In Proceedings of the 2001 of Brighton Crop Protection Conference Weeds, Farnham, UK, 13–15 November; BCPC: Farnham, UK, 2001. [Google Scholar]
  4. Rasmussen, J. Testing harrows for mechanical control of annual weeds in agricultural crops. Weed Res. 1992, 32, 267–274. [Google Scholar] [CrossRef]
  5. Brandsaeter, L.O.; Mangerud, K.; Rasmussen, J. Interactions between pre- and post-emergence weed harrowing in spring cereals. Weed Res. 2012, 52, 338–347. [Google Scholar] [CrossRef]
  6. Rasmussen, J. A model for prediction of yield response in weed harrowing. Weed Res. 1991, 31, 401–408. [Google Scholar] [CrossRef]
  7. Rasmussen, J.; Svenningsen, T. Selective Weed Harrowing in Cereals. Biol. Agric. Hortic. 1995, 12, 29–46. [Google Scholar] [CrossRef]
  8. Rasmussen, J.; Nielsen, H.H.; Gundersen, H. Tolerance and Selectivity of Cereal Species and Cultivars to Postemergence Weed Harrowing. Weed Sci. 2009, 57, 338–345. [Google Scholar] [CrossRef]
  9. Gerhards, R.; Späth, M.; Sökefeld, M.; Peteinatos, G.G.; Nabout, A.; Rueda Ayala, V. Automatic adjustment of harrowing intensity in cereals using digital image analysis. Weed Res. 2020, 61, 68–77. [Google Scholar] [CrossRef]
  10. Rydberg, T. Weed Harrowing—The Influence of Driving Speed and Driving Direction on Degree of Soil Covering and the Growth of Weed and Crop Plants. Biol. Agric. Hortic. 1994, 10, 197–205. [Google Scholar] [CrossRef]
  11. Rasmussen, J.; Bibby, B.M.; Schou, A.P. Investigating the selectivity of weed harrowing with new methods. Weed Res. 2008, 48, 523–532. [Google Scholar] [CrossRef] [Green Version]
  12. Rueda-Ayala, V.; Weis, M.; Keller, M.; Andújar, D.; Gerhards, R. Development and testing of a decision-making based method to adjust automatically the harrowing intensity. Sensors 2013, 13, 6254–6271. [Google Scholar] [CrossRef] [PubMed]
  13. Engelke, B. Entwicklung eines Steuersystems in der Ganzflächig Mechanischen Unkrautbekämpfung. Development of a Self-Adjusting System for Broadcast Mechanical Weed Control. PhD. Thesis, Christian-Albrechts-Universität zu Kiel, Göttingen, Germany, 2001. [Google Scholar]
  14. Peteinatos, G.; Gierer, F.; Gerhards, R. Precision harrowing using a bispectral camera and a flexible tine harrow. In Proceedings of the 28. Deutsche Arbeitstagung über Fragen der Unkrautbiologie und -bekämpfung, Braunschweig, Germany, 27 February–1 March 2018; Nordmeyer, H., Ulber, L., Eds.; JKI: Braunschweig, Germany, 2018. [Google Scholar]
  15. Spaeth, M.; Machleb, J.; Peteinatos, G.G.; Saile, M.; Gerhards, R. Smart Harrowing—Adjusting the Treatment Intensity Based on Machine Vision to Achieve a Uniform Weed Control Selectivity under Heterogeneous Field Conditions. Agronomy 2020, 10, 1925. [Google Scholar] [CrossRef]
  16. Rueda-Ayala, V.; Peteinatos, G.; Gerhards, R.; Andújar, D. A non-chemical system for online weed control. Sensors 2015, 15, 7691–7707. [Google Scholar] [CrossRef] [PubMed] [Green Version]
  17. Rueda-Ayala, V.P.; Gerhards, R. Selectivity of Weed Harrowing with Sensor Technology in Cereals in Germany. In Proceedings of the 7th European Conference on Precision Agriculture (ECPA), Wageningen, The Netherlands, 6–7 July; van Henten, E.J., Goense, D., Lokhorst, C., Eds.; Wangeningen Academic: Wageningen, The Netherlands, 2009. [Google Scholar]
  18. Rueda-Ayala, V.P.; Rasmussen, J.; Gerhards, R.; Fournaise, N.E. The influence of post-emergence weed harrowing on selectivity, crop recovery and crop yield in different growth stages of winter wheat. Weed Res. 2011, 51, 478–488. [Google Scholar] [CrossRef]
  19. Bàrberi, P.; Silvestri, N.; Peruzzi, A.; Raffaelli, M. Finger-Harrowing of Durum Wheat under Different Tillage Systems. Biol. Agric. Hortic. 2000, 17, 285–303. [Google Scholar] [CrossRef]
  20. Kurstjens, D.; Perdok, U. The selective soil covering mechanism of weed harrows on sandy soil. Soil Tillage Res. 2000, 55, 193–206. [Google Scholar] [CrossRef]
  21. Kurstjens, D.A.G.; Kropff, M.J. The impact of uprooting and soil-covering on the effectiveness of weed harrowing. Weed Res. 2001, 41, 211–228. [Google Scholar] [CrossRef]
  22. Home, M.C.W.; Tillett, N.D.; Hague, T.; Godwin, R.J. An experimental study of lateral positional accuracy achieved during inter-row cultivation. In Proceedings of the 2002 5th EWRS Workshop on Physical and Cultural Weed Control; Pisa, Italy, 11–13 March 2002. [Google Scholar]
  23. Hock, S.M.; Knezevic, S.Z.; Martin, A.R.; Lindquist, J.L. Soybean row spacing and weed emergence time influence weed competitiveness and competitive indices. Weed Sci. 2006, 54, 38–46. [Google Scholar] [CrossRef] [Green Version]
  24. Søgaard, H.T. Automatic Control of a Finger Weeder with Respect to the Harrowing Intensity at Varying Soil Structures. J. Agric. Eng. Res. 1998, 70, 157–163. [Google Scholar] [CrossRef]
Figure 1. The sensor guided harrow in action, plus the hydraulic cylinder, which was used to adjust the tine angle to the actual field conditions.
Agronomy 11 01605 g001
Figure 2. Mean crop soil cover (CSC) and standard deviation measured in Eningen and Hirrlingen in 2020 after harrowing in three conventional and three automatic settings, p = 0.0034. Means with the same letter were not significantly different according to the HSD-test at α ≤ 0.05. Man_I = low conventional adjustment of tine angle (10°); Man_II = medium conventional adjustment (tine angle 40°); Man_III high conventional adjustment (tine angle 70°); CSC 10% = threshold for automatic adjustment, soil burial 10%; CSC 20% = threshold for automatic adjustment, soil burial 20%; CSC 60% = threshold for automatic adjustment, soil burial 60%.
Agronomy 11 01605 g002
Figure 3. Percentage of weed control efficacy in spring oats in Eningen, p = 9.489 × 10⁻¹⁶ (a) and winter wheat in Hirrlingen p = 2.064 × 10⁻⁵ (b) in 2020. The measurement was done directly after treatment, only the herbicide treatment was measured 14 days after application. Means with the same letter were not significantly different according to the HSD-test at α ≤ 0.05. HERB = herbicide application, conventional intensity (Man_) I, II, and III = tine angle 10°, 40°, and 70°; Crop soil cover (CSC) 10, 20, and 60% = plant burial by 10, 20, and 70% soil. The error bars show the standard deviation.
Agronomy 11 01605 g003
Figure 4. Dry biomass (g m−2) of spring oats in Eningen, p = 0.1445 (a) and winter wheat in Hirrlingen, p = 1.458 ×10⁻⁷ (b) in 2020. Biomass was measured at BBCH 49 in Eningen and BBCH 59 in Hirrlingen. Means with the same letter were not significantly different according to the HSD-test at α ≤ 0.05. HERB = herbicide application, CON = untreated control, conventional intensity (Man_) I, II, and III = tine angle 10°, 40° and 70°; Crop soil cover (CSC) 10, 20, and 60% = plant burial by 10, 20, and 70% soil. The error bars show the standard deviation.
Agronomy 11 01605 g004
Figure 5. Grain yield (t ha−1) of spring oats in Eningen, p = 0.0039 (a) and winter wheat in Hirrlingen, p = 0.0032 (b) in 2020. Means with the same letter were not significantly different according to HSD-test at α ≤ 0.05. HERB = herbicide application, CON = untreated control, conventional intensity (Man_) I, II and III = tine angle 10°, 40° and 70°, Crop soil cover (CSC) 10, 20, and 60% = plant burial by 10, 20 and 70% soil. The error bars shows the standard deviation.
Agronomy 11 01605 g005
Table 1. Year, location, crop with cultivar, sowing date (YYYY-MM-DD), seed rate, and soil texture of all five experiments in 2019 and 2020.
YearLocationCropSowing DateSeed Rate
(Seeds m−2)
Soil Texture
2019Hirrlingen Winter wheat,
cv. Porthus
2019-10-0630049% Clay, 6% Sand, 45% Silt
2019Hirrlingen Spring oats,
cv. Apollon
2019-03-0135045% Clay, 11% Sand, 44% Silt
2019KHHSpring oats,
cv. Apollon
2016-02-2640024% Clay, 11% Sand, 65% Silt
2020Hirrlingen Winter wheat,
cv. Patras
2020-10-1030053% Clay, 7% Sand, 40% Silt
2020EningenSpring oats,
cv. Armani
2020-03-2435043% Clay, 23% Sand, 35% Silt
Table 2. Overview of the harrowing treatments with their different intensity level, and relative crop stage at harrowing in the experiments in spring oats and winter wheat in Hirrlingen, KHH, and Eningen in 2019 and 2020. Man_I = low conventional adjustment of tine angle (10°); Man_II = medium conventional adjustment (tine angle 40°); Man_III strong conventional adjustment (tine angle 70°); CSC 10% = threshold for automatic adjustment with 10% crop soil burial; CSC 20% = threshold for automatic adjustment with 20% crop soil burial; CSC 60% = threshold for automatic adjustment with 60% crop soil burial.
YearLocationCrop and
Growth Stage at Harrowing
Mechanical Treatment
Intensity Level
ConventionalAutomatic
2019HirrlingenWinter wheat
BBCH 26–28
Man_I-
Man_II
Man_III
2019HirrlingenSpring oats
BBCH 26–28
Man_I-
Man_II
Man_III
2019KHHSpring oats
BBCH 21–23
Man_I-
Man_II
Man_III
2020HirrlingenWinter wheat
BBCH 21–24
Man_ICSC 10%
Man_IICSC 20%
Man_IIICSC 60%
2020EningenSpring oats
BBCH 21–24
Man_ICSC 10%
Man_IICSC 20%
Man_IIICSC 60%
Table 3. Average weed density (weeds m−2) and the dominance of the five most abundant weed species (%) in the trials in Hirrlingen, KHH, and Eningen in 2019 and 2020.
Location, YearCropWeed Density
Weeds m−2
Weed Species
Hirrlingen, 2019Spring oats275Chenopodium album L. (lamb’s quarters) 40%
Cirsium arvense L. (creeping thistle) 27%
Stellaria media L. (chickweed) 21%
Galium aparine L. (cleavers) 4%
Veronica persica POIR. (birdeye speedwell) 3%
Hirrlingen, 2019Winter wheat35Capsella bursa-pastoris L. (Shepherd’s purse) 33%
Veronica persica (birdeye speedwell) 12%
Galium aparine (cleavers) 11%
Viola arvensis Murray (field pansy) 9%
Fumaria officinalis L. (common fumitory) 8%
KHH, 2019Spring oats74Galium aparine (cleavers) 28%
Veronica persica (birdeye speedwell) 23%
Chenopodium album (lamb’s quarters) 21%
Stellaria media (chickweed) 12%
Sinapis arvensis L. (charlock mustard) 4%
Hirrlingen, 2020Winter wheat70Galium aparine (cleavers) 27%
Veronica persica (birdeye speedwell) 22%
Lamium purpureum L. (red dead-nettle) 14%
Capsella bursa-pastoris (shepherd’s purse 13%
Stellaria media (chickweed) 7%
Eningen, 2020Spring oats140Thlaspi arvense L. (field pennycress) 36%
Veronica persica (birdeye speedwell) 25%
Polygonum aviculare L. (common knotgrass) 15%
Chenopodium album (lamb’s quarters) 10%
Capsella bursa-pastoris (shepherd’s purse) 9%
Table 4. Weed control efficacy (WCE, %, ±SD), crop dry biomass (g m−2, ±SD), and grain yield (t ha−1, ±SD) of the experiments in Hirrlingen and KHH in 2019. Means with the same letter within a column are not significantly different according to HSD-test at p ≤ 0.05. Levels of significance are given for each experiment separately.
Location, YearCropTreatmentWCE
(%)
Dry Biomass
(g m−2) ±SD
Grain Yield
(t ha−1) ±SD
Hirrlingen, 2019Winter wheat,
cv. Porthus
CON
HERB
Man_I, Man_II, Man_III
-302 (±9) c9.0 (±0.3) b
98% a389 (±12) a10.6 (±0.1) a
19% c333 (±31) bc10.4 (±0.5) ab
59% b378 (±24) ab10.6 (±0.3) a
73% ab352 (±14) b10.1 (±0.9) ab
Hirrlingen, 2019Spring oats,
cv. Apollon
CON
HERB
Man_I, Man_II, Man_III
-269 (±11) b6.6 (±0.5) c
98% a304 (±8) a8.4 (±0.2) a
32% c269 (±14) b6.9 (±0.4) bc
66% b291 (±21) ab8.2 (±0.2) a
80% ab290 (±18) ab7.6 (±0.3) b
KHH, 2019Spring oats,
cv. Apollon
CON
HERB
Man_I, Man_II, Man_III
-384 (±12) c5.0 (±0.3) b
99% a452 (±17) b6.0 (±0.2) a
25% c401 (±31) bc5.5 (±0.4) ab
62% b482 (±11) a5.7 (±0.5) ab
88% a402 (±42) bc 5.0 (±0.4) b
Table 5. Crop density (plants m−1, ±SD; p = 0.0053 for Hirrlingen and p = 0.0086 for Eningen) after the treatments and weed density (weeds m−2, ±SD; p = 1.567 ×10⁻⁹ for Hirrlingen and p = 1.946 ×10⁻¹² for Eningen) at harvest time for winter wheat in Hirrlingen and spring oats in Eningen in 2020. Crop density in the herbicide treatment was measured 14-days after application. Means with the same letter within a column are not significantly different according to the HSD-test at p ≤ 0.05.
TreatmentCrop Density
(Plants m−1)
Weed Density at Harvest Time
(Weeds m−2)
Winter Wheat
Hirrlingen
(±SD)
Spring Oats Eningen
(±SD)
Winter Wheat
Hirrlingen
(±SD)
Spring Oats
Eningen
(±SD)
CON52 (±1.4) a60 (±1.4) a29 (±1.8) a33 (±1.2) a
HERB45 (±3.3) b58 (±1.4) a0 (±0) c0 (±0) c
Man_I39 (±2.6) c56 (±1.6) b18 (±1.1) b8 (±0.3) b
Man_II49 (±2.3) ab59 (±1.0) a5 (±2.2) bc0 (±0) c
Man_III46 (±1.0) b49 (±2.2) c0 (±0) c0 (±0) c
CSC 10%54 (±1.2) a61 (±1.2) a1 (±0.8) c0 (±0) c
CSC 20%52 (±1.5) a60 (±1.9) a0 (±0) c0 (±0) c
CSC 60%51 (±1.2) a61 (±0.7) a0 (±0) c0 (±0) c
Publisher’s Note: MDPI stays neutral with regard to jurisdictional claims in published maps and institutional affiliations.

