
Effects of NP Fertilizer Placement Depth by Year Interaction on the Number of Maize (Zea mays L.) Plants after Emergence Using the Additive Main Effects and Multiplicative Interaction Model

 ,
,  ,
,  , ,
, ,  and
and 
Abstract
:1. Introduction
2. Materials and Methods
2.1. Soil and Climate Information
| K = | 10 · monthly precipitation total [mm] |
| Number of days · mean daily air temperature in a given month [°C] |
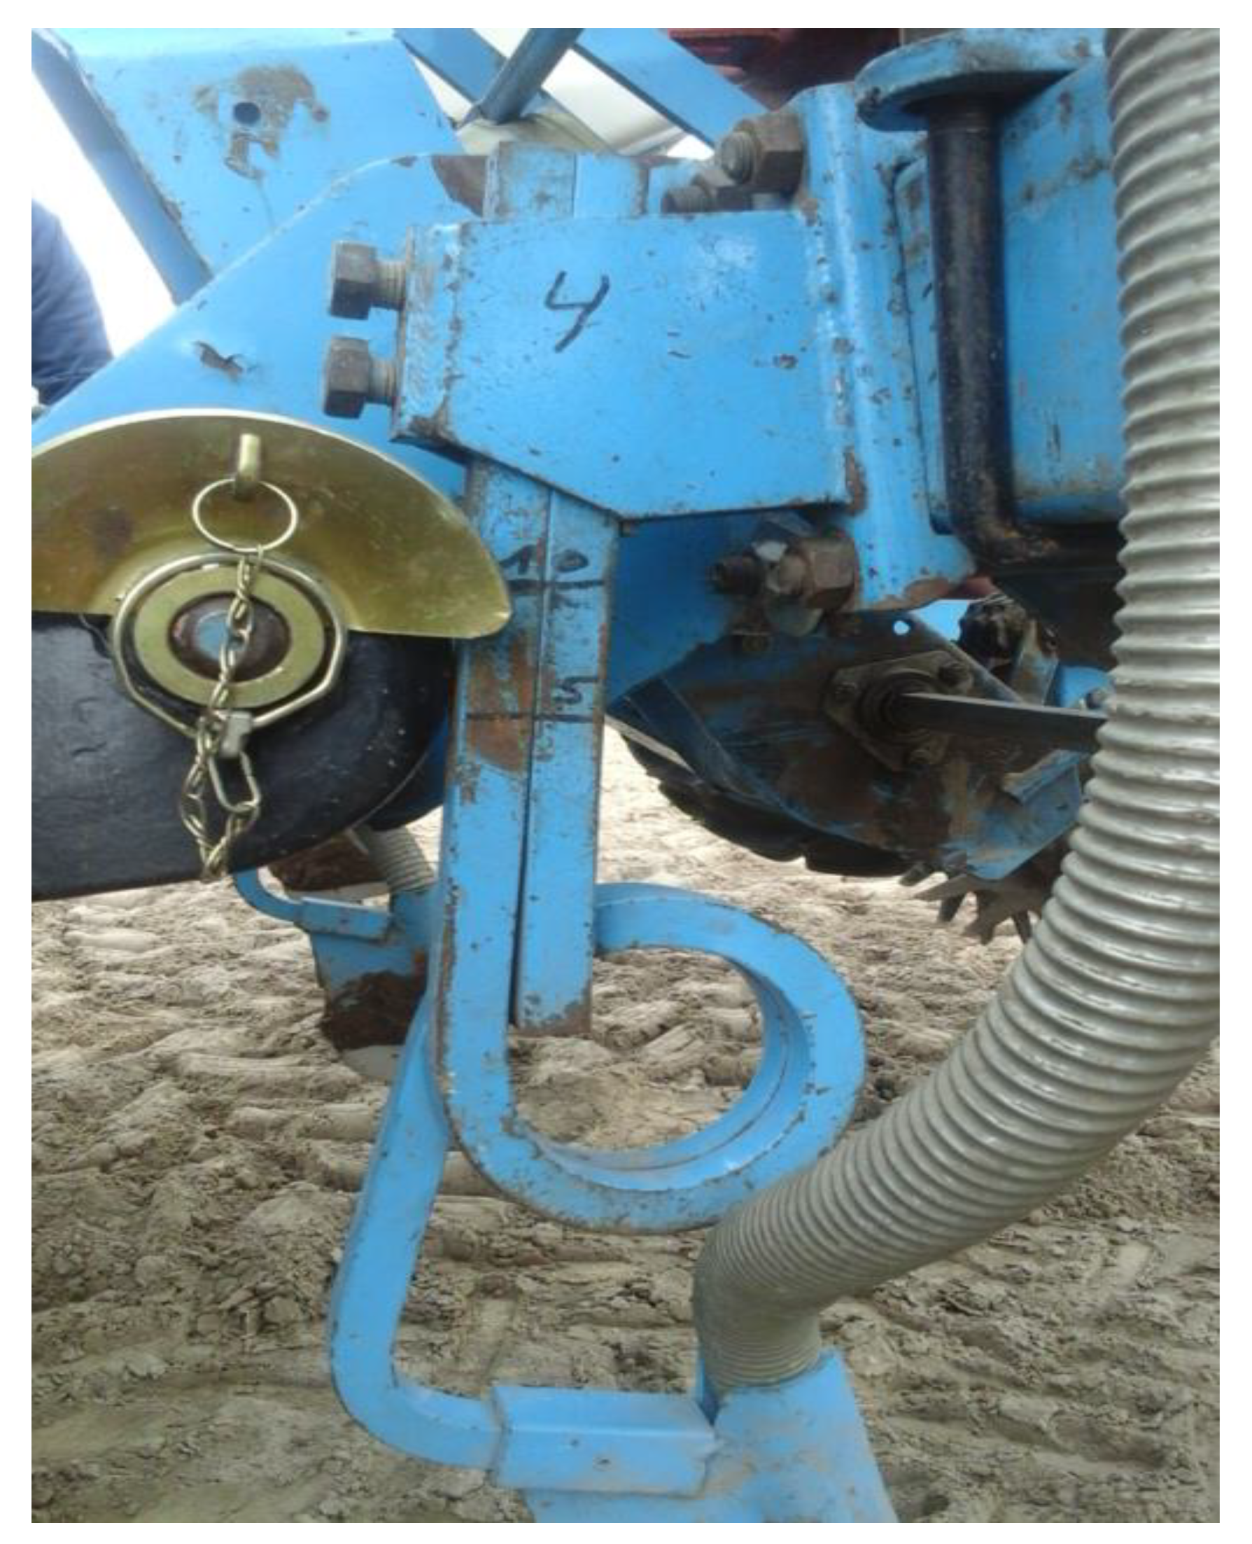
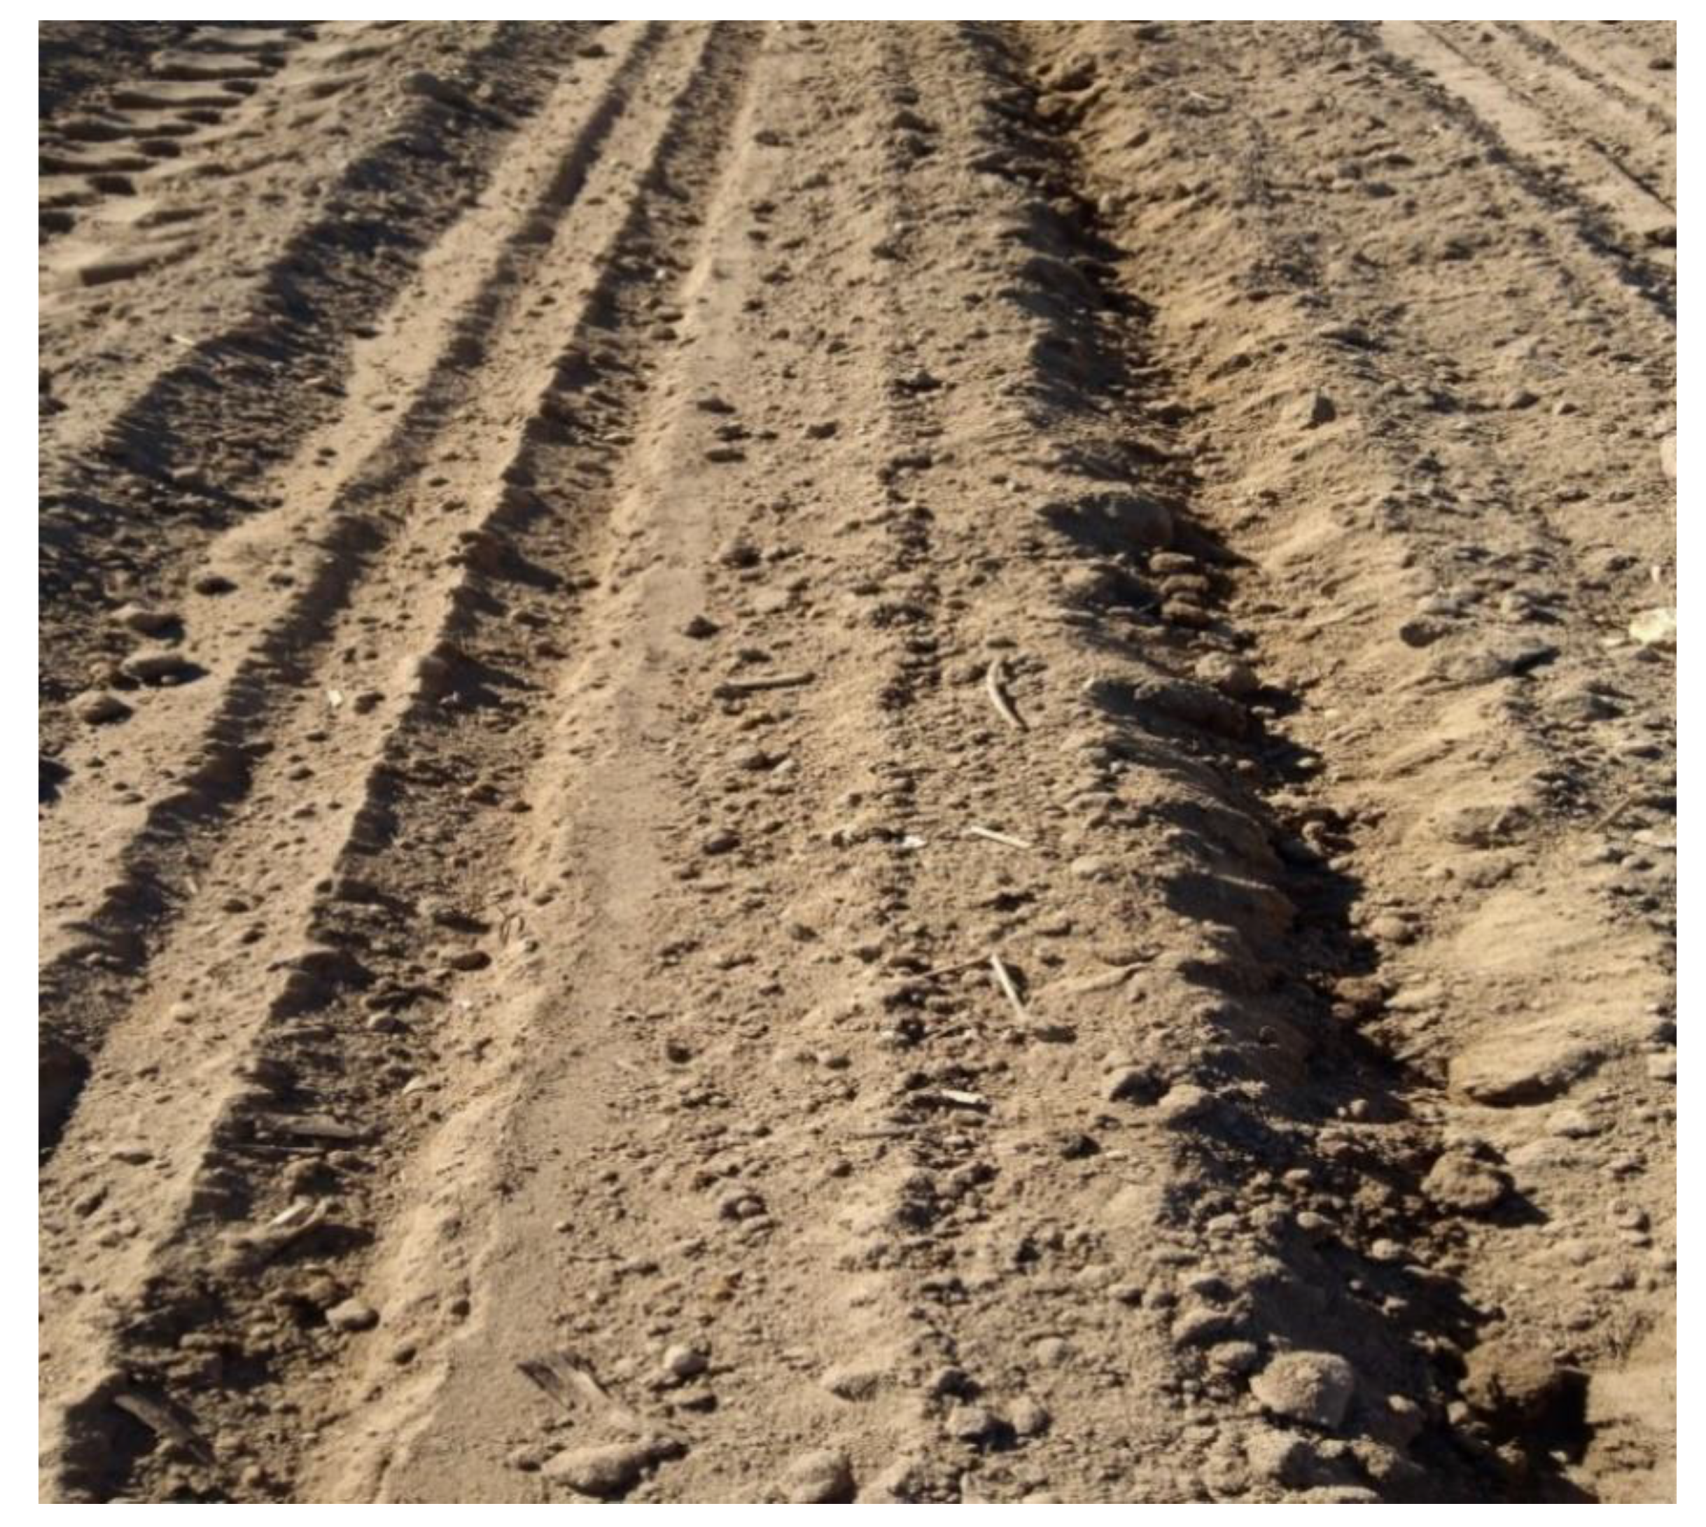
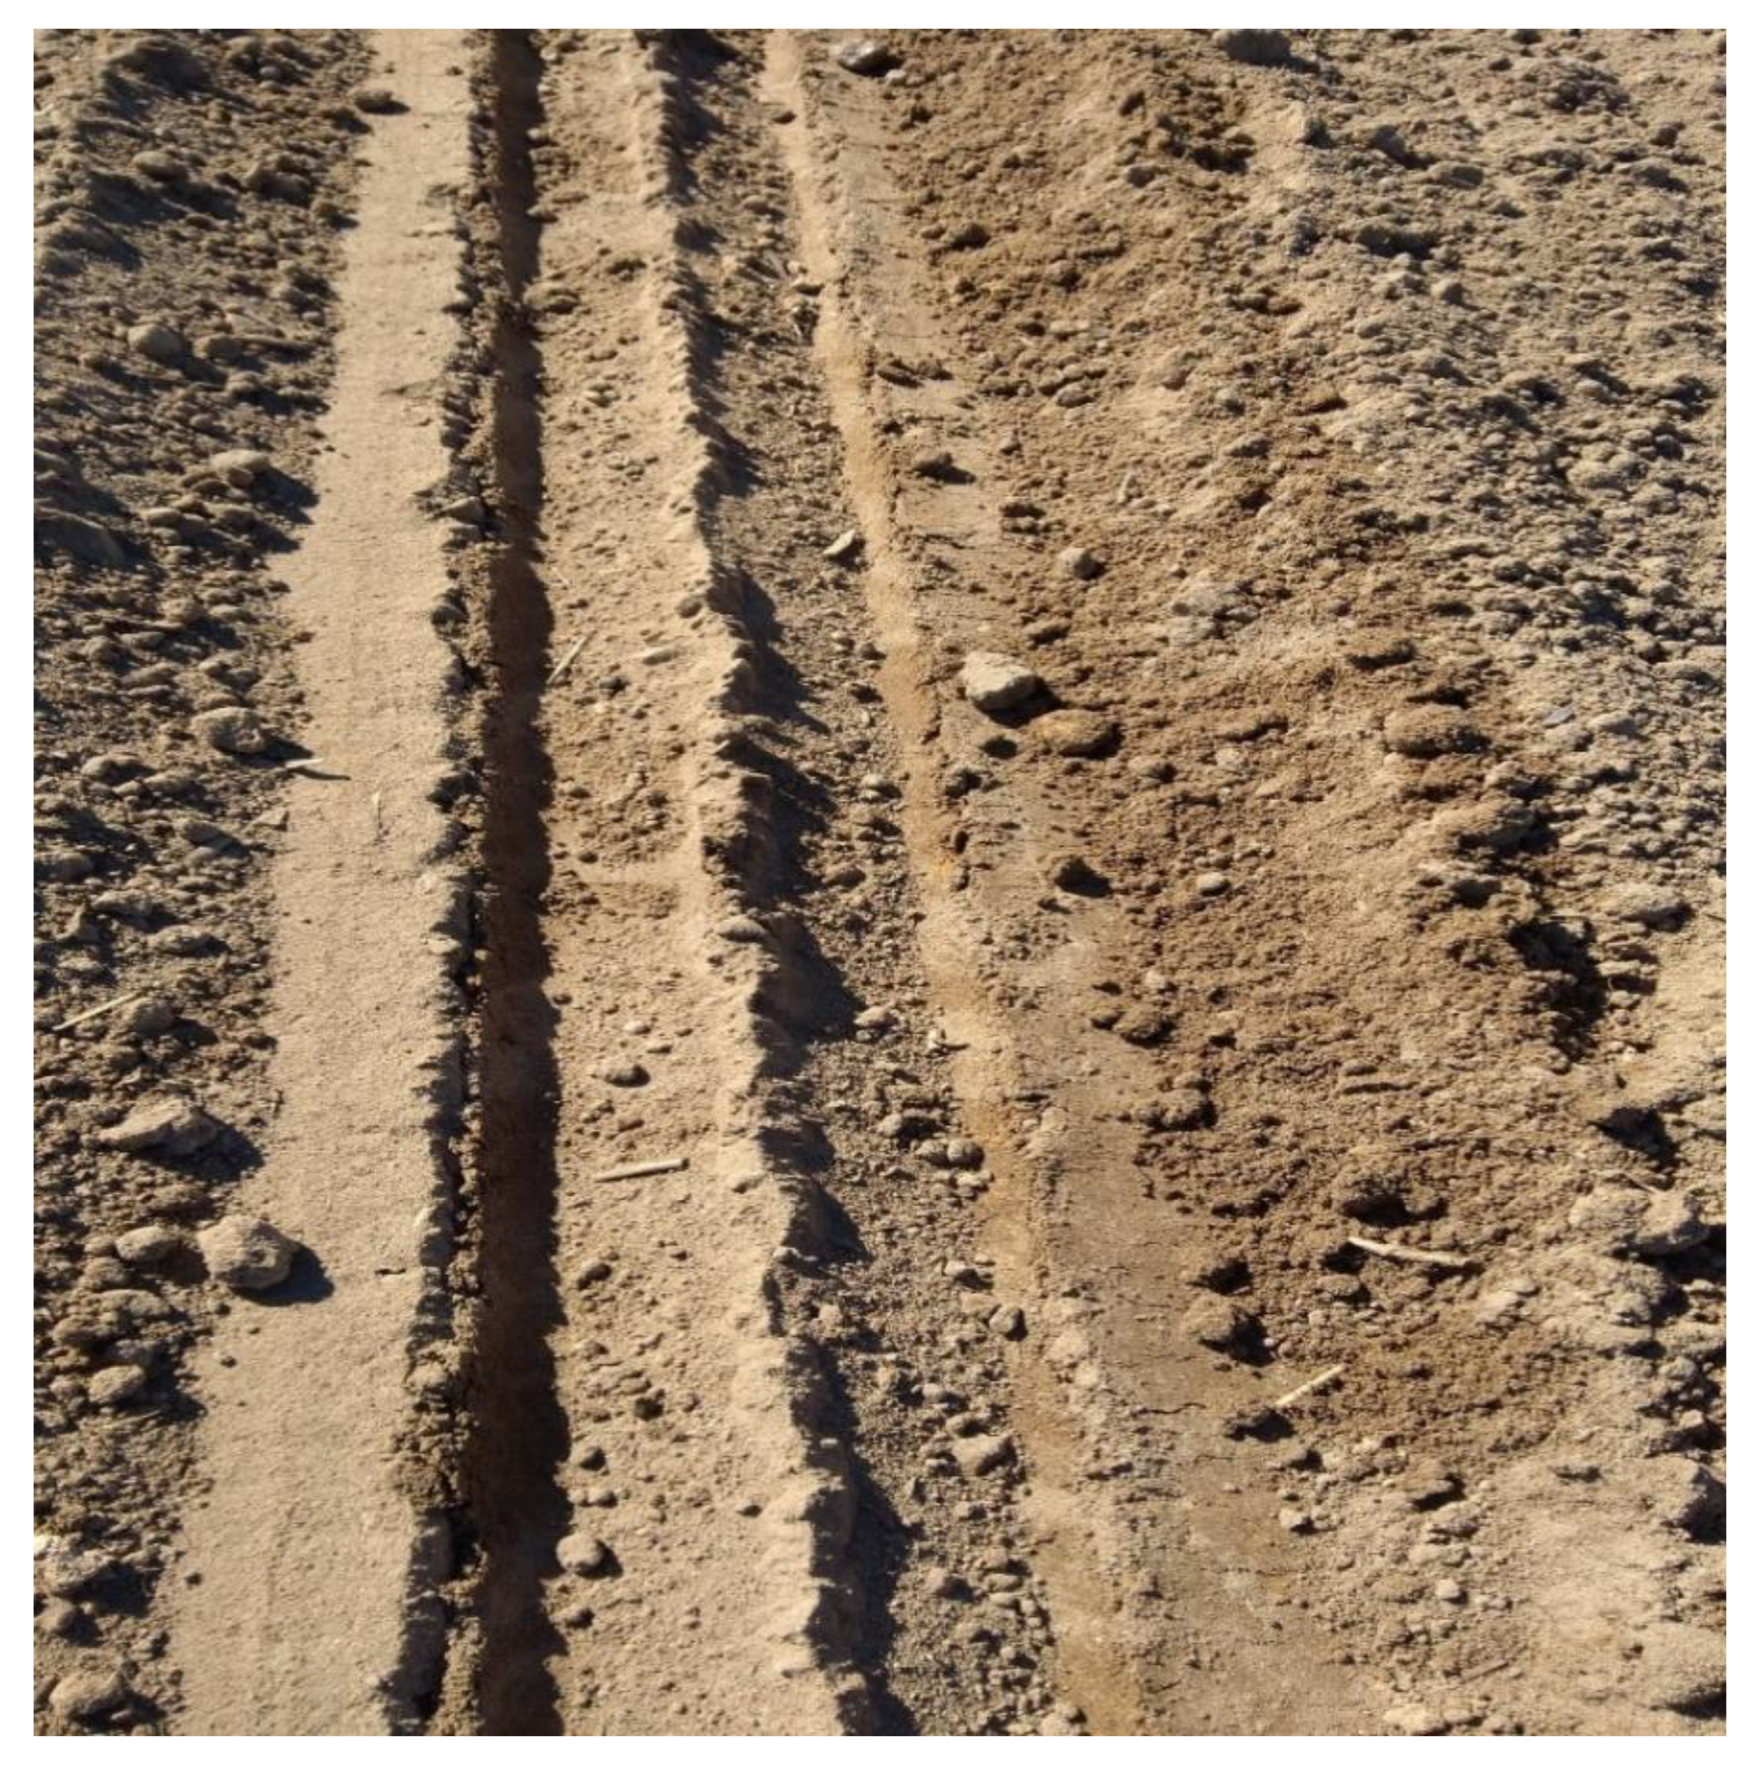
2.2. Field Experiment
2.3. Statistical Analysis
3. Results
4. Discussion
5. Conclusions
Author Contributions
Funding
Institutional Review Board Statement
Informed Consent Statement
Data Availability Statement
Conflicts of Interest
References
- Amnuaylojaroen, T.; Chanvichit, P.; Janta, R.; Surapipith, V. Projection of rice and maize productions in Northern Thailand under climate change scenario RCP8.5. Agriculture 2021, 11, 23. [Google Scholar] [CrossRef]
- Neumann, K.; Verburg, P.H.; Stehfest, E.; Mueller, C. The yield gap of global grain production: A spatial analysis. Agric. Syst. 2010, 103, 316–326. [Google Scholar] [CrossRef]
- Kolver, E.S.; Roche, J.R.; Miller, D.; Densley, R. Maize silage for dairy cows. Proc. N. Z. Assoc. 2001, 63, 195–201. [Google Scholar] [CrossRef]
- Paponov, I.A.; Sambo, P.; Erley, G.S.; Presterl, T.; Geiger, H.H.; Engels, C. Grain yield and kernel weight of two maize genotypes differing in nitrogen use efficiency at various levels on nitrogen and carbohydrate availability during flowering and grain filling. Plant Soil 2005, 272, 111–123. [Google Scholar] [CrossRef]
- Adamczyk, J.; Rogacki, J.; Cygert, H. The progress in maize breeding in Poland. Acta Sci. Pol. Agric. 2010, 9, 85–91. (In Polish) [Google Scholar]
- Baohua, L.; Xinping, C.; Qingfeng, M.; Haishun, Y.; Justin, V.W. Estimating maize yield potential and yield gap with agro-climatic zones in China-Distinguish irrigated and rainfed conditions. Agric. For. Meteorol. 2017, 239, 108–117. [Google Scholar] [CrossRef]
- Bänziger, M.; Edmeades, G.O.; Lafitte, H.R. Physiological mechanisms contributing to the increased N stress tolerance of tropical maize selected for drought tolerance. Field Crops Res. 2002, 75, 223–233. [Google Scholar] [CrossRef]
- Milander, J.J. Maize Yield and Components as Influenced by Environment and Agronomic Management. Master’s Thesis, University of Nebraska, Lincoln, NE, USA, 2015; p. 86. [Google Scholar]
- Szulc, P.; Barłóg, P.; Ambroży-Deręgowska, K.; Mejza, I.; Kobus-Cisowska, J. In-soil application of NP mineral fertilizer as a method of improving nitrogen yielding efficiency. Agronomy 2020, 10, 1488. [Google Scholar] [CrossRef]
- Szulc, P.; Barłóg, P.; Ambroży-Deręgowska, K.; Mejza, I.; Kobus-Cisowska, J.; Ligaj, M. Effect of phosphorus application technique on effectiveness indices of its use in maize cultivation. Plant Soil Environ. 2020, 66, 500–505. [Google Scholar] [CrossRef]
- Araus, J.L.; Slafer, G.A.; Royo, C.; Serret, M.D. Breeding for yield potential and stress adaptation in cereals. CRC Crit. Rev. Plant Sci. 2008, 27, 377–412. [Google Scholar] [CrossRef]
- Balawejder, M.; Szostek, M.; Gorzelany, J.; Antos, P.; Witek, G.; Małtok, N. A study on the potential fertilization effects of microgranule fertilizer based on the protein and calcined bones in maize cultivation. Sustainability 2020, 12, 1343. [Google Scholar] [CrossRef] [Green Version]
- Nkebiwe, P.M.; Weinmann, M.; Bar-Tal, A.; Müller, T. Fertilizer placement to improve crop nutrient acquisition and yield: A review and meta-analysis. Field Crops Res. 2016, 196, 389–401. [Google Scholar] [CrossRef]
- Zhang, H.L.; Ma, Q.; Fan, L.F.; Zhao, P.F.; Wang, J.X.; Zhang, X.D.; Zhu, D.H.; Huang, L.; Zhao, D.J.; Wang, Z.Y. Nondestructive in situ measurement method for kernel moisture content in corn ear. Sensor 2016, 16, 2196. [Google Scholar] [CrossRef] [Green Version]
- Weinberg, Z.G.; Yan, Y.; Chen, Y.; Finkelman, S.; Ashbell, G.; Navarro, S. The effect of moisture level on high-moisture maize (Zea mays L.) under hermetic storage conditions—In vitro studies. J. Stored Prod. Res. 2008, 44, 136–144. [Google Scholar] [CrossRef]
- Szulc, P. Starter fertilization of maize as a method to improve the efficiency of nutrient application. Pol. J. Natur. Sci. 2017, 32, 615–636. [Google Scholar]
- Ao, S.; Russelle, M.P.; Feyereisen, G.W.; Varga, T.; Coulter, J.A. Maize hybrid response to sustained moderate drought stress reveals clues for improved management. Agronomy 2020, 10, 1374. [Google Scholar] [CrossRef]
- Kruczek, A. Response of maize varieties to the method of fertilization with a two-component NP fertilizer depending on the date of sowing. Pamiętnik Puławski 2005, 140, 117–127. (In Polish) [Google Scholar]
- Jagła, M.; Szulc, P.; Ambroży-Deręgowska, K.; Mejza, I.; Kobus-Cisowska, J. Yielding of two types of maize cultivars in relation to selected agrotechnical factors. Plant Soil Environ. 2019, 65, 416–423. [Google Scholar] [CrossRef] [Green Version]
- Mandić, V.; Dordević, S.; Bikelić, Z.; Krnjaja, V.; Pantelić, V.; Simić, A.; Dragićević, V. Agronomic responses of soybean genotypes to starter nitrogen fertilizer rate. Agronomy 2020, 10, 535. [Google Scholar] [CrossRef] [Green Version]
- Rehm, G.W.; Lamb, J.A. Corn Response to Fluid Fertilizers Placed Near the Seed at Planting. Nutr. Manag. Soil Plant Anal. 2009, 73, 1427–1434. [Google Scholar] [CrossRef]
- Grzebisz, W.; Szczepaniak, W.; Bocianowski, J. Potassium fertilization as a driver of sustainable management of nitrogen in potato (Solanum tuberosum L.). Field Crops Res. 2020, 254, 107824. [Google Scholar] [CrossRef]
- Zobel, R.W.; Wright, M.J.; Gauch, H.G. Statistical analysis of yield trial. Agron. J. 1988, 80, 388–393. [Google Scholar] [CrossRef]
- Gauch, H.G.; Zobel, R.W. Imputing missing yield trial data. Theor. Appl. Genet. 1990, 79, 753–761. [Google Scholar] [CrossRef] [PubMed]
- Bocianowski, J.; Szulc, P.; Nowosad, K. Soil tillage methods by years interaction for dry matter of plant yield of maize (Zea mays L.) using additive main effects and multiplicative interaction model. J. Integr. Agric. 2018, 17, 2836–2839. [Google Scholar] [CrossRef] [Green Version]
- Crossa, J.; Gauch, H.G.; Zobel, R.W. Additive main effects and multiplicative interactions analysis of two international maize cultivar trials. Crop Sci. 1990, 30, 493–500. [Google Scholar] [CrossRef]
- Bocianowski, J.; Nowosad, K.; Szulc, P. Soil tillage methods by years interaction for harvest index of maize (Zea mays L.) using additive main effects and multiplicative interaction model. Acta Agric. Scand. B Soil Plant Sci. 2019, 69, 75–81. [Google Scholar] [CrossRef]
- Fotso, A.K.; Hanna, R.; Kulakow, P.; Parkes, E.; Iluebbey, P.; Ngome, F.A.; Suh, C.; Massussi, J.; Choutnji, I.; Wirnkar, V.L. AMMI analysis of cassava response to contrasting environments: Case study of genotype by environment effect on pests and diseases, root yield, and carotenoids content in Cameroon. Euphytica 2018, 214, 155. [Google Scholar] [CrossRef]
- Bocianowski, J.; Nowosad, K.; Tomkowiak, A. Genotype—Environment interaction for seed yield of maize hybrids and lines using the AMMI model. Maydica 2019, 64, M13. [Google Scholar]
- Padarewski, J.; Rodrigues, P.C. The usefulness of EM-AMMI to study the influence of missing data pattern and application to Polish post-registration winter wheat data. Aust. J. Crop Sci. 2014, 8, 640–645. [Google Scholar]
- Bocianowski, J.; Liersch, A.; Nowosad, K. Genotype by environment interaction for alkenyl glucosinolates content in winter oilseed rape (Brassica napus L.) using additive main effects and multiplicative interaction model. Curr. Plant Biol. 2020, 21, 100137. [Google Scholar] [CrossRef]
- Hassani, M.; Heidari, B.; Dadkhodaie, A.; Stevanato, P. Genotype by environment interaction components underlying variations in root, sugar and white sugar yield in sugar beet (Beta vulgaris L). Euphytica 2018, 214, 79. [Google Scholar] [CrossRef]
- Bocianowski, J.; Tratwal, A.; Nowosad, K. Genotype by environment interaction for main winter triticale varieties characteristics at two levels of technology using additive main effects and multiplicative interaction model. Euphytica 2021, 217, 26. [Google Scholar] [CrossRef]
- World Reference Base for Soil Resources; IUSS Working Group WRB, World Soil Res. Rep. 103; FAO: Rome, Italy, 2006.
- Soil Taxonomy. A Basic System of Soil Classification for Making and Interpreting Soil Surveys; Soil Survey Staff USDA-NRCS. Agri. Handb. 436; U.S. Gov. Printing Office: Washington, DC, USA, 1999. [Google Scholar]
- Dubas, A.; Drzymała, S.; Mocek, A.; Owczarzak, W.; Szulc, P. Impact of Reduced Tillage in Long-Term Maize Monoculture (Zea mays L.) on Soil Properties and Plant Vegetation and Yielding; University Publisher Poznań University of Life Sciences: Poznań, Poland, 2012; 74p; ISBN 978-83-7160-662-5. (In Polish) [Google Scholar]
- Szulc, P.; Jagła, M.; Nowosad, K.; Bocianowski, J.; Olejarski, P. Path analysis in assessment of cause and effect dependencies of yield structure components in maize cultivars differing in genetic profiles. Fresenius Environ. Bull. 2017, 26, 7309–7318. [Google Scholar]
- Nowosad, K.; Liersch, A.; Popławska, W.; Bocianowski, J. Genotype by environment interaction for seed yield in rapeseed (Brassica napus L.) using additive main effects and multiplicative interaction model. Euphytica 2016, 208, 187–194. [Google Scholar] [CrossRef]
- Purchase, J.L.; Hatting, H.; van Deventer, C.S. Genotype × environment interaction of winter wheat (Triticum aestivum L.) in South Africa: II. Stability analysis of yield performance. S. Afr. J. Plant Soil 2000, 17, 101–107. [Google Scholar] [CrossRef]
- Nowosad, K.; Liersch, A.; Poplawska, W.; Bocianowski, J. Genotype by environment interaction for oil content in winter oilseed rape (Brassica napus L.) using additive main effects and multiplicative interaction model. Indian J. Genet. Pl. Br. 2017, 77, 293–297. [Google Scholar] [CrossRef] [Green Version]
- Gollob, H.F. A statistical model which combines features of factor analytic and analysis of variance techniques. Psychometrika 1968, 33, 73–155. [Google Scholar] [CrossRef]
- Genstat, 18th ed.; v.18.2.0.18409; VSN International Ltd.: Hemel Hempstead, UK, 2016.
- Bocianowski, J.; Szulc, P.; Nowosad, K.; Rybus-Zając, M. Relationships between selected traits of maize cultivars differing in leaf blade senescence rates. Polish J. Agron. 2016, 26, 9–14. [Google Scholar]
- Szulc, P.; Kruczek, A. Change of the morphological features of maize in dependence on doses of phosphorus and methods of their usage. Roczniki AR w Poznaniu 2005, 64, 173–183. (In Polish) [Google Scholar]
- Ge, Z.; Rubio, G.; Lynch, J.P. The importance of root gravitropism for inter-root competition and phosphorus acquisition efficiency: Results from a geometric simulation model. Plant Soil 2000, 218, 159–171. [Google Scholar] [CrossRef] [PubMed]
- Kruczek, A.; Szulc, P. Effect of fertilization method on the uptake and accumulation of mineral components in the initial period of maize development. Int. Agrophys. 2006, 20, 11–22. [Google Scholar]
- Hardegree, S.P.; Jones, T.A.; Roundy, B.A.; Shaw, N.L.; Monaco, T.A. Assessment of range planting as a conservation practice. Rangel. Ecol. Manag. 2016, 69, 237–247. [Google Scholar] [CrossRef]
- Sáenz Rodrígueaz, M.N.; Cassab, G.I. Primary root and mesocotyl elongation in maize seedlings: Two organs with antagonistic growth below the soil surface. Plants 2021, 10, 1274. [Google Scholar] [CrossRef] [PubMed]
- Zhao, G.; Wang, J.H. Effect of auxin on mesocotyl elongation of dark-grown maize under different seeding depths. Russ. J. Plant Physiol. 2010, 57, 79–86. [Google Scholar] [CrossRef]
- Eapen, D.; Martinez, J.J.; Hernández, O.; Flores, L.; Nieto-Sotelo, J.; Cassab, G.I. Synergy between root hydrotropic response and root biomass in maize (Zea mays L.) enhances drought avoidance. Plant. Sci. 2017, 365, 87–99. [Google Scholar] [CrossRef]
- Vanhees, D.J.; Loades, K.W.; Bengough, A.G.; Mooney, S.J.; Lynch, J. Root anatomical traits contribute to deeper rooting of maize under compacted field conditions. J. Exp. Bot. 2020, 14, 4243–4257. [Google Scholar] [CrossRef]
- Bocianowski, J.; Radkowski, A.; Nowosad, K.; Radkowska, I.; Zieliński, A. The impact of genotype-by-environment interaction on the dry matter yield and chemical composition in timothy (Phleum pratense L.) examined by using the additive main effects and multiplicative interaction model. Grass Forage Sci. 2021. [Google Scholar] [CrossRef]
- Hristov, N.; Mladenov, N.; Djuric, V.; Kondic-Spika, A.; Marjanovic-Jeromela, A.; Simic, D. Genotype by environment interactions in wheat quality breeding programs in southeast Europe. Euphytica 2010, 174, 315–324. [Google Scholar] [CrossRef]
- Bocianowski, J.; Księżak, J.; Nowosad, K. Genotype by environment interaction for seeds yield in pea (Pisum sativum L.) using additive main effects and multiplicative interaction model. Euphytica 2019, 215, 191. [Google Scholar] [CrossRef] [Green Version]
- Berti, M.; Fischer, S.; Wilckens, R.; Hevia, F.; Johnson, B. Adaptation and genotype × environment interaction of flaxseed (Linum usitatissimum L.) genotypes in South Central Chile. Chil. J. Agric. Res. 2010, 70, 345–356. [Google Scholar]
- Nowosad, K.; Tratwal, A.; Bocianowski, J. Genotype by environment interaction for grain yield in spring barley using additive main effects and multiplicative interaction model. Cereal Res. Commun. 2018, 46, 729–738. [Google Scholar] [CrossRef]
- Abakemal, D.; Shimelis, H.; Derera, J. Genotype-by-environment interaction and yield stability of quality protein maize hybrids developed from tropical-highland adapted inbred lines. Euphytica 2016, 209, 757–769. [Google Scholar] [CrossRef]
- Bocianowski, J.; Niemann, J.; Nowosad, K. Genotype-by-environment interaction for seed quality traits in interspecific cross-derived Brassica lines using additive main effects and multiplicative interaction model. Euphytica 2019, 215, 7. [Google Scholar] [CrossRef] [Green Version]
- Edwards, J.W. Genotype×environment interaction for plant density response in maize (Zea mays L.). Crop Sci. 2016, 56, 1493–1505. [Google Scholar] [CrossRef] [Green Version]
- Bocianowski, J.; Warzecha, T.; Nowosad, K.; Bathelt, R. Genotype by environment interaction using AMMI model and estimation of additive and epistasis gene effects for 1000-kernel weight in spring barley (Hordeum vulgare L.). J. Appl. Genet. 2019, 60, 127–135. [Google Scholar] [CrossRef] [Green Version]
- Rea, R.; De Sousa-Vieira, O.; Díaz, A.; Ramón, M.; Briceño, R.; George, J.; Niño, M.; Balzano-Nogueira, L. Genotype-environment interaction, megaenvironments and two-table coupling methods for sugarcane yield studies in Venezuela. Sugar Tech. 2016, 18, 354–364. [Google Scholar] [CrossRef]
- Bocianowski, J.; Nowosad, K.; Liersch, A.; Popławska, W.; Łącka, A. Genotype-by-environment interaction for seed glucosinolate content in winter oilseed rape (Brassica napus L.) using an additive main effects and multiplicative interaction model. Biom. Lett. 2018, 55, 85–96. [Google Scholar] [CrossRef] [Green Version]
- Bocianowski, J.; Tratwal, A.; Nowosad, K. Genotype by environment interaction for area under the disease-progress curve (AUDPC) value in spring barley using additive main effects and multiplicative interaction model. Australas. Plant Pathol. 2020, 49, 525–529. [Google Scholar] [CrossRef]
- Liersch, A.; Bocianowski, J.; Nowosad, K.; Spasibionek, S.; Szała, L.; Cegielska-Taras, T.; Sosnowska, K.; Matuszczak, M.; Mikołajczyk, M.; Bartkowiak-Broda, I. Effect of Genotype × Environment Interaction for Seed Traits in Winter Oilseed Rape (Brassica napus L.). Agriculture 2020, 10, 607. [Google Scholar] [CrossRef]
- Gauch, H.G. Model selection and validation for yield trials with interaction. Biometrics 1988, 44, 705–715. [Google Scholar] [CrossRef]
- Gauch, H.G. Statistical Analysis of Regional Yield Trials: AMMI Analysis of Factorial Designs; Elsevier: Amsterdam, The Netherlands, 1992. [Google Scholar]
- Gauch, H.G.; Zobel, R.W. AMMI analyses of yield trials. In Genotype by Environment Interaction; Kang, M.S., Gauch, H.G., Eds.; CRC: Boca Raton, FL, USA, 1996; pp. 85–122. [Google Scholar]


| Specification | Years | |||||
|---|---|---|---|---|---|---|
| 2015 | 2016 | 2017 | 2018 | 2019 | 2020 | |
| P [mg P kg−1 dm of soil] | 40.0 | 104.0 | 73.0 | 49.0 | 155.0 | 115.0 |
| K [mg K kg−1 dm of soil] | 111.0 | 97.0 | 108.0 | 116.0 | 122.0 | 103.4 |
| Mg [mg Mg kg−1 dm of soil] | 29.0 | 44.0 | 53.0 | 53.0 | 69.0 | 58.0 |
| pH [1 mol dm−3 KCl] | 4.5 | 4.6 | 5.6 | 5.1 | 5.8 | 5.9 |
| Nmin [kg ha−1] in soil, layer 0.0–0.6 m | 68.5 | 79.2 | 71.4 | 65.7 | 69.3 | 73.8 |
| C, org. [%] | 1.01 | 0.99 | 0.99 | 0.98 | 1.02 | 1.00 |
| Years | Temperature [°C] | |||
|---|---|---|---|---|
| April | May | June | Average/Sum | |
| 2015 | 9.3 | 13.9 | 16.9 | 13.4 |
| 2016 | 9.6 | 16.3 | 19.9 | 15.3 |
| 2017 | 7.3 | 13.7 | 17.4 | 12.8 |
| 2018 | 12.9 | 16.9 | 18.5 | 16.1 |
| 2019 | 10.5 | 11.9 | 22.0 | 14.8 |
| 2020 | 9.4 | 11.8 | 18.3 | 13.2 |
| Years | Rainfall [mm] | |||
| 2015 | 17.6 | 27.2 | 66.6 | 111.4 |
| 2016 | 47.3 | 47.3 | 12.8 | 107.4 |
| 2017 | 40.6 | 56.8 | 68.2 | 165.6 |
| 2018 | 36.2 | 17.4 | 25.6 | 79.2 |
| 2019 | 8.6 | 94.4 | 7.2 | 110.2 |
| 2020 | 2.0 | 52.8 | 42.8 | 97.6 |
| Years | Values of hydrothermal coefficient of water preservation [K] 1 | |||
| 2015 | 0.63 | 0.63 | 1.31 | 0.85 |
| 2016 | 1.64 | 0.93 | 2.07 | 1.54 |
| 2017 | 1.85 | 1.33 | 1.30 | 1.49 |
| 2018 | 0.93 | 0.33 | 0.46 | 0.57 |
| 2019 | 0.27 | 2.55 | 0.11 | 0.97 |
| 2020 | 0.07 | 1.44 | 0.77 | 0.76 |
| Source of Variation | d.f. | Sum of Squares | Mean Squares | F Statistic | Variability Explained (%) |
|---|---|---|---|---|---|
| Treatments | 23 | 5.404 | 0.2349 | 24.09 *** | 89.40 |
| NP Fertilizer Placement Depth (D) | 3 | 1.403 | 0.4678 | 47.96 *** | 23.21 |
| Year (Y) | 5 | 3.718 | 0.7435 | 117.19 *** | 61.51 |
| DY Interaction | 15 | 0.283 | 0.0189 | 1.93 * | 4.68 |
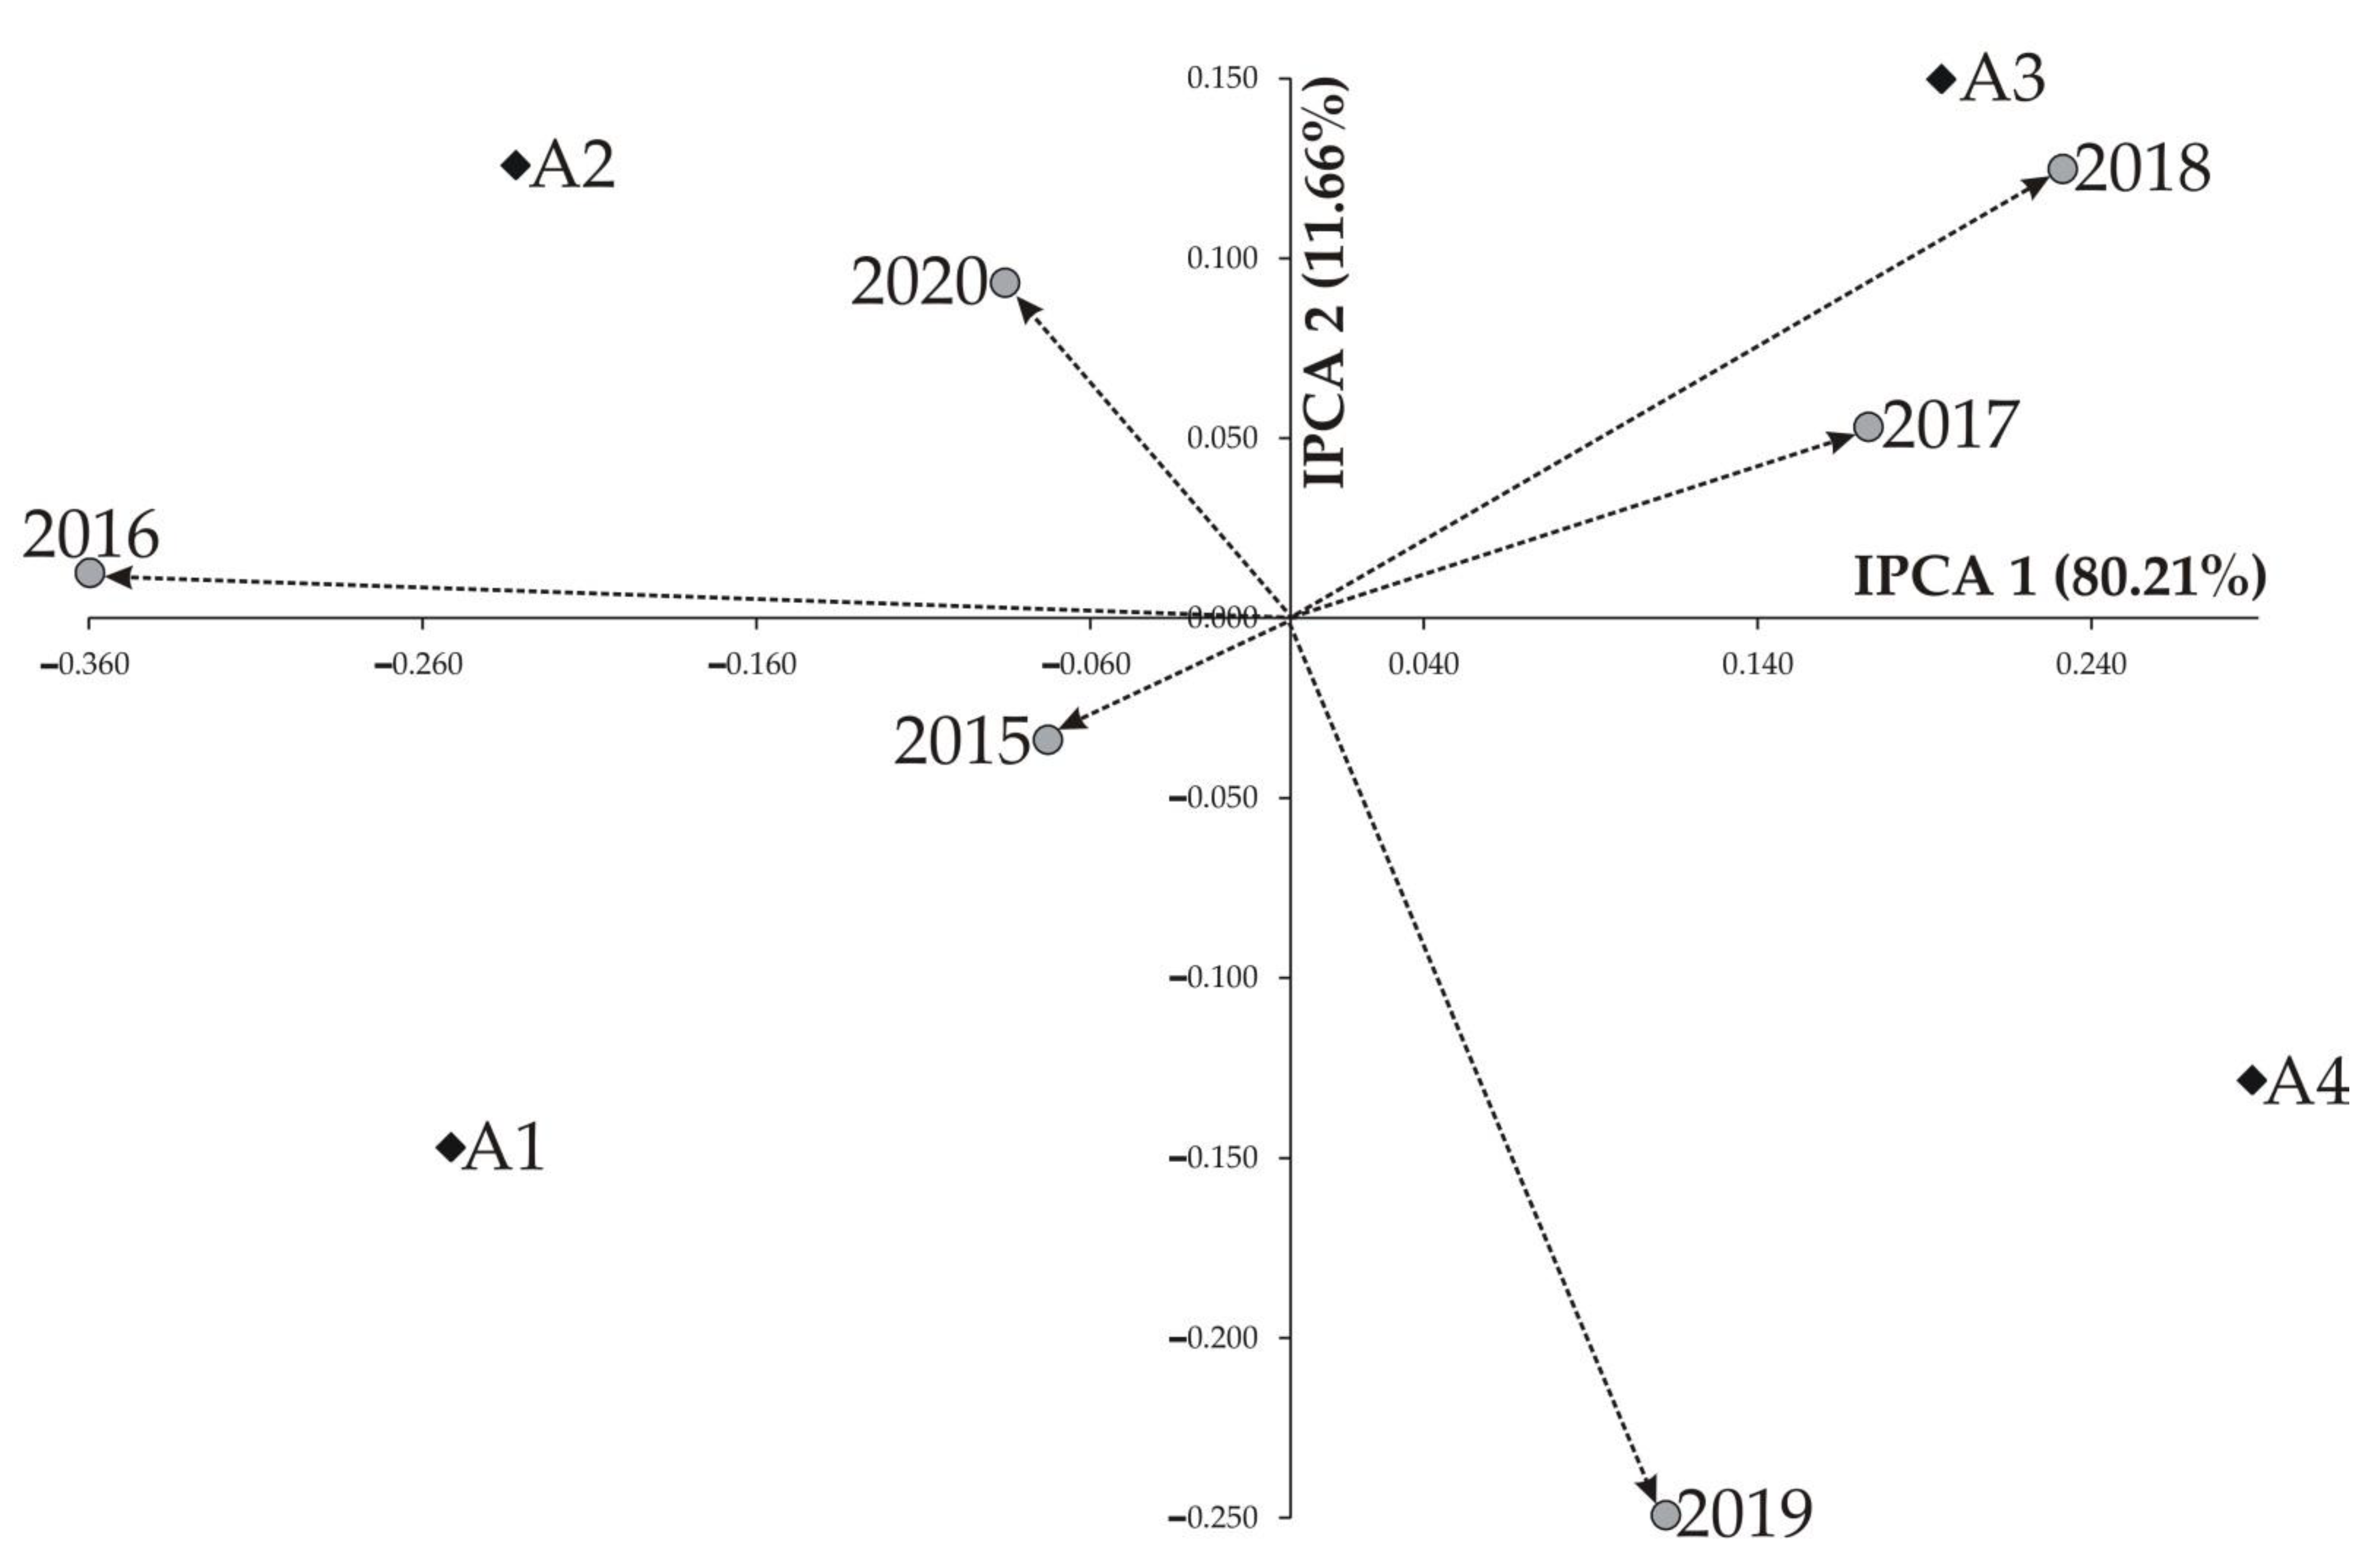
| IPCA 1 | 7 | 0.227 | 0.0324 | 3.32 ** | 80.21 |
| IPCA 2 | 5 | 0.033 | 0.0066 | 0.67 * | 11.66 |
| Residuals | 3 | 0.023 | 0.0078 | 0.8 * | 8.13 |
| Error | 54 | 0.527 | 0.0098 |
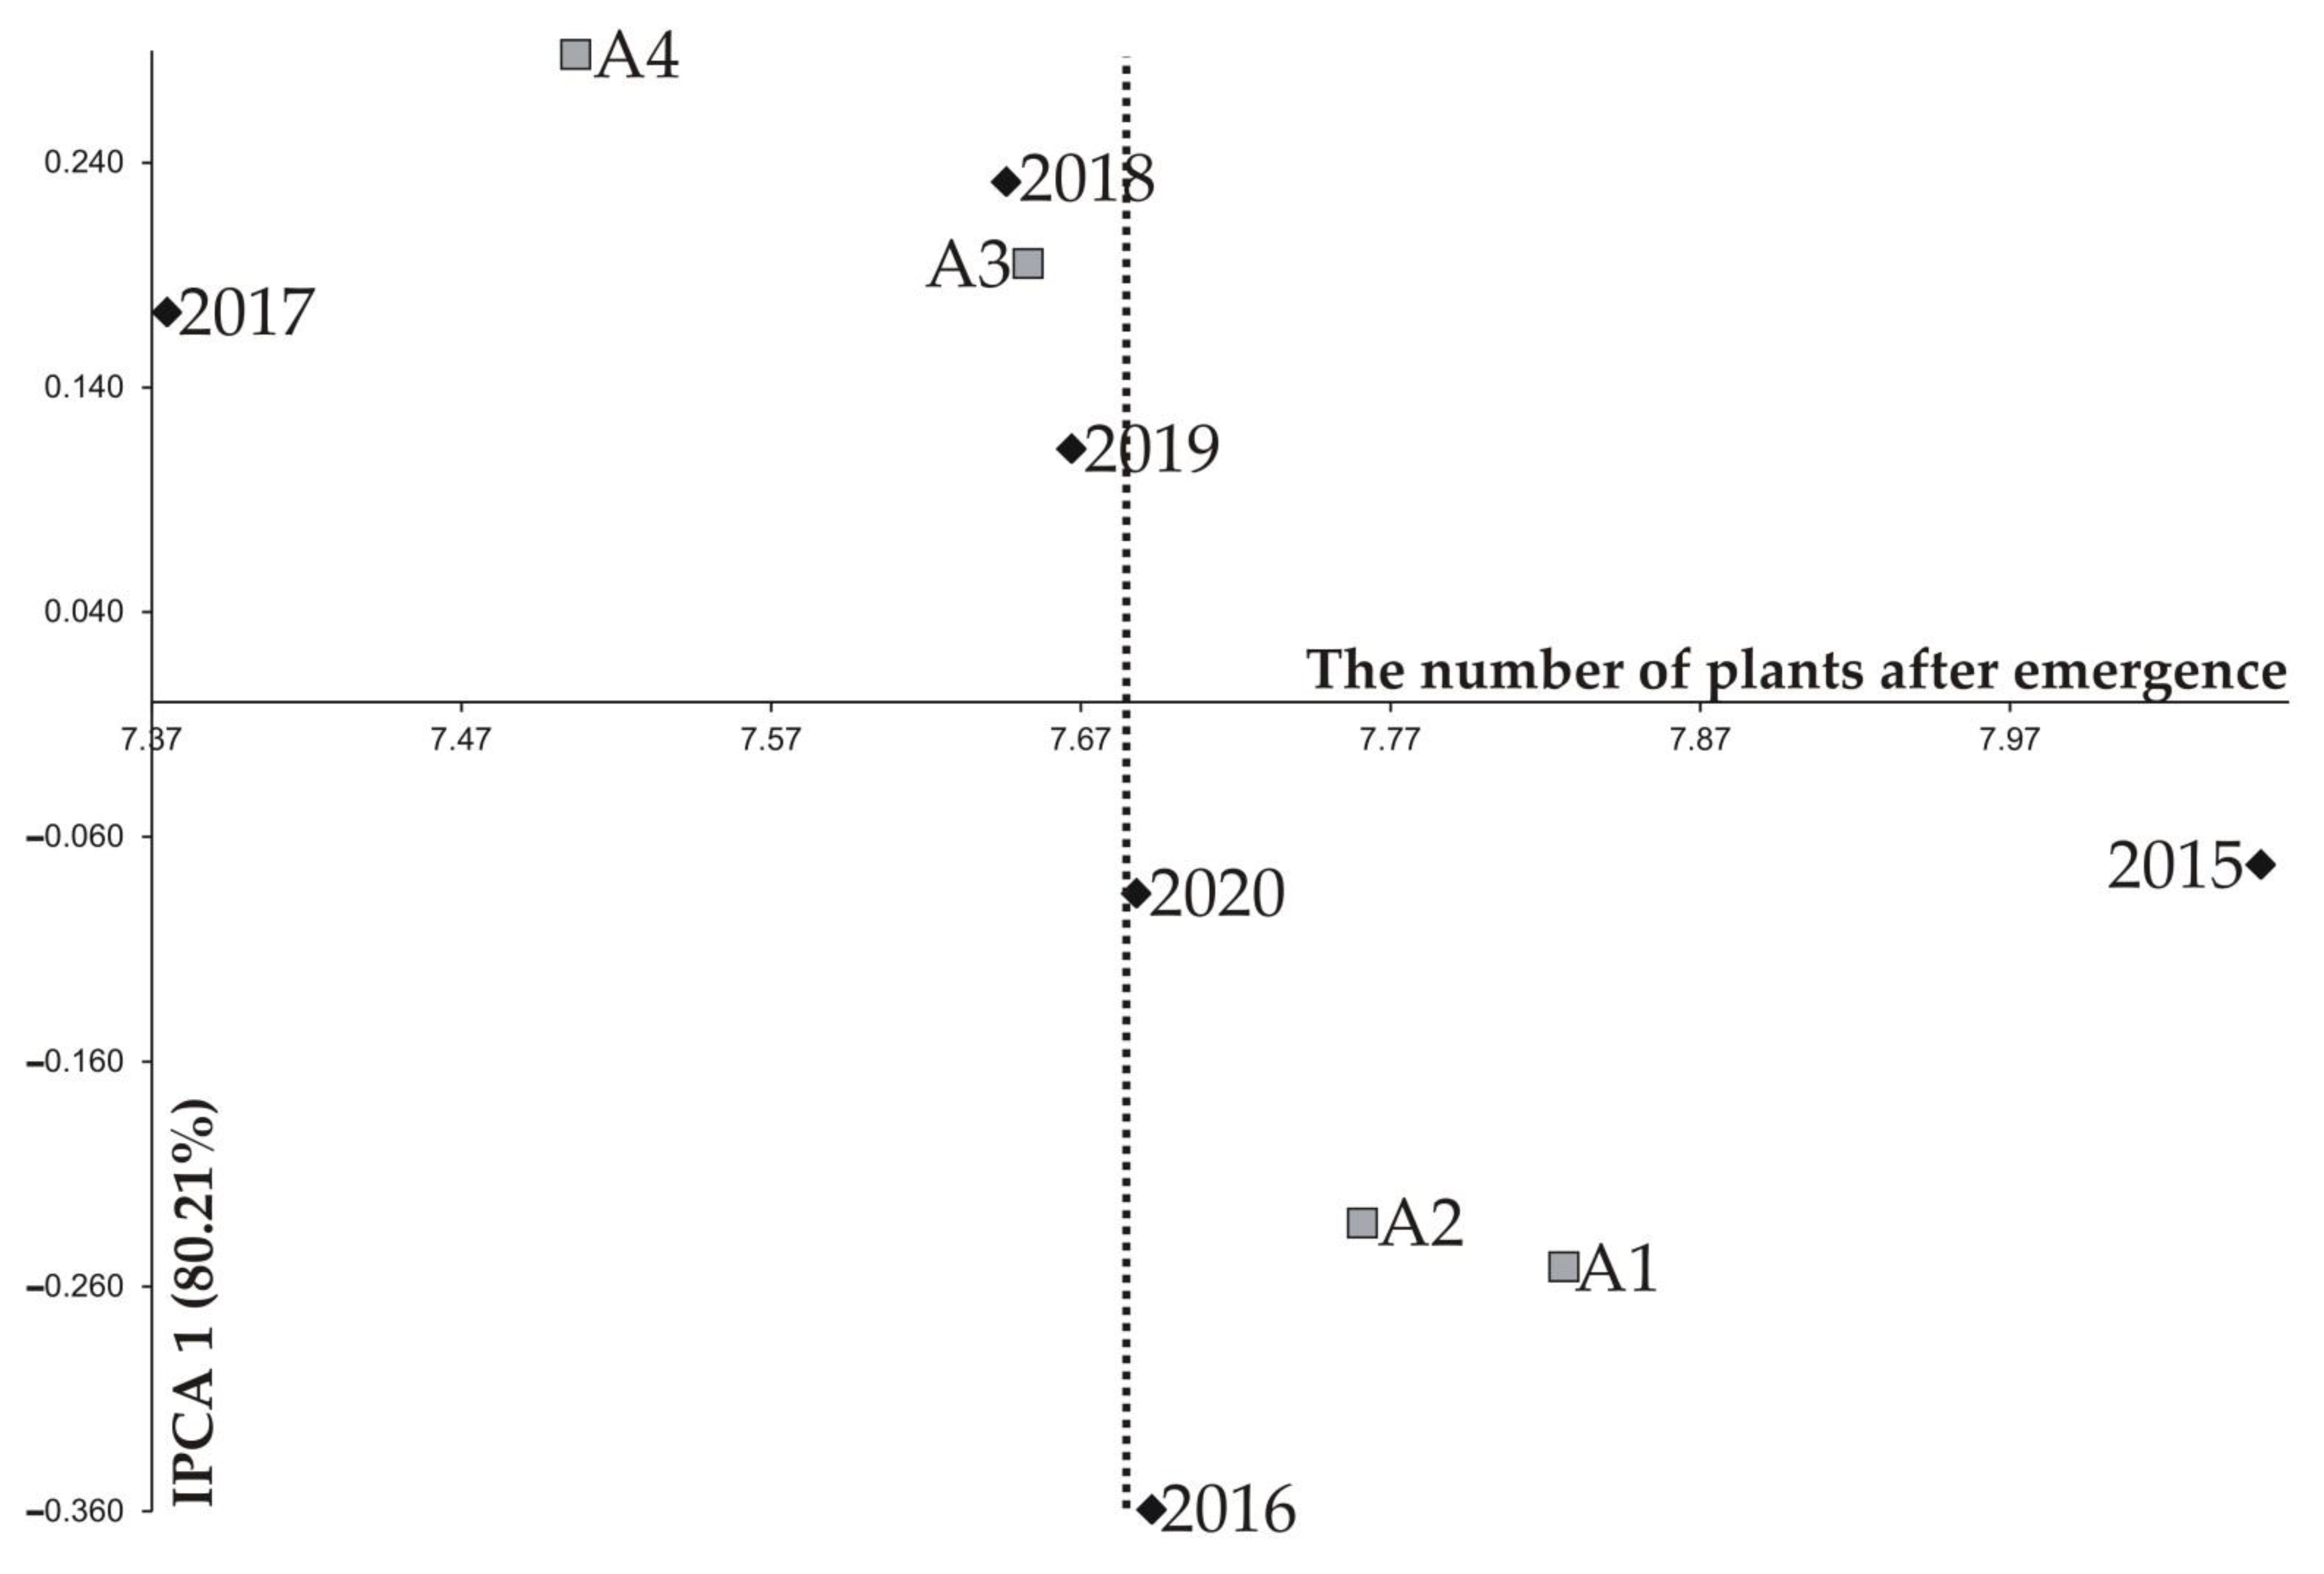
| Year | NP Fertilizer Placement Depth | IPCA 1 | IPCA 2 | ||||||
|---|---|---|---|---|---|---|---|---|---|
| A1 1 | A2 | A3 | A4 | Mean | Standard Deviation | Coefficient of Variation | |||
| 2015 | 8.201 a2 | 8.147 ab | 8.022 ab | 7.835 b | 8.051 | 0.161 | 2.00 | −0.073 | −0.034 |
| 2016 | 7.911 a | 7.862 a | 7.598 b | 7.402 b | 7.693 | 0.233 | 3.03 | −0.360 | 0.012 |
| 2017 | 7.446 a | 7.432 a | 7.384 b | 7.237 c | 7.375 | 0.114 | 1.55 | 0.173 | 0.053 |
| 2018 | 7.710 a | 7.688 ab | 7.637 ab | 7.548 b | 7.646 | 0.103 | 1.34 | 0.231 | 0.125 |
| 2019 | 7.821 a | 7.665 b | 7.688 b | 7.496 c | 7.667 | 0.153 | 2.00 | 0.113 | −0.249 |
| 2020 | 7.867 a | 7.770 a | 7.590 b | 7.522 b | 7.688 | 0.168 | 2.18 | −0.085 | 0.093 |
| Mean | 7.826 a | 7.761 ab | 7.653 ab | 7.507 b | 7.687 | 0.252 | 3.28 | ||
| Coefficient of variation | 3.17 | 3.08 | 2.78 | 2.59 | |||||
| IPCA 1 | −0.251 | −0.232 | 0.195 | 0.288 | |||||
| IPCA 2 | −0.147 | 0.126 | 0.150 | −0.128 | |||||
| ASV | 1.745 | 1.615 | 1.361 | 1.999 | |||||
Publisher’s Note: MDPI stays neutral with regard to jurisdictional claims in published maps and institutional affiliations. |
© 2021 by the authors. Licensee MDPI, Basel, Switzerland. This article is an open access article distributed under the terms and conditions of the Creative Commons Attribution (CC BY) license (https://creativecommons.org/licenses/by/4.0/).
Share and Cite
Szulc, P.; Bocianowski, J.; Nowosad, K.; Bujak, H.; Zielewicz, W.; Stachowiak, B. Effects of NP Fertilizer Placement Depth by Year Interaction on the Number of Maize (Zea mays L.) Plants after Emergence Using the Additive Main Effects and Multiplicative Interaction Model. Agronomy 2021, 11, 1543. https://doi.org/10.3390/agronomy11081543
Szulc P, Bocianowski J, Nowosad K, Bujak H, Zielewicz W, Stachowiak B. Effects of NP Fertilizer Placement Depth by Year Interaction on the Number of Maize (Zea mays L.) Plants after Emergence Using the Additive Main Effects and Multiplicative Interaction Model. Agronomy. 2021; 11(8):1543. https://doi.org/10.3390/agronomy11081543
Chicago/Turabian StyleSzulc, Piotr, Jan Bocianowski, Kamila Nowosad, Henryk Bujak, Waldemar Zielewicz, and Barbara Stachowiak. 2021. "Effects of NP Fertilizer Placement Depth by Year Interaction on the Number of Maize (Zea mays L.) Plants after Emergence Using the Additive Main Effects and Multiplicative Interaction Model" Agronomy 11, no. 8: 1543. https://doi.org/10.3390/agronomy11081543
APA StyleSzulc, P., Bocianowski, J., Nowosad, K., Bujak, H., Zielewicz, W., & Stachowiak, B. (2021). Effects of NP Fertilizer Placement Depth by Year Interaction on the Number of Maize (Zea mays L.) Plants after Emergence Using the Additive Main Effects and Multiplicative Interaction Model. Agronomy, 11(8), 1543. https://doi.org/10.3390/agronomy11081543