Article

Organic Oat Response to Variety, Seeding Rate, and Nutrient Source and Rate

1
Department of Soil, Water, and Climate, University of Minnesota, 1991 Upper Buford Circle, Saint Paul, MN 55108, USA
2
Department of Soil, Water, and Climate, University of Minnesota, 23669 130th Street, Lamberton, MN 56152, USA
*
Author to whom correspondence should be addressed.
Agronomy 2021, 11(7), 1418; https://doi.org/10.3390/agronomy11071418
Submission received: 23 June 2021 / Revised: 8 July 2021 / Accepted: 13 July 2021 / Published: 15 July 2021
(This article belongs to the Section Soil and Plant Nutrition)

Abstract

:
Oat (Avena sativa L.) is an important crop for organic production systems in the upper Midwest, but limited information on optimal nutrient management and seeding rates is available. Oat varieties representing three maturity groups were evaluated during 2015 and 2016 in Lamberton, Minnesota on organically certified ground previously planted to alfalfa (Medicago sativa L.). Two oat seeding rates (110 and 145 kg ha−1), two nutrient sources (raw and composted beef manure), and four N application rates (0, 50, 100, and 150 kg ha−1) were studied. Plant population; number of tillers; grain yield; grain nutrient removal (primary and secondary macronutrients); and post-harvest soil nitrate, Bray P-1, and K in the top 0 to 15 cm layer were measured. Grain yield was 4.8, 4.0, and 3.8 kg ha−1 for late maturing Deon, early maturing Tack/Saber, and medium maturing Shelby, respectively. Yield was optimized at a nutrient application rate of 82.3 kg N ha−1 and decreased at higher rates. Grain N content was not related to yield, suggesting that the other nutrients in manure and compost may have been responsible for optimizing yield. High application rates resulted in increased residual soil test P and K levels, which could become problematic if not managed appropriately.

1. Introduction

Small grains remain an important part of field crop production in organic systems, especially in the U.S. upper Midwest [1,2]. This is because longer, more diverse rotations (three or more years) tend to reduce weeds [3], break pest cycles [4], and improve economic returns [5,6] in organic systems. Oat, in particular, tends to be rotated with corn (Zea mays L.), soybean (Glycine max (L.) Merr.), and occasionally alfalfa. Oat has diverse uses as a food for human consumption, as animal feed, or even as bedding for livestock. In 2016, oat was produced on approximately 20,000 hectares of organically certified land in the U.S., with 65% of production occurring in the four-state region of Iowa, North Dakota, Minnesota, and Wisconsin [7].
Though oat is commonly rotated with corn, soybean, and/or alfalfa, research about agronomic practices that optimize production in this region is limited [2] despite new varieties being released on a regular basis—as recently as 2012 and 2019 by the Minnesota Experiment Station [8]. The lack of research may be due to lower economic returns for oat compared with other field crops [2,9], so it may be overlooked in favor of the more profitable crops. Organic oat management requires additional layers of complexity [10], especially with regard to weed management and soil fertility needs. For example, cultural practices differ because there is restricted use of synthetic pesticides and fertilizers.
Because of reduced herbicide use, optimizing seeding rate is one way to maximize small grain yield in organic systems [11,12]. In studies evaluating organic oat, decreased weed biomass was associated with increased oat seeding rates (386 to 500 plants m−2) [2,13]. In addition to seeding rate, Canadian researchers [13] also evaluated two different oat varieties (more versus less competitive) and found the higher seeding rate improved yield regardless of variety. Additional information is needed to optimize seeding rates for varieties commonly used in the U.S. upper Midwest, however, especially as new ones are released.
Nutrient management is another factor important for optimizing yield, but can be complex in organic production systems, especially in small grains for which both under- and over-application can negatively impact yield [14,15,16]. Nutrients are generally provided by organic sources such as legumes in rotation, animal manures, and/or compost [10]. U.S. national organic standards require that raw manure be applied at specific times before crop harvest, and that compost be properly processed to reach specific temperatures required to kill pathogens [17]. Furthermore, mismanagement of animal manure, either raw or composted, can result in excessively high soil test phosphorus (P) levels with potential for negative impacts on the environment [18,19].
Managing soil nutrients is especially important in an organic alfalfa–oat rotation, because alfalfa provides a nitrogen (N) credit for the following oat crop, but consumes much of the P and potassium (K) that was applied with animal manure prior to establishment if applied at appropriate rates [20,21]. Alfalfa is especially known to remove large quantities of K from the soil due to luxury consumption [22,23]. Therefore, in organic production systems, application of P and K is often needed for the crop that follows alfalfa, and manure or compost are often the most economical choice [20]. However, the ratios of N, P, and K in manure are not often balanced for crop needs, resulting in under- or over-application of one or more nutrients [19,24]. Due to the complexity of meeting crop nutrient needs with imprecise nutrient sources, monitoring of N, P, and K soil levels after crop harvest can help farmers improve nutrient management in their operations, especially in organic production systems that rely on animal manure.
Few studies have evaluated different nutrient sources and application rates for optimum organic oat production, especially as it relates to variety and seeding rate. In a conventional system, Marshall et al. [25] reported that nitrogen and seeding rate impacted oat yield, but there was not an interaction between the two. On the other hand, May et al. [26] reported that two oat varieties responded differently to nitrogen. Given that oat varieties with different maturity groups differ in overall yield potential, it makes sense that optimal nitrogen rate may vary. Because the literature is limited regarding these production practices for organic systems, the purpose of the current study was to: (i) evaluate the effects of oat variety with different maturity groups, seeding rates, and organic nutrient sources (raw and composted beef manure) on organic oat productivity; (ii) and to assess grain nutrient removal and soil nutrient status of soil after oat harvest to better understand nutrient cycling in an organic system.

2. Materials and Methods

This field experiment was conducted at the University of Minnesota Southwestern Research and Outreach Center (SWROC) near Lamberton, MN (44°24′ N, 95°30′ W) during 2015 and 2016. The soil at the SWROC was a Normania loam (Fine-loamy, mixed, superactive, mesic Aquic Hapludolls) [27]. The experiment was conducted on certified organic land (certified organic for over 30 years) in an area that had been cultivated with alfalfa (Medicago sativa) for 3 years prior to oat planting. A new study area was initiated each year so that oat always followed alfalfa to assure the experimental areas were kept as certified organic land. Monthly total precipitation and average temperature was collected from the local weather station present at SWROC and compared to the 30 year average (1981–2010; Figure 1). Weeds were controlled by tine weeding two times during the growing season before the oat plants were tall enough to shade the soil and prevent further weed seed germination to maintain plots as clean as possible.
Eight soil samples were collected randomly using a soil probe 2.5 cm in width from each of the research plots prior to the beginning of this study from the 0 to 15 cm soil layer. After collection, soils were air-dried (35 °C), sieved (2 mm), and stored at room temperature (22 °C) until analyses were completed. Soil pH was measured in water (1:1 soil to water ratio) and soil organic matter (OM) content was measured by loss on ignition at 360 °C [28]. Soil-extractable P was extracted using the Bray P-1 extractant [28] and determined using the molybdate blue method of Murphy and Riley [29] on a Biotek Epoch spectrophotometer (Biotek, Winooski, VT). Soil potassium (K) was extracted using ammonium acetate and determined by atomic absorption [28]. Table 1 shows the results of initial soil tests.
Plots were 3 m in width by 15 m in length, though 0.15 m from each side and 1 m from each of the ends were not considered for sample collection or yield harvest to avoid edge effects. Treatments tested included two nutrient sources (composted and raw beef manure supplied by a local grower); four application rates (0, 50, 100, and 150 kg N ha−1) for each source; two seeding rates (110 and 145 kg oat ha−1); and varieties representing three oat maturity groups (early, medium, and late) each year. The two nutrient sources used were selected because they differ in plant nutrient release rates, particularly nitrogen [19,30]. The seeding rates tested were achieved by calibrating the planter to deliver the required amount of seeds for each seeding rate. The varieties representing the early maturing oats were Tack in 2015 and Saber in 2016 due to the unavailability of Tack seed (the Saber pedigree is ‘Tack’/’Spurs’). In both years, the medium maturity group was represented by variety Shelby 427 and the late maturity group by variety Deon.
Manure and compost samples were collected prior to application to test for nutrient concentration [31] to plan for application rates, as well as at the time of application to assure the correct amount of nutrients was applied. The as-applied nutrient concentrations and rates are in Table 2. The amount of manure and compost needed for each plot was individually weighed and manually applied to ensure that the correct amount was applied. After nutrient application, plots were tilled using a chisel plow down to a depth of 15 cm to incorporate manure and compost and prepare the seedbed for planting.
Manure and compost were applied on 4 May 2015 and 12 April 2016. Oat planting took place on 5 May 2015 and 12 April 2016. Oat was seeded with a seed drill using 15 cm row spacing down to a depth of 1 to 2 cm. Plant population and number of tillers per plant were quantified approximately 30 d after emergence by counting the number of plants and tillers per plant in a 0.1 m2 quadrat placed randomly in each plot. Oat harvest took place in August (between August 15 and 30) when each variety was ready for harvest, which differed according to variety. Grain yield was determined using a plot combine with moisture content adjusted to 12%.
After harvest, oat grain samples and soil samples (eight samples, 0 to 15 cm depth randomly collected using a 2.5 cm soil probe) were collected from each of the plots so that the grain nutrient removal and the soil nutrient status after crop growth could be determined. The grain samples were collected using a plot combine after harvesting the entire experimental plot. Grain samples were then ground using a mechanical mill grinder to pass through a 1-mm sieve and analyzed for N and S concentration by combustion using a CNS analyzer (VarioMACRO, Elementar, Langenselbold, Germany) following methods of Gavlak et al. [32]. Total nutrient concentrations, including P, K, Ca, and Mg, were determined by sulfuric acid + hydrogen peroxide digestion and analyzed using inductively coupled plasma optical emission spectroscopy (ICP-OES, Optima 8x00 Perkin Elmer, Norwalk, CT, USA) [32]. Total nutrient removal in the grain was calculated as the product of grain yield and nutrient concentration. After collection, soils were air-dried (35 °C), ground and sieved (2 mm), and stored at room temperature (22 °C) until analysis. Soil-extractable P and K were determined used the methods described above for the initial soil samples. Soil was extracted with 2M KCl and analyzed for nitrate according to Doane and Horwáth [33].
The experimental design was a split–split plot with nutrient source and rate as the whole plot arranged in a randomized complete block design. Variety was the first split level and the seeding rate was the second split level. There were three replications (blocks) for each treatment totaling 144 individual plots. Data for grain yield, grain nutrient concentration, and soil nutrient levels were analyzed at p ≤ 0.05 using the GLIMMIX procedure in SAS 9.4 [34]. Nutrient source and maturity effects and their interactions were considered fixed effects, nutrient rate was considered a continuous variable, while year (and its interactions) and replication were considered as random effects. With year designated as a random effect, inferences on optimal oat management could be extended to other growing seasons. Regression analysis was done to assess if the response to nutrient application rate was linear or non-linear. When fixed effects were found to be significant (see Table S1 in the Supplementary Files), pairwise mean comparisons were made at p ≤ 0.05 using the lines option in the GLIMMIX procedure of SAS [35]. A t-test was used to compare regression coefficients when a significant interaction was observed between fixed effects and N rates [36]. PROC CORR was used to evaluate relationships between yield, plant population, tillering, grain nutrient concentration, and soil nutrients [34]. When relationships were found to be significant at p ≤ 0.05, data were visually inspected and reported as weak, moderate, or strong when Pearson Correlation Coefficients were <0.39, 0.4 to 0.69, >0.70, respectively [37].

3. Results and Discussion
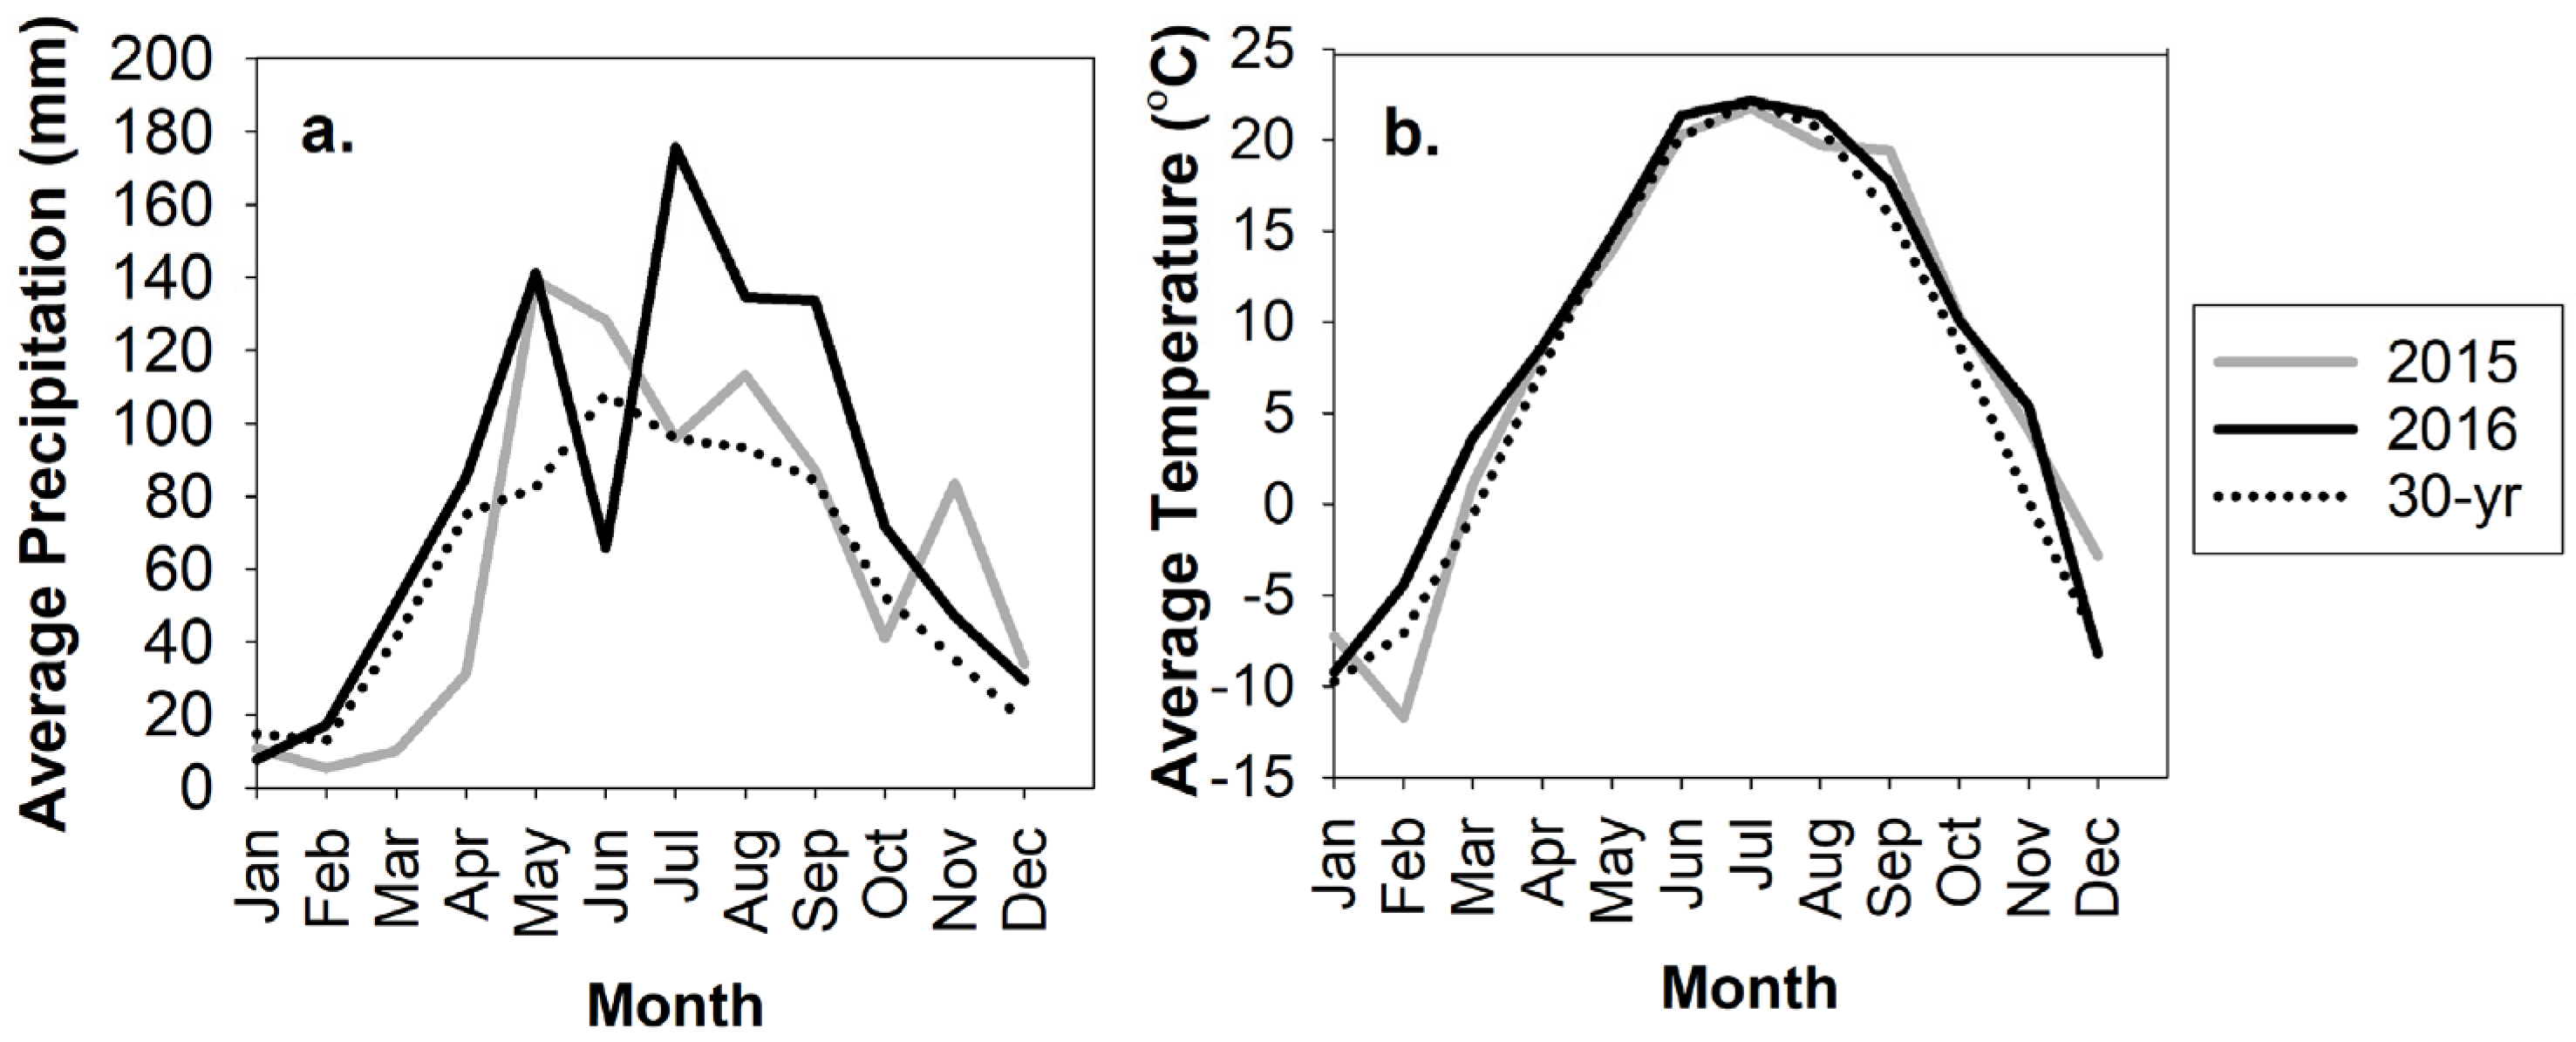
3.1. Weather

Small grains prefer cooler temperatures (the ideal average temperature is from 13 to 19 °C) with adequate moisture throughout the growing season [38]. Compared with the 30 year average, 2015 and 2016 were warmer and wetter than usual at Lamberton, MN (Figure 1). However, during the growing season (May to August), it was cooler and wetter than the 30 year average (−0.5 °C and +96.9 mm of precipitation compared to average) in 2015, but in 2016 it was warmer and wetter (+0.5 °C and +137.5 mm of precipitation compared to average).

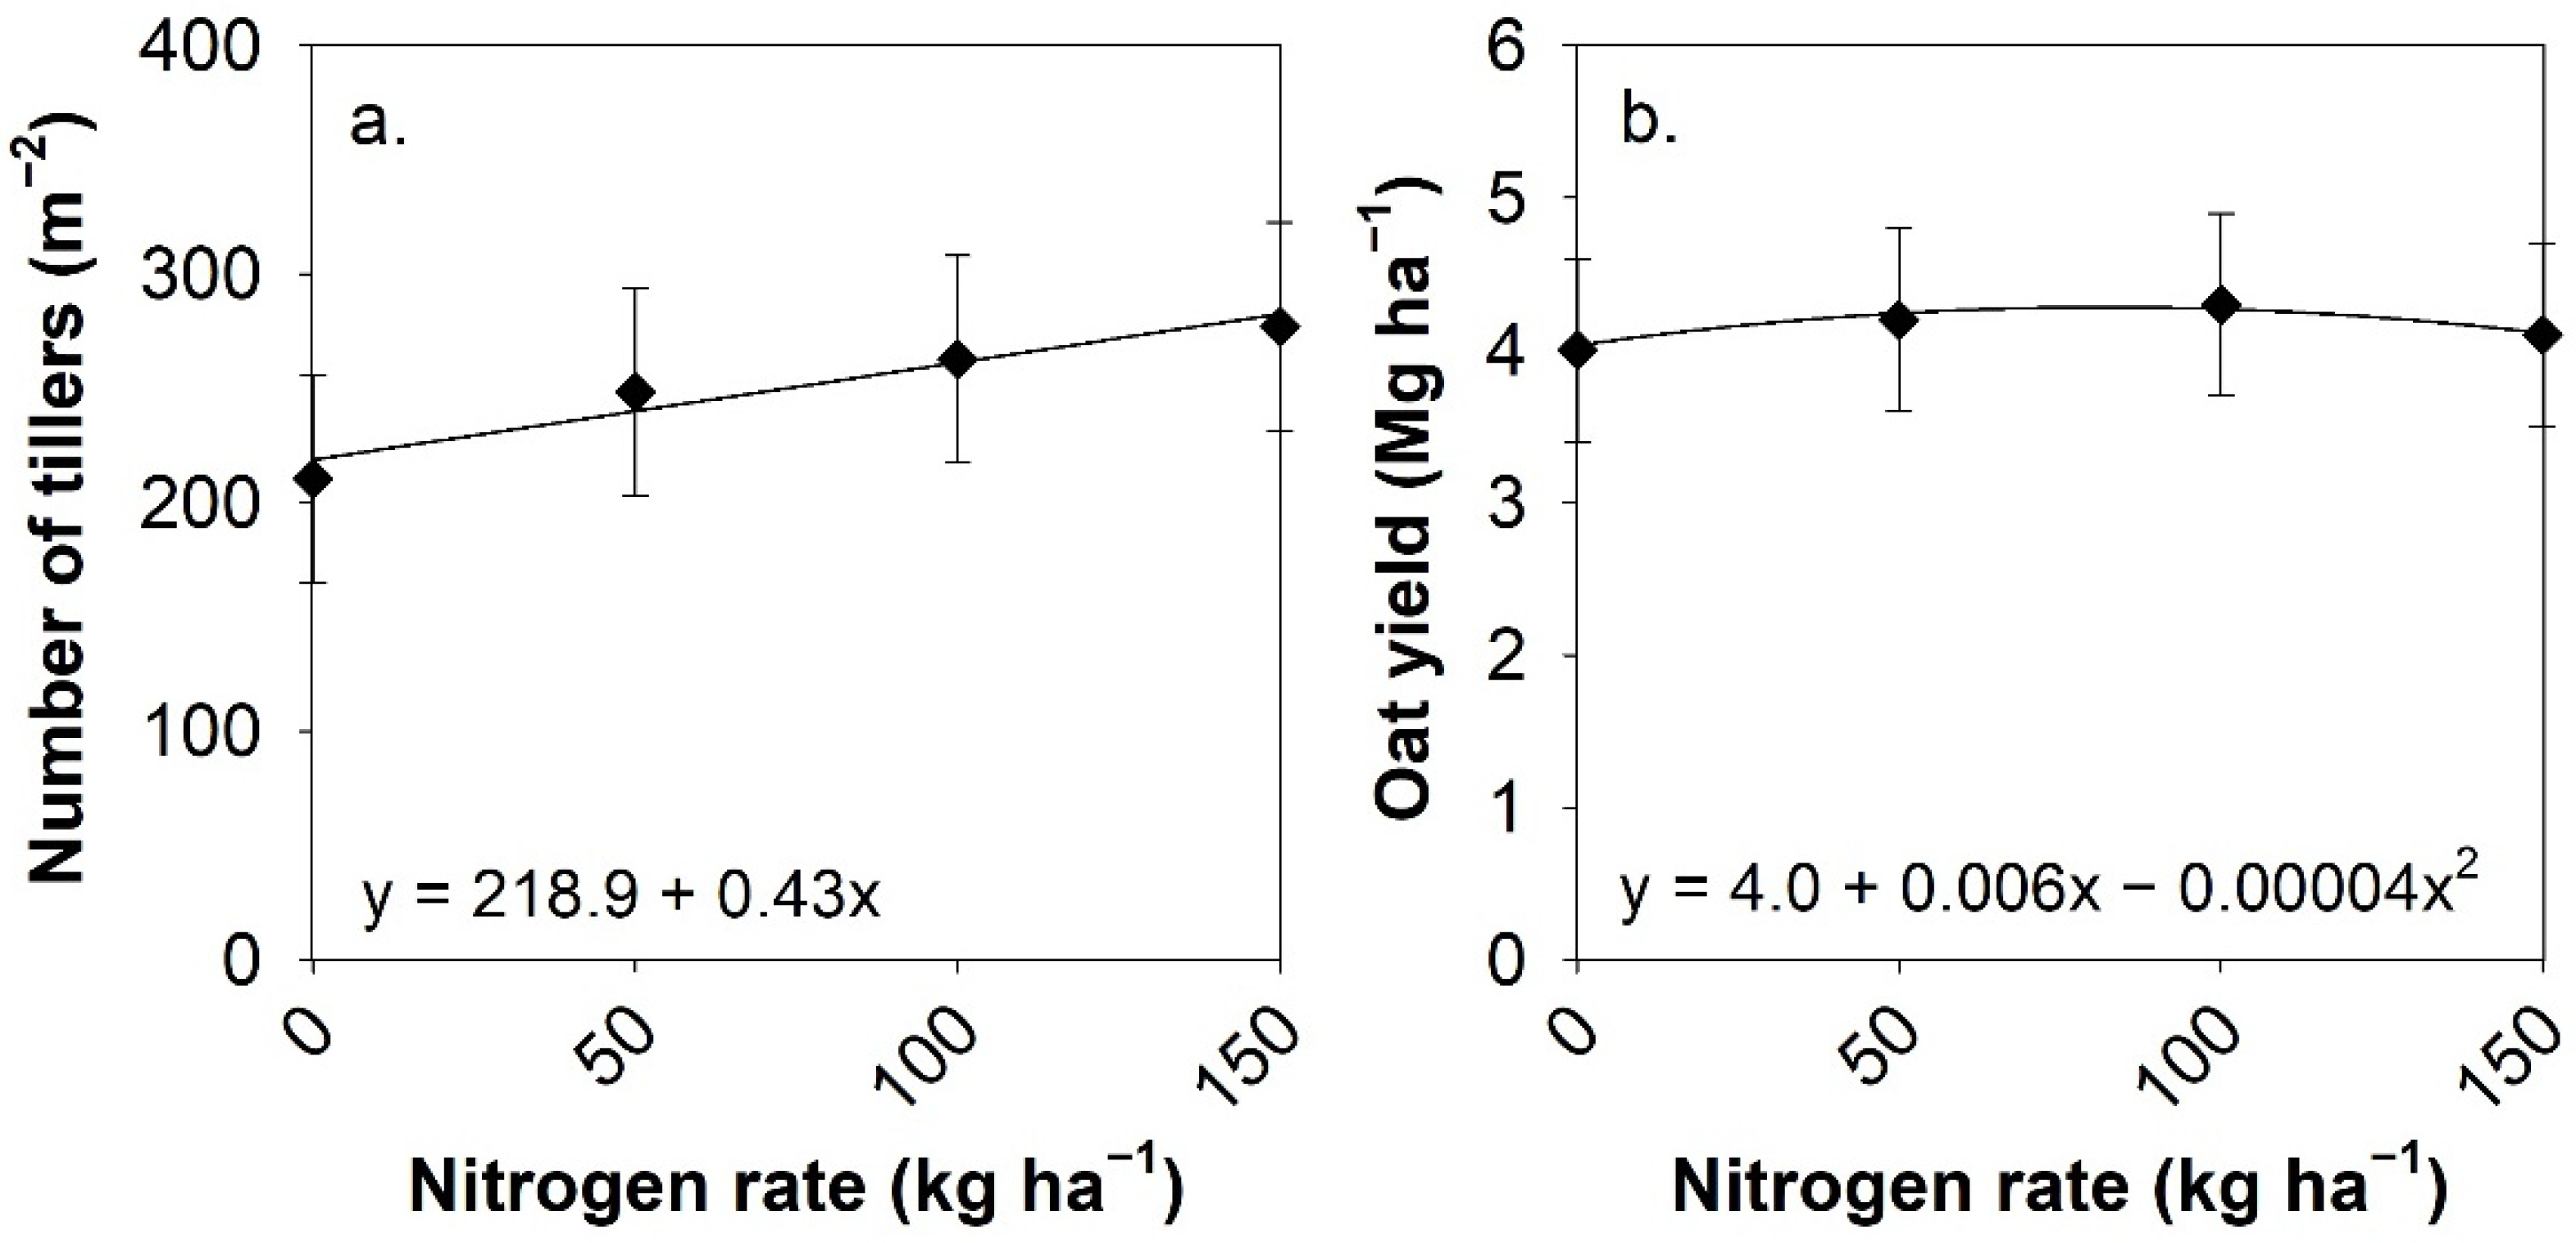
3.2. Plant Population and Tillers per Plant

Variety and seeding rate affected plant population (p < 0.001 for both; Table 3). Early maturing oat, represented by varieties Tack and Saber (in 2015 and 2016, respectively) and late maturing oat (variety Deon) had similar plant population across both years while the medium maturing oat (variety Shelby) had the highest plant population per square meter. The higher seeding rate increased plant population by 17% compared to the low seeding rate (316.4 and 269.9 plants m−2, respectively).
Ideal plant population for oat in Minnesota ranges from 300 to 325 plants m−2 [39]. Only the high seeding rate (145 kg oat ha−1) reached this ideal plant density reliably. Of the different maturity groups, the late and early maturity oats were approximately 13% below the low end of the ideal range while the medium maturity oat was 19% above the top end of the range. On the other hand, Weisberger et al. [2] reported lower plant population for oat in an organic system in Iowa, ranging from 122 to 244 plants m−2. Plant population was 25 to 43% below the targeted planting density in that study and may have been a result of underestimated oat stand loss [2]. Differences between varieties in the current study may have also been due to differing field stand loss percentages, though this was not evaluated. It is also possible that the different varieties had varying kernel weights, which resulted in differing number of seeds planted between species [39].
Oat tillering ranged from 210.5 to 277.0 tillers m−2 and responded linearly to increasing N rate (p = 0.009, Figure 2). For every 50 kg N ha−1 applied, the number of tillers increased by 21.5 per square meter. Others have also found that tillering is affected by increased fertility. Ahmad et al. [40] reported that there were 277 tillers m−2 in the no-fertilizer control while tillering in the manured plots ranged from 290 to 320 tillers m−2, which is well within the range of the current study. Bilal et al. [41] also found increased tillering with increased N application rates, but the number of tillers per square meter ranged from 512 to 627 which is higher than what was found in the current study. On the other hand, Reeves and Sraon [42] reported that oat variety played a role in tillering as well, though that was not found with the varieties used in this study, despite the use of different maturity groups.

3.3. Grain Yield

Oat grain yield was influenced by oat variety and N rate (p < 0.001 for both; Table 3 and Figure 2, respectively). The late maturing variety Deon yielded approximately 19% higher than the early maturing varieties (Tack/Saber) and 27% higher than the medium maturing variety Shelby. The early maturity group outyielded the medium maturity group by approximately 7%. These same trends were seen in the Minnesota Agricultural Experiment Station oat field trials during the same years at SWROC, with oat yield averaging 6.6, 5.2, and 4.5 Mg ha−1 for Deon, Saber, and Shelby, respectively [43]. These trials were conducted under conventional production practices, however, and yielded approximately 23% higher than the current study. This is typical for the region as others have reported that conventionally produced oats yielded 19 to 27% more than organically produced oats [44,45]. Compared to other studies in organic systems, oat grain yield in this study was comparable or slightly higher. On organically managed cropland in Iowa, Weisberger et al. [2] reported yield ranging from 1.3 to 3.3 Mg ha−1 from 2015 to 2016, though oat was interseeded with alfalfa and oat yield may have been reduced due to the added competition for resources. Organic oat trials across Minnesota, South Dakota, and Wisconsin in 2017 and 2018 yielded from 1.5 to 3.0 and from 2.0 to 4.2 Mg ha−1 for varieties Shelby and Deon, respectively [46].
The relationship between N rate and grain yield was non-linear and a quadratic response was fit (Figure 2). The optimal N rate was 82.3 kg N ha−1 with a maximum yield of 4.3 Mg ha−1. This is well within the optimal N range of many conventional oat production studies, which ranged from 30 to 101 kg N ha−1 [25,26,47,48,49,50,51]. At higher N rates, yield was reduced. Others have reported that excessive N rates also reduced oat yield in their trials [14,26,48], though it was often due to increased lodging which was not observed in this study. In contrast, others have reported linear or curvilinear responses to N [15,26,50], though it is possible that excessive N rates were not applied and effects were not able to be determined.
There is limited information regarding the effect of N rate or nutrient source in organic oat production systems. In a conventional system in Manitoba, Canada where liquid swine manure was applied at several rates, yield ranged from 1.4 to 4.3 Mg ha−1 and was impacted by N application rate in three of four years [52]. The authors suggested the oat was non-responsive in years when pre-plant soil N levels were high [52]. In our study, the previous crop was alfalfa, which can supply substantial amounts of nitrogen to the following crop [53], so it was surprising that yield was responsive to N rate. The nutrient sources used in this study-beef manure and composted beef manure-supply many nutrients besides N, however, and may have influenced yield, as well. This is why it is important to evaluate grain nutrient concentrations and residual soil nutrient levels post-harvest to better understand these combined factors and their effect on yield.
Interestingly, seeding rate (110 or 145 kg oat ha−1) did not affect oat grain yield in the current study (p = 0.582). Weisberger et al. [2] found that increased seeding rate for organic oat resulted in increased yield in one of two years, though they tested rates from 49 to 119 kg oat ha−1 in the year where the trend was significant. This is below or similar to the low end of the current study. On the other hand, doubling the seeding rate of organic wheat and barley increased yield by approximately 7% in a Canadian study, though simulated weed pressure was a factor in the study and may have played a role in the results [11]. The lack of clear information regarding the effect of seeding rate on yield suggests that some of management practices used for conventionally grown oat may not apply to organically grown oat, further justifying the need for further research on organic oat production.
In oat production, plant population and the number of tillers per plant are traditionally thought of as important determinants of yield [2,40,54]. In the current study, plant population and tillering were negatively related to oat yield (p < 0.001 for both), though the plant population relationship was moderate (r = −0.43) while the tillering relationship to yield was weak (r = −0.20). From Table 3, plant population ranged from 261.1 to 356.8 plants m−2 on average in this study and these results suggest that the lower end of this range was more optimal for oat production. Contrarily, Weisberger et al. [2] found that grain yield was positively related to plant population in one of two years in an organic production system in Iowa, though the plant densities reported in that study (122 to 244 plants m−2) were lower than what was found in the current study and may not have reached an optimal level. More information may be needed to evaluate the target plant population for organic systems as the current recommendation of 300 to 325 plants m−2, based on conventional production practices [39], may be inadequate.

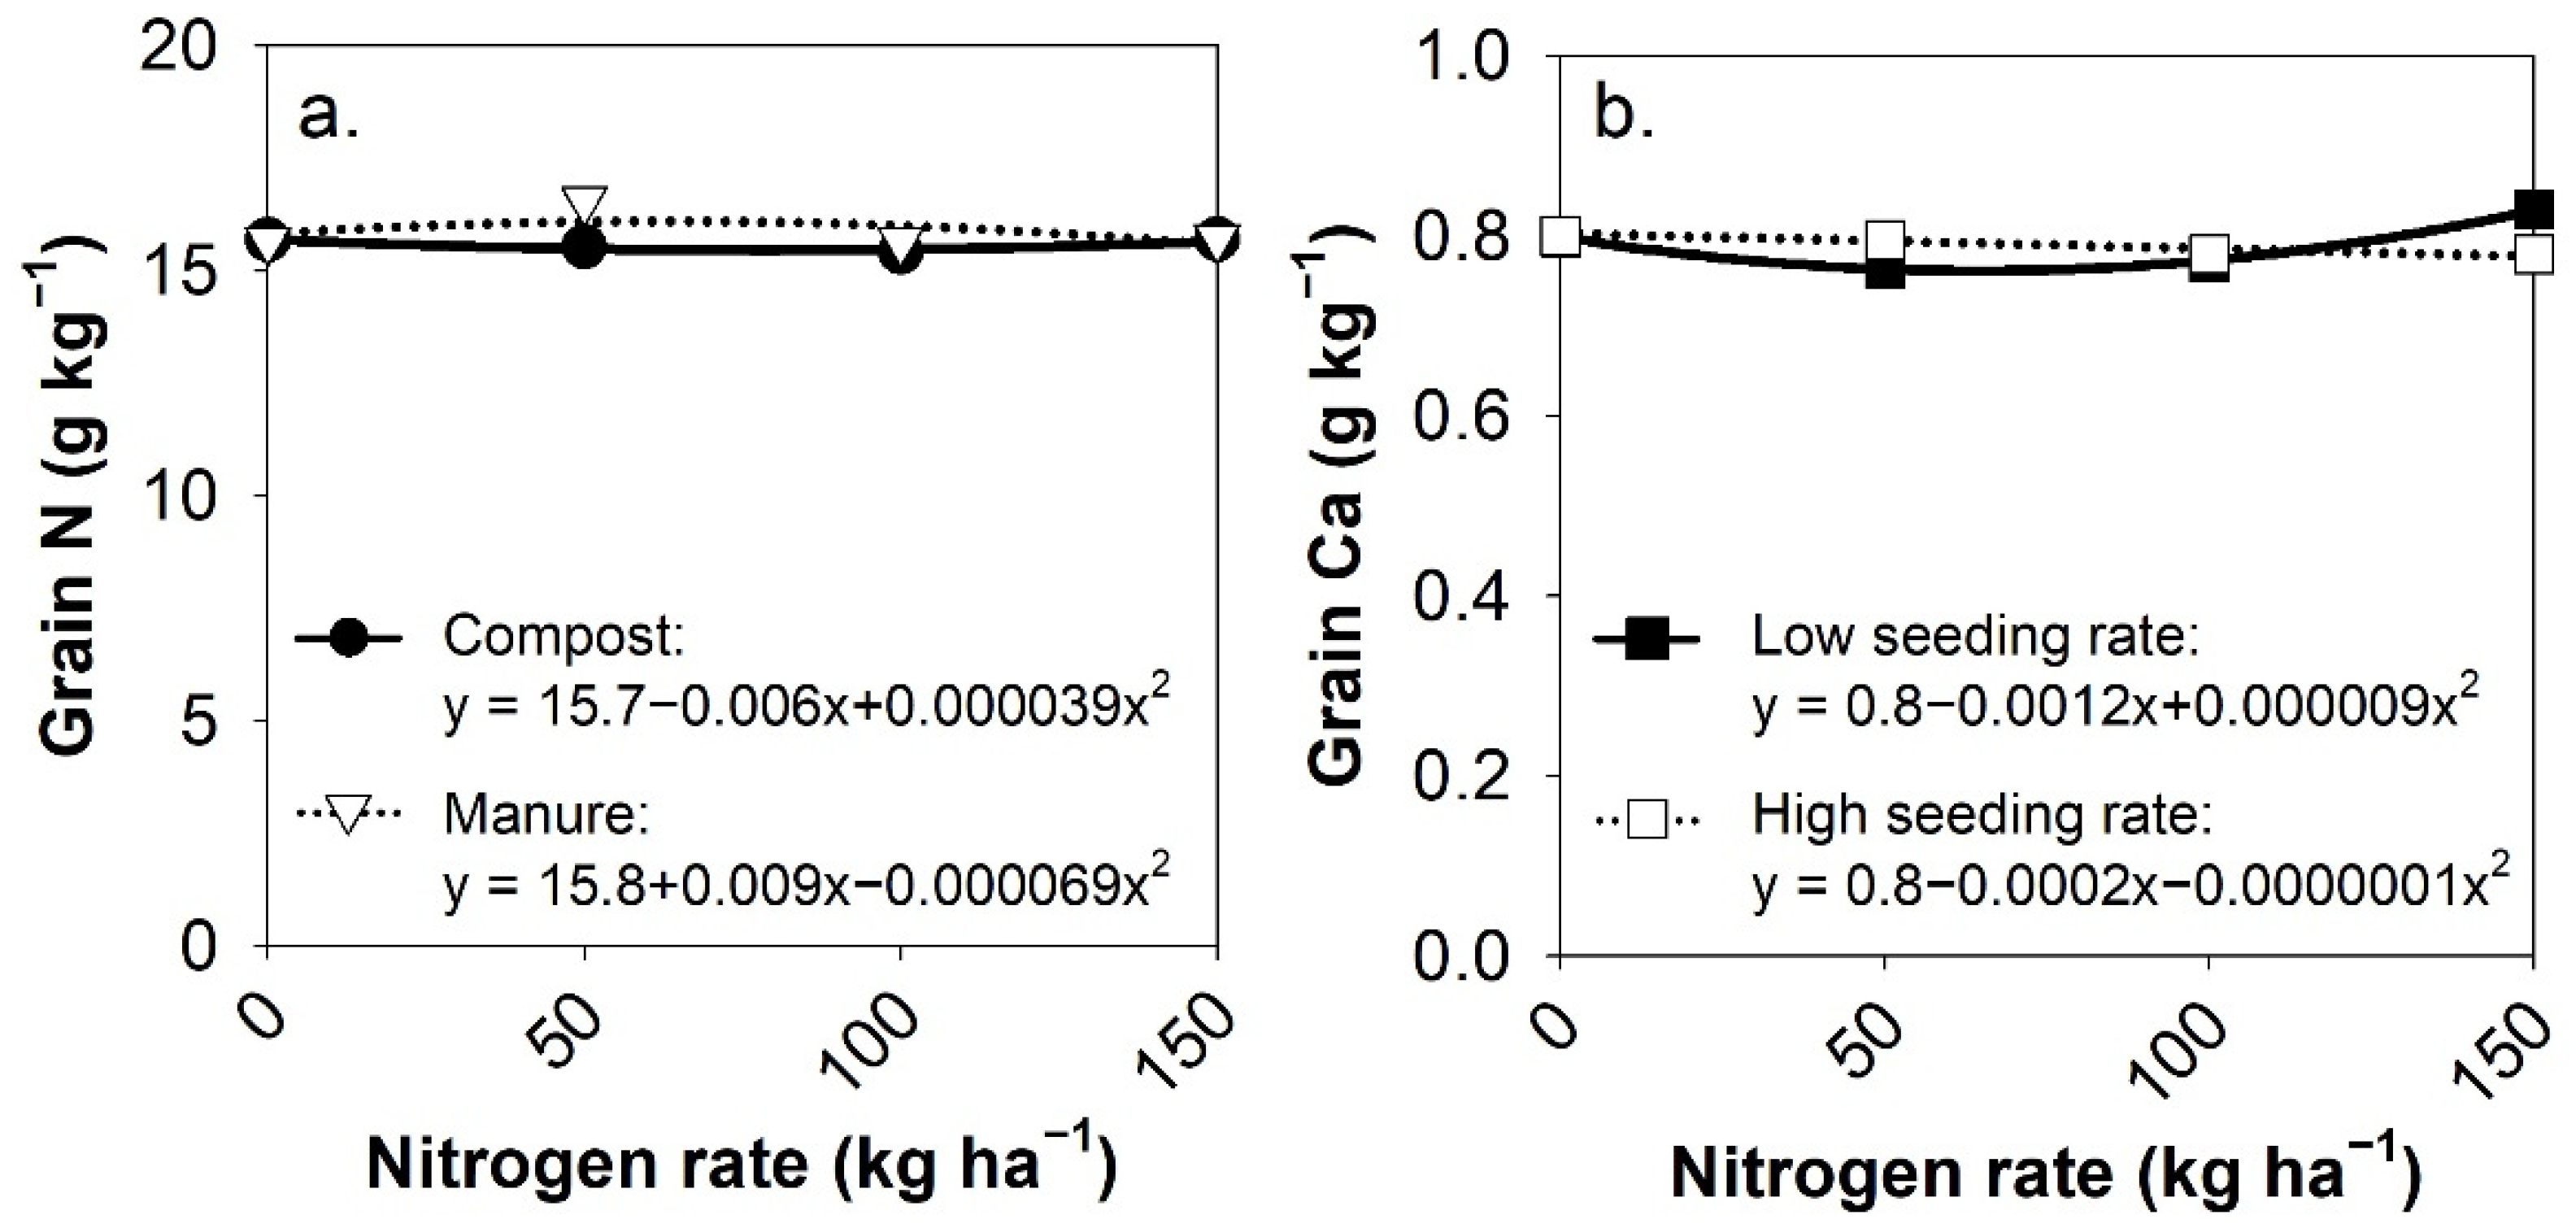
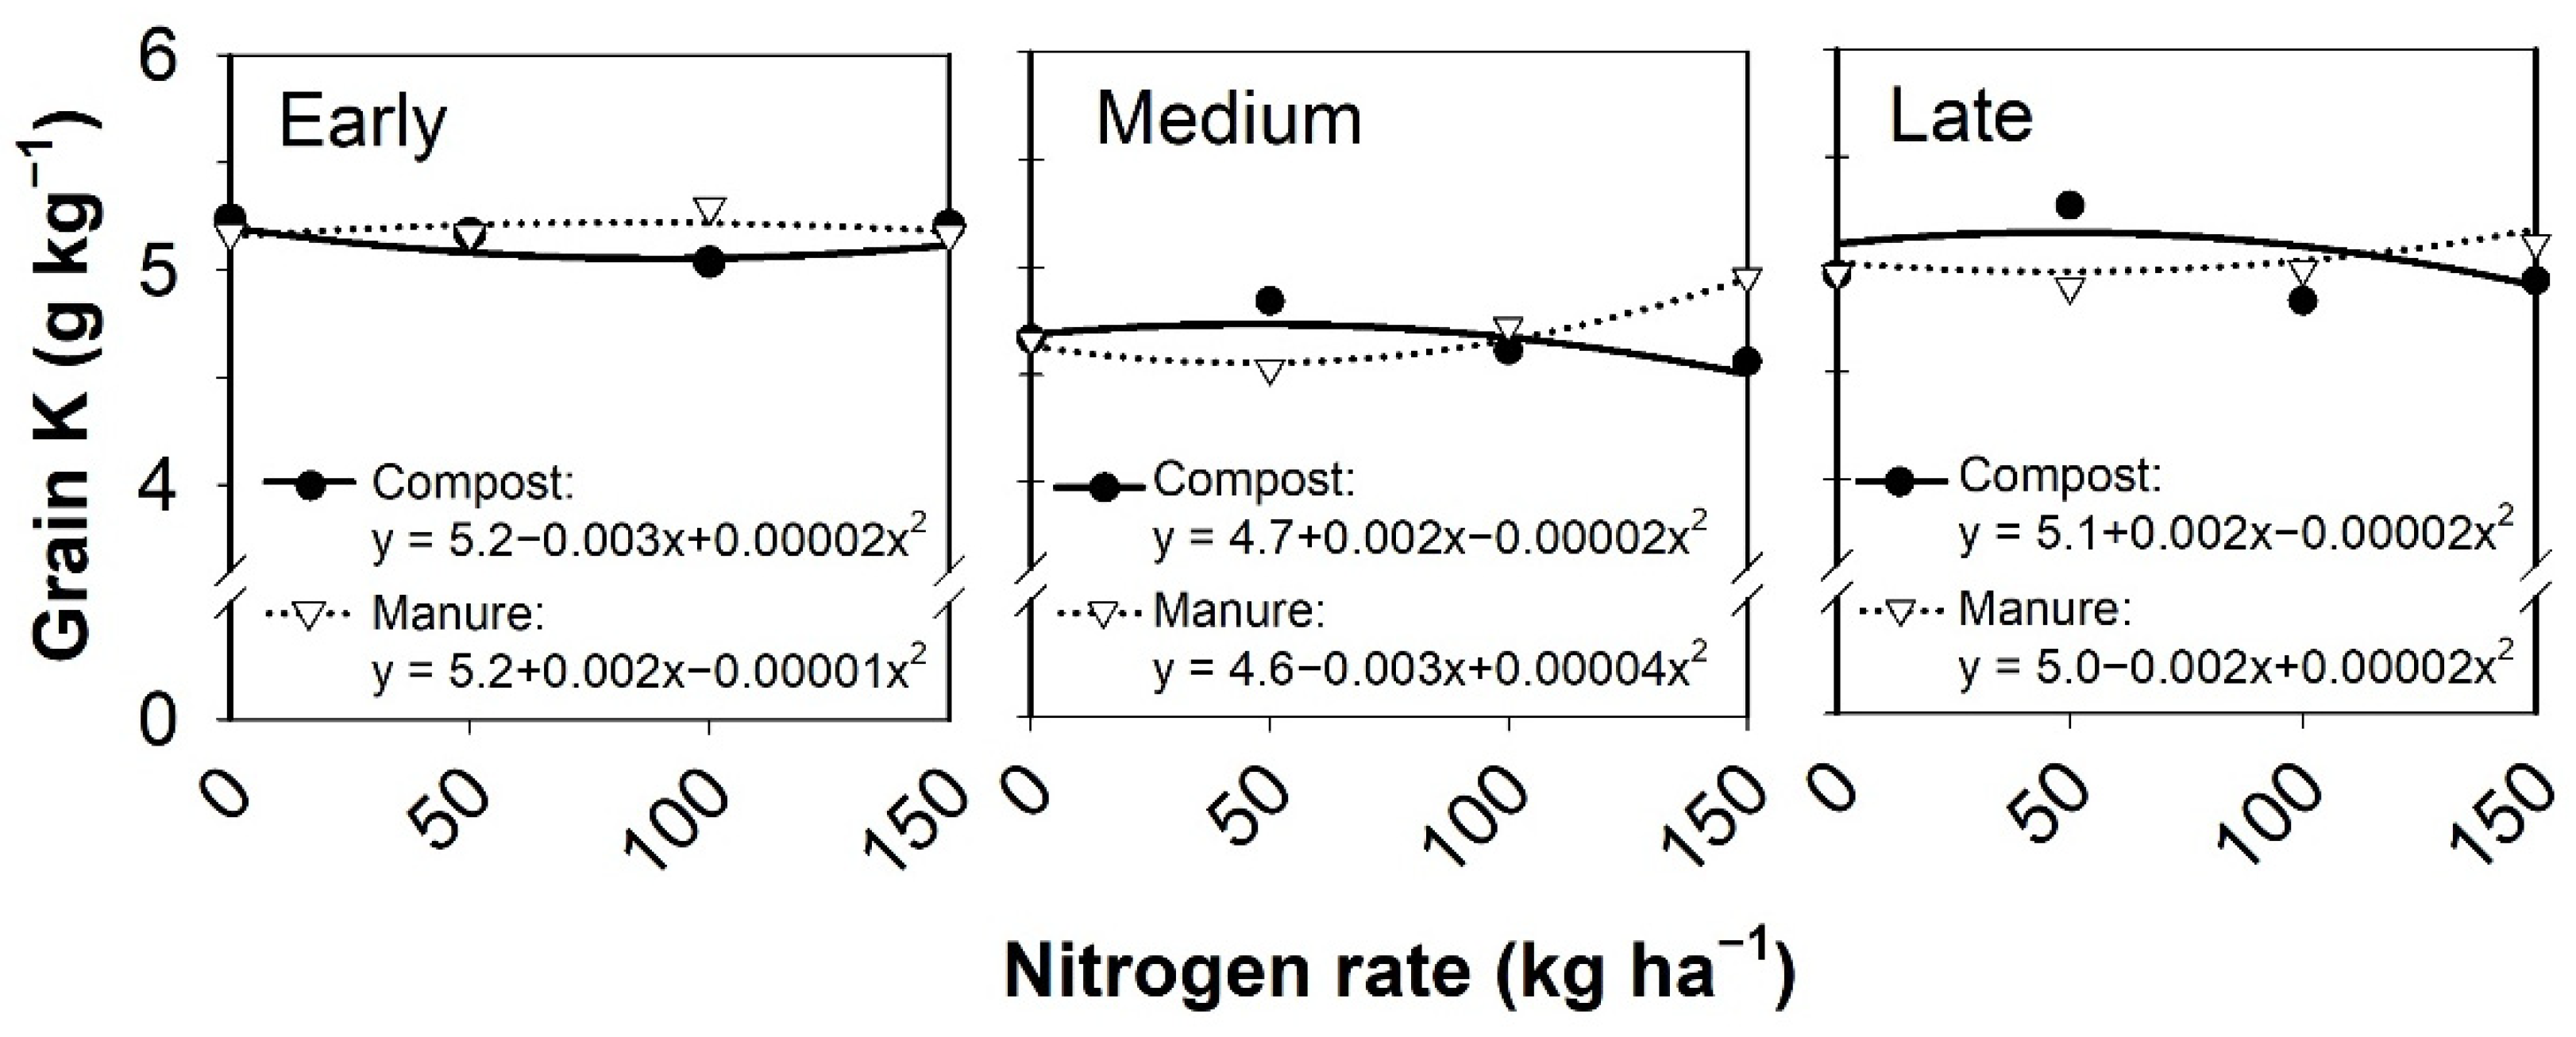
3.4. Grain Nutrient Content

Grain N, Ca, Mg, and S content differed among oat varieties (p = 0.042, < 0.001, 0.032, and 0.001, respectively) but not grain P (p = 0.842). Grain K content was affected by the N rate × variety × seed rate interaction and will be discussed below. Since there is limited information for oat grain nutrient content in the literature, average values were shown in Table 4 for each variety to illustrate ranges that can be expected. In general, the nutrient removal trends were inconsistent across varieties. The early maturing oats (Tack/Saber) had the highest N and Mg contents and were 5 and 4% higher, respectively, than the medium maturity variety Shelby. Grain Mg content for early maturing oat was also 2% higher than late maturing variety Deon, but N and K content were not significantly different. Variety Shelby had the highest Ca content (19% higher than Tack/Saber and 31% higher than Deon) while Deon had the highest S content (approximately 7% higher than both Tack/Saber and Shelby). The difference across varieties, despite receiving the same amount of nutrients within a treatment, indicates that nutrient partitioning is dependent on variety, which may be important in seed selection for food-grade oats.
As mentioned, studies evaluating nutrient uptake in organically produced oat are limited. In Poland, the mineral content of oat was 4.2, 0.41, and 0.87 g kg−1 for K, Ca, and Mg, respectively [55]. In the current study, grain K, Ca, and Mg nutrient content tended to be higher, but may be due to varietal or climatic differences between these regions. In conventional system studies in Canada, oat grain N and P content ranged from 14.1 to 21.7 g N kg−1 and 2.4 to 3.3 g P kg−1 [52,56]. Malhi et al. [56] also reported a consistent grain K concentration of 4.5 g K kg−1, while S content ranged from 2.2 to 2.3 g S kg−1 across two years of study. Grain N content in the current study was within the range of the conventional oat trials, while grain P and K levels trended higher and grain S was lower than these studies. This may be due to the higher P and K application rates from the raw and composted beef manures that were applied based on N needs of the crop in this study (Table 2) while the conventional studies were able to tailor fertilizer applications to crop needs.
Grain N and Ca contents were also affected by the N rate × source interaction and the N rate × seeding rate interaction, respectively, and quadratic models were the best fit for this response. For grain N content, both the linear and quadratic coefficients were found to be significantly different between composted and raw beef manure (p = 0.050 and 0.026, respectively; Figure 3). According to the model for composted manure, grain N tended to decrease initially until an application rate of 78.5 kg N ha−1, then it increased through the highest application rate. On the other hand, when raw manure was applied, grain N increased initially until 62.8 kg N ha−1 was applied and then decreased through the highest N application rates. For grain Ca content, only the quadratic coefficient was found to be significantly different while the linear coefficient was not significant (p = 0.016 and 0.089, respectively; Figure 3). For both grain N and Ca content, the linear and quadratic coefficients were near zero, however, regardless of source or seeding rate. From a biological standpoint, this indicates that the interactions were not meaningful. In all cases, the amounts of N and Ca were still within a range that could be considered adequate based on the limited data available in the literature.
Grain P was not affected by any of the tested variables in this study, indicating it was consistent across N application rate and source, seeding rate, and variety. This was surprising considering that almost 200% more P was applied between the lowest and highest N application rates (not including the 0 N; Table 2) and that the different varieties tended have different nutrient contents for the other primary and secondary nutrients. Initial soil test P levels were in the low range from 6 to 10 mg P kg−1 (Table 1), and University of Minnesota Extension guidelines suggested oat would likely respond to 17 to 20 kg P ha−1 [57], though these guidelines are based on conventional production systems. Since grain P uptake was unresponsive to additions of P, the soil supply was likely sufficient under the conditions of this study. This was in contract to findings of Buckley et al. [52] where increased N rate decreased P grain content. Phosphorus application rates were kept constant across plots in that study, however, which is not what happened in the current study.
Grain K content was affected by the N rate × variety × source interaction and the relationships with N rate were fit with quadratic equations. Only the quadratic coefficient was found to be significantly different between variety and nutrient source while the linear coefficient was not significant (p = 0.043 and 0.134, respectively; Figure 4). The t-test comparisons showed that there was a difference in the N rate response to compost and manure in the medium maturing variety Shelby, but not for the other two maturity groups. Generally, Shelby grain K content was 8% higher with the composted manure when 50 kg N ha−1 was applied, but at the 150 kg N ha−1 application rate, grain K content was 7% higher for the raw manure plots. Figure 4 indicates that there were varietal differences in grain K content, which is confirmed by the significance of the simple effects test for variety (p = 0.013; Table 4). Grain K content for the early maturing oat (Tack/Saber) was 10% higher than the medium maturing variety Shelby, while late maturing variety Deon did not differ from the other varieties. As discussed earlier, these results could be applicable to producers growing oat for the food-grade market where nutrient profiles may be important.
The relationships between yield and grain nutrient concentrations were evaluated using correlation analysis. Grain N content was not related to yield (p = 0.482), while grain P, Mg, and S were moderately positively correlated (p < 0.001 for all; r = 0.42, 0.66, and 0.63, respectively) and K was strongly positively correlated (p < 0.001; r = 0.73). A positive relationship indicates that nutrient concentration increased as grain yield increased. Interestingly, grain Ca content was moderately negatively correlated with yield (p < 0.001; r = −0.43), indicating that grain Ca was reduced as yield increased, likely due to a dilution effect resulting from higher yields with no need for additional Ca above a certain threshold. The lack of a significant correlation between grain yield and N concentration was not expected since there was a significant non-linear grain yield response to N application rate (p < 0.001, Figure 2b). This finding paired with earlier results that grain N content was not meaningfully related to N application rate, however, reinforces that soil N levels may have been sufficient in this study due to the previous alfalfa crop. It appears that applied N was not as much of an influence on yield as the other nutrients applied with manure or compost.

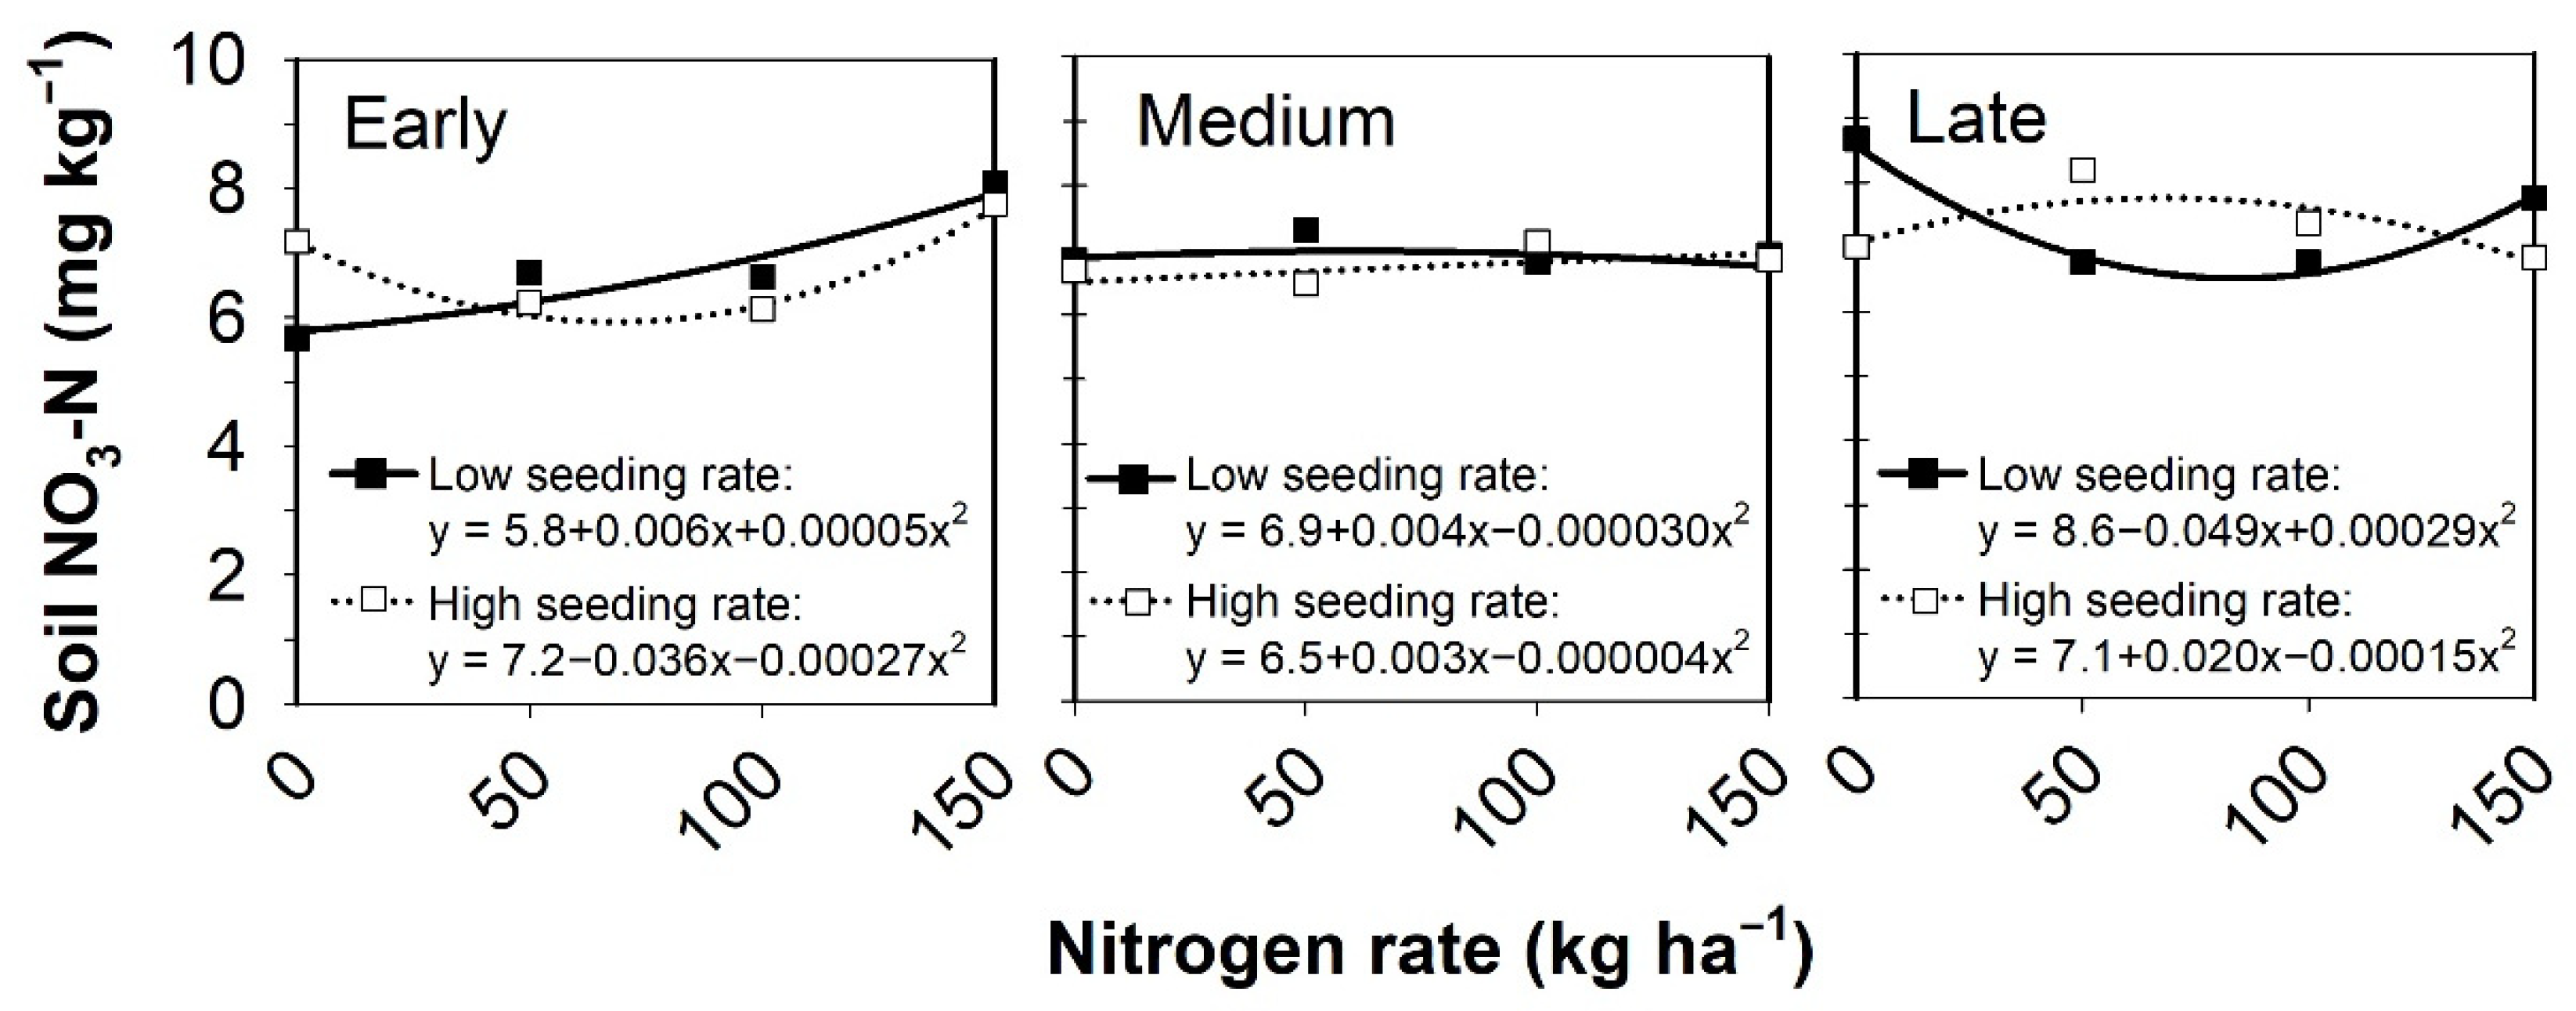
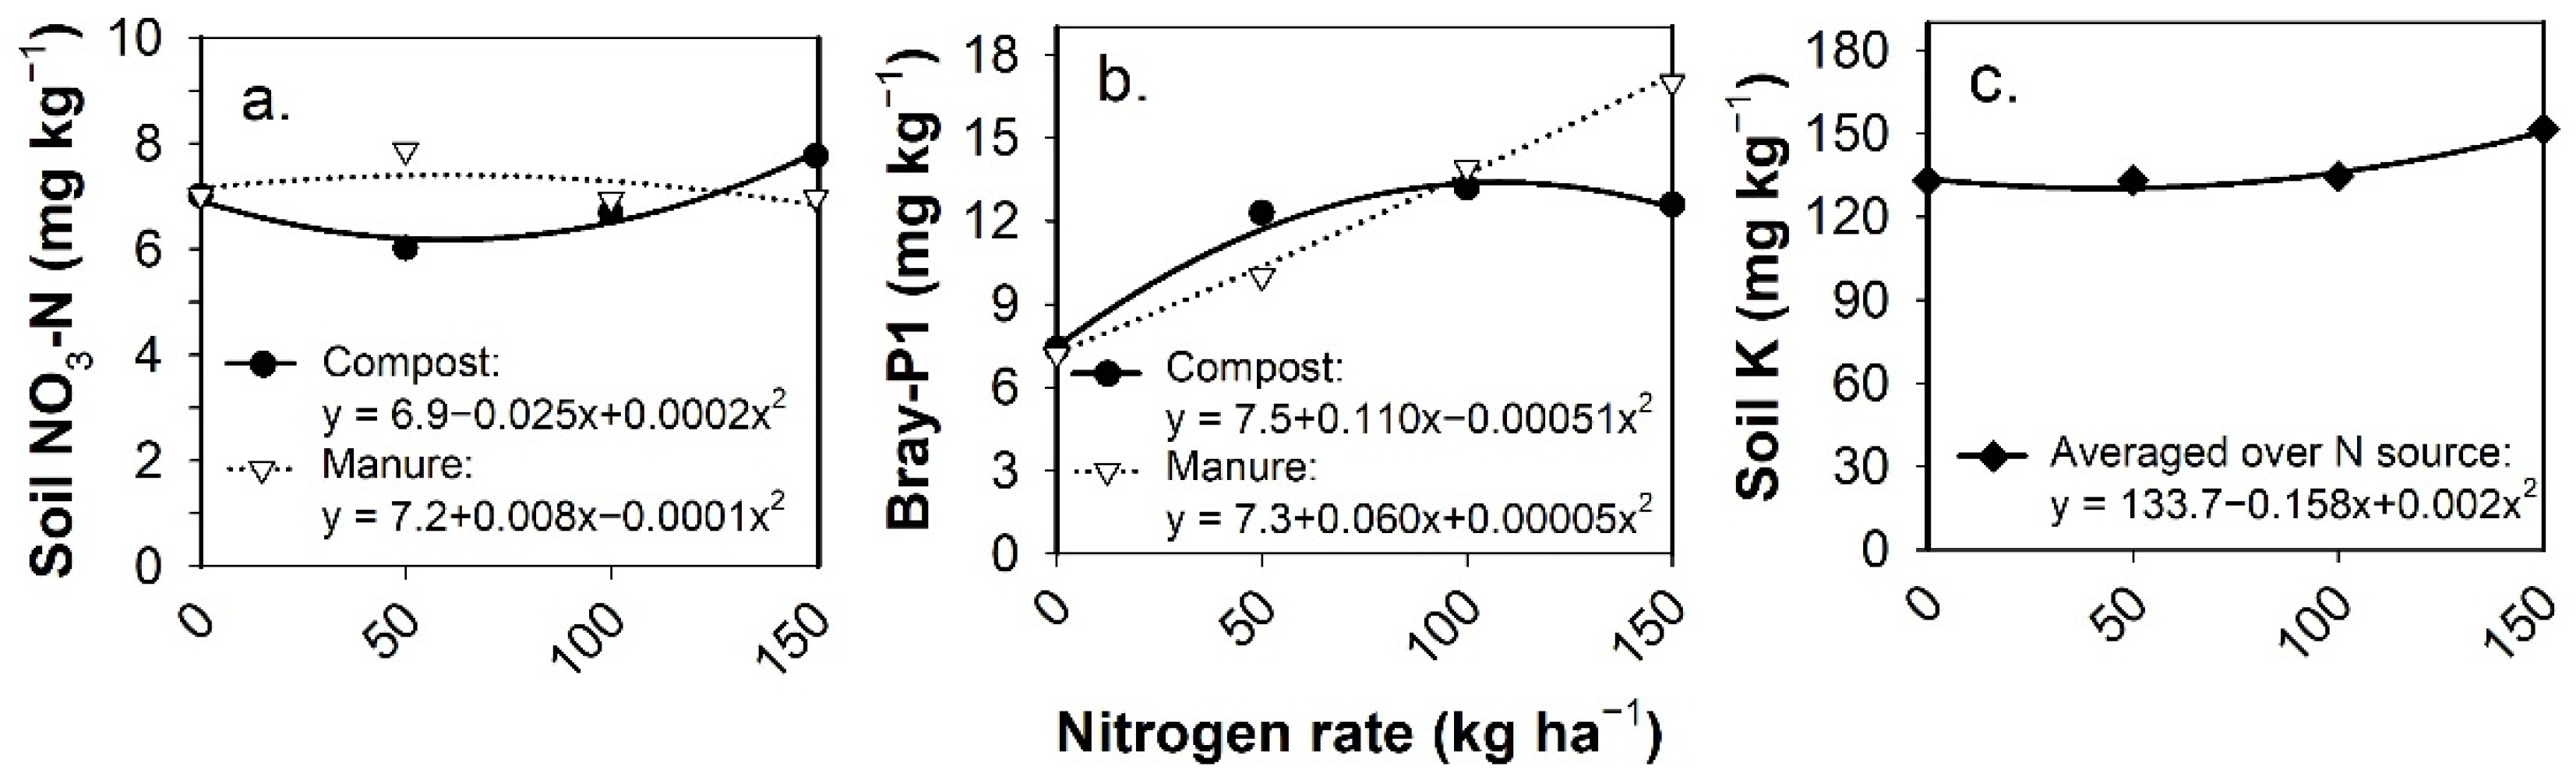
3.5. Post-Harvest Residual Soil Nutrients

Monitoring soil nutrient status after crop harvest is a tool for assessing nutrient management during the previous season and can also be used to help determine nutrient needs for the following crop. This is particularly true in manured systems, composted or raw, where nutrient inputs may not match crop needs [30,58] and it may take several cropping seasons to utilize the full amount of nutrients applied. This is particularly a challenge for organic production systems that utilize organic nutrient sources frequently to supply full nitrogen needs of the crops [59]. In the current study, post-harvest residual soil samples were collected in the 0 to 15 cm soil layer to monitor nitrate, Bray P-1, and K levels.
Soil nitrate test levels averaged less than 10 kg ha−1, which is considered fairly low at the end of the growing season, likely due to the wet conditions in 2015 and 2016. In a conventional production system that used chemical fertilizers, Ochsner et al. [60] found that soil nitrate levels in the top 0 to 15 cm were less than 10 kg ha−1 following corn, soybean, or kura clover (Trifolium ambiguum) in a wet year, but greater than 40 kg ha−1 following corn and soybean in a dry year. Similarly, Pfarr et al. [61] reported less than 10 kg ha−1 following corn fertilized with manure or chemical fertilizers in two wet years. Nitrate levels were higher at deeper depths, indicating nitrate leaching from the top layer of soil had occurred [61].
Despite the low soil nitrate levels, there were N rate × source and N rate × variety × seeding rate interactions and quadratic models were found to have the best fit to describe each relationship (Figure 5 and Figure 6). For the N rate × variety × seeding rate interaction, the linear and quadratic coefficients were found to be significantly different between variety and seeding rate (p = 0.009 and 0.016, respectively) and a similar trend was found for the N rate × source interaction between nutrient sources (p = 0.029 and 0.005, respectively). Differences in N response to seeding rate in the early and late maturing varieties, but not the medium maturing variety appeared to be primarily driven by variability in soil nitrate concentration in the 0 N treatments (Figure 5). For example, the 0 N treatment had the highest (8.7 mg kg−1) and also the lowest (5.7 mg kg−1) soil nitrate levels observed in the post-harvest soil samples. This was not the case for the N rate × nutrient source interaction, however, where the 0 N soil nitrate levels were similar between compost and raw manure (Figure 6). The interaction was due to increased soil nitrate at the lower N application rate for raw manure while composted manure had higher soil nitrate at the higher application rate.
Grain N content was also affected by the N rate × nutrient source interaction so the relationship between grain N content and soil nitrate was evaluated with correlation analysis. Overall, there was a weak, positive correlation between grain N and soil N concentration (p < 0.001, r = 0.192), though the relationship was stronger (but still weak) in the compost plots and non-significant in the manure plots (p < 0.001, r = 0.332 and p = 0.307, respectively). This is likely due to the slow release nature of compost when it comes to nutrients [30,62,63], allowing oat to take up N longer through the growing season and increasing residual soil nitrate after harvest. In the raw manure plots, nitrate likely leached to lower soil layers due to the wetter-than-normal growing conditions during this study. Deeper soil samples are recommended for future studies to better understand soil nitrate within the root zone.
Soil test P behavior changed based on N application rate and whether manure or compost was the fertility source (p = 0.015, Figure 6). Beef manure resulted in a quadratic increase in soil test P, whereas composted manure showed an initial increase in soil test P with the first application rate, but no further increases in soil test P were observed with higher compost rate. Generally, compared with the 0 N rate, the highest application rate increased soil test P by 71% with composted manure and 138% with raw manure. According to the University of Minnesota Extension [57], the soil test P levels after manure application went from a “low” classification to “medium” when 100 kg N ha−1 was applied or “high” when 150 kg N ha−1 was applied. In contrast, soil test P levels after composted manure was applied were raised to a “medium” category regardless of application rate. Pagliari and Laboski [64] have shown that composting can change the mineral composition of P in manure, and as a result, impact the effects of composted manure on soil test P. Raw manure has higher amounts of inorganic P than composted manure and manures with higher inorganic P content will increase soil test P more effectively than composted manure with lower inorganic P content [64,65,66]. The buildup of soil test P, especially in such a short time frame, is concerning. As soil test P levels increase beyond agronomic crop needs, reports have shown increased edge-of-field and leaching losses [67,68,69], which may end up in drainage tiles and surface water leading to nuisance or harmful algal blooms [70].
The post-harvest soil samples indicated that soil test K was significantly affected by N rate (p < 0.001, Figure 6) and a quadratic model was fit. According to the model, soil test K levels began to increase when 44 kg N ha−1 was applied. As with quadratic models, the increase was slow at first but increased more rapidly at the higher N application rates. There was a 14% difference between the 0 and 150 kg N ha−1 application rates. Overall, soil test K levels remained in the high range (121 to 160 mg kg−1) [57], regardless of application rate, though they shifted from the low end of the range to the high end with higher application rates. At the high range, the addition of K is not likely to result in a yield increase for most crops [71]. On the other hand, forages grown on soils with high levels of K can cause Mg deficiencies in cattle (a condition called grass tetany), so it is in the interest of organic producers to monitor soil test K levels [72]. Unlike soil test nitrate and Bray P-1, there was no N rate source effect × interaction (p = 0.174), suggesting that the effect on soil test K by both fertility sources where the same. Potassium availability for plant uptake in composted and raw manure is considered to be similar, unlike N and P availability [62], and explains why soil test K levels did not differ between sources.

4. Conclusions

There is little information regarding organic oat production in the literature, particularly as it relates to nutrient management, variety, and seeding rate. This study found that variety selection continues to play a large role in yield potential, especially in organic production systems, though seeding rate did not. Variety Deon, a late maturing variety, tended to outperform the other varieties, particularly the medium maturity variety Shelby. On the other hand, the early maturing varieties Tack and Saber tended to have higher nutrient contents, which may be important for food-grade oat producers.
Nutrient application rates, which were based on the N content of raw or composted beef manure, influenced yield and in some cases grain nutrient content. Yield was optimized at 82.3 kg N ha−1, regardless of nutrient source. However, this affect did not appear to be driven by the N content of either nutrient source, likely because oat was grown after alfalfa, a legume that provides ample N to the following crop. This also likely masked differences in N availability from the two nutrient sources, so caution should be used if attempting to extend these results to oat production that does not follow a legume. Monitoring soil nutrients throughout the growing season in the future may provide insight into nutrient release and timing from the different sources.

Supplementary Materials

The following are available online at https://www.mdpi.com/article/10.3390/agronomy11071418/s1, Table S1: A summary of P > F values for main effects and interactions for grain yield, plant population, number of tillers, grain nutrient content, and post-harvest soil (0 to 15 cm) nutrient contents for the organic oat trial conducted near Lamberton, MN in 2015 and 2016.

Author Contributions

Conceptualization, P.H.P., E.E.E. and L.K.; methodology, P.H.P.; formal analysis, E.E.E. and L.K.; data curation, P.H.P. and M.L.W.; writing—original draft preparation, P.H.P. and M.L.W.; writing—review and editing, P.H.P. and M.L.W.; visualization, M.L.W.; supervision, P.H.P.; project administration, P.H.P.; funding acquisition, P.H.P. All authors have read and agreed to the published version of the manuscript.

Funding

This research was funded by Grain Millers, Inc.

Institutional Review Board Statement

Not applicable.

Informed Consent Statement

Not applicable.

Data Availability Statement

Data from this research can be made available by the corresponding authors upon request.

Conflicts of Interest

The authors declare no conflict of interest. The funders had no role in the design of the study; in the collection, analyses, or interpretation of data; in the writing of the manuscript, or in the decision to publish the results.

References

  1. McBride, W.D.; Greene, C. The Profitability of Organic Soybean Production. Renew. Agric. Food Syst. 2009, 24, 276–284. [Google Scholar] [CrossRef] [Green Version]
  2. Weisberger, D.A.; Wiedenhoeft, M.H.; Smith, M.A.; Liebman, M.Z. Balancing Objectives in an Organic Oat Rotation Year: Implications of Planting Date and Crop Density. Agron. J. 2019, 111, 816–825. [Google Scholar] [CrossRef]
  3. Teasdale, J.R.; Mangum, R.W.; Radhakrishnan, J.; Cavigelli, M.A. Weed Seedbank Dynamics in Three Organic Farming Crop Rotations. Agron. J. 2004, 96, 1429–1435. [Google Scholar] [CrossRef]
  4. Nair, A.; Delate, K. Composting, crop rotation, and cover crop practices in organic vegetable production. In Organic Farming for Sustainable Agriculture; Nandwani, D., Ed.; Springer International Publishing: Basel, Switzerland, 2016; pp. 231–257. ISBN 978-3-319-26803-3. [Google Scholar]
  5. Delate, K.; Cambardella, C.A. Agroecosystem Performance during Transition to Certified Organic Grain Production. Agron. J. 2004, 96, 1288. [Google Scholar] [CrossRef]
  6. Delbridge, T.A.; Coulter, J.A.; King, R.P.; Sheaffer, C.C.; Wyse, D.L. Economic Performance of Long-Term Organic and Conventional Cropping Systems in Minnesota. Agron. J. 2011, 103, 1372–1382. [Google Scholar] [CrossRef]
  7. USDA-NASS Certified Organic Survey 2016 Summary; USDA-National Agricultural Statistics Service: Washington, DC, USA, 2017; Available online: https://downloads.usda.library.cornell.edu/usda-esmis/files/zg64tk92g/70795b52w/4m90dz33q/OrganicProduction-09-20-2017_correction.pdf (accessed on 22 September 2020).
  8. MCIA Oats; Minnesota Crop Improvement Association: Saint Paul, MN, USA, 2020; Available online: http://docs.mncia.org/public/website/UMN-Oat-Brochure-2020.pdf (accessed on 23 June 2021).
  9. Delate, K.; Duffy, M.; Chase, C.; Holste, A.; Friedrich, H.; Wantate, N. An Economic Comparison of Organic and Conventional Grain Crops in a Long-Term Agroecological Research (LTAR) Site in Iowa. Am. J. Alternative Agric. 2003, 18, 59–69. [Google Scholar] [CrossRef]
  10. Coleman, P. Guide for Organic Crop Producers; USDA-Agricultural Marketing Service—National Organic Program: Washington, DC, USA, 2012; Available online: https://www.ams.usda.gov/sites/default/files/media/CropProducersGuide.pdf (accessed on 23 June 2021).
  11. Mason, H.; Navabi, A.; Frick, B.; O’Donovan, J.; Spaner, D. Cultivar and Seeding Rate Effects on the Competitive Ability of Spring Cereals Grown under Organic Production in Northern Canada. Agron. J. 2007, 99, 1199–1207. [Google Scholar] [CrossRef]
  12. Olsen, J.M.; Griepentrog, H.-W.; Nielsen, J.; Weiner, J. How Important Are Crop Spatial Pattern and Density for Weed Suppression by Spring Wheat? Weed Sci. 2012, 60, 501–509. [Google Scholar] [CrossRef]
  13. Benaragama, D.; Shirtliffe, S.J. Integrating Cultural and Mechanical Methods for Additive Weed Control in Organic Systems. Agron. J. 2013, 105, 1728–1734. [Google Scholar] [CrossRef]
  14. Ma, B.L.; Biswas, D.K.; Zhou, Q.P.; Ren, C.Z. Comparisons among Cultivars of Wheat, Hulled and Hulless Oats: Effects of N Fertilization on Growth and Yield. Can. J. Plant Sci. 2012, 92, 1213–1222. [Google Scholar] [CrossRef]
  15. Ma, B.L.; Zheng, Z.; Pageau, D.; Vera, C.; Fregeau-Reid, J.; Xue, A.; Yan, W. Nitrogen and Phosphorus Uptake, Yield and Agronomic Traits of Oat Cultivars as Affected by Fertilizer N Rates under Diverse Environments. Nutr. Cycl. Agroecosyst. 2017, 108, 245–265. [Google Scholar] [CrossRef]
  16. Mulder, E.G. Effect of Mineral Nutrition on Lodging of Cereals. Plant Soil 1954, 5, 246–306. [Google Scholar] [CrossRef]
  17. USDA Organic production and handling requirements—§205.203. In Electronic Code of Federal Regulations (eCFR); Part 205—National Organic Program; United Stated Department of Agriculture: Washington, DC, USA, 2020; Available online: https://www.ecfr.gov (accessed on 21 June 2021).
  18. Ahmed, S.; Mickelson, S.; Pederson, C.; Baker, J.; Kanwar, R.; Lorimor, J.; Webber, D. Swine Manure Rate, Timing, and Application Method Effects on Post-Harvest Soil Nutrients, Crop Yield, and Water Quality Implications in a Corn-Soybean Rotation. Trans. ASABE 2013, 56, 395–408. [Google Scholar] [CrossRef]
  19. Eghball, B.; Power, J.F. Phosphorus- and Nitrogen-Based Manure and Compost Applications: Corn Production and Soil Phosphorus. Soil Sci. Soc. Am. J. 1999, 63, 895–901. [Google Scholar] [CrossRef] [Green Version]
  20. Fuerst, E.P.; Koenig, R.T.; Kugler, J.; Painter, K.; Stannard, M.; Goldberg, J. Organic Alfalfa Management Guide; Washington State University Extension: Pullman, WA, USA, 2009; Available online: https://www.nrcs.usda.gov/Internet/FSE_PLANTMATERIALS/publications/wapmcpu10176.pdf (accessed on 23 June 2021).
  21. Yost, M.A.; Coulter, J.A. Managing the Rotation from Alfalfa to Corn. 2018. Available online: https://extension.umn.edu/corn-cropping-systems/managing-rotation-alfalfa-corn (accessed on 6 April 2021).
  22. Jungers, J.M.; Kaiser, D.E.; Lamb, J.F.S.; Lamb, J.A.; Noland, R.L.; Samac, D.A.; Wells, M.S.; Sheaffer, C.C. Potassium Fertilization Affects Alfalfa Forage Yield, Nutritive Value, Root Traits, and Persistence. Agron. J. 2019, 111, 2843–2852. [Google Scholar] [CrossRef]
  23. Schmitt, M.A.; Shaeffer, C.C.; Randall, G.W. Preplant Manure and Commercial P and K Fertilizer Effects on Alfalfa Production. J. Prod. Agric. 1993, 6, 385–390. [Google Scholar] [CrossRef]
  24. Wilson, M. Guidelines for Manure Application Rates. University of Minnesota Extension. 2020. Available online: https://extension.umn.edu/manure-land-application/manure-application-rates (accessed on 21 June 2021).
  25. Marshall, H.G.; Kolb, F.L.; Roth, G.W. Effects of Nitrogen Fertilizer Rate, Seeding Rate, and Row Spacing on Semidwarf and Conventional Height Spring Oat. Crop Sci. 1987, 27, 572–575. [Google Scholar] [CrossRef]
  26. May, W.E.; Mohr, R.M.; Lafond, G.P.; Johnston, A.M.; Stevenson, F.C. Effect of Nitrogen, Seeding Date and Cultivar on Oat Quality and Yield in the Eastern Canadian Prairies. Can. J. Plant Sci. 2004, 84, 1025–1036. [Google Scholar] [CrossRef] [Green Version]
  27. United States Department of Agriculture—Natural Resources Conservation Service Web Soil Survey. Available online: https://www.nrcs.usda.gov/wps/portal/nrcs/detail/soils/survey/?cid=nrcseprd1464818 (accessed on 4 July 2021).
  28. Recommended Chemical Soil Test Procedures for the North Central Region; Brown, J.R. (Ed.) Missouri Agricultural Experiment Station SB 1001: Columbia, MO, USA, 1998; Available online: https://www.canr.msu.edu/uploads/234/68557/rec_chem_soil_test_proce55c.pdf (accessed on 23 June 2021).
  29. Murphy, J.; Riley, J.P. A Modified Single Solution Method for the Determination of Phosphate in Natural Waters. Anal. Chim. Acta 1962, 27, 31–36. [Google Scholar] [CrossRef]
  30. Eghball, B. Nitrogen Mineralization from Field-Applied Beef Cattle Feedlot Manure or Compost. Soil Sci. Soc. Am. J. 2000, 64, 2024–2030. [Google Scholar] [CrossRef]
  31. Peters, J.; Combs, S.; Hoskins, B.; Jarman, J.; Kovar, J.; Watson, M.; Wolf, A.; Wolf, N. Recommended Methods of Manure Analysis; Peters, J., Ed.; University of Wisconsin-Extension: Madison, WI, USA, 2003; Available online: https://cdn.shopify.com/s/files/1/0145/8808/4272/files/A3769.pdf (accessed on 23 June 2021).
  32. Gavlak, R.; Horneck, D.A.; Miller, R.O. Soil, Plant, and Water Reference Methods for the Western Region, 3rd ed.; Western Rural Development Cente: Corvallis, OR, USA, 2005; 207p. [Google Scholar]
  33. Doane, T.A.; Horwáth, W.R. Spectrophotometric Determination of Nitrate with a Single Reagent. Anal. Lett. 2003, 36, 2713–2722. [Google Scholar] [CrossRef]
  34. SAS Institute Inc. SAS/STAT® 14.2 User’s Guide; SAS Institute Inc.: Cary, NC, USA, 2016; Available online: https://documentation.sas.com/doc/en/statcdc/14.2/statug/titlepage.htm (accessed on 23 June 2021).
  35. Littell, R.C.; Milliken, G.A.; Stroup, W.W.; Wolfinger, R.D.; Schabenberger, O. SAS for Mixed Models, 2nd ed.; SAS Institute: Cary, NC, USA, 2007; ISBN 978-1-59994-078-6. [Google Scholar]
  36. Kim, T.K. T Test as a Parametric Statistic. Korean J. Anesth. 2015, 68, 540–546. [Google Scholar] [CrossRef] [Green Version]
  37. Schober, P.; Boer, C.; Schwarte, L.A. Correlation Coefficients: Appropriate Use and Interpretation. Anesth. Analg. 2018, 126, 1763–1768. [Google Scholar] [CrossRef] [PubMed]
  38. Sorrells, M.E.; Simmons, S.R. Influence of environment on the development and adaptation of oat. In Oat Science and Technology; American Society of Agronomy, Inc. and Crop Science Society of America, Inc.: Madison, WI, USA, 1992; pp. 115–163. ISBN 978-0-89118-225-2. [Google Scholar]
  39. Wiersma, J.; Ransom, J.; Hofman, V. Seeding Rate for Small Grains. 2018. Available online: https://extension.umn.edu/planting-small-grains/seeding-rate-small-grains (accessed on 2 January 2021).
  40. Ahmad, A.H.; Wahid, A.; Khalidg, F.; Fiaz, N.; Zamir, M.S.I. Impact of Organic and Inorganic Sources of Nitrogen and Phosphorus Fertilizers on Growth, Yield and Quality of Forage Oat (Avena sativa L.). Cercet. Agron. Mold. 2011, 44, 39–49. [Google Scholar] [CrossRef] [Green Version]
  41. Bilal, M.; Ayub, M.; Tariq, M.; Tahir, M.; Nadeem, M.A. Dry Matter Yield and Forage Quality Traits of Oat (Avena Sativa L.) under Integrative Use of Microbial and Synthetic Source of Nitrogen. J. Saudi Soc. Agric. Sci. 2017, 16, 236–241. [Google Scholar] [CrossRef] [Green Version]
  42. Reeves, D.L.; Sraon, H.S. How an oat plant develops. In Research Bulletins of the South Dakota Agricultural Experiment Station (1887–2011); South Dakota Agricultural Experiment Station, South Dakota State University: Brookings, SD, USA, 1976; p. 15. [Google Scholar]
  43. Wiersma, J.; Dill-Macky, R.; Rines, H.; Tiede, T.; Smith, K. 2016 Oat Field Crop Trials Results; Minnesota Agricultural Experiment Station: Saint Paul, MN, USA, 2016; Available online: https://www.maes.umn.edu/sites/maes.umn.edu/files/oat_2016_final-update.pdf (accessed on 23 June 2021).
  44. Entz, M.H.; Guilford, R.; Gulden, R. Crop Yield and Soil Nutrient Status on 14 Organic Farms in the Eastern Portion of the Northern Great Plains. Can. J. Plant Sci. 2001, 81, 351–354. [Google Scholar] [CrossRef]
  45. Langemeier, M.; O’Donnell, M. Conventional and Organic Enterprise Net Returns. In Farmdoc Daily 2020. Available online: https://farmdocdaily.illinois.edu/2020/09/conventional-and-organic-enterprise-net-returns.html (accessed on 1 April 2021).
  46. Caffe-Treml, M.; Guiterrez, L.; Smith, K.P.; Kleinjan, J. 2017–2018 Multi-State Organic Oat Variety Trial Results; South Dakota State University Extension: Brookings, SD, USA, 2019; Available online: https://extension.sdstate.edu/sites/default/files/2019-05/P-00107.pdf (accessed on 23 June 2021).
  47. Brinkman, M.A.; Rho, Y.D. Response of Three Oat Cultivars to N Fertilizer. Crop Sci. 1984, 24, 973–977. [Google Scholar] [CrossRef]
  48. Hamill, M.L. The Effect of Cultivar, Seeding Date, Seeding Rate and Nitrogen Fertility on Oat (Avena sativa L.) Yield and Milling Quality. Master’s Thesis, University of Manitoba, Winnipeg, MB, Canada, 2002. [Google Scholar]
  49. Lafond, G.P.; May, W.E.; Holzapfel, C.B. Row Spacing and Nitrogen Fertilizer Effect on No-Till Oat Production. Agron. J. 2013, 105, 1–10. [Google Scholar] [CrossRef] [Green Version]
  50. May, W.E.; Brandt, S.; Hutt-Taylor, K. Response of Oat Grain Yield and Quality to Nitrogen Fertilizer and Fungicides. Agron. J. 2020, 112, 1021–1034. [Google Scholar] [CrossRef] [Green Version]
  51. Pecio, A.; Bichonski, A. Nitrogen Fertilization and Fungicide Application as Elements of Oat Production. Pol. J. Environ. Stud. 2010, 19, 1297–1305. [Google Scholar]
  52. Buckley, K.E.; Mohr, R.M.; Therrien, M.C. Yield and Quality of Oat in Response to Varying Rates of Swine Slurry. Can. J. Plant Sci. 2010, 90, 645–653. [Google Scholar] [CrossRef]
  53. Yost, M.A.; Coulter, J.A.; Russelle, M.P.; Sheaffer, C.C.; Kaiser, D.E. Alfalfa Nitrogen Credit to First-Year Corn: Potassium, Regrowth, and Tillage Timing Effects. Agron. J. 2012, 104, 953–962. [Google Scholar] [CrossRef] [Green Version]
  54. Grain Millers, Inc. The Growth and Development of Oats: A Production Guide; Grain Millers, Inc.: Eden Prairie, MN, USA, 2017; Available online: http://allamakeeswcd.org/wp-content/uploads/2017/10/Oat-Production-Guide.pdf (accessed on 26 March 2021).
  55. Ciolek, A.; Makarska, E.; Wesolowski, M.; Cierpiala, R. Content of Selected Nutrients in Wheat, Barley, and Oat Grain from Organic and Conventional Farming. J. Elem. 2012, 17, 181–189. [Google Scholar] [CrossRef]
  56. Malhi, S.S.; Johnston, A.M.; Schoenau, J.J.; Wang, Z.L.; Vera, C.L. Seasonal Biomass Accumulation and Nutrient Uptake of Wheat, Barley and Oat on a Black Chernozem Soil in Saskatchewan. Can. J. Plant Sci. 2006, 86, 1005–1014. [Google Scholar] [CrossRef]
  57. Kaiser, D. Oat Fertilizer Recommendations. 2018. Available online: https://extension.umn.edu/crop-specific-needs/oat-fertilizer-recommendations (accessed on 15 January 2021).
  58. Nelson, N.O.; Janke, R.R. Phosphorus Sources and Management in Organic Production Systems. HortTechnology 2007, 17, 442–454. [Google Scholar] [CrossRef] [Green Version]
  59. Nesme, T.; Colomb, B.; Hinsinger, P.; Watson, C.A. Soil Phosphorus Management in Organic Cropping Systems: From Current Practices to Avenues for a More Efficient Use of P Resources. In Organic Farming, Prototype for Sustainable Agricultures: Prototype for Sustainable Agricultures; Bellon, S., Penvern, S., Eds.; Springer: Dordrecht, The Netherlands, 2014; pp. 23–45. ISBN 978-94-007-7927-3. [Google Scholar]
  60. Ochsner, T.E.; Schumacher, T.W.; Venterea, R.T.; Feyereisen, G.W.; Baker, J.M. Soil Water Dynamics and Nitrate Leaching under Corn–Soybean Rotation, Continuous Corn, and Kura Clover. Vadose Zone J. 2018, 17, 170028. [Google Scholar] [CrossRef] [Green Version]
  61. Pfarr, C.J.; Wilson, M.L.; Coulter, J.A.; Fernández, F.G. Liquid Swine Manure as a Sidedressed Nitrogen Source for Corn. Agron. J. 2020, 112, 5206–5221. [Google Scholar] [CrossRef]
  62. Eghball, B.; Wienhold, B.J.; Gilley, J.E.; Eigenberg, R.A. Mineralization of Manure Nutrients. J. Water Conserv. 2002, 57, 470–472. [Google Scholar]
  63. Larney, F.J.; Sullivan, D.M.; Buckley, K.E.; Eghball, B. The Role of Composting in Recycling Manure Nutrients. Can. J. Soil Sci. 2006, 86, 597–611. [Google Scholar] [CrossRef]
  64. Pagliari, P.H.; Laboski, C.A.M. Dairy Manure Treatment Effects on Manure Phosphorus Fractionation and Changes in Soil Test Phosphorus. Biol. Fertil. Soils 2013, 49, 987–999. [Google Scholar] [CrossRef]
  65. Pagliari, P.H. Variety and solubility of phosphorus forms in animal manure and their effects on soil test phosphorus. In Applied Manure and Nutrient Chemistry for Sustainable Agriculture and Environment; Springer: Dordrecht, The Netherlands, 2014; pp. 141–161. [Google Scholar]
  66. Pagliari, P.H.; Laboski, C.A.M. Effects of Manure Inorganic and Enzymatically Hydrolyzable Phosphorus on Soil Test Phosphorus. Soil Sci. Soc. Am. J. 2014, 78, 1301. [Google Scholar] [CrossRef]
  67. Duncan, E.W.; King, K.W.; Williams, M.R.; LaBarge, G.; Pease, L.A.; Smith, D.R.; Fausey, N.R. Linking Soil Phosphorus to Dissolved Phosphorus Losses in the Midwest. Agric. Environ. Lett. 2017, 2, 170004. [Google Scholar] [CrossRef]
  68. Maguire, R.O.; Sims, J.T. Soil Testing to Predict Phosphorus Leaching. J. Environ. Qual. 2002, 31, 1601–1609. [Google Scholar] [CrossRef] [PubMed]
  69. Sharpley, A.; Daniel, T.C.; Sims, J.T.; Pote, D.H. Determining Environmentally Sound Soil Phosphorus Levels. J. Soil Water Conserv. 1996, 51, 160–166. [Google Scholar]
  70. Elser, J.; Bennett, E. A Broken Biogeochemical Cycle. Nature 2011, 478, 29–31. [Google Scholar] [CrossRef] [PubMed]
  71. Kaiser, D.; Rosen, C.J. Potassium for Crop Production. 2018. Available online: https://extension.umn.edu/phosphorus-and-potassium/potassium-crop-production (accessed on 6 April 2021).
  72. Heinrich, A.; Falen, J.; Stone, A. High Soil Test Phosphorus and Potassium Levels on a Long-Term Organic Farm: Trends, Causes, and Solutions. 2020. Available online: https://eorganic.org/node/20735 (accessed on 23 June 2021).
Figure 1. Monthly total precipitation (a) and average temperature (b) during 2015 and 2016 and the 30 year (1981–2010) average for Lamberton, MN.
Agronomy 11 01418 g001
Figure 2. Number of tillers (a) and oat yield (b) as affected by nitrogen application rate (averaged over oat varieties, seeding rate, and nutrient source with standard errors shown). The number of tillers responded linearly (p = 0.009), while oat yield was a quadratic response (p < 0.001).
Agronomy 11 01418 g002
Figure 3. Average grain concentration for: (a) nitrogen (N) as affected by the N rate × nutrient source interaction (p = 0.026) and (b) calcium (Ca) as affected by the N rate × seeding rate interaction for grain Ca (p = 0.016). Nutrient sources included composted or raw beef manure. The low and high seeding rates were 110 and 145 kg ha−1, respectively.
Agronomy 11 01418 g003
Figure 4. Average grain concentration for potassium (K) as affected by the N rate × variety × nutrient source interaction (p = 0.043). The early maturing varieties (early) included Tack in 2015 and Saber in 2016, while the medium (medium) and late (late) maturing varieties included Shelby and Deon, respectively. Nutrient sources included composted or raw beef manure.
Agronomy 11 01418 g004
Figure 5. Average concentration of post-harvest soil nitrate (NO3-N) in the 0 to 15 cm soil layer as affected by the N rate × variety × seeding rate interaction (p = 0.016). The early maturing varieties (early) included Tack in 2015 and Saber in 2016, while the medium (medium) and late (late) maturing varieties included Shelby and Deon, respectively. The low and high seeding rates were 110 and 145 kg ha−1, respectively.
Agronomy 11 01418 g005
Figure 6. Average concentration of post-harvest soil (a) nitrate (NO3-N), (b) Bray P-1, and (c) K in the 0 to 15 cm soil layer as affected by the N rate × nutrient source interaction (p = 0.005, 0.015, and <0.001, respectively). The early maturing varieties (early) included Tack in 2015 and Saber in 2016, while the medium and late maturing varieties included Shelby and Deon, respectively. Nutrient sources included composted or raw beef manure.
Agronomy 11 01418 g006
Table 1. Soil properties in the 0 to 15 cm soil layer before planting in 2015 and 2016 near Lamberton, MN.
Year0–15 cm
pHOrganic Matter
g kg−1
Bray P-1K
mg kg−1
20157.34910108
20167.3537230
Table 2. As-applied nutrient concentration of raw and composted manure (referred to as manure and compost, respectively) and rates in 2015 and 2016 at Lamberton, MN. Nutrients include total nitrogen (TN), phosphorus (P), and potassium (K) applied each year in the spring prior to planting oat.
YearNutrient SourceNutrient ConcentrationTarget N
Application Rate kg N ha−1
Actual Application Rates
TNPKRate
Mg ha−1
TNPK
kg Mg−1kg ha−1
2015Compost8.04.45.5506.350.227.634.5
10012.6100.455.269.0
15018.8150.682.9103.6
Manure9.42.67.1505.450.614.038.2
10010.8101.128.076.4
15016.1151.742.0114.6
2016Compost7.45.04.8506.749.833.532.3
10013.599.567.064.6
15020.2149.3100.596.8
Manure8.35.36.9506.150.232.141.8
10012.1100.564.283.5
15018.2150.796.2125.3
Table 3. Average oat plant population and yield with standard errors for oat varieties that represent different maturity groups. Plant population and yield are averaged over nutrient source and application rate as well as seeding rate since there were no interactions with these factors.
Variety 1Maturity GroupPlant Population 2Yield
Plants m−2Mg ha−1
Tack/SaberEarly261.1 ± 25.6 b4.0 ± 0.6 b
ShelbyMedium356.8 ± 25.6 a3.8 ± 0.6 c
DeonLate261.6 ± 25.6 b4.8 ± 0.6 a
1 Early maturing oats were represented by variety Tack in 2015 and Saber in 2016. 2 Means followed by the same letter in a column are not significantly different (p > 0.05).
Table 4. Average oat grain nutrient content with standard errors for oat varieties that represent different maturity groups.
Variety 1Maturity GroupGrain Nutrient Content 2
NPK 3CaMgS
g kg−1
Tack/SaberEarly16.0 ± 0.4 a3.9 ± 0.2 a5.2 ± 1.7 a 0.77 ± 0.01 b1.4 ± 0.2 a1.5 ± 0.1 b
ShelbyMedium15.2 ± 0.4 b3.8 ± 0.2 a4.7 ± 1.7 b 0.95 ± 0.01 a1.3 ± 0.2 c1.5 ± 0.1 b
DeonLate15.9 ± 0.4 a3.8 ± 0.2 a5.0 ± 1.7 ab0.65 ± 0.01 c1.4 ± 0.2 b1.6 ± 0.1 a
1 Early maturing oats were represented by variety Tack in 2015 and Saber in 2016. 2 Means followed by the same letter in a column are not significantly different (p > 0.05). 3 The N rate × variety × seed rate interaction was significant for grain K content and is reported elsewhere.
Publisher’s Note: MDPI stays neutral with regard to jurisdictional claims in published maps and institutional affiliations.

