Article

De Novo SNP Discovery and Genotyping of Iranian Pimpinella Species Using ddRAD Sequencing

by
Shaghayegh Mehravi
1,
Gholam Ali Ranjbar
2,
Ghader Mirzaghaderi
3,
Anita Alice Severn-Ellis
1,
Armin Scheben
4,
David Edwards
1 and
Jacqueline Batley
1,*
1
School of Biological Sciences, University of Western Australia, Perth, WA 6009, Australia
2
Department of Plant Breeding and Biotechnology, Faculty of Crop Sciences, Sari Agricultural Sciences and Natural Resources University, Sari 4818168984, Iran
3
Department of Agronomy and Plant Breeding, College of Agriculture, University of Kurdistan, Kurdistan, Sari 4818168984, Iran
4
Simons Center for Quantitative Biology, Cold Spring Harbor Laboratory, Cold Spring Harbor, NY 11724, USA
*
Author to whom correspondence should be addressed.
Agronomy 2021, 11(7), 1342; https://doi.org/10.3390/agronomy11071342
Submission received: 26 May 2021 / Revised: 28 June 2021 / Accepted: 28 June 2021 / Published: 30 June 2021
(This article belongs to the Section Crop Breeding and Genetics)

Abstract

:
The species of Pimpinella, one of the largest genera of the family Apiaceae, are traditionally cultivated for medicinal purposes. In this study, high-throughput double digest restriction-site associated DNA sequencing technology (ddRAD-seq) was used to identify single nucleotide polymorphisms (SNPs) in eight Pimpinella species from Iran. After double-digestion with the enzymes HpyCH4IV and HinfI, a total of 334,702,966 paired-end reads were de novo assembled into 1,270,791 loci with an average of 28.8 reads per locus. After stringent filtering, 2440 high-quality SNPs were identified for downstream analysis. Analysis of genetic relationships and population structure, based on these retained SNPs, indicated the presence of three major groups. Gene ontology and pathway analysis were determined by using comparison SNP-associated flanking sequences with a public non-redundant database. Due to the lack of genomic resources in this genus, our present study is the first report to provide high-quality SNPs in Pimpinella based on a de novo analysis pipeline using ddRAD-seq. This data will enhance the molecular knowledge of the genus Pimpinella and will provide an important source of information for breeders and the research community to enhance breeding programs and support the management of Pimpinella genomic resources.

1. Introduction

The genus Pimpinella belongs to the family Apiaceae, together with 250 other genera [1]. Over 46 species of this genus are distributed in the Eastern Mediterranean Region, West Asia, the Middle East, Mexico, Iraq, Turkey, Iran, India, Egypt, Spain and many other warm regions of the world [2]. They are annual or perennial semi-bushy aromatic plants with bisexual flowers with five stamens and two carpels. Species of the genus Pimpinella grow under different climatic conditions and types of soil. The Pimpinella species is known as “Jafari koohi” in Persian, and is commonly used as an aromatic plant and traditionally as a food flavouring, for relief of gastrointestinal spasms and as a carminative digestive [3]. Different species of Pimpinella are famous for their antispasmodic, antioxidant, antimicrobial, expectorant, estrogenic, acariside, insecticidal, anticonvulsant and antifungal properties [4,5]. The valuable therapeutic aspects of Pimpinella are mostly correlated with the existence of sesquiterpenes, phenolic compounds, flavonoids, coumarins, phenylpropanoids and essential oils [6]. The major constituents of the essential oils are kaempherol, quercetin and anethole [7].
There are more than 22 Pimpinella species in Persian flora [8]. P. anisum, P. deverroides, P. eriocarpa, P. aurea, P. tragium, P. affinis and P. tragioides are some of the most common species, which grow in different regions of Iran. In Iran, Pimpinella had a cultivation area of approximately 6,125 ha and seed production of approximately 6,381 ha and seed production of approximately 106.248 tons in 2019 (Food and Agriculture Organization, http://faostat.fao.org (accessed on 14 September 2019). However, the annual production of Pimpinella species is considerably affected by many factors including biotic and abiotic components of the ecosystem and genetic potential of the cultivars [9,10].
Currently, there is limited genomic information available for the Pimpinella genus. As such, although Pimpinella are highly valuable spice plants with pharmacological benefits, data about their genetic and genomic relationships, especially among those species native to Iran, remains limited. Extensive genetic and genomic investigations must be conducted for comprehensive understanding of the Pimpinella genome to enhance productivity, improve quality and develop cultivars that are resilient to biotic and abiotic stresses.
DNA based molecular markers are now increasingly being employed to accelerate plant breeding programs through marker-assisted selection for increasing yield in the germplasm and to understand the molecular mechanisms underlying genetic traits. Different genetic markers, including Inter-simple sequence repeat (ISSR), randomly amplified polymorphic DNA (RAPD) [11], internal transcribed spacer (ITS) [12,13], nuclear rDNA ITS [14] and cpDNA rps16 intron and rpl16 intron [15] have been used in the analysis of genetic diversity, phylogenetic analyses and construction of genetic linkage maps of Pimpinella germplasm.
Single-nucleotide polymorphisms (SNPs) are considered excellent markers for genotyping, with advantages of cost-effectiveness, flexibility, low error rate and suitability for high throughput screening [16]. SNP markers can also easily and inexpensively be converted to develop high-quality assays, which could be used to support Pimpinella breeding programs. In recent years, genome-wide SNP discovery and genotyping have been accelerated with the aid of next generation sequencing (NGS) technology. Restriction site-associated DNA sequencing (RAD-seq) and genotyping by sequencing (GBS) have been increasingly used in genetic and genomic studies in various plant taxa such as onion [17,18], kiwifruit [19], bread wheat [20,21], chickpea [22], soybean [23], carrot [24] and strawberry [25]. RAD-seq is also an efficient method of large scale de novo SNP discovery and genotyping using high-throughput sequencing of large sample sets in a single experiment. Recently Peterson et al. [26] established a double-digest restriction-associated DNA sequencing (ddRAD-seq) method for large scale polymorphism discovery in complex genomes with higher accuracy than GBS.
In the present study, we performed paired-end (PE) ddRAD-seq to develop a novel genome-wide SNP resource from Pimpinella species cultivated in Iran. Filtered high-quality SNPs from eight Pimpinella species were used to identify population structure and genetic relationships. Further, we functionally annotated SNP flanking sequences to determine similarity with known genes and biological functions.

2. Materials and Methods

2.1. Plant Material and DNA Extraction

Eight species of Pimpinella (P. aurea L., P. anisum L., P. affinis, P. kotschyana, P. tragioides, P. eriocarpa, P. tragium and P. barbata) were obtained from the Gene bank of the research institute of forests and rangelands of Tehran, Iran, as described in Table S1. Before sowing, the seeds were sterilized for 5 min in 10% sodium hypochlorite solution (Sigma-Aldrich, Saint Louis, MI, USA) and then in 96% ethanol for 1 min and thoroughly washed with distilled water thereafter [27]. The seeds were sown in 30 cm × 30 cm plastic pots containing 3 kg of soil mixture composed of 15% silt, 15% clay and 70% sand. The plants were grown in a glasshouse located in the University of Western Australia (UWA), Perth, Australia, with 14 h photoperiod, 55–65% humidity and 30/18 °C day/night temperature. Young leaf tissue from one plant of each species was flash frozen in liquid nitrogen, ground to a fine powder and stored at −20 °C. High quality nuclear DNA was extracted using the DNeasy Plant Mini Kit (QIAGEN, Hilden, Germany) according to the manufacturer’s protocol. The resulting DNA was quantified using the Qubit 3.0 Fluorometer (Invitrogen, Carlsbad, CA, USA) with the Qubit dsDNA BR Assay Kit (Invitrogen, Carlsbad, CA, USA). The DNA quality was assessed using the LabChip GX Touch 24 (PerkinElmer, Waltham, MA, USA).

2.2. ddRAD Library Preparation

ddRAD libraries were prepared according to the method described by Severn-Ellis et al. [28] using 200 ng of extracted DNA. The DNA from each sample was restriction-digested in a total volume of 18 µL, containing 5 units each of HpyCH4IV and HinfI, as well as NEB 10 × CutSmart Buffer (New England Biolabs, Ipswich, MA. USA). The reaction was incubated at 37 °C for 4 h. Barcoded and common adapters were designed as described by Peterson et al. [26] to complement the restriction overhangs created by HpyCH4IV and HinfI respectively. Each restriction-digested sample was then ligated to a unique 5′ barcoded adapter and a common 3′ adapter. Ligation reactions were carried out in 40 µL containing the restriction-digested sample, 0.23 µM of the common adapter and 0.5 µM barcoded adapter, respectively, 1U T4 DNA ligase (Invitrogen, Carlsbad, CA, USA), 8 µL T4 ligation buffer (Invitrogen, Carlsbad, CA, USA) and 7 µL of nuclease-free water. Ligation reactions were in-cubated at 22 °C for 2 h and then heat inactivated at 65 °C for 20 min.
Purification and double size selections of the ligated samples was carried out to remove un-ligated adapters and simultaneously select fragments be-tween 250 and 800 bp in size. To remove DNA fragments >800 bp the sample volume was increased to 100 µL by adding 60 µL of nuclease water and then transferred to a 96-well PCR plate containing 50 µL of a 1:4 (0.5×) mixture of AMPure XP Beads (Beckman Coulter, Brea, CA, USA) to PEG buffer (20% PEG w/v, 2.5 M NaCl). After incubation, the beads were collected on a magnetic stand (Invitrogen, Carlsbad, CA, USA). The supernatant was transferred to 20 µL of a 1:1 AMPure XP Beads to PEG buffer (0.7×) mix for the second bead bind to remove fragments <250 bp. The supernatant was removed and the beads con-taining the size selected sample DNA were washed using 80% ethanol. The DNA was eluted in 30 µL nuclease free water.
To enrich the ligated and size selected DNA, PCR amplification was per-formed using 10 µL of size selected DNA, 25 µL of Phusion Hot-Start High-Fidelity Master Mix (Thermo Fisher Scientific, Waltham, MA, USA), 0.5 µM of the PCR1 and 0.5 µM indexed PCR2 primers, respectively. Nucle-ase-free water was added to bring the final volume to 50 µL. The PCR primers used were specific to each adapter and comprised of an Illumina index se-quence and flow cell annealing complimentary sequences [26]. Amplification was carried out at 98 °C for 2 min, 12–18 cycles of 98 °C for 15 s, 62 °C for 30 s, 72 °C for 30 s, final extension for 5 min at 72 °C and held at 4 °C on an Applied Biosystems Veriti Thermal Cycler (Thermo Fisher Scientific, Waltham, MA, USA).
PCR products were purified to remove residual primers and primer di-mers in a 1.5X Ampure XP Bead cleanup step. The DNA concentration of each sample was determined using the Qubit High Sensitivity (HS) assay (Invitro-gen; Waltham, MA, USA). The quality of individual libraries and median frag-ment size was assessed on the LabChip GX Touch (PerkinElmer, Waltham, MA, USA) using the HT DNA HiSens Dual Protocol Reagents (PerkinElmer, Waltham, MA, USA). Equimolar amounts (20–30 nM) of the prepared libraries were pooled. The pooled library underwent a final 0.8X Ampure XP bead cleanup to remove any remaining residual fragments shorter than 200 bp. The concentration of the final bead-cleaned library was determined in preparation for sequencing. Sequencing was carried out at the Garvan Institute of Medical research (Darlinghurst, NSW, Australia), on the Illumina HiSeq XTen (Illu-mina, San Diego, CA, USA) sequencing platform.

2.3. Sequence Quality Analysis and Filtering

Sequence reads were de-multiplexed by using the outer dual index bar-code information using STACKS v.2.1 pipeline (Institute of Ecology and Evo-lution, University of Oregon, Eugene, OR, USA) [29] and assigned to sequenced spe-cies. Average read quality and unpaired reads, presence of repetitive sequenc-es and adapter read-through and GC-content were checked using FastQC v.0.11.4 (Babraham Hall, Babraham Research Campus Cambridge, UK) [30] and multiQC v.1.7 (Department of Biochemistry and Biophysics, Stockholm University, Stockholm, Sweden) [31]. Reads containing the correct restriction sites in R1 and R2 were obtained by searching restriction site sequences in the raw reads respectively. Adapter and sequence trimming were performed us-ing Trimmomatic v.0.36 [32] with default settings and reads were truncated to a uniform 146 bp (R1) and 151 bp (R2), with all shorter reads being discarded.

2.4. De Novo Assembly, Read Alignment and SNP Identification

De novo mapping and SNP calling was performed using STACKS. De novo assembly was carried out with a minimum stack size of three reads (m = 3) and a maximum distance between stacks of three (M = 3). Sam-ple-specific stacks were assembled into homologous stacks if they had a maximum distance of three nucleotides (n = 3) between samples. To limit false SNP identification and increase accuracy of downstream analyses, SNPs with a minor allele frequency (MAF) <0.05 and more than two missing genotype calls were discarded using VCFtools 0.1.15 (Wellcome Trust Sanger Institute, Cambridge, UK) [33].

2.5. Phylogenetic Tree Construction of Eight Pimpinella Species and Principal Component Analysis

A maximum likelihood (ML) phylogeny was inferred based on the fil-tered SNPs using RAXML v. 8.2.11 (Department of Informatics, Institute of Theoretical Informatics, Germany) [34]. Maximum likelihood searches were conducted in RAXML using a model with ascertainment bias correction (ASC_GTRGAMMA) for sequence data, and a rapid bootstrapping analysis with 100 bootstraps was conducted. A random SNP was retained for each ddRAD locus in order to remove physically linked SNPs for Principal com-ponent analysis (PCA). PCA of filtered SNP data was conducted using the R package SNPRrelate (Department of Biostatistics, University of Washington, Seattle, WA, USA) [35]. After converting VCF to GDS format, linked SNPs were re-moved based on co-location using the snpgdsLDpruning function.

2.6. Functional Analysis of SNP-Associated Contig

For functional annotation, SNP-associated scaffold sequences that might putatively encode proteins were searched against the non-redundant protein database at the National Center for Biotechnology Information (NCBI) (Be-thesda, Bethesda, MD, USA) with minimum E-value of ˂ 1.0 × e−6 as the threshold. The most comparable sequence matches for each SNP-associated contigs was se-lected and used to find Gene Ontology (GO) terms using EMBL eggnogg mapper (Structural and Computational Biology Unit, European Molecular Bi-ology Laboratory, Heidelberg, Germany) [36]. The three major GO terms, cel-lular component (CC), biological process (BP) and molecular function (MF) were determined with e-value hit filter ˂1.0 × e−6. In a final step, details of pathway annotated SNP-associated contigs was performed using the Kyoto Encyclopedia of Genes and Genomes (KEGG) database (http://www.genome.ad.jp/ accessed on 1 January 2000) [37].

3. Results

3.1. Genotyping-by-Sequencing Library Construction and Sequencing

A total of 334,702,966 raw paired-end reads were generated. After cleaning the raw data, we obtained 311,040,452 reads, which were subjected to further trimming and demultiplexing. A total of 1,279,850 contigs with an effective per-sample mean coverage of 27.7×, were de novo assembled. The minimum and maximum lengths of the contigs were 146 and 545 bp, respectively, with an average of 247 bp. The GC content was in the range of 39.5–40.5%. The highest number of SNPs were obtained using a maximum distance between RAD stacks of 6 and a maximum mismatch of 6 between sample loci in the catalog (Table S2).

3.2. SNP Calling and Filtering

We selected 1,279,850 contigs from the de novo assembly with a length of 146–151 bp for SNP calling based on Illumina maximum read length. In total, 1,270,791 SNPs were predicted from 625,507 assembled contigs. We then filtered 2440 high-quality SNPs from 625,507 contigs based on a minimum stack size of three reads (m = 3) and a maximum distance between stacks of three (M = 3) and a maximum distance of three nucleotides (n = 3) between samples. After the quality and depth filtering, a mean of 7.8% of SNPs were removed. A statistical summary of data collected about raw reads, cleaned reads are summarized.
Distributions of each type of SNP were as follows: A/G, 698 (28.6%); C/T, 734 (30%); A/T, 219 (8.9%); A/C, 332 (13.6%); C/G, 215 (8.8%) and G/T, 242 (9.9%) (Figure 1). Of the 2440 identified SNPs, 1432 (58.7%) were classified as transitions (A/G or C/T) and 1008 (41.3%) were classified as transversions (A/T, A/C, C/G and G/T) (Figure 1).

3.3. Population Structure and Genetic Relationship Analysis

The heterozygosity and percentage of polymorphic loci showed that the observed heterozygosity (H0) was higher than the expected heterozygosity (He). The mean H0 and He of the Pimpinella among the eight species were calculated as 0.67 and 0.49, respectively (Table S3). In addition, the mean percentage of polymorphic loci observed among the eight species were found to be 20.05.
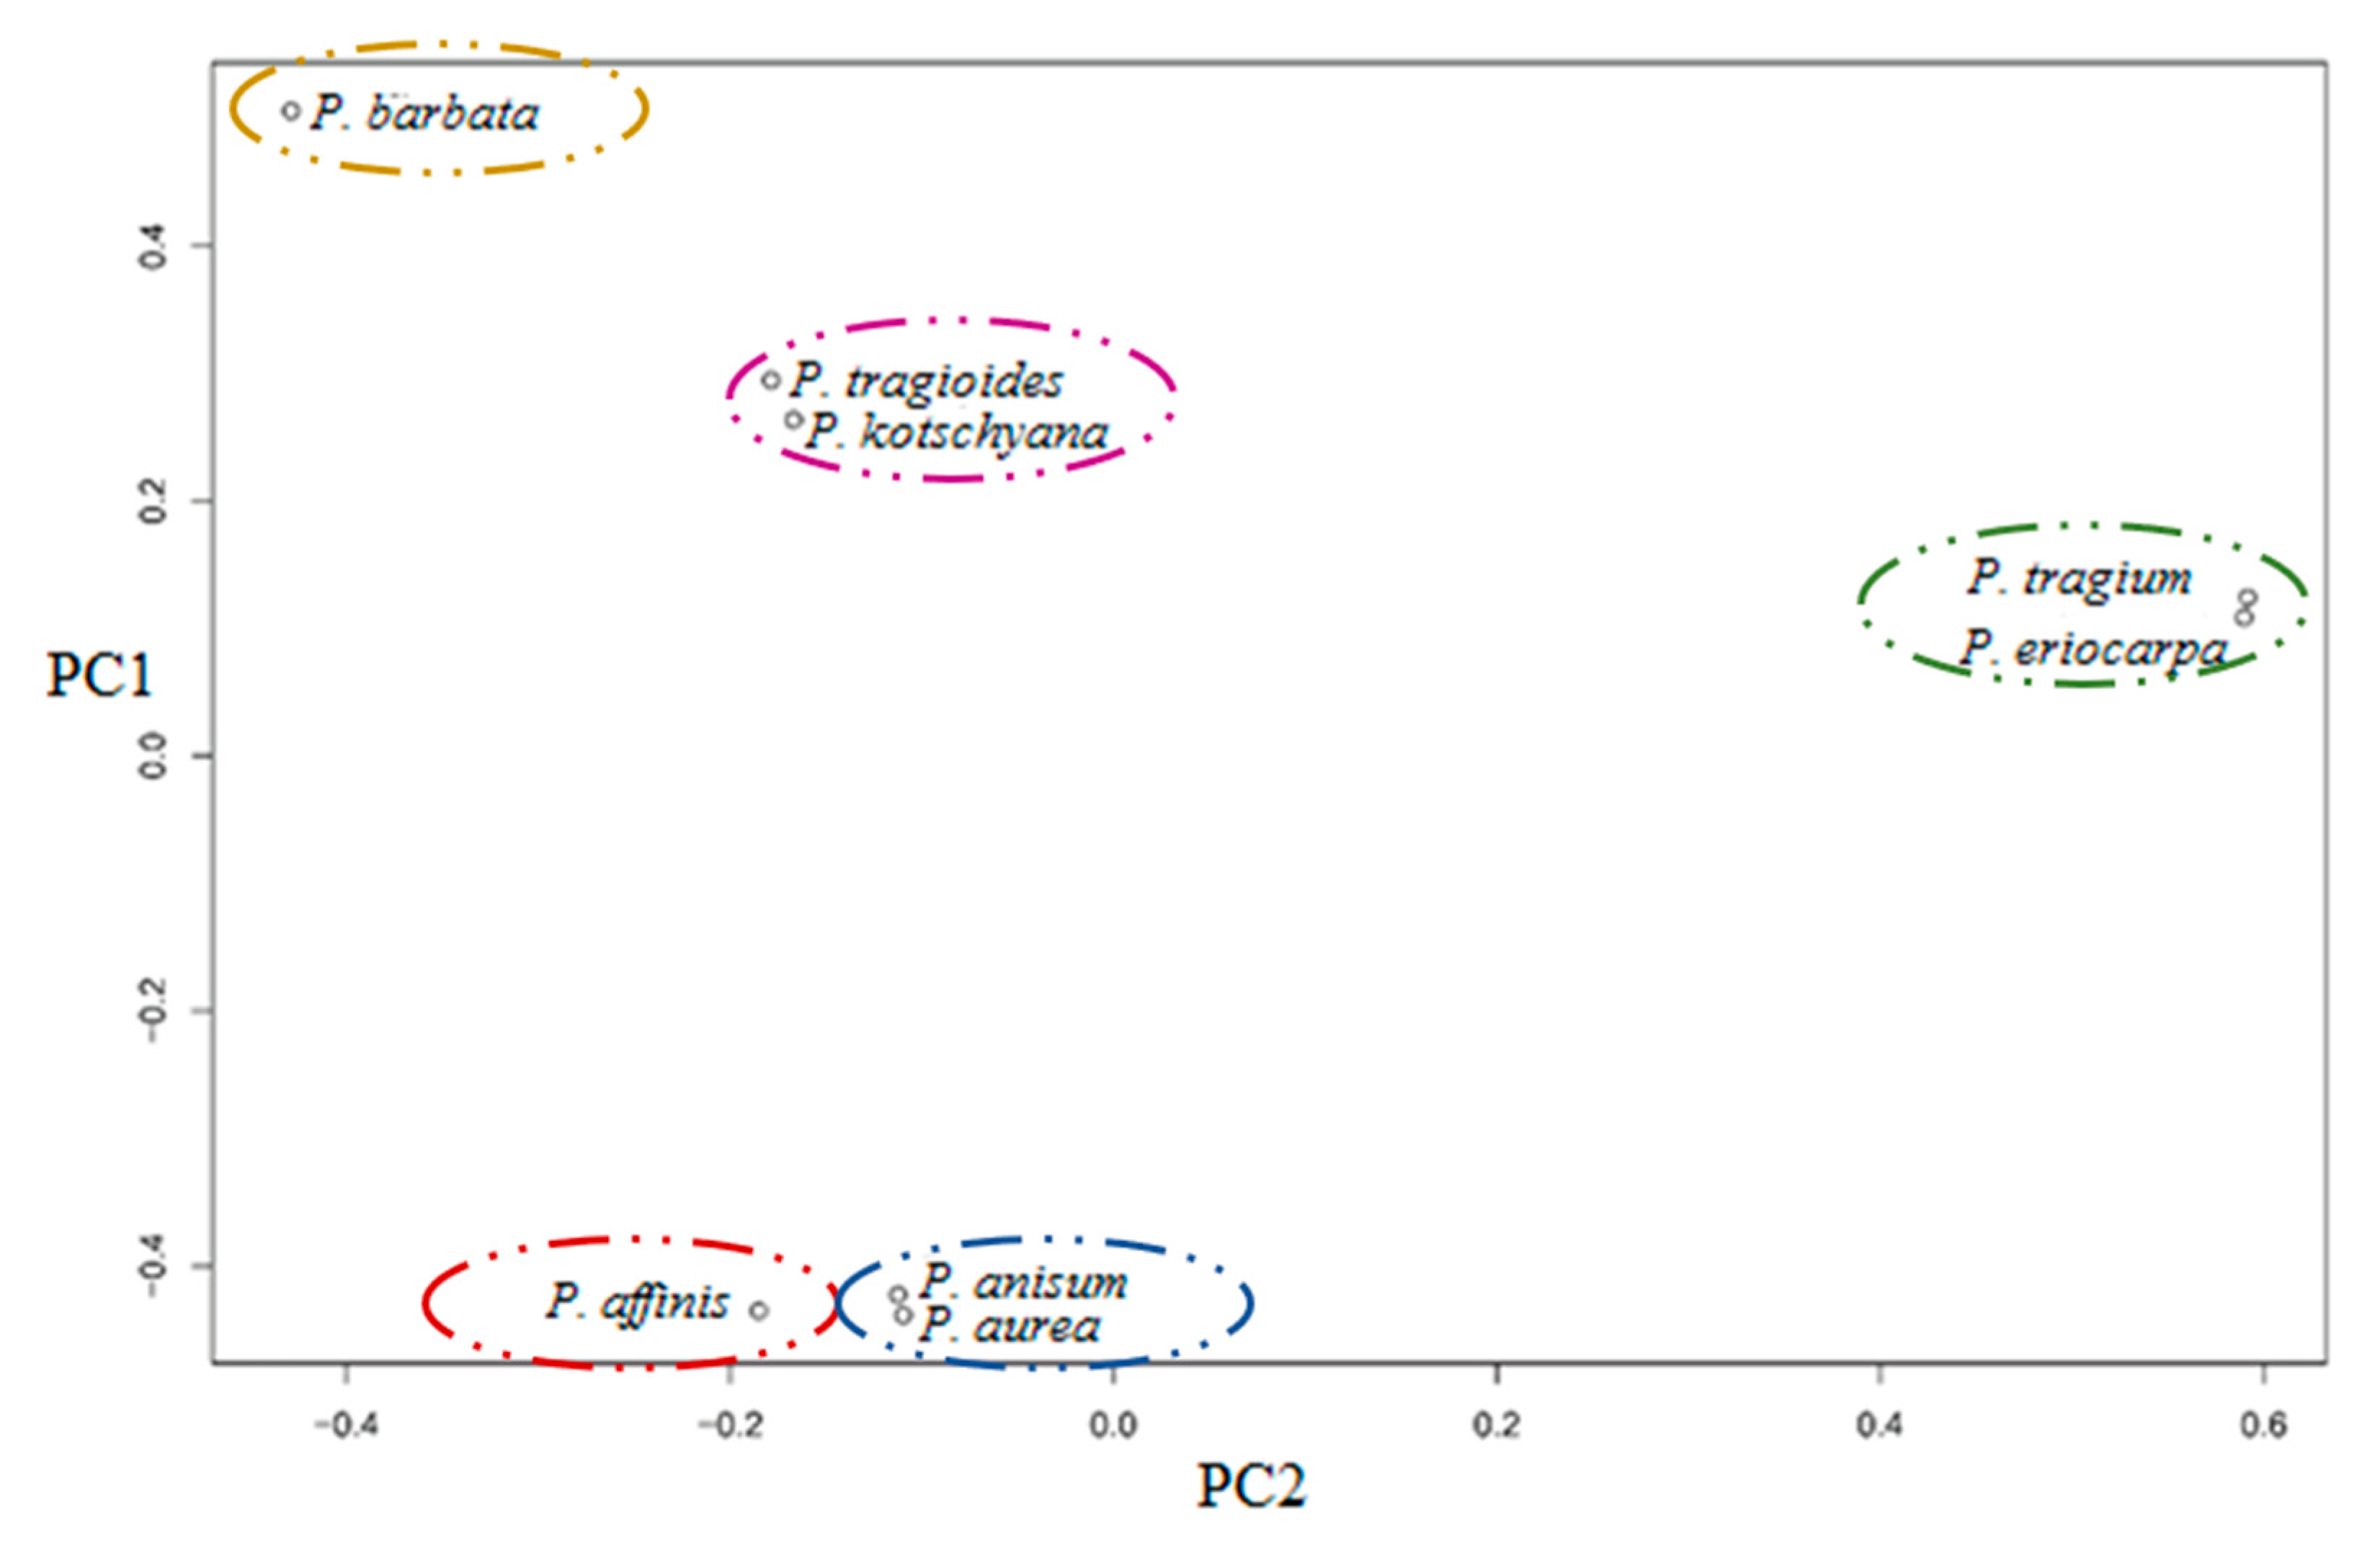
PCA was used to assess the diversity in the Pimpinella species using information from filtered SNP. From 2440 high-quality SNPs detected in Pimpinella species, 774 unlinked SNPs were used for PCA analysis. The first two principal components (PC1 and PC2) explained 27.9% and 24.5% of the total variance and they were projected in a two-dimensional graphic (Figure 2). PC1 separated the P. barbata from other species while PC2 separated P. tragium and P. eriocarpa.

3.4. Functional Analysis of SNP-Associated Scaffolds

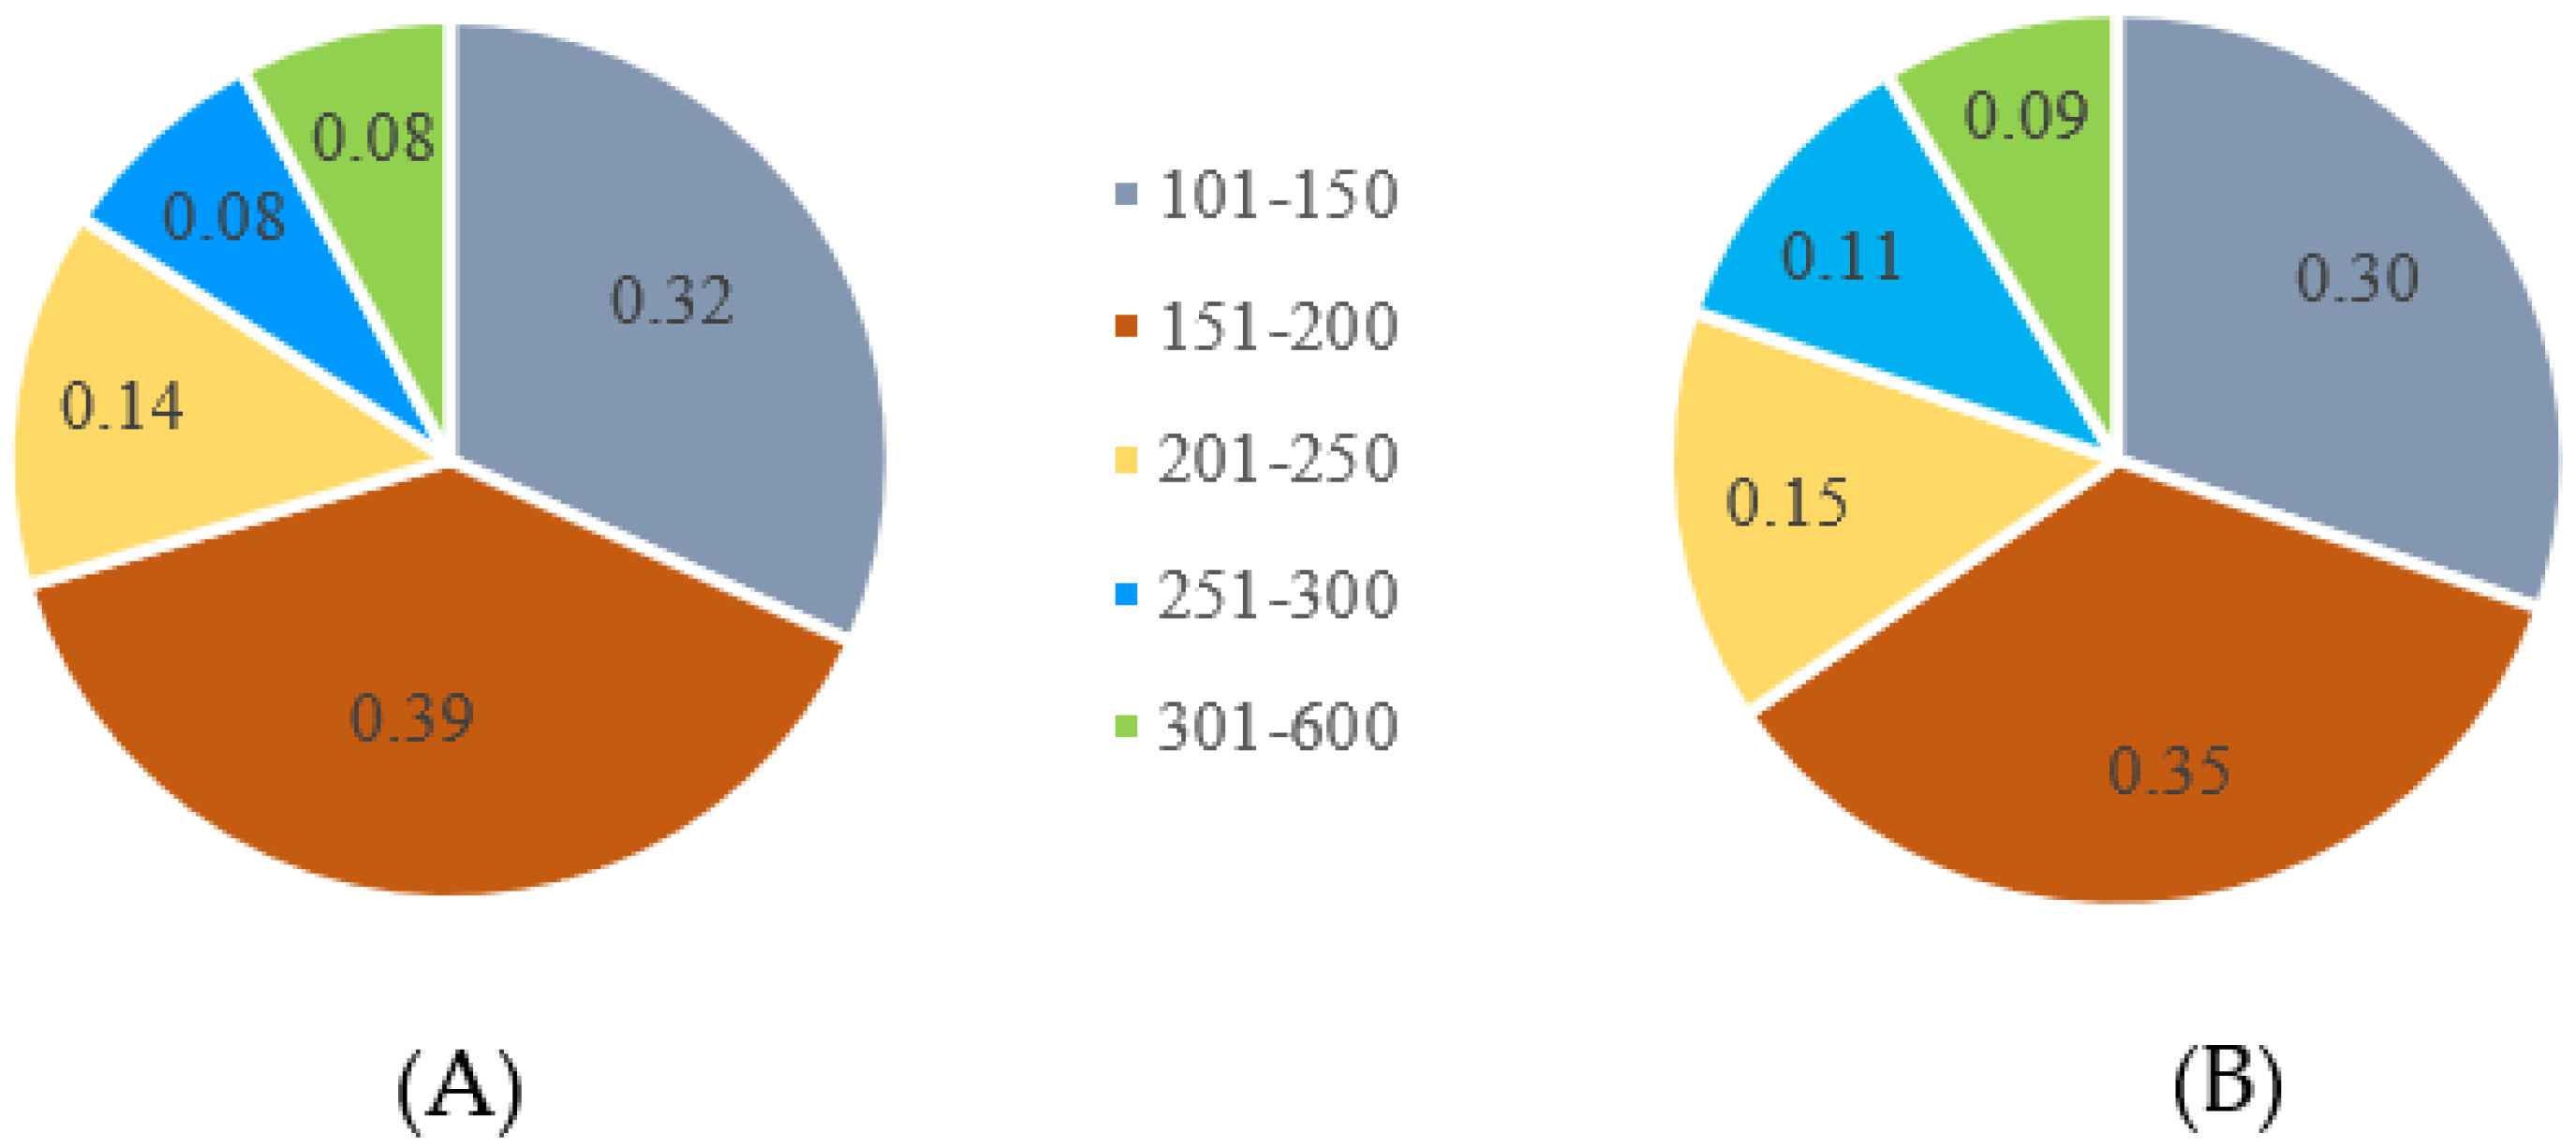
A total of 642 contigs were searched against the nr (BLASTX) (NCBI non-redundant protein sequences) via BLAST 2.5.0 (NCBI, Bethesda, MD, USA). with a minimum E-value of ˂ 1.0 × e−6 as a similarity threshold (Table S4). Similarity results were obtained from 98 of the 642 contigs corresponding to known protein sequences. The remaining 544 contigs did not match with any known protein sequences (Figure 3A,B).
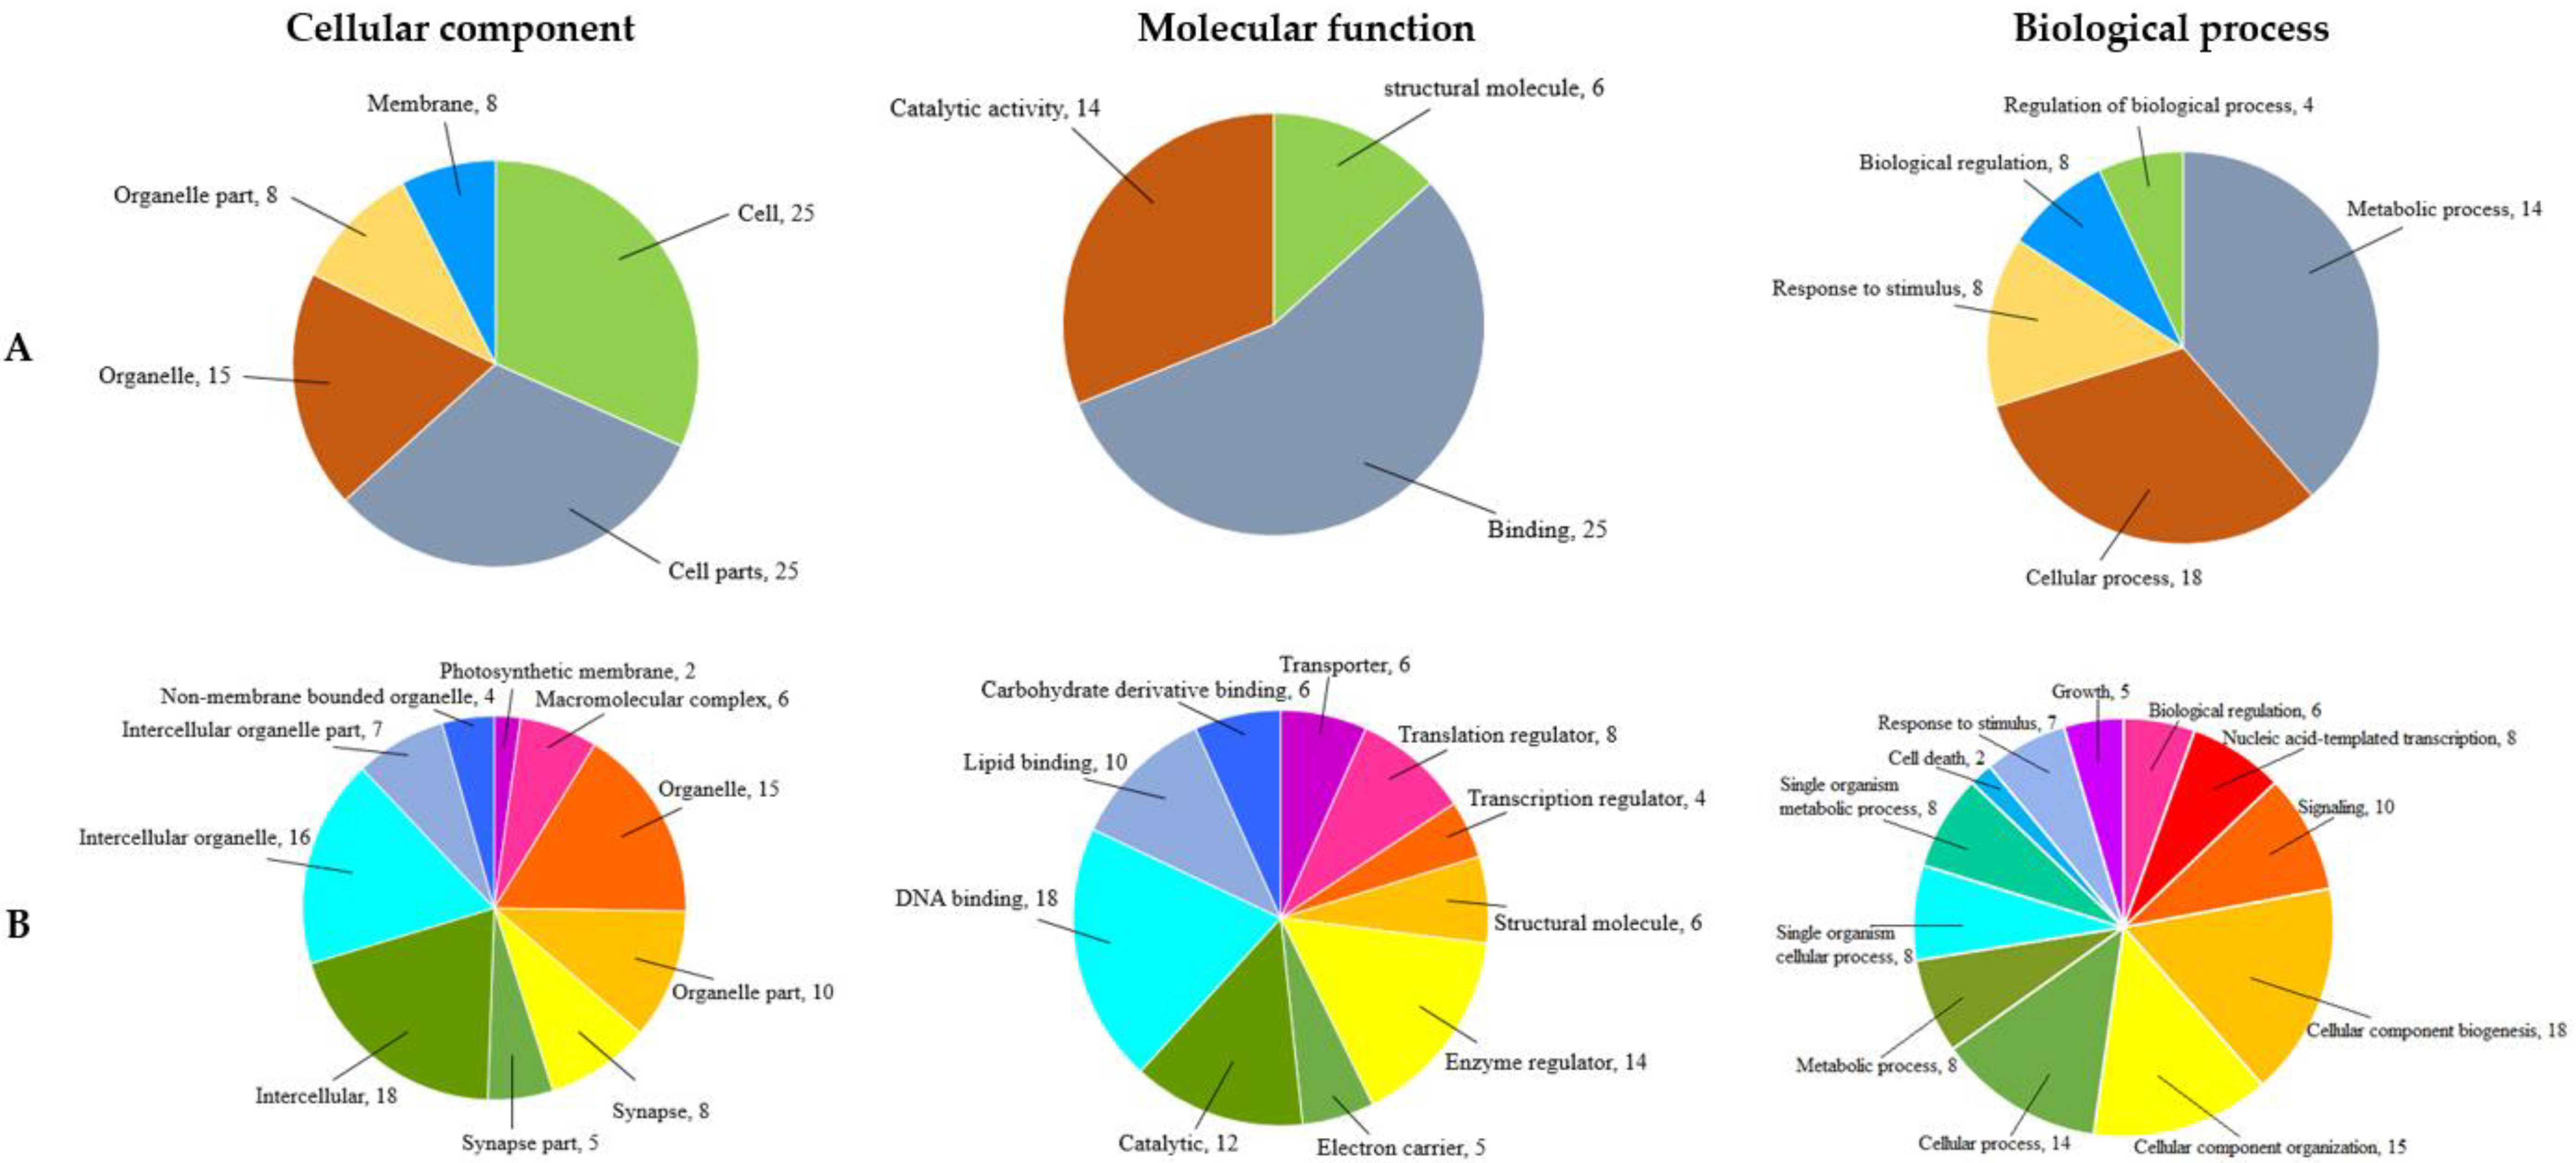
The 98 BLAST hits mainly matched with Daucus carota genes. Seventeen unknown carrot genes with aligned RAD contigs were character-ized using eggNOG 5.0. (Structural and Computational Biology Unit, Euro-pean Molecular Biology Laboratory, Heidelberg, Germany). In total, from 642 RAD contigs 66.4% (426) and 61.5% (395) were intersected genes and intersected exons, respectively. In addition, functional annotations resulted in 496 GO terms (Table S5). These 496 GO terms were further classified into three functional categories such as cellular component (CC, 198 GO terms), molecular function (MF, 88 GO terms) and biological process (BP, 210 GO terms) [38]. Some contigs matched with more than one GO term, whereas a few matched only one GO term. Cellular component annotations were further sub-classified into five main levels of predominant GO subcategories: (1) cell (category I; GO: 0005623) and cell parts (category II; GO: 0044464) were associated with 25 contigs; organelle (category III; GO: 0043226) was associated with 15 contigs and the organelle part category (category IV; GO: 0044422) was associated with 8 contigs; the membrane category (category V; GO: 0016020) was associated with 6 contigs. Most contigs in the MF category were associated with three main GO subcategories: structural molecule (category I, GO: 0005198) with 6 contigs, binding (category II, GO: 0005488) with 25 contigs and catalytic activity (category III, GO: 0003824) with 14 contigs. Biological processes were also categorized into five subcategories: metabolic process (category I; GO: 0008152) with 22 contigs; cellular process (category II, GO: 0009987) with 18 contigs; response to stimulus (category III, GO: 0050896) with 8 contigs; biological regulation (category IV, GO: 0065007) with 5 contigs and regulation of biological process (category VI, GO: 0050789) with 4 contigs (Figure 4A). The level of 3 GO terms with 32 functional groups are plotted in Figure 4B. More than half of the genes were not annotated in this study, likely due to the sequence lengths and depth SNP or scaffold coverage mean, as is common in studies performing de novo analysis [39,40]. In addition, some of these genes might be unique to Pimpinella species.
Analysis of pathway details from annotation results shows that seven contigs are involved in seven different pathways (Table 1). Based on the greatest number of contigs identified in each functional category, the categories detected most often were energy metabolism.
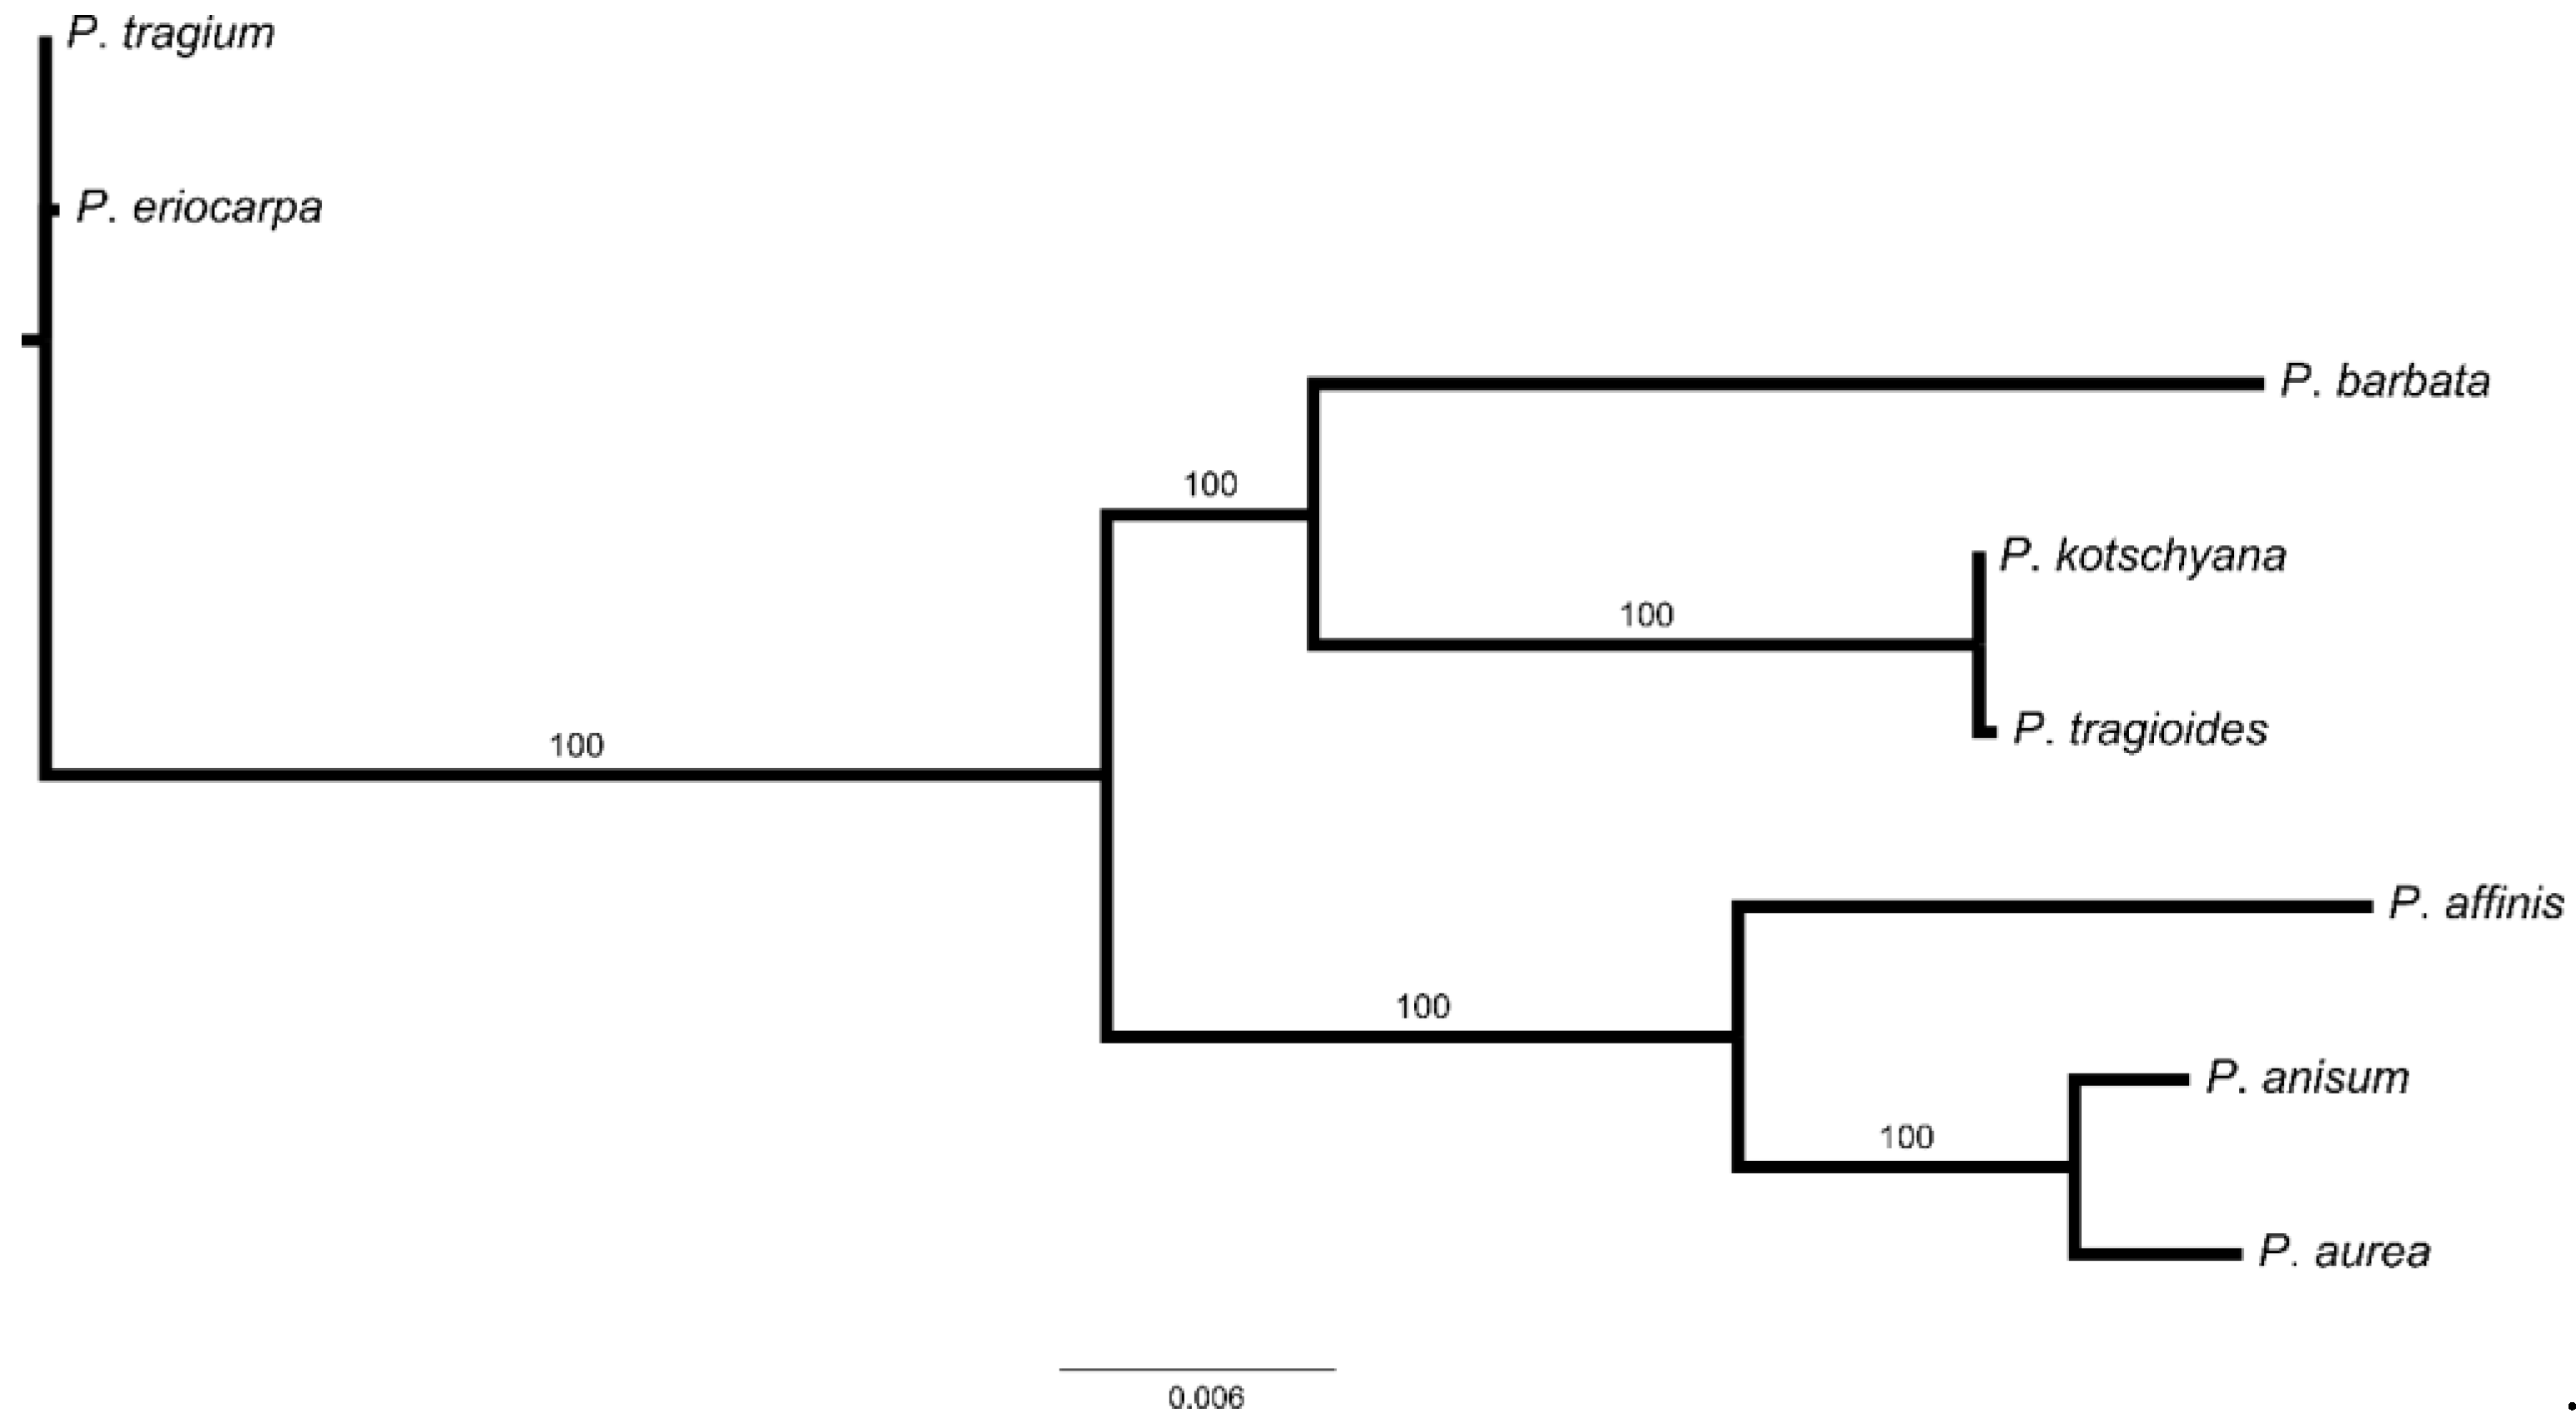
A phylogenetic tree using maximum likelihood method was constructed on the basis of identified SNPs. The result revealed that eight Pimpinella species are clearly separated into three clusters. The first cluster is comprised of P. tragium, the second cluster of P. eriocarpa and the third cluster of P. barbata, P. tragioides, P. kotschyana, P. tragium, P. aurea and P. anisum (Figure 5).

4. Discussion

Detailed characterization of the genetic structure of species is one of the most important prerequisites in the application of breeding programs and efficient protection and use of plant genetic resources [41,42]. Thus, ddRAD is considered as one of most reliable and powerful approaches to provide more effective SNP genotyping. To date, relatively few studies have examined the genetic structure and relationships between Pimpinella species using a PCR-based approach [4,12,13,43]. Furthermore, only two studies, by Wang et al. [15] and Fereidounfar et al. [44], examined the phylogenetic relationships and these used nrDNA ITS and cpDNA intron sequence data. In this study, we set out to use ddRAD-seq to discover genome-wide SNPs in Iranian endemic Pimpinella species in a cost- and time-efficient manner. To achieve this purpose, we selected the HinfI and HpyCH4IV enzyme combination which led to a sufficient read depth to perform SNP calling across different species in the absence of a reference genome. Only 39.0% of the trimmed contigs were aligned using the reads, possibly due to the stringent parameters used by the STACKS de novo to minimize multiple mapping. A similar limitation was also reported for genome-wide SNP discovery in Capsicum annuum germplasm [45].
In the present study, a total of 334,702,966 raw paired-end reads were produced. This high number of raw sequencing reads among the eight Pimpinella species reflected reduced levels of contamination and unexpectedly low sequence repeats. We applied STACKS de novo for SNP calling, which filled the specifications required for SNP discovery from the trimmed reads in the absence of a reference genome sequence [46]. Using this tool, we eliminated low-quality and contaminated reads using efficient filtering criteria. Regardless of the complexities included, 2440 SNPs were identified in this investigation after the initial quality check. The average SNP frequency, 1.5 SNP per 100 bp of filtered ddRAD loci, was higher than the SNP frequency in Apiaceae family [24]. Identification of SNPs obtained from this study maximizes the probability of finding efficient molecular markers in Pimpinella. Such moderate frequency of SNPs retained after the initial quality check in Pimpinella species indicates the importance of generating genome-wide SNPs, which, critically, include markers from transcribed regions and regulatory regions [17].
A major challenge encountered by all genotyping methods has been the difficulty of aligning true alleles of each single locus in plants for which whole-genome sequences and reference genome are not available, such as the Pimpinella genus. In addition, information on the levels of heterozygosity within a selected species would be of value for elucidating the underlying population structure, for calculating minimum population sizes required for maintaining genetic diversity and also for future estimations of genetic gain [17,47]. Our method and selected tools have effectively calculated the heterozygosity and excluded only 175 SNPs, or 7.2% of the quality filtered SNPs. This value is lower and higher than has been previously reported by Duangjit et al. [48] and Jo et al. [17] which consisted of 12.7% and 5.9% heterozygous SNPs. The lower frequency of heterozygous calls could be attributed to the bias arising from our relatively small sample size [49]. The number of SNPs identified in this study was restricted by the capture of a reduced portion of the genome following the combination of the HinfI and HpyCH4IV enzymes and stringent SNP calling by stacks. Although, additional SNPs could have been identified by increasing the value of M and n in species with higher level of polymorphism [50,51].
The C/T allele (734, 30%) occurred most frequently between SNP alleles. Similar results were also observed in other species including Allium cepa [18,39], Brassica napus [52], Cucumis melo [53] and oil palm [54]. The transition/transversion ratio in this study was 1.42, which is lower than has been previously reported in Triticum aestivum L. (1.75) [20], Oryza sativa (2.3) [55], Arachis hypogaea (3.2) [54] and Allium cepa (2.53) [18]. This is the first study in Pimpinella to develop genome-wide SNPs using the GBS method without a reference genome. However, de novo assembly was successfully used to design a SNP array, construct linkage maps, high density genetic and transcriptome analyses in Allium cepa [39], Cicer arietinum L. [22] and Hordeum vulgare [56]. Thus, the identified SNPs with associated flanking sequences can be usable for high-throughput validation assays in Pimpinella breeding programs.
The relatively higher frequency of observed heterozygosity than expected for this study suggests that this species may have recently experienced a genetic bottleneck [57]. In Eucalyptus populations, a similar effect was reported with H0 ˃ He [58]. The low percentage of polymorphic loci among species indicates significant heterogeneity of genetic architecture among species as well as gene-by-environment effects [59,60].
Maximum likelihood phylogenetic construction based on 2440 filtered SNPs generally grouped the eight species of Pimpinella into three main clusters. Cluster 3 had the most species including P. barbata, P. kotschyana, P. tragioides, P. affinis, P. anisum and P. aurea. The species of P. tragium and P. eriocarpa created a separate cluster. The results of this study suggest that the species within one cluster have the most homology in SNP loci. Iranian Pimpinella has been rarely studied from molecular viewpoint. Consistent with previous data [44], a close correlation was observed between geography and the phylogenetic tree in our analysis. P. tragium is south of the East European native and constituted an early diverging cluster and formed a sister cluster to Southwest Asia Pimpinella. It has been suggested that P. tragium is is the origin of the predominantly herbaceous Apiaceae subfamily Apioideae, and chromosome base number of x = 8. However, all species of Pimpinella from Southwest Asia origin fall within a cluster. Based on nuclear region IITS and cpDNA within the context of the genus Pimpinella, Fereidounfar et al. [44] placed some Iranian species in one tribe. Recently, molecular studies grouped P. affinis, P. aurea, P. tragioides, P. barbata and P. kotschyana based on nuclear region IITS and cpDNA [44]. Our phylogenetic trees were consistent with those previously reported, such that P. tragium and P. eriocarpa are considered a separate group within Pimpinella [44]. One of the greatest advantages of using ddRAD-seq for phylogenetic reconstruction, as opposed to the traditional methods of using one to several genes, is that the ddRAD approach samples data from many loci among the entire genome. This suggests that ddRAD-seq data could be profitably applied to methods for multi-locus species tree estimation. RAD-seq are usually considered applicable for phylogenetic reconstruction in species in which sufficient numbers of orthologous restriction sites are retained among species [61].
Estimation of genetic distance between species is one of useful tools for species registration and protection and parental selection in Pimpinella hybridization programs. Cluster and PCA analysis are appropriate methods in genetic diversity identification, tracing the pathway of the evolution of species, parental selection and center of origin and diversity [62]. In this study, we performed PCA on the SNPs data using different species. PCA result illustrated three main groups of Pimpinella species. This technique has been used with great success in a number of recent population genetic studies [63,64,65]. The result of ML and PCA may have relative differences from each other due to the use of the only first two components in the PCA. When the two first principal components account for high variation percentage, clustering according to these two components can be a useful method to find the clusters. However, cluster analysis based on PCA is a more explicit indicator of differences among species than cluster analysis without PCA based [66].
Within the detected SNPs, the 58.7% of transition (A/G, C/T) type were found in Pimpinella species. Transversions (A/T, A/C, C/G and G/T) SNP ratios in Pimpinella species can be used to measure the genetic distance between the species. Transitions polymorphism occurred more frequently than transversions, consistent with the nature of these changes [67].
In total, BLASTX searches against the non-redundant protein database identified 98 of the 642 contigs corresponding to known protein sequences, whereas 544 contigs did not match with any known protein sequence, suggesting that our Illumina paired-end sequencing were unique to Iranian Pimpinella species.
Analysis of metabolic pathway from annotation results showed that seven different pathways, including amino acids metabolism, DNA replication, RNA replication and energy metabolism, were identified. Overall, these pathway details from ddRAD-sequencing will provide valuable information for understanding more about Iranian Pimpinella species.
Plant breeders have always been interested in selecting plant materials based on their germplasm collections, long-term consistent assistance and relatedness limitations to support breeding programs. Relatedness analysis helps plant breeders to understand the backgrounds of their plant materials [18]. In studies on Vigna unguiculata [68] and Allium sativum [69], this model was used in genomic selection and association-related studies.
In this study, the data collection and analysis process provided a novel step forward in the use of ddRAD data to address questions in Pimpinella species genomic structure. We show that the reduced representation genotyping approach is an alternative method to whole-genome resequencing with using restriction site associated DNA sequencing (RAD-Seq).

5. Conclusions

In this study, we identified highly valuable SNP resources from Iranian Pimpinella species using ddRAD-seq analysis. In our literature review, this is the first report of de novo analysis pipeline being used for the discovery of SNPs in Iranian Pimpinella species. Our investigation provides high-quality SNPs, with details of their genetic structure and their annotated functions, and will be useful for deepening our understanding of Pimpinella genomic resource for genetic diversity and relatedness among species, marker-assisted selection programs, trait dissection, breeding and high-density map development.

Supplementary Materials

The following are available online at https://www.mdpi.com/article/10.3390/agronomy11071342/s1, Table S1: List of the eight Pimpinella species, latitude, longitude, altitude, mean temperature, mean rain-fall and locations assigned in this study, Table S2: Population statistics calculated using populations, Table S3: Population statistics calculated using populations (STACKS) for de novo mapping (-M 3 -n 3)., Table S4: BLAST results of SNP-associated sequences from Korean onion accessions compared with the non-redundant (nr) protein database., Table S5: Gene Ontology (GO) annotations of Korean onion accessions.

Author Contributions

J.B., G.M. and G.A.R. conceived and designed this study. S.M. and A.A.S.-E. isolated the DNA and conducted experiments. A.A.S.-E., A.S. and S.M. conducted all statistical analysis and prepared the figures. S.M. wrote the manuscript. J.B., G.M., D.E., A.S. and G.A.R. revised the manuscript. All authors have read and agreed to the published version of the manuscript.

Funding

This research was supported by the Western Australia University, Perth province, Australia.

Institutional Review Board Statement

Not applicable.

Informed Consent Statement

Not applicable.

Data Availability Statement

Raw sequencing reads are available at pim3.filt.vcf—Google Drive.

Conflicts of Interest

The authors declare no conflict of interest.

References

  1. Iovene, M.; Grzebelus, E.; Carputo, D.; Jiang, J.; Simon, P.W. Major cytogenetic landmarks and karyotype analysis in Daucus carota and other Apiaceae. Am. J. Bot. 2008, 95, 793–804. [Google Scholar] [CrossRef]
  2. Pourgholami, M.; Majzoob, S.; Javadi, M.; Kamalinejad, M.; Fanaee, G.; Sayyah, M. The fruit essential oil of Pimpinella anisum exerts anticonvulsant effects in mice. J. Ethnopharmacol. 1999, 66, 211–215. [Google Scholar] [CrossRef]
  3. Özcan, M.M.; Chalchat, J.C. Chemical composition and antifungal effect of anise (Pimpinella anisum L.) fruit oil at ripening stage. Ann. Microbiol. 2006, 56, 353–358. [Google Scholar] [CrossRef]
  4. Fujimatu, E.; Ishikawa, T.; Kitajima, J. Aromatic compound glucosides, alkyl glucoside and glucide from the fruit of anise. Phytochemistry 2003, 63, 609–616. [Google Scholar] [CrossRef]
  5. Tirapelli, C.R.; de Andrade, C.R.; Cassano, A.O.; De Souza, F.A.; Ambrosio, S.R.; da Costa, F.B.; de Oliveira, A.M. Antispasmodic and relaxant effects of the hidroalcoholic extract of Pimpinella anisum (Apiaceae) on rat anococcygeus smooth muscle. J. Ethnopharmacol. 2007, 110, 23–29. [Google Scholar] [CrossRef]
  6. Güvenalp, Z.; Ozbek, H.; Yuzbasioglu, M.; Kuruuzum-Uz, A.; Demirezer, L.O. Flavonoid Quantification and Antioxidant Activities of Some Pimpinella species. Rev. Anal. Chem. 2010, 29, 233–240. [Google Scholar] [CrossRef]
  7. Kuruüzüm-Uz, A.; Güvenalp, Z.; Yuzbasioglu, M.; Özbek, H.; Kazaz, C.; Demirezer, L. Flavonoids from Pimpinella kotschyana. Planta Medica 2010, 76, 274. [Google Scholar] [CrossRef]
  8. Mozaffarian, V. Studies on the flora of Iran, new species and new records. Pak. J. Bot. 2002, 34, 391–396. [Google Scholar]
  9. Awad, N.M.; Turky, A.S.; Mazhar, A. Effects of bio-and chemical nitrogenous fertilizers on yield of anise Pimpinella anisum and biological activities of soil irrigated with agricultural drainage water. Egypt. J. Soil Sci. 2005, 45, 265. [Google Scholar]
  10. Zheljazkov, V.D.; Callahan, A.; Cantrell, C.L. Yield and Oil Composition of 38 Basil (Ocimum basilicum L.) Accessions Grown in Mississippi. J. Agric. Food Chem. 2008, 56, 241–245. [Google Scholar] [CrossRef] [PubMed]
  11. Giachino, R.R.A. Investigation of the genetic variation of anise (Pimpinella anisum L.) using RAPD and ISSR markers. Genet. Resour. Crop. Evol. 2019, 67, 763–780. [Google Scholar] [CrossRef]
  12. Nurcahyanti, A.D.R.; Nasser, I.J.; Sporer, F.; Graf, J.; Bermawie, N.; Reichling, J.; Wink, M. Chemical Composition of the Essential Oil from Aerial Parts of Javanian Pimpinella pruatjan Molk. and Its Molecular Phylogeny. Diversity 2016, 8, 15. [Google Scholar] [CrossRef] [Green Version]
  13. Tabanca, N.; Douglas, A.W.; Bedir, E.; Dayan, F.E.; Kirimer, N.; Baser, K.H.C.; Aytac, Z.; Khan, I.A.; Scheffler, B.E. Patterns of essential oil relationships in Pimpinella (Umbelliferae) based on phylogenetic relationships using nuclear and chloroplast sequences. Plant Genet. Resour. 2005, 3, 149–169. [Google Scholar] [CrossRef]
  14. Spalik, K.; Downie, S.R. Intercontinental disjunctions in Cryptotaenia (Apiaceae, Oenantheae): An appraisal using molecular data. J. Biogeogr. 2007, 34, 2039–2054. [Google Scholar] [CrossRef]
  15. Wang, Z.X.; Downie, S.R.; Tan, J.B.; Liao, C.Y.; Yu, Y.; He, X.J. Molecular phylogenetics of Pimpinella and allied genera (Apiaceae), with emphasis on Chinese native species, inferred from nrDNA ITS and cpDNA intron sequence data. Nord. J. Bot. 2014, 32, 642–657. [Google Scholar] [CrossRef]
  16. Deschamps, S.; Llaca, V.; May, G.D. Genotyping-by-Sequencing in Plants. Biology 2012, 1, 460–483. [Google Scholar] [CrossRef] [Green Version]
  17. Jo, J.; Purushotham, P.M.; Han, K.; Lee, H.-R.; Nah, G.; Kang, B.-C. Development of a Genetic Map for Onion (Allium cepa L.) Using Reference-Free Genotyping-by-Sequencing and SNP Assays. Front. Plant Sci. 2017, 8, 1606. [Google Scholar] [CrossRef] [PubMed]
  18. Lee, J.-H.; Natarajan, S.; Biswas, M.K.; Shirasawa, K.; Isobe, S.; Kim, H.-T.; Park, J.-I.; Seong, C.-N.; Nou, I.-S. SNP discovery of Korean short day onion inbred lines using double digest restriction site-associated DNA sequencing. PLoS ONE 2018, 13, e0201229. [Google Scholar] [CrossRef] [PubMed] [Green Version]
  19. Zhang, Q.; Liu, C.; Liu, Y.; VanBuren, R.; Yao, X.; Zhong, C.; Huang, H. High-density interspecific genetic maps of kiwifruit and the identification of sex-specific markers. DNA Res. 2015, 22, 367–375. [Google Scholar] [CrossRef] [Green Version]
  20. Alipour, H.; Bihamta, M.R.; Mohammadi, V.; Peyghambari, S.A.; Bai, G.; Zhang, G. Genotyping-by-Sequencing (GBS) Revealed Molecular Genetic Diversity of Iranian Wheat Landraces and Cultivars. Front. Plant Sci. 2017, 8, 1293. [Google Scholar] [CrossRef]
  21. Julio, H.-E.; Vikram, P.; Singh, R.P.; Kilian, A.; Carling, J.; Song, J.; Burgueno-Ferreira, J.A.; Bhavani, S.; Huerta-Espino, J.; Payne, T.; et al. A high density GBS map of bread wheat and its application for dissecting complex disease resistance traits. BMC Genom. 2015, 16, 1–15. [Google Scholar] [CrossRef] [Green Version]
  22. Jaganathan, D.; Thudi, M.; Kale, S.; Azam, S.; Roorkiwal, M.; Gaur, P.M.; Kishor, P.K.; Nguyen, H.; Sutton, T.; Varshney, R.K. Genotyping-by-sequencing based intra-specific genetic map refines a ‘‘QTL-hotspot” region for drought tolerance in chickpea. Mol. Genet. Genom. 2015, 290, 559–571. [Google Scholar] [CrossRef] [PubMed]
  23. Iquira, E.; Humira, S.; François, B. Association mapping of QTLs for sclerotinia stem rot resistance in a collection of soybean plant introductions using a genotyping by sequencing (GBS) approach. BMC Plant Biol. 2015, 15, 5–12. [Google Scholar] [CrossRef] [Green Version]
  24. Arbizu, C.I.; Ellison, S.L.; Senalik, D.; Simon, P.W.; Spooner, D.M. Genotyping-by-sequencing provides the discriminating power to investigate the subspecies of Daucus carota (Apiaceae). BMC Evol. Biol. 2016, 16, 234. [Google Scholar] [CrossRef] [Green Version]
  25. Davik, J.; Sargent, D.J.; Brurberg, M.B.; Lien, S.; Kent, M.; Alsheikh, M. A ddRAD Based Linkage Map of the Cultivated Strawberry, Fragaria xananassa. PLoS ONE 2015, 10, e0137746. [Google Scholar] [CrossRef] [PubMed] [Green Version]
  26. Peterson, B.K.; Weber, J.N.; Kay, E.H.; Fisher, H.S.; Hoekstra, H.E. Double digest RAD seq: An inexpensive method for de novo SNP discovery and genotyping in model and non-model species. PLoS ONE 2012, 7, e37135. [Google Scholar] [CrossRef] [Green Version]
  27. Hojati, M.; Modarres-Sanavy, S.A.M.; Karimi, M.; Ghanati, F. Responses of growth and antioxidant systems in Carthamustinctorius L. under water deficit stress. Acta Physiol. Plant. 2011, 33, 105–112. [Google Scholar] [CrossRef]
  28. Severn-Ellis, A.A.; Scheben, A.; Neik, T.X.; Saad, N.S.M.; Pradhan, A.; Batley, J. Genotyping for Species Identification and Diversity Assessment Using Double-Digest Restriction Site-Associated DNA Sequencing (ddRAD-Seq), Legume Genomics; Springer: Berlin/Heidelberg, Germany, 2020; pp. 159–187. [Google Scholar]
  29. Catchen, J.M.; Amores, A.; Hohenlohe, P.; Cresko, W.; Postlethwait, J.H. Stacks: Building and Genotyping Loci De Novo From Short-Read Sequences. G3 Genes Genomes Genet. 2011, 1, 171–182. [Google Scholar] [CrossRef] [Green Version]
  30. Andrews, S. A Quality Control Tool for High Throughput Sequencing Data. Available online: http://www.bioinformatics.babraham.ac.uk/projects/fastqc (accessed on 16 May 2010).
  31. Ewels, P.; Magnusson, M.; Lundin, S.; Käller, M. MultiQC: Summarize analysis results for multiple tools and samples in a single report. Bioinformatics 2016, 32, 3047–3048. [Google Scholar] [CrossRef] [Green Version]
  32. Bolger, A.M.; Lohse, M.; Usadel, B. Trimmomatic: A flexible trimmer for Illumina sequence data. Bioinformatics 2014, 30, 2114–2120. [Google Scholar] [CrossRef] [Green Version]
  33. Danecek, P.; Auton, A.; Abecasis, G.; Albers, C.A.; Banks, E.; DePristo, M.A.; Handsaker, R.E.; Lunter, G.; Marth, G.T.; Sherry, S.T.; et al. The variant call format and VCFtools. Bioinformatics 2011, 27, 2156–2158. [Google Scholar] [CrossRef]
  34. Stamatakis, A. RAxML version 8: A tool for phylogenetic analysis and post-analysis of large phylogenies. Bioinformatics 2014, 30, 1312–1313. [Google Scholar] [CrossRef] [PubMed]
  35. Zheng, X.; Levine, D.; Shen, J.; Gogarten, S.M.; Laurie, C.; Weir, B.S. A high-performance computing toolset for relatedness and principal component analysis of SNP data. Bioinformatics 2012, 28, 3326–3328. [Google Scholar] [CrossRef] [Green Version]
  36. Cantalapiedra, C.P.; Hernández-Plaza, A.; Letunic, I.; Bork, P.; Huerta-Cepas, J. eggNOG-mapper v2: Functional Annotation, Orthology Assignments, and Domain Prediction at the Metagenomic Scale. bioRxiv 2021, in press. [Google Scholar]
  37. Ogata, H.; Goto, S.; Sato, K.; Fujibuchi, W.; Bono, H.; Kanehisa, M. KEGG: Kyoto Encyclopedia of Genes and Genomes. Nucleic Acids Res. 2000, 27, 29–34. [Google Scholar] [CrossRef] [PubMed] [Green Version]
  38. Ashburner, M.; Ball, C.A.; Blake, J.A.; Botstein, D.; Butler, H.; Cherry, J.M.; Davis, A.P.; Dolinski, K.; Dwight, S.S.; Eppig, J.T. Gene ontology: Tool for the unification of biology. Nat. Genet. 2000, 25, 25–29. [Google Scholar] [CrossRef] [Green Version]
  39. Han, J.; Thamilarasan, S.K.; Natarajan, S.; Park, J.-I.; Chung, M.-Y.; Nou, I.-S. De Novo Assembly and Transcriptome Analysis of Bulb Onion (Allium cepa L.) during Cold Acclimation Using Contrasting Genotypes. PLoS ONE 2016, 11, e0161987. [Google Scholar] [CrossRef]
  40. Novaes, E.; Drost, D.R.; Farmerie, W.G.; Pappas, G.J.; Grattapaglia, D.; Sederoff, R.R.; Kirst, M. High-throughput gene and SNP discovery in Eucalyptus grandis, an uncharacterized genome. BMC Genom. 2008, 9, 354. [Google Scholar] [CrossRef] [Green Version]
  41. Izzatullayeva, V.; Akparov, Z.; Babayeva, S.; Ojaghi, J.; Abbasov, M. Efficiency of using RAPD and ISSR markers in evaluation of genetic diversity in sugar beet. Turk. J. Boil. 2014, 38, 429–438. [Google Scholar] [CrossRef]
  42. Tripathi, N.; Saini, N.; Mehto, V.; Kumar, S.; Tiwari, S. Assessment of genetic diversity among Withania somnifera collected from central India using RAPD and ISSR analysis. Med. Aromat. Plant Sci. Biotechnol 2012, 6, 33–39. [Google Scholar]
  43. Marakli, S. Transferability of Barley Retrotransposons (Sukkula and Nikita) to Investigate Genetic Structure of Pimpinella anisum L. Marmara Fen Bilim. Derg. 2018, 30, 217–220. [Google Scholar] [CrossRef]
  44. Fereidounfar, S.; Ghahremaninejad, F.; Khajehpiri, M. Phylogeny of the Southwest Asian Pimpinella and related genera based on nuclear and plastid sequences. Genet. Mol. Res. 2016, 15, 1–17. [Google Scholar] [CrossRef]
  45. Taranto, F.; D’Agostino, N.; Greco, B.; Cardi, T.; Tripodi, P. Genome-wide SNP discovery and population structure analysis in pepper (Capsicum annuum) using genotyping by sequencing. BMC Genom. 2016, 17, 943. [Google Scholar] [CrossRef] [Green Version]
  46. Paris, J.R.; Stevens, J.R.; Catchen, J.M. Lost in parameter space: A road map for stacks. Methods Ecol. Evol. 2017, 8, 1360–1373. [Google Scholar] [CrossRef]
  47. Baldwin, S.; Pither-Joyce, M.; Wright, K.; Chen, L.; McCallum, J. Development of robust genomic simple sequence repeat markers for estimation of genetic diversity within and among bulb onion (Allium cepa L.) populations. Mol. Breed. 2012, 30, 1401–1411. [Google Scholar] [CrossRef]
  48. Duangjit, J.; Bohanec, B.; Chan, A.; Town, C.; Havey, M.J. Transcriptome sequencing to produce SNP-based genetic maps of onion. Theor. Appl. Genet. 2013, 126, 2093–2101. [Google Scholar] [CrossRef] [PubMed]
  49. Maruyama, T.; Fuerst, P. Population Bottlenecks and Nonequilibrium Models in Population Genetics. II. Number of Alleles in a Small Population that was Formed by a Recent Bottleneck. Genetics 1985, 111, 675–689. [Google Scholar] [CrossRef] [PubMed]
  50. Campagna, L.; Gronau, I.; Silveira, L.F.; Siepel, A.; Lovette, I.J. Distinguishing noise from signal in patterns of genomic divergence in a highly polymorphic avian radiation. Mol. Ecol. 2015, 24, 4238–4251. [Google Scholar] [CrossRef] [PubMed]
  51. Ravinet, M.; Westram, A.; Johannesson, K.; Butlin, R.; André, C.; Panova, M. Shared and nonshared genomic divergence in parallel ecotypes of L ittorina saxatilis at a local scale. Mol. Ecol. 2016, 25, 287–305. [Google Scholar] [CrossRef]
  52. Bus, A.; Hecht, J.; Huettel, B.; Reinhardt, R.; Stich, B. High-throughput polymorphism detection and genotyping in Brassica napus using next-generation RAD sequencing. BMC Genom. 2012, 13, 281. [Google Scholar] [CrossRef] [Green Version]
  53. Natarajan, S.; Kim, H.-T.; Thamilarasan, S.K.; Veerappan, K.; Park, J.-I.; Nou, I.-S. Whole Genome Re-Sequencing and Characterization of Powdery Mildew Disease-Associated Allelic Variation in Melon. PLoS ONE 2016, 11, e0157524. [Google Scholar] [CrossRef] [PubMed]
  54. Shirasawa, K.; Kuwata, C.; Watanabe, M.; Fukami, M.; Hirakawa, H.; Isobe, S. Target Amplicon Sequencing for Genotyping Genome-Wide Single Nucleotide Polymorphisms Identified by Whole-Genome Resequencing in Peanut. Plant Genome 2016, 9, 9. [Google Scholar] [CrossRef] [PubMed] [Green Version]
  55. Huang, L.; Li, Z.; Wu, J.; Xu, Y.; Yang, X.; Fan, L.; Fang, R.; Zhou, X. Analysis of genetic variation and diversity of Rice stripe virus populations through high-throughput sequencing. Front. Plant Sci. 2015, 6, 176. [Google Scholar] [CrossRef] [Green Version]
  56. Elshire, R.J.; Glaubitz, J.C.; Sun, Q.; Poland, J.A.; Kawamoto, K.; Buckler, E.S.; Mitchell, S.E. A Robust, Simple Genotyping-by-Sequencing (GBS) Approach for High Diversity Species. PLoS ONE 2011, 6, e19379. [Google Scholar] [CrossRef] [Green Version]
  57. Cornuet, J.M.; Luikart, G. Description and Power Analysis of Two Tests for Detecting Recent Population Bottlenecks From Allele Frequency Data. Genetics 1996, 144, 2001–2014. [Google Scholar] [CrossRef] [PubMed]
  58. Prober, S.M.; Brown, A. Conservation of the Grassy White Box Woodlands: Population Genetics and Fragmentation of Eucalyptus albens. Conserv. Biol. 1994, 8, 1003–1013. [Google Scholar] [CrossRef]
  59. Glémin, S.; Bazin, E.; Charlesworth, D. Impact of mating systems on patterns of sequence polymorphism in flowering plants. In Proceedings of the Royal Society of London. Series B: Biological Sciences, The Royal Society, London, UK, 14 September 2006; pp. 3011–3019. [Google Scholar]
  60. Zhao, K.; Tung, C.-W.; Eizenga, G.C.; Wright, M.; Ali, M.L.; Price, A.H.; Norton, G.J.; Islam, M.R.; Reynolds, A.R.; Mezey, J.G.; et al. Genome-wide association mapping reveals a rich genetic architecture of complex traits in Oryza sativa. Nat. Commun. 2011, 2, 467. [Google Scholar] [CrossRef]
  61. Rubin, B.E.R.; Ree, R.H.; Moreau, C.S. Inferring Phylogenies from RAD Sequence Data. PLoS ONE 2012, 7, e33394. [Google Scholar] [CrossRef] [Green Version]
  62. Eivazi, A.; Naghavi, M.R.; Hajheidari, M.; Pirseyedi, S.; Ghaffari, M.; Mohammadi, S.; Majidi, I.; Salekdeh, G.; Mardi, M. Assessing wheat (Triticum aestivum L.) genetic diversity using quality traits, amplified fragment length polymorphisms, simple sequence repeats and proteome analysis. Ann. Appl. Biol. 2007, 152, 81–91. [Google Scholar] [CrossRef]
  63. Gupta, P.; Idris, A.; Mantri, S.; Asif, M.H.; Yadav, H.K.; Roy, J.K.; Tuli, R.; Mohanty, C.S.; Sawant, S.V. Discovery and use of single nucleotide polymorphic (SNP) markers in Jatropha curcas L. Mol. Breed. 2012, 30, 1325–1335. [Google Scholar] [CrossRef]
  64. Lo, M.-T.; Hinds, D.; Tung, D.A.H.J.Y.; Franz, C.; Fan, C.-C.; Wang, Y.; Smeland, O.B.; Schork, C.-C.F.A.; Holland, D.; Kauppi, K.; et al. Genome-wide analyses for personality traits identify six genomic loci and show correlations with psychiatric disorders. Nat. Genet. 2017, 49, 152–156. [Google Scholar] [CrossRef] [Green Version]
  65. Valenzuela-Muñoz, V.; Gallardo-Escárate, C. TLR and IMD signaling pathways from Caligus rogercresseyi (Crustacea: Copepoda): In silico gene expression and SNPs discovery. Fish Shellfish. Immunol. 2014, 36, 428–434. [Google Scholar] [CrossRef]
  66. Khodadadi, M.; Fotokian, M.H.; Miransari, M. Genetic diversity of wheat (Triticum aestivum L.) genotypes based on cluster and principal component analyses for breeding strategies. Aust. J. Crop. Sci. 2011, 5, 17–24. [Google Scholar]
  67. Guan, X.; Nah, G.; Song, Q.; Udall, J.A.; Stelly, D.M.; Chen, Z.J. Transcriptome analysis of extant cotton progenitors revealed tetraploidization and identified genome-specific single nucleotide polymorphism in diploid and allotetraploid cotton. BMC Res. Notes 2014, 7, 493. [Google Scholar] [CrossRef] [PubMed] [Green Version]
  68. Ravelombola, W.; Shi, A.; Weng, Y.; Mou, B.; Motes, D.; Clark, J.; Chen, P.; Srivastava, V.; Qin, J.; Dong, L.; et al. Association analysis of salt tolerance in cowpea (Vigna unguiculata (L.) Walp) at germination and seedling stages. Theor. Appl. Genet. 2017, 131, 79–91. [Google Scholar] [CrossRef] [PubMed]
  69. Egea, L.A.; Mérida-García, R.; Kilian, A.; Hernandez, P.; Dorado, G. Assessment of Genetic Diversity and Structure of Large Garlic (Allium sativum) Germplasm Bank, by Diversity Arrays Technology “Genotyping-by-Sequencing” Platform (DArTseq). Front. Genet. 2017, 8, 98. [Google Scholar] [CrossRef] [Green Version]
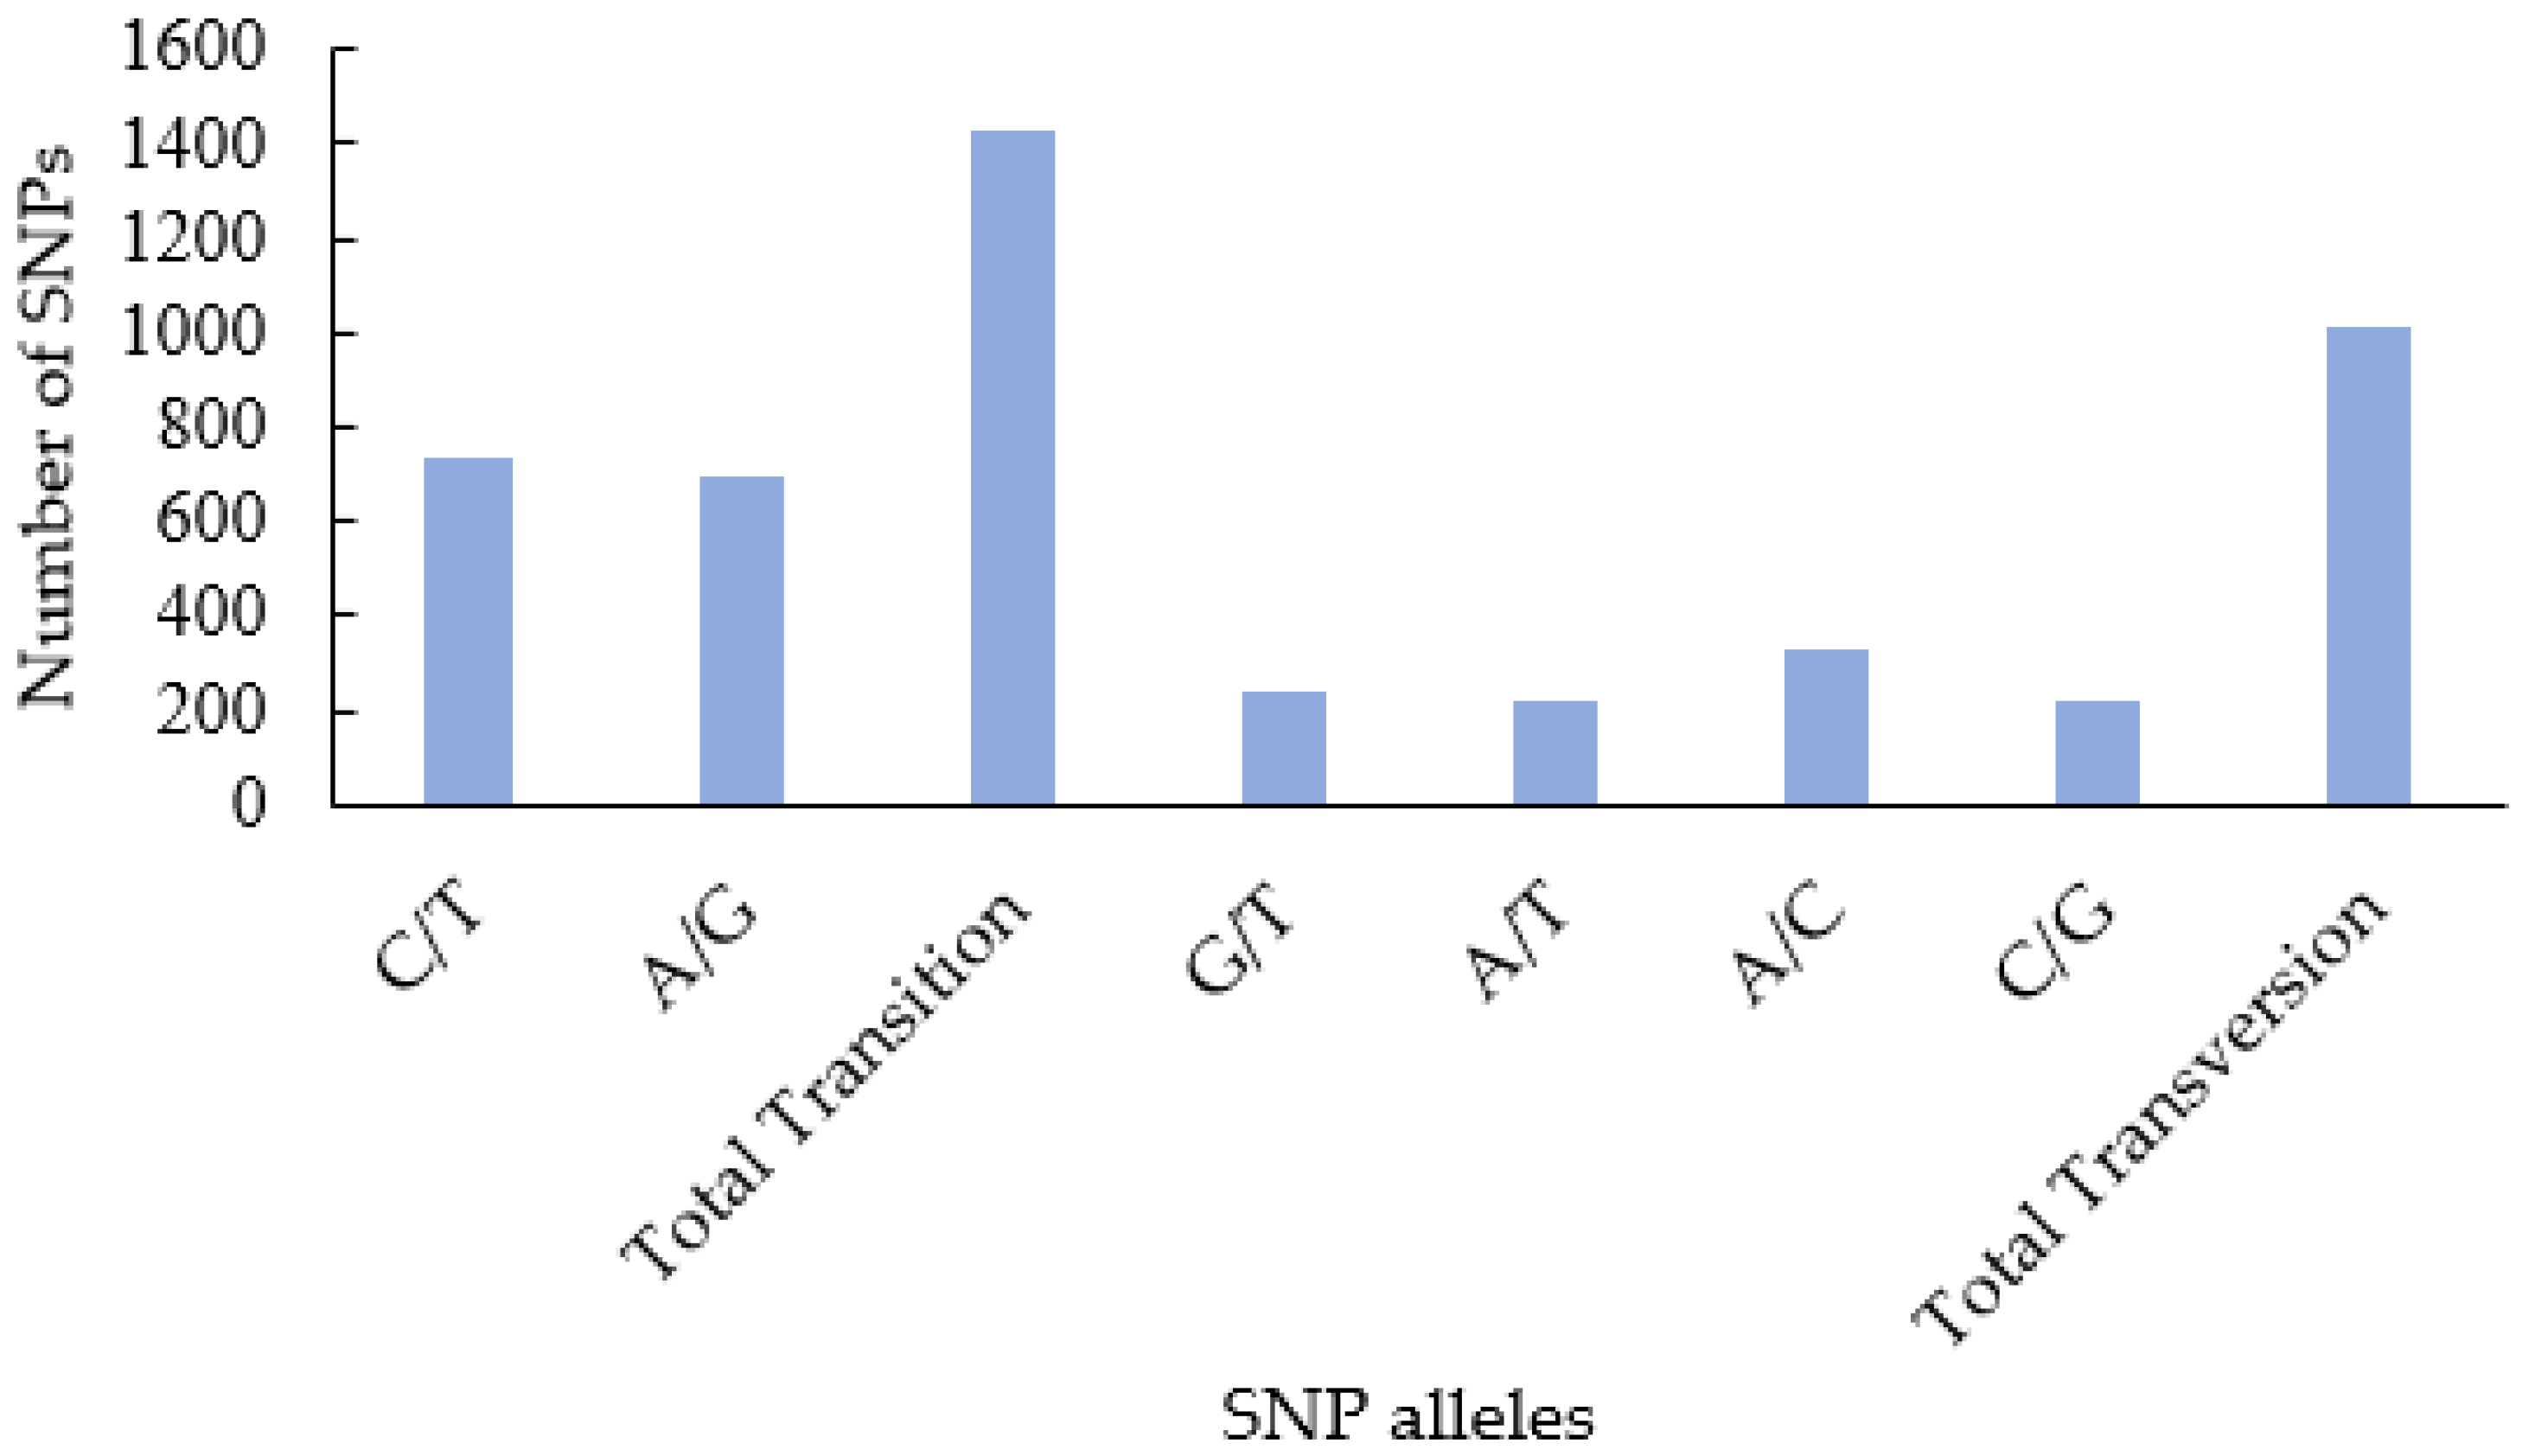
Figure 1. Histogram plot showing SNP distribution and transition/transversion from SNPs identified from de novo ddRAD-sequencing.
Agronomy 11 01342 g001
Figure 2. Diagram resulting from the analysis of principal components of the studied species of Pimpinella.
Agronomy 11 01342 g002
Figure 3. Sequence length distribution from the de novo assembly (A), number of sequences annotated with BLAST hits (B).
Agronomy 11 01342 g003
Figure 4. Level 2 (A) and level 3 (B) Gene Ontology classifications of the SNP-associated contig identified from ddRAD-sequencing.
Agronomy 11 01342 g004
Figure 5. Phylogenetic reconstruction of eight Pimpinella species by Maximum likelihood method. Numbers at the nodes are Bootstrap values from 100 replications.
Agronomy 11 01342 g005
Table 1. Pathway details of annotated SNP-associated contigs.
Pathway IDKEGG PathwayNumber of SequencesEnzyme
map03030DNA replication1DNA ligase [EC:6.5.1.1]
map03020RNA polymerase1RNA nucleotidyltransferase [EC:2.7.7.6]
map00270Cysteine and methionine metabolism1Adenosylhomocysteinase [EC:3.3.1.1]
map00190Oxidative phosphorylation1Ubiquinone reductase [EC:7.1.1.2], ATP synthase [EC:3.6.3.14]
map00195Photosynthesis1Photosystem II [EC:1.10.3.9]
map00143Metabolic pathways1NADH dehydrogenase [EC:7.1.1.2]
Publisher’s Note: MDPI stays neutral with regard to jurisdictional claims in published maps and institutional affiliations.