Article

Multi-Environmental Evaluation of Protein Content and Yield Stability among Tropical Soybean Genotypes Using GGE Biplot Analysis

1
School of Agricultural Sciences, College of Agricultural and Environmental Sciences, Makerere University, Kampala P.O. Box 7062, Uganda
2
National Livestock Resources Research Institute, National Agricultural Research Organization, Kampala P.O. Box 5704, Uganda
3
Biosciences Eastern and Central Africa-International Livestock Research Institute, P.O. Box 30709, Nairobi 00100, Kenya
*
Author to whom correspondence should be addressed.
Agronomy 2021, 11(7), 1265; https://doi.org/10.3390/agronomy11071265
Submission received: 4 May 2021 / Revised: 4 June 2021 / Accepted: 19 June 2021 / Published: 22 June 2021

Abstract

:
The yield and protein performance in a soybean genotype result from its interaction with the prevailing environmental conditions. This makes selecting the best genotypes under varied target production environments more complex. This study’s objectives were to determine protein content and protein stability of 30 elite soybean genotypes in major soybean-growing areas of Uganda, assess the yield performance and stability in soybeans and determine the relationship between the protein content and grain yield in soybeans. The genotypes were planted in a randomized complete block design of three replications for six seasons across eight locations in Uganda. Genotype and genotype-by-environment (GGE) biplot analyses classified the test locations into three mega-environments for soybean protein and grain yields. Genotype NII X GC 20.3 had the highest mean protein content of 43.0%, and BSPS 48A-9-2 and BSPS 48A-28 were superior for the mean grain yield (1207 kg ha−1). Bulindi was the most discriminating and representative test environment for soybean yield. A weak and negative correlation (r = −0.1**, d.f. = 29) was detected between the protein content (%) and yield (kg ha1). The highest-yielding genotypes BSPS 48A-9-2, BSPS 48A-31, and Nam II × GC 44.2 are recommended for further evaluation under farmers’ production conditions for selection and release as new soybean varieties in Uganda.

1. Introduction

Soybeans (Glycine max (L.) Merr.) are a vital feed and food resource in the East African region [1]. Over the recent decades, soybean production has undergone the greatest expansion of any global crop [2]. The largest expansion of soybean production occurred during the second half of the twentieth century, where production grew tenfold from 27 million tons (MT) in 1962 to 334 M.T. in 2019 [3]. It is expected that, by 2050, soybean production will double [4]. Around 75% of soybeans produced worldwide are used for animal feed, especially for poultry and pigs [4]. The remaining soybeans produced are eaten directly, mainly in Asian countries, and a small portion is used to produce biodiesel [4]. Soybean grain contains about 40% protein, 20% oil, varied essential amino acids and nutrients, and a high-calorie value [5]. Soybeans improve soil fertility through nitrogen fixation and enhanced moisture retention, leading to a more sustainable cropping system [6]. The nitrogen-fixing ability of soybeans makes them a good crop for the sustainable agricultural systems of tropical Africa, which are characterized by infertile soils and low fertilizer usage. Therefore, the need for nitrogen fertilizer input is minimized. Soybeans are cultivated as both a food and cash crop [7,8]. Soybean production is expected to increase rapidly as economic development leads to higher animal protein consumption, especially in developing and emerging countries. Therefore, there is a need to promote soybeans as a cash and food crop in tropical Africa.
Makerere University Centre for Soybean Improvement and Development (MAKCSID) has developed several elite soybean genotypes that have been evaluated at advanced yield trials (AYTs) to assess their adaptability in the major soybean production areas of Uganda [9,10,11,12]. However, very little is known about the environments’ effects on the nutritional traits, especially the protein contents of these soybean genotypes, when grown in different multilocational field trials. Few studies have assessed the behavior of the protein contents of soybean genotypes in multilocational trials. Kumar et al. [13] investigated the effect of the environment on the physical properties and biochemical composition of seven Indian soybean cultivars at four growing locations in a multilocational field trial. They found a significant effect of the environment, genotype, and genotype × environment interaction (GEI) on the protein content. Similarly, Arslanoglu et al. [14] investigated the effects of genotype and environment interactions on the protein and oil contents of eight soybean genotypes in eight different environments in Turkey’s Middle Black Sea region. They found the effects of the genotype, environment, and their interactions on soybean seeds’ protein content to be statistically significant. Several studies have reported that high temperatures and less rainfall during soybean seed development and throughout the whole season tend to increase the protein content [13,15,16].
The yield stability in soybeans has been studied more than the nutritional traits. A study conducted in four different locations of Ethiopia for two consecutive years using thirty-two genotypes showed a crossover type of GEI for the grain yield. The same study also identified three genotypes with a high mean yield and high stability performance across the test environments [17]. Adie et al. [18] evaluated 10 black-seeded soybean genotypes in 16 locations and found genotype W9837 × Cikuray-66 as the most stable, and it was recommended for release as a new high-yielding variety. In Zambia, a multi-environment trial analysis reported that the best genotype for general adaptability was the variety TGX 1988-22F. This genotype was stable across all the locations, with high yields and average stability [19].
Several studies have reported inconsistent relationships between the protein content and yield within each genotype when grown in different locations and seasons [20,21]. Different studies have reported both positive [20,22] and negative [23,24,25] correlations. The quantitative nature of inheritance of the protein content and yield in soybeans further influences the genotypes’ responses under different environment and management conditions [14,15,16,26]. The inconsistent findings for the protein and yield relationship and the quantitative nature of the inheritance of both traits reported in previous studies make it extremely challenging to improve the two traits in soybeans simultaneously. Therefore, the objectives of this study were to (i) determine the protein content and protein stability of 30 elite soybean genotypes in eight locations that represent the major soybean-growing areas of Uganda, (ii) assess the grain yield performance and stability in soybeans and (iii) determine the relationship between protein and yield in soybeans.

2. Materials and Methods

2.1. Experimental Materials

The soybean genotypes included 28 elite breeding lines developed by Makerere University Centre for Soybean Improvement and Development (MAKCSID) and two check varieties (Maksoy 3N and Maksoy 4N) (Table 1). Maksoy 3N is a farmer-preferred variety because of its large seed, high grain yield, and high oil content, while Maksoy 4N is a high-yielding soybean variety also released in Uganda. All the experimental materials were derived from 3 crosses made at the National Crops Resources Research Institute (NaCRRI) and Makerere University Agricultural Research Institute Kabanyolo (MUARIK) in Uganda. The parental lines were Nam 2, farmers’ preferred variety; Duiker introduced from Zimbabwe has desirable farmers’ seed traits, such as large seeds, a cream color, and yellow hilum; and GC0038-29 matures early and is resistant to soybean rust disease. The three biparental populations were advanced from the F2 to F6 generation using a modified single-seed descent (SSD) method, where one pod was used instead of a single seed. At the F7 generation, single plant selections were made to identify soybean plants with desirable traits, such as high yield, early maturity, resistance to major diseases and insect pests, resistance to lodging, and pod shattering. These selected single plants were planted in single rows, and seeds from every row were harvested in isolation and used in a replicated preliminary yield trial at Kabanyolo in 2013A. The initial yield trial was evaluated in an intermediate yield trial at two locations in 2013B (NaCRRI and MUARIK). The seed from the intermediate yield trial was evaluated further in an advanced yield trial conducted at eight locations representing Uganda’s major soybean-growing areas.

2.2. Description of the Locations Used in the Study

The grain yield trial was conducted in eight locations, representing Uganda’s major soybean-growing areas (Table 2). Three locations, Namulonge, Kabanyolo, and Nakabango, are situated in the Lake Victoria Crescent, while Bulindi is in the Western Grasslands, Ngetta in the North-Western savannah grasslands, Iki-Iki in the Kyoga plains, Abi in North-Western Farmlands Wooded Savanna, and Mubuku in the Western Medium High Farmlands. These locations have different climatic conditions that influence soybean yields (Table 2). The Mubuku irrigation scheme was selected to assess the adaptability of the soybean genotypes under irrigation conditions. A protein content analysis was conducted in all the above locations, except for Kabanyolo and Bulindi.

2.3. Experimental Design, Data Collection, and Analysis

The soybean genotypes were planted in a randomized complete block design (RCBD) with three replications. Each genotype was represented by three rows measuring 5 m long, with a spacing of 60 cm between rows and 5 cm between plants within a row. The multilocational trial was conducted for six consecutive seasons: the first rains of 2014 (2014A), second rains of 2014 (2014B), first rains of 2015 (2015A), second rains of 2015 (2015B), first rains of 2016 (2016A), and second rains of 2016 (2016B). The trials were kept weed-free, and three weedings were conducted each season. No agrochemicals were used on the trials to control pests. Each genotype was harvested from all three rows at maturity, threshed, and corrected to 10% moisture content by sun-drying before determining the protein content and yield in kg per hectare. The total seed protein content analysis was conducted on soybean genotypes grown in six locations (Abi, Iki-Iki, Mubuku, Nakabango, Namulonge, and Ngetta). The protein content was determined for the 2016A season from the Bioscience Eastern and Central Africa-International Livestock Research Institute (BecA-ILRI) Hub using the Modified Folin–Lowry method [27].
Before the analysis of variance, both protein and grain yield data were subjected to a normality test using QQ plots in the R package [28]. Analysis of variance (ANOVA) for both the protein content and grain yield was done separately for each location and combined across locations using the package agricolae R package [28]. Genotypes were considered as fixed effects and replications and blocks within replications as random effects. For the combined analysis, variances were partitioned into the relevant sources of variation to test for differences among the genotypes and the presence of GEI. Adjusted protein contents and grain yields from ANOVA were subjected to a GGE biplot analysis to decompose each trait’s GEI to compare the genotype stability in the performance across the various environments [29,30]. A correlation analysis was performed for the protein content and yield from the six locations where a protein content analysis was conducted. The correlation analysis was conducted using the corrplot package version 0.88 using the Pearson method in R software [31].

3. Results

3.1. Protein Content (%) Performance of Genotypes across Locations

Protein content data were normally distributed as illustrated by the QQ plot (Figure 1). The ANOVA for protein content revealed a highly significant difference (p < 0.001) among genotypes, locations, and Genotype × Location interactions (Table 3). Nakabango had the highest mean protein content of 42.5%; followed by Mubuku and Iki-Iki with protein contents of 41.3% and 41.1%, respectively (Table 4). Genotype NII X GC 20.3 had the highest mean protein content of 43.0%, followed by genotypes NII X GC 43.2 (42.5 %), NII X GC 7.2 (42.3%), and BSPS 48A-31 (42.2%) (Table 4). A narrow range in the performance of 4.6% between the genotype with the highest protein content and that with the lowest protein content was observed across the six locations.

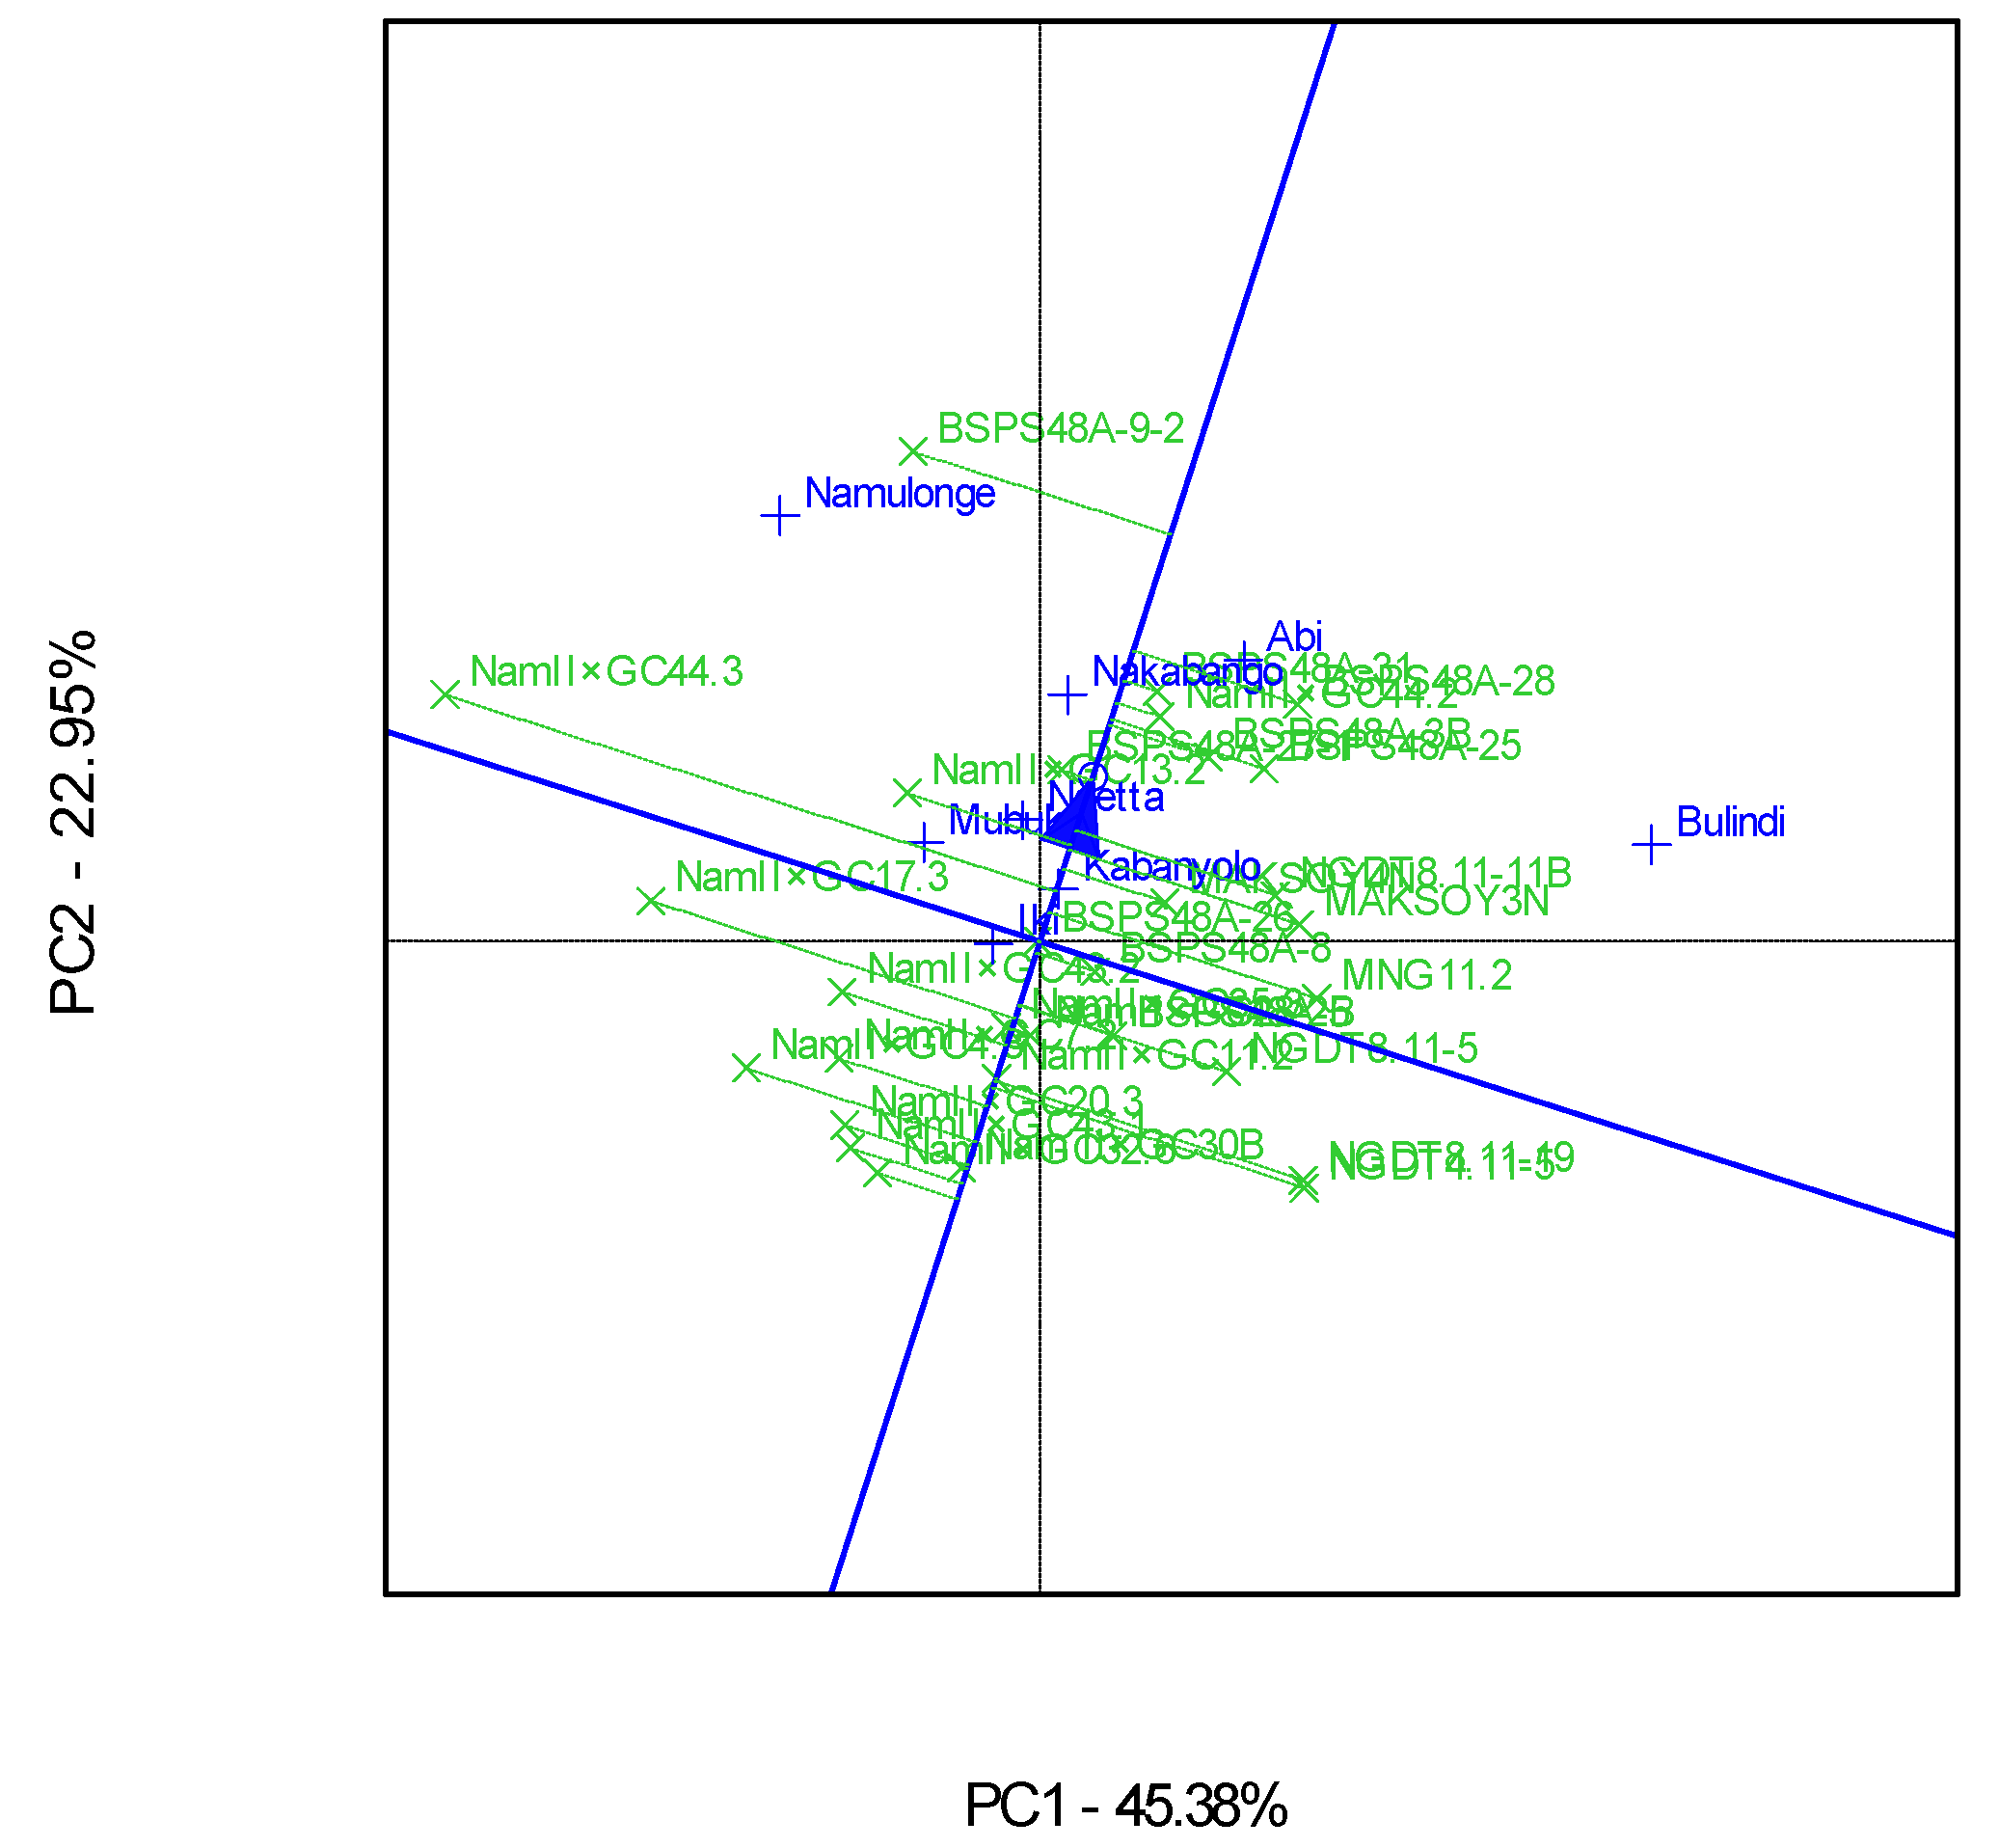
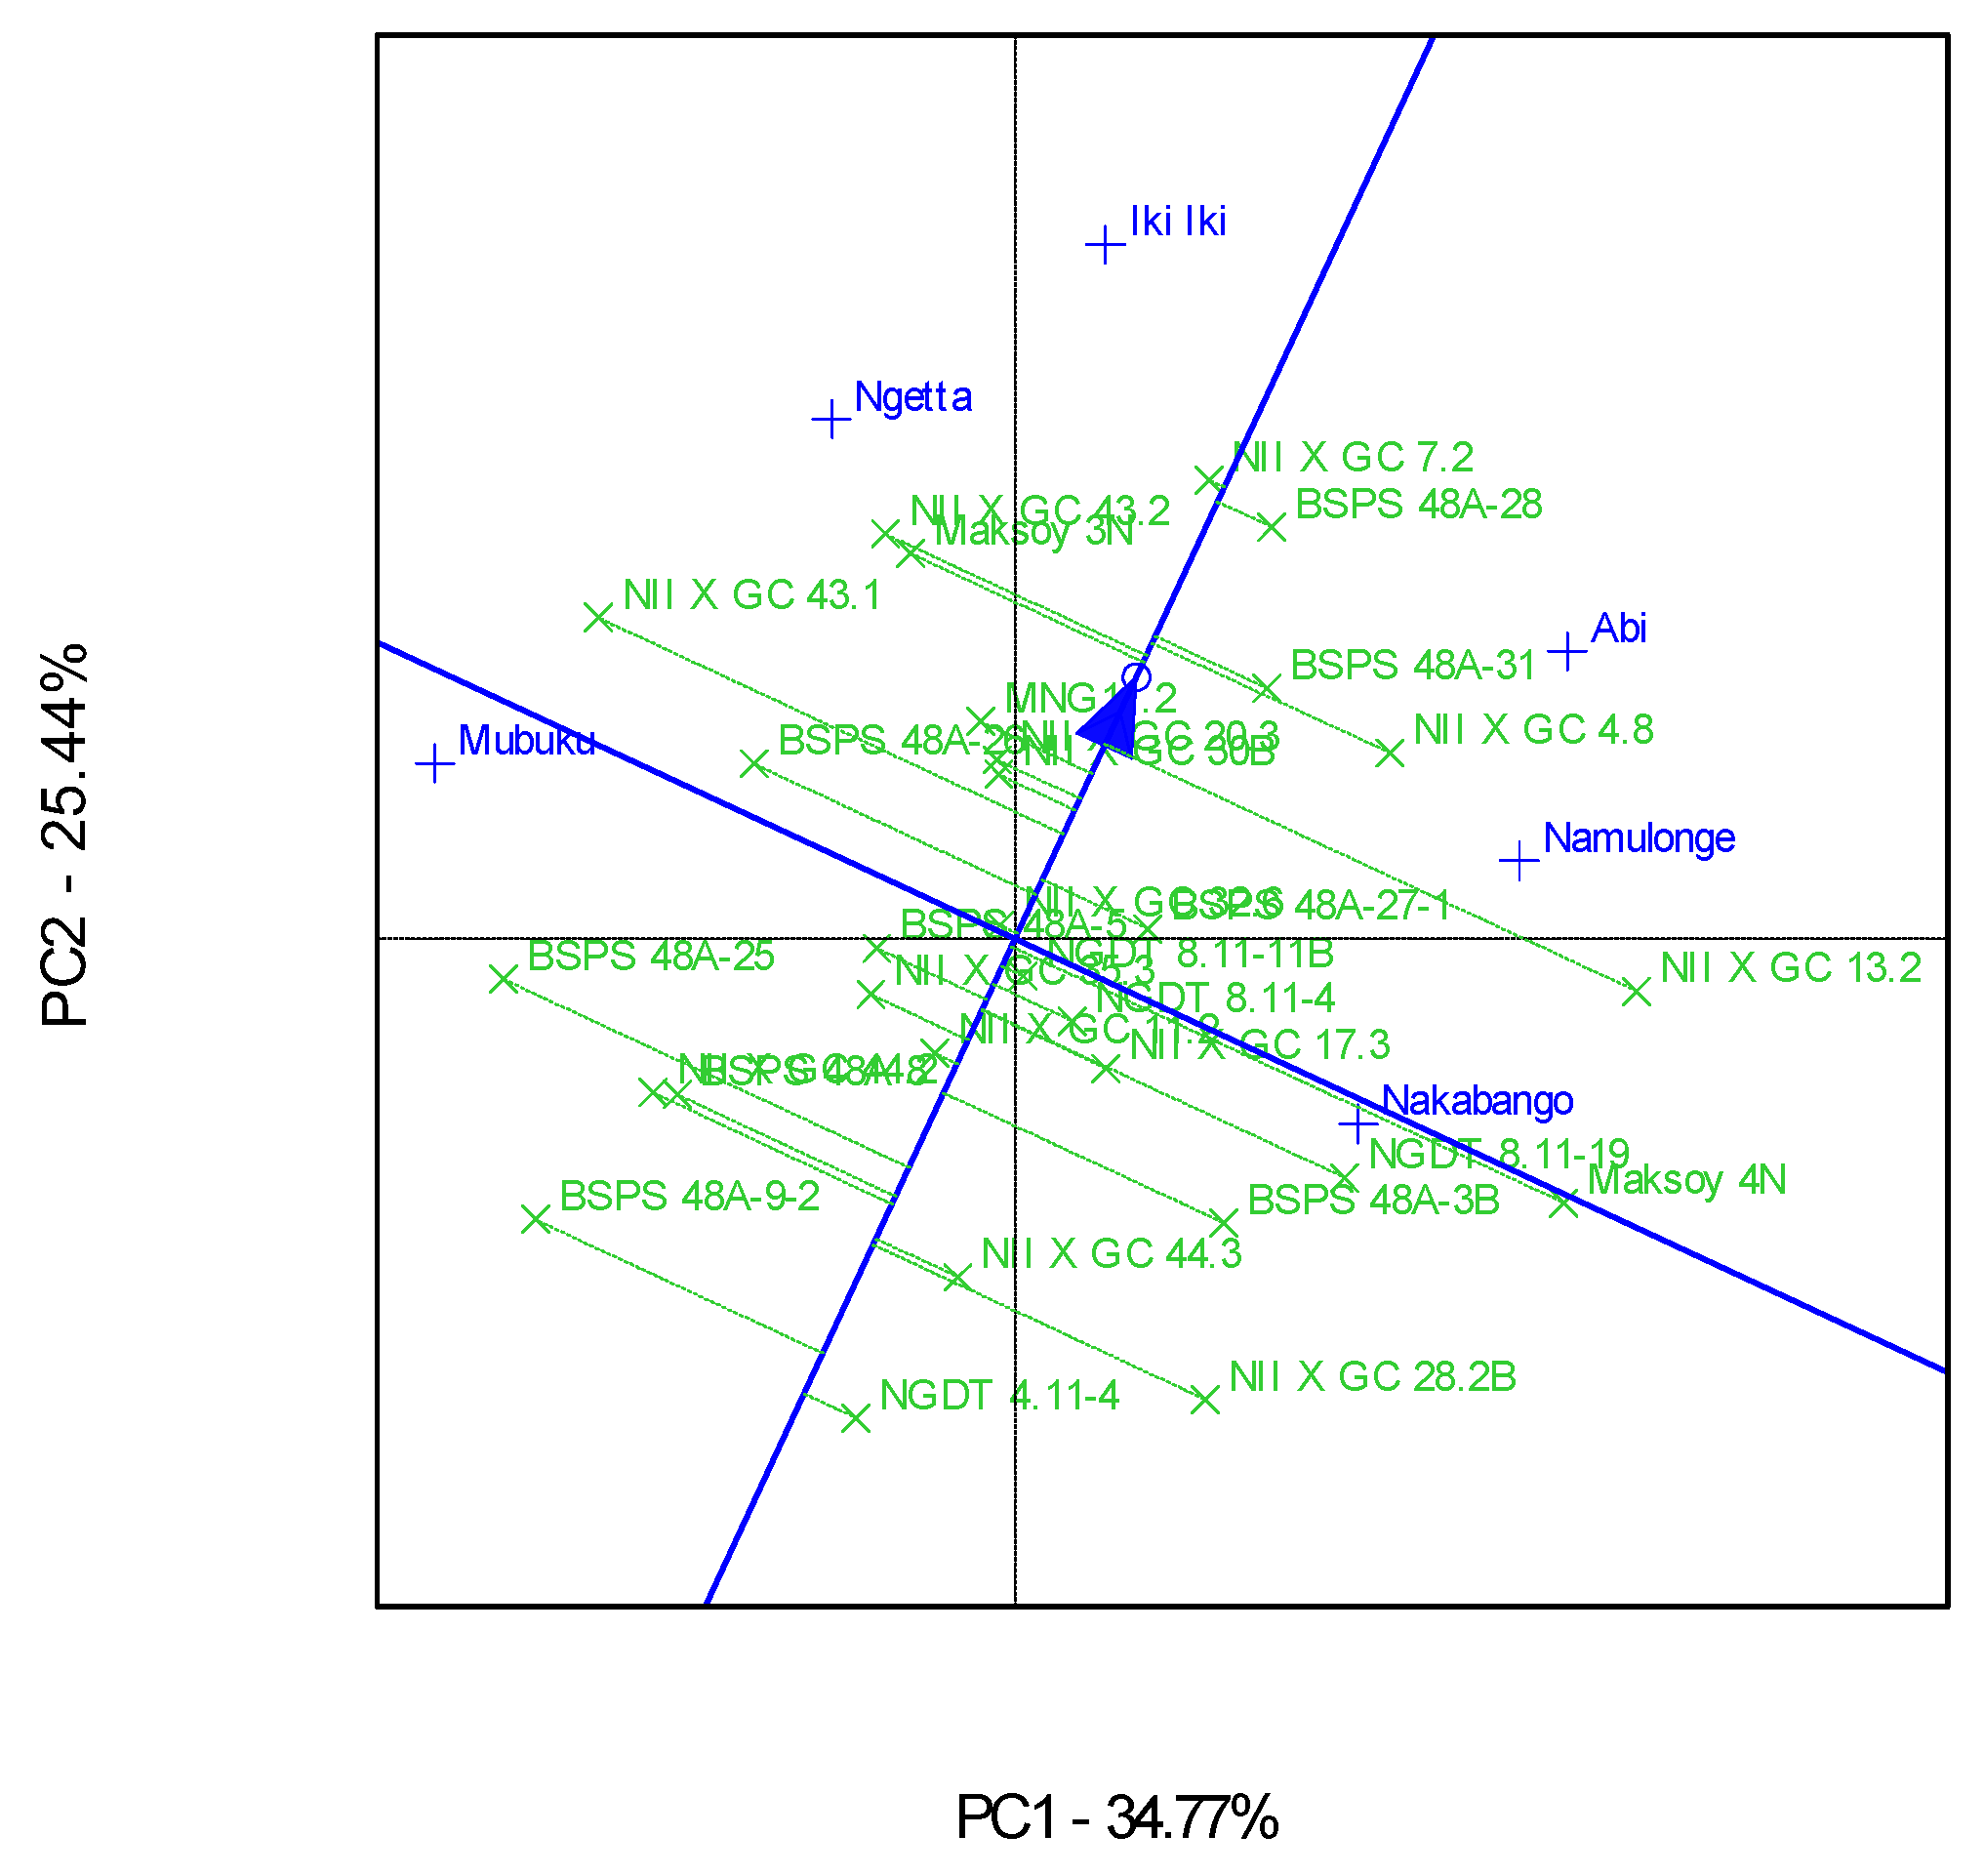
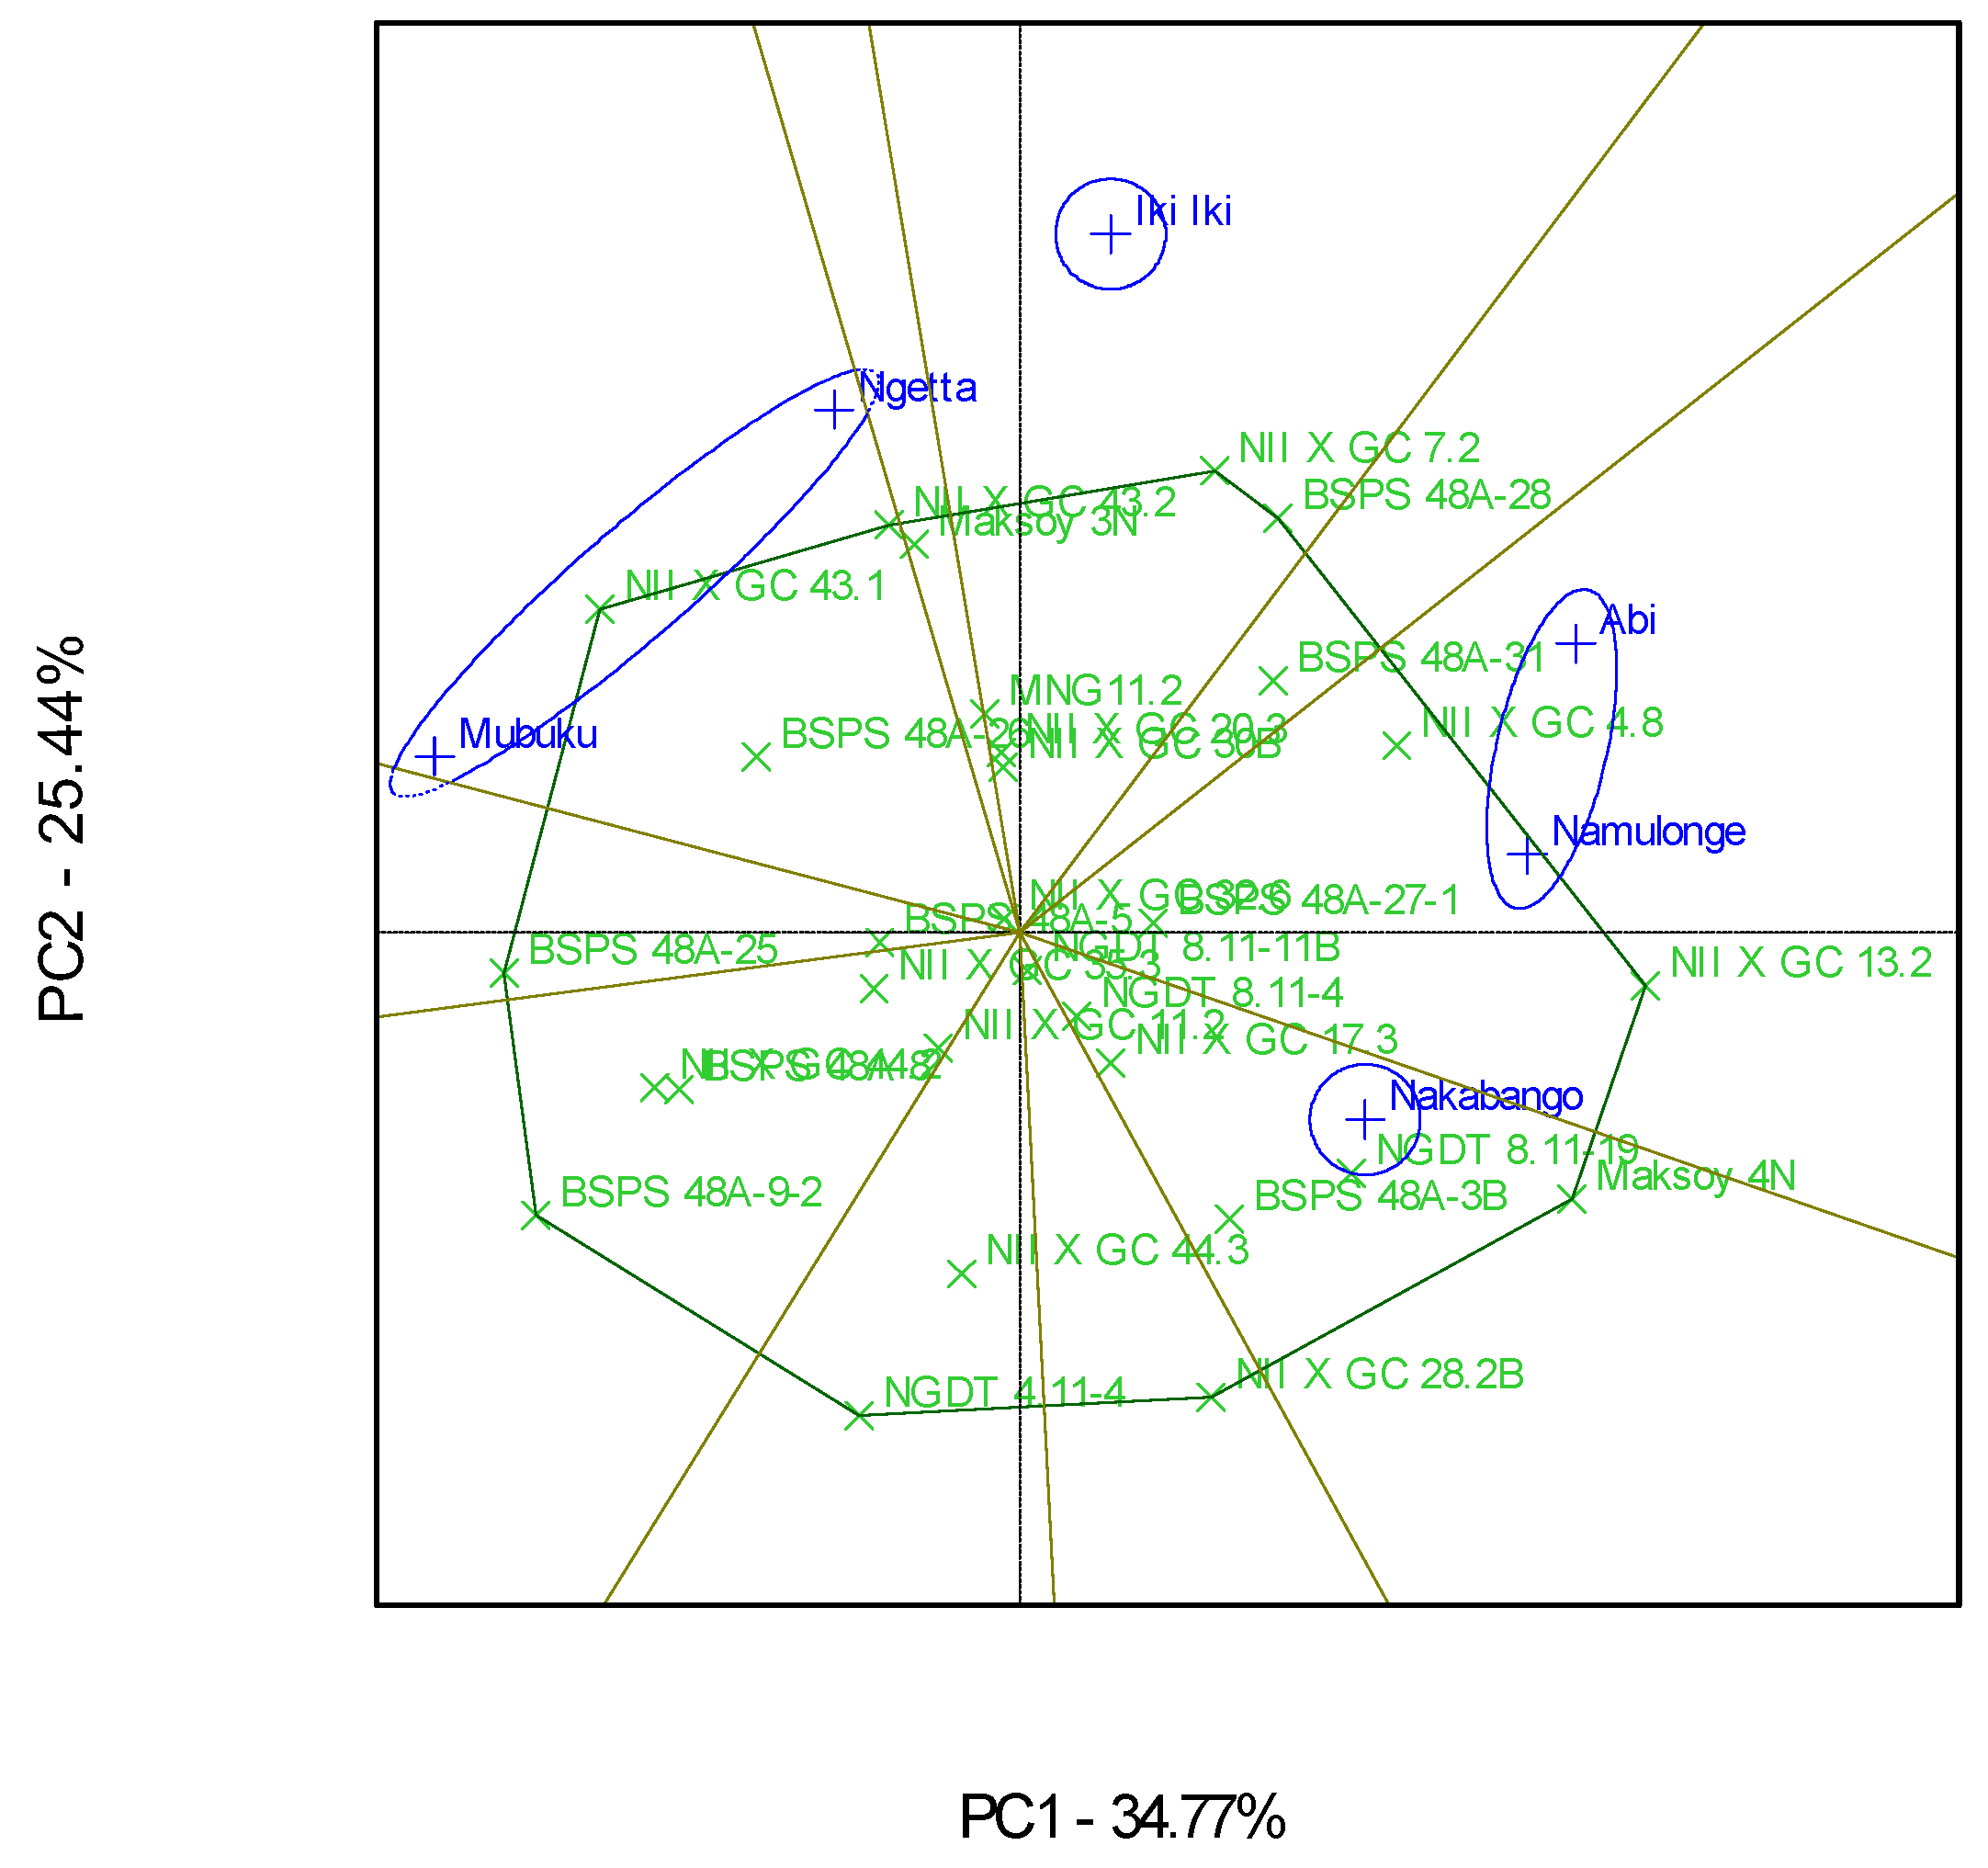
3.2. Which-Won-Where Patterns and Stability of Genotypes for Protein Content

The genotype and genotype × Location interactions for the traits were visualized in Ranking GGE, “Which-Won-Where” GGE, and the discriminating and representative environment GGE biplot analysis, as represented in Figure 2, Figure 3 and Figure 4. The GGE biplots explained 60.21% of the total interaction variations, distributed as 34.77% and 25.44% between principal component (PC)1 and PC2, respectively. Genotype NII X GC 7.2 had a high protein content and was very stable across the six locations (Figure 2). This genotype was the highest performer, as it was furthest from the mean along the “average environment axis” [32]. The biplot showed that most of the genotypes’ protein contents did not deviate much from the mean (Figure 2).
The “Which-Won-Where” GGE biplot gave a fair visual assessment of the genotype and genotype × Location interactions for the protein contents (Figure 3). The six locations were grouped into four mega-environments; the first one included Mubuku and Ngetta, the second one had Abi and Namulonge, and the third and fourth included Iki-Iki and Nakabango, respectively (Figure 3). Genotypes NII X G C 43.1, NII X G C 13.2, NII X G C 7.2, and Maksoy 4N won in their respective mega-environments (Figure 3). Location Iki-Iki was detected as the most discriminating environment compared to the other locations (Figure 4). This was revealed by the long length of Iki-Iki vectors from the origin (Figure 4). Namulonge was the most representative of the test locations compared to the rest due to the average environment axis’ small angle (Figure 4).

3.3. Grain Yield Performance of Genotypes across Locations

The grain yield data were normally distributed as illustrated by the QQ plot (Figure 5). A significant difference (p < 0.001) among the genotypes; locations; and subsequent interactions: Genotype × Location and Location × Season for seed yield were found (Table 5). Genotypes BSPS 48A-28 and BSPS 48A-9-2 had the highest mean yield of 1207 kg ha−1 (Table 6). The two check varieties Maksoy 3N and Maksoy 4N had yields of 1131 kg ha−1 and 1135 kg ha−1, respectively. Bulindi had the highest mean yield of 1598 kg ha−1, followed by Nakabango and Mubuku, with yields of 1438 kg ha−1 and 1345 kg ha−1, respectively (Table 6).

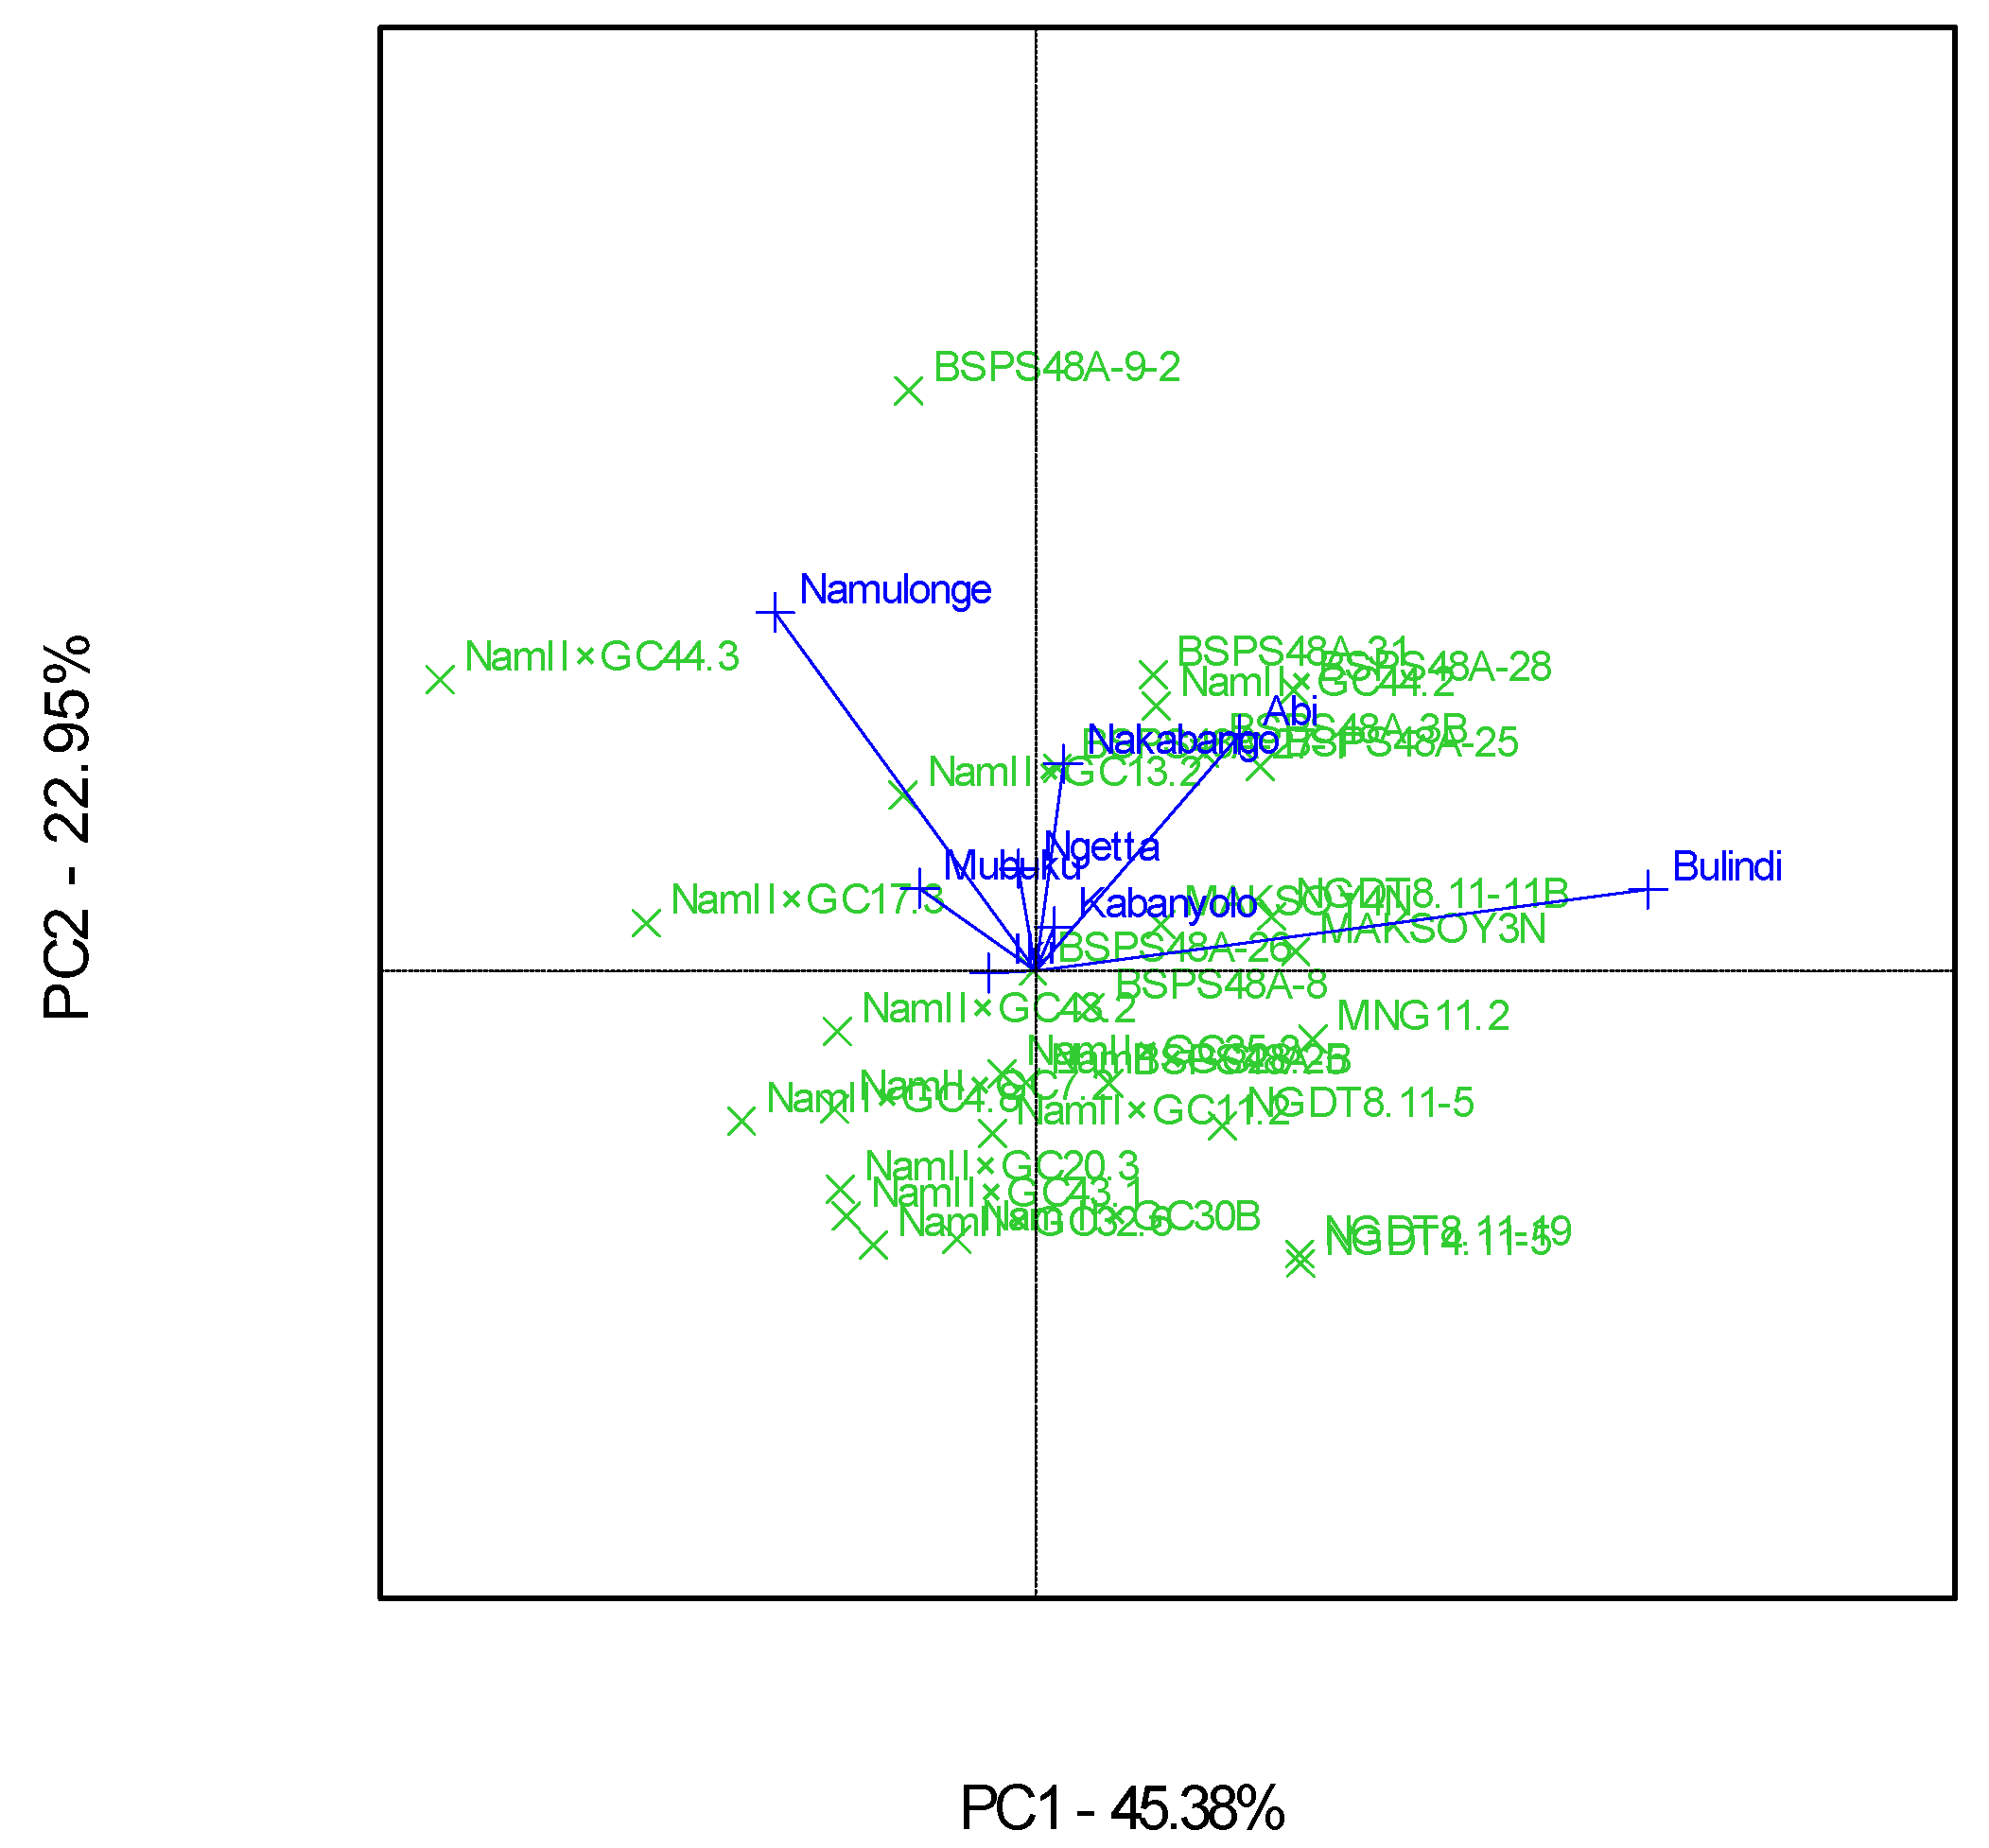
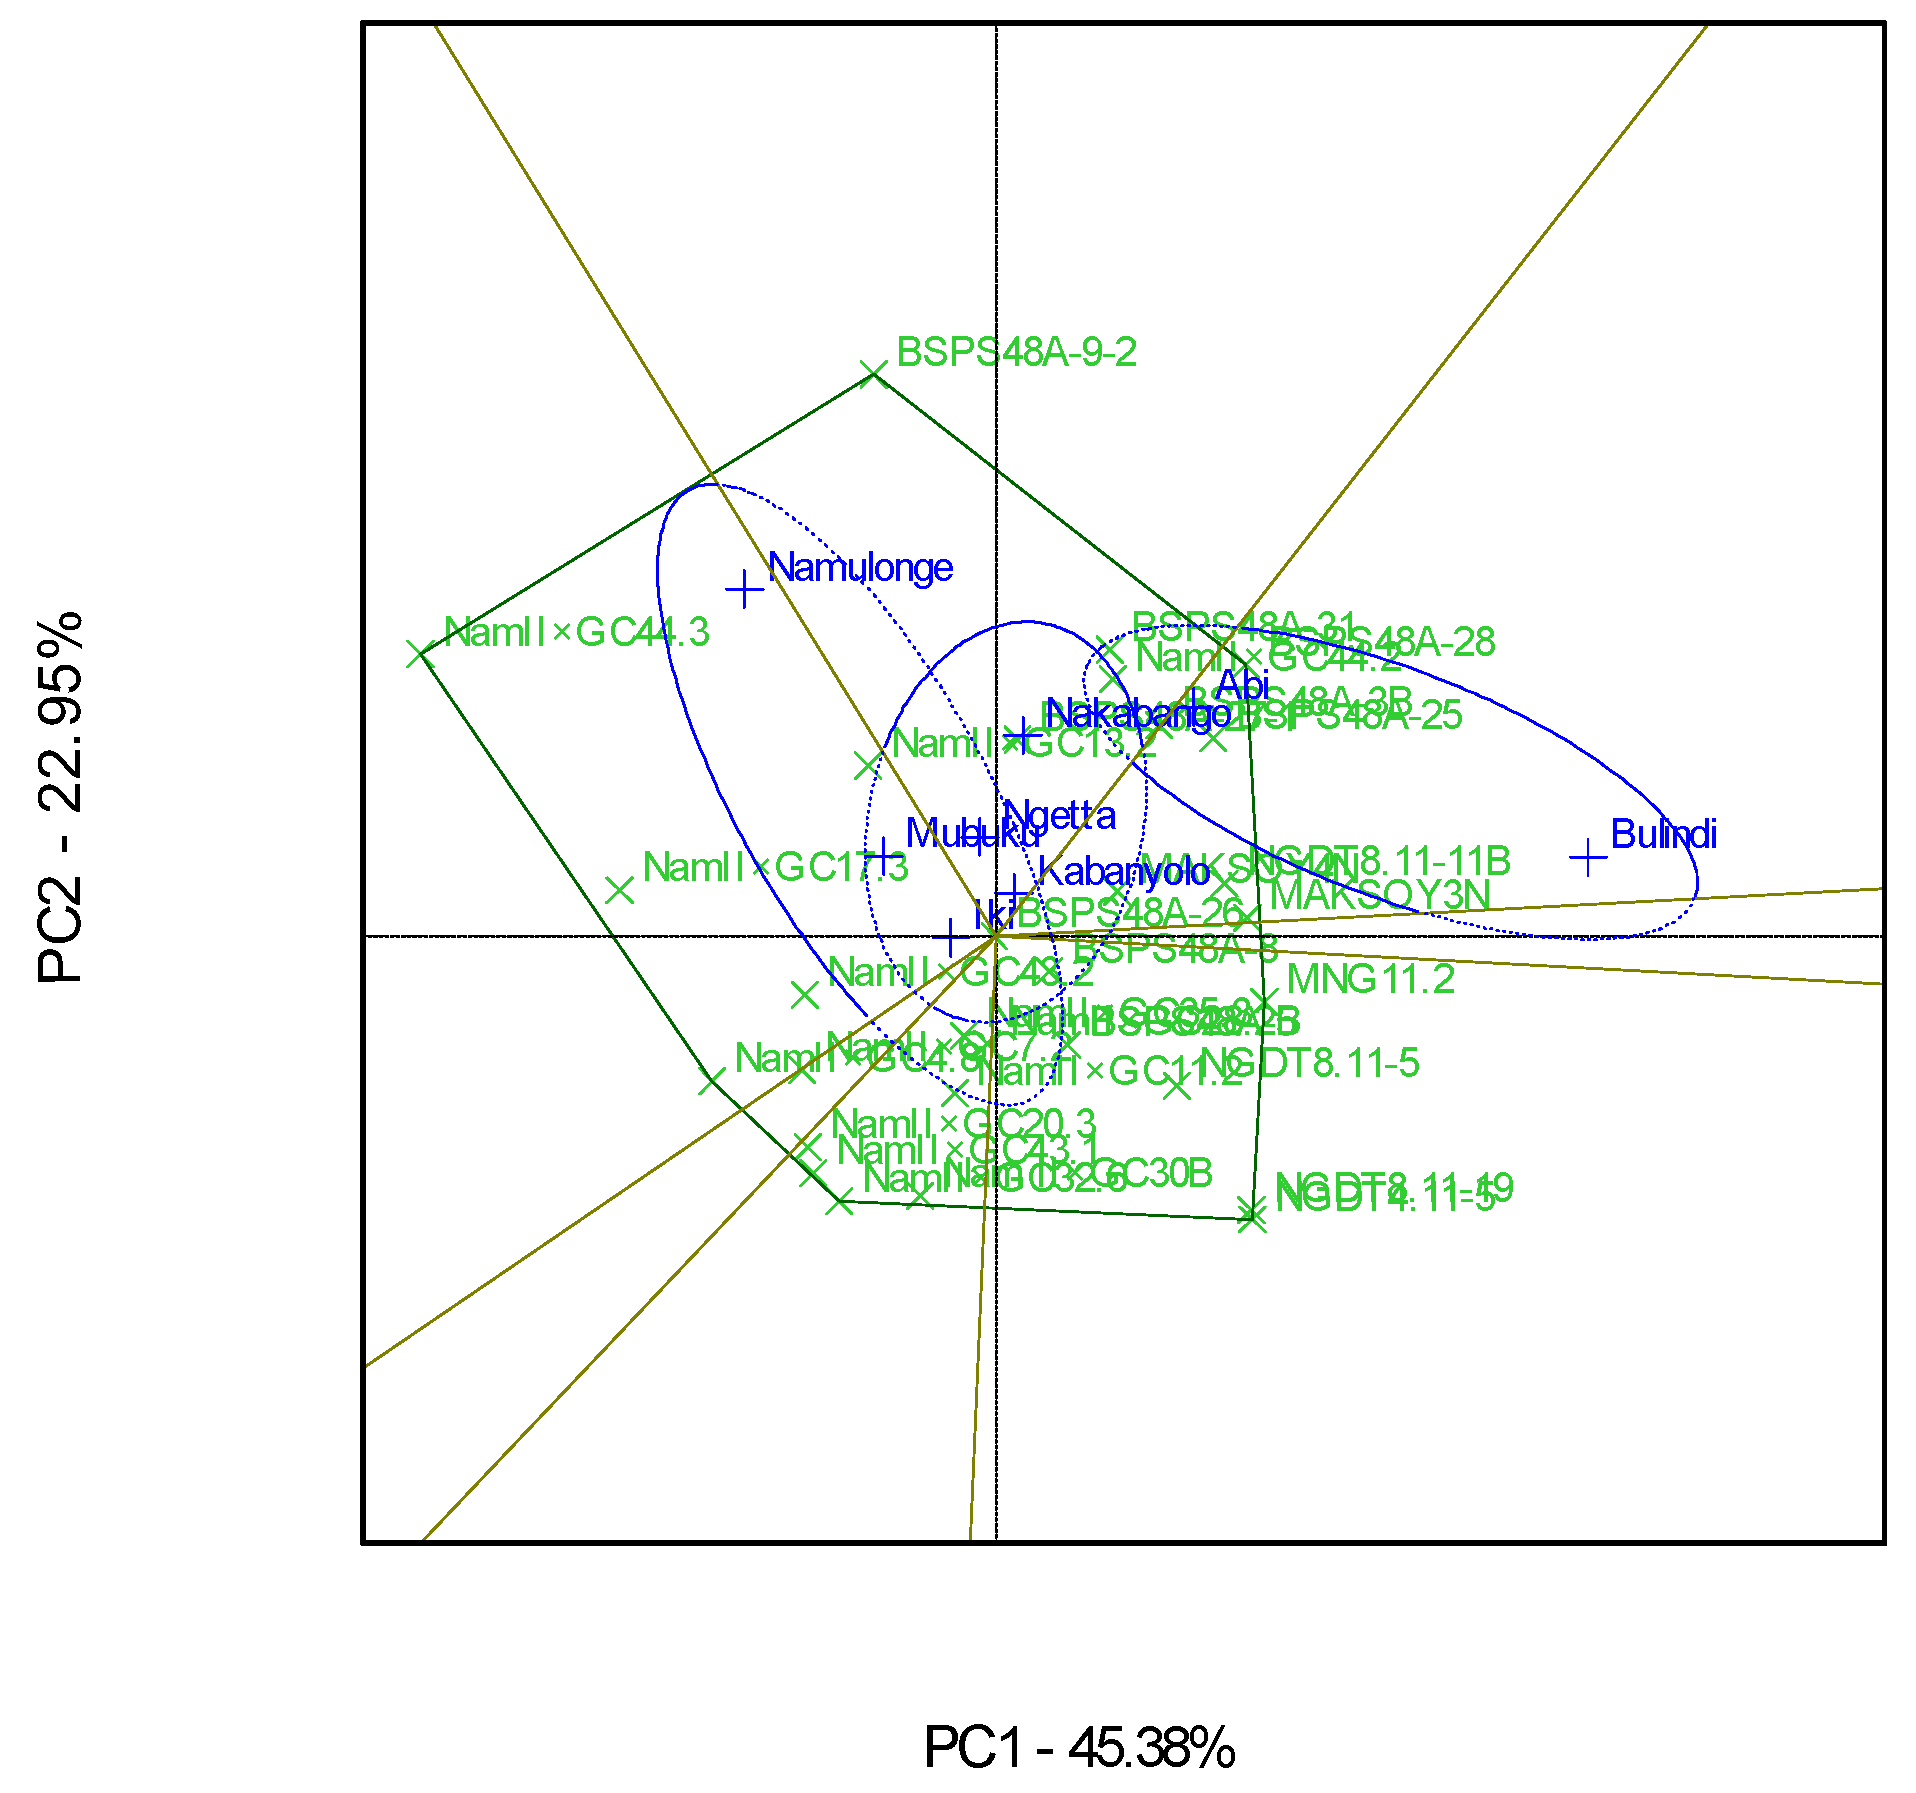
3.4. “Which-Won-Where” Patterns and Stability of Genotypes for Grain Yield

A ranking GGE biplot analysis showed that genotype BSPS 48A-9-2 was the best performer, though it was relatively unstable across the eight locations (Figure 6). This genotype was the highest performer, as it was furthest from the mean along the “average environment axis” [32]. On the other hand, Nam 2 × GC 30B was the most stable genotype, yet very low yielding, while Nam 2 × GC 44.3 was the least stable genotype. In comparison, Nam 2 × GC 44.2 was both a high-yielding and stable genotype (Figure 6).
The GGE polygon plot gave a fair visual assessment of the GEI, with both PC1 and PC2 explaining 68% of the total GEI sum of squares (Figure 7). The eight locations were grouped into three major mega-environments for the grain yields. The first mega-environment included Namulonge, Mubuku, and Iki-Iki, with the best genotype being Nam 2 × GC 44.3. The second mega-environment included Ngetta, Nakabango, and Kabanyolo, with the best genotype being BSPS 48A-9-2. The last mega-environment included Abi and Bulindi, with the best genotype being BSPS 48A-28 (Figure 7).
The GGE scatterplot showed that Bulindi was the most discriminating environment, while Iki-Iki was the least of the eight locations (Figure 8). This was revealed by the long and short environment vectors of Bulindi and Iki-Iki, respectively. Bulindi was the most representative of the mega-environment of all the eight test environments compared to the rest due to the small angle from the average environment axis (Figure 8).

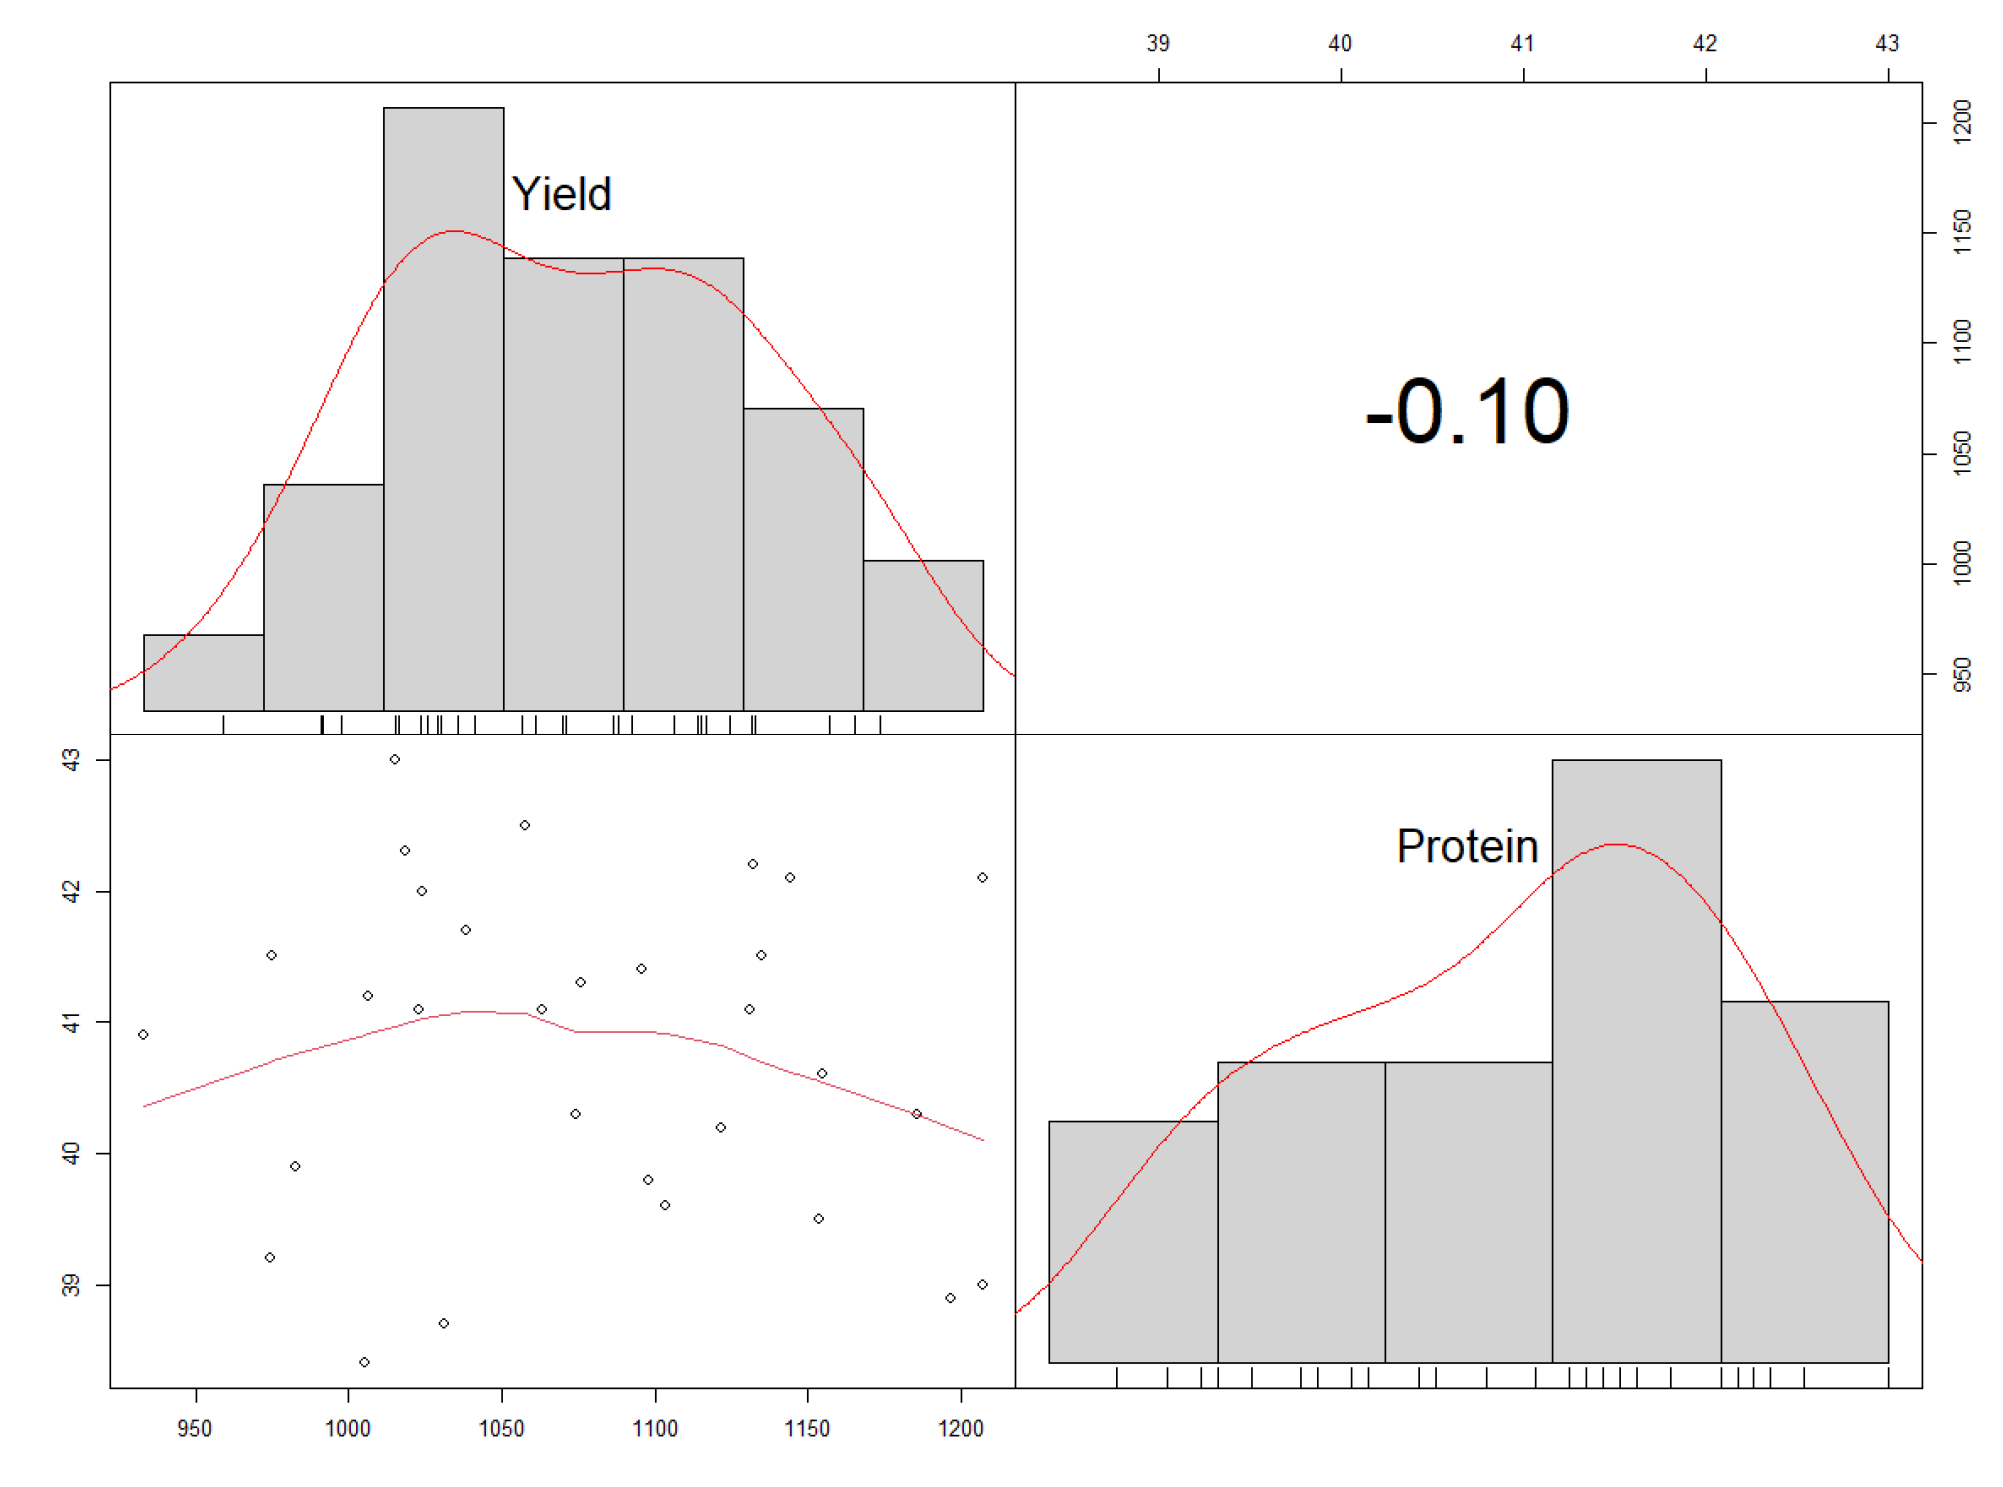
3.5. Correlation Analysis for Protein Content (%) and Yield (kg ha−1)

A significant but weak and negative correlation (r = −0.1**, d.f. = 29) was found between the protein content (%) and yield (kg ha−1) (Figure 9). This was reflected in the genotype performances. For example, genotype Nam 2 × GC 44.3 had a high protein content while its yield was low. On the other hand, genotypes BSPS 48A-9-2 and Nam 2 × GC 44.2 had higher yields than all the different genotypes but had low protein contents.

4. Discussion

4.1. Protein Performance and Stability

The present study illustrated a narrow range of 4.6% between the soybean genotypes with the highest and the lowest protein contents. The majority of the genotypes had protein contents close to the mean value. This was probably because most of the evaluated genotypes were advanced breeding lines that are progenies of two major crosses (Nam 2 × GC and Duiker × GC). Therefore, there was low diversity in terms of the test genotypes used in this study. However, highly significant genotypic differences in the protein contents observed suggested that the selection for protein contents among the studied soybean genotypes was still possible.
The first three soybean genotypes with the highest protein contents were progenies of the Nam 2 × GC 00138-29 cross. Nam 2 is a Ugandan variety, which was a selection from TGM 79, obtained from IITA. The parent has a high protein content and has a better general combining ability for the protein content when crossed with most soybean parents. Commercial Ugandan soybean varieties Namsoy 4M and Maksoy 6N derived from the parents have high protein contents of 43.0% and 41.0%, respectively [1,33]. On the contrary, most of the progenies from Duiker × GC 00138-29 crosses have protein contents below or slightly beyond the average of 40.8%. The parents (Duiker and GC 00138-29) were chosen to combine for rust resistance and seed quality characteristics preferred by farmers. Duiker originated from Zimbabwe and was used as a female parent during the generation of the crosses because of the beautiful seed color—a cream seed coat and yellow hilum. On the other hand, GC00138-29 is a soybean variety obtained from AVRDC in Taiwan and was used as a source of soybean rust resistance in Uganda. This is evident in the commercial varieties Maksoy 3N and Maksoy 4N derived from the same cross and used as local checks. Maksoy 3N and Maksoy 4N registered average protein contents of 41.1% and 41.5%, respectively. Therefore, soybean varieties developed from Duiker × GC crosses are good for several traits like high yields, beautiful seeds, and large-seeded but average in terms of protein contents.
Soybean protein contents are also significantly influenced by environment and genotype × environment interactions. The significant effect of genotype × environment is that the protein contents in soybean are a quantitative trait [13,14,15,16]. This finding suggests that changes in environmental conditions resulting from the cultivation of soybean genotypes in different locations can influence the protein contents. Such an observation agrees with previous studies that reported a significant effect of the genotype × environmental interaction for protein contents in multilocational field trials [13,15,34,35].

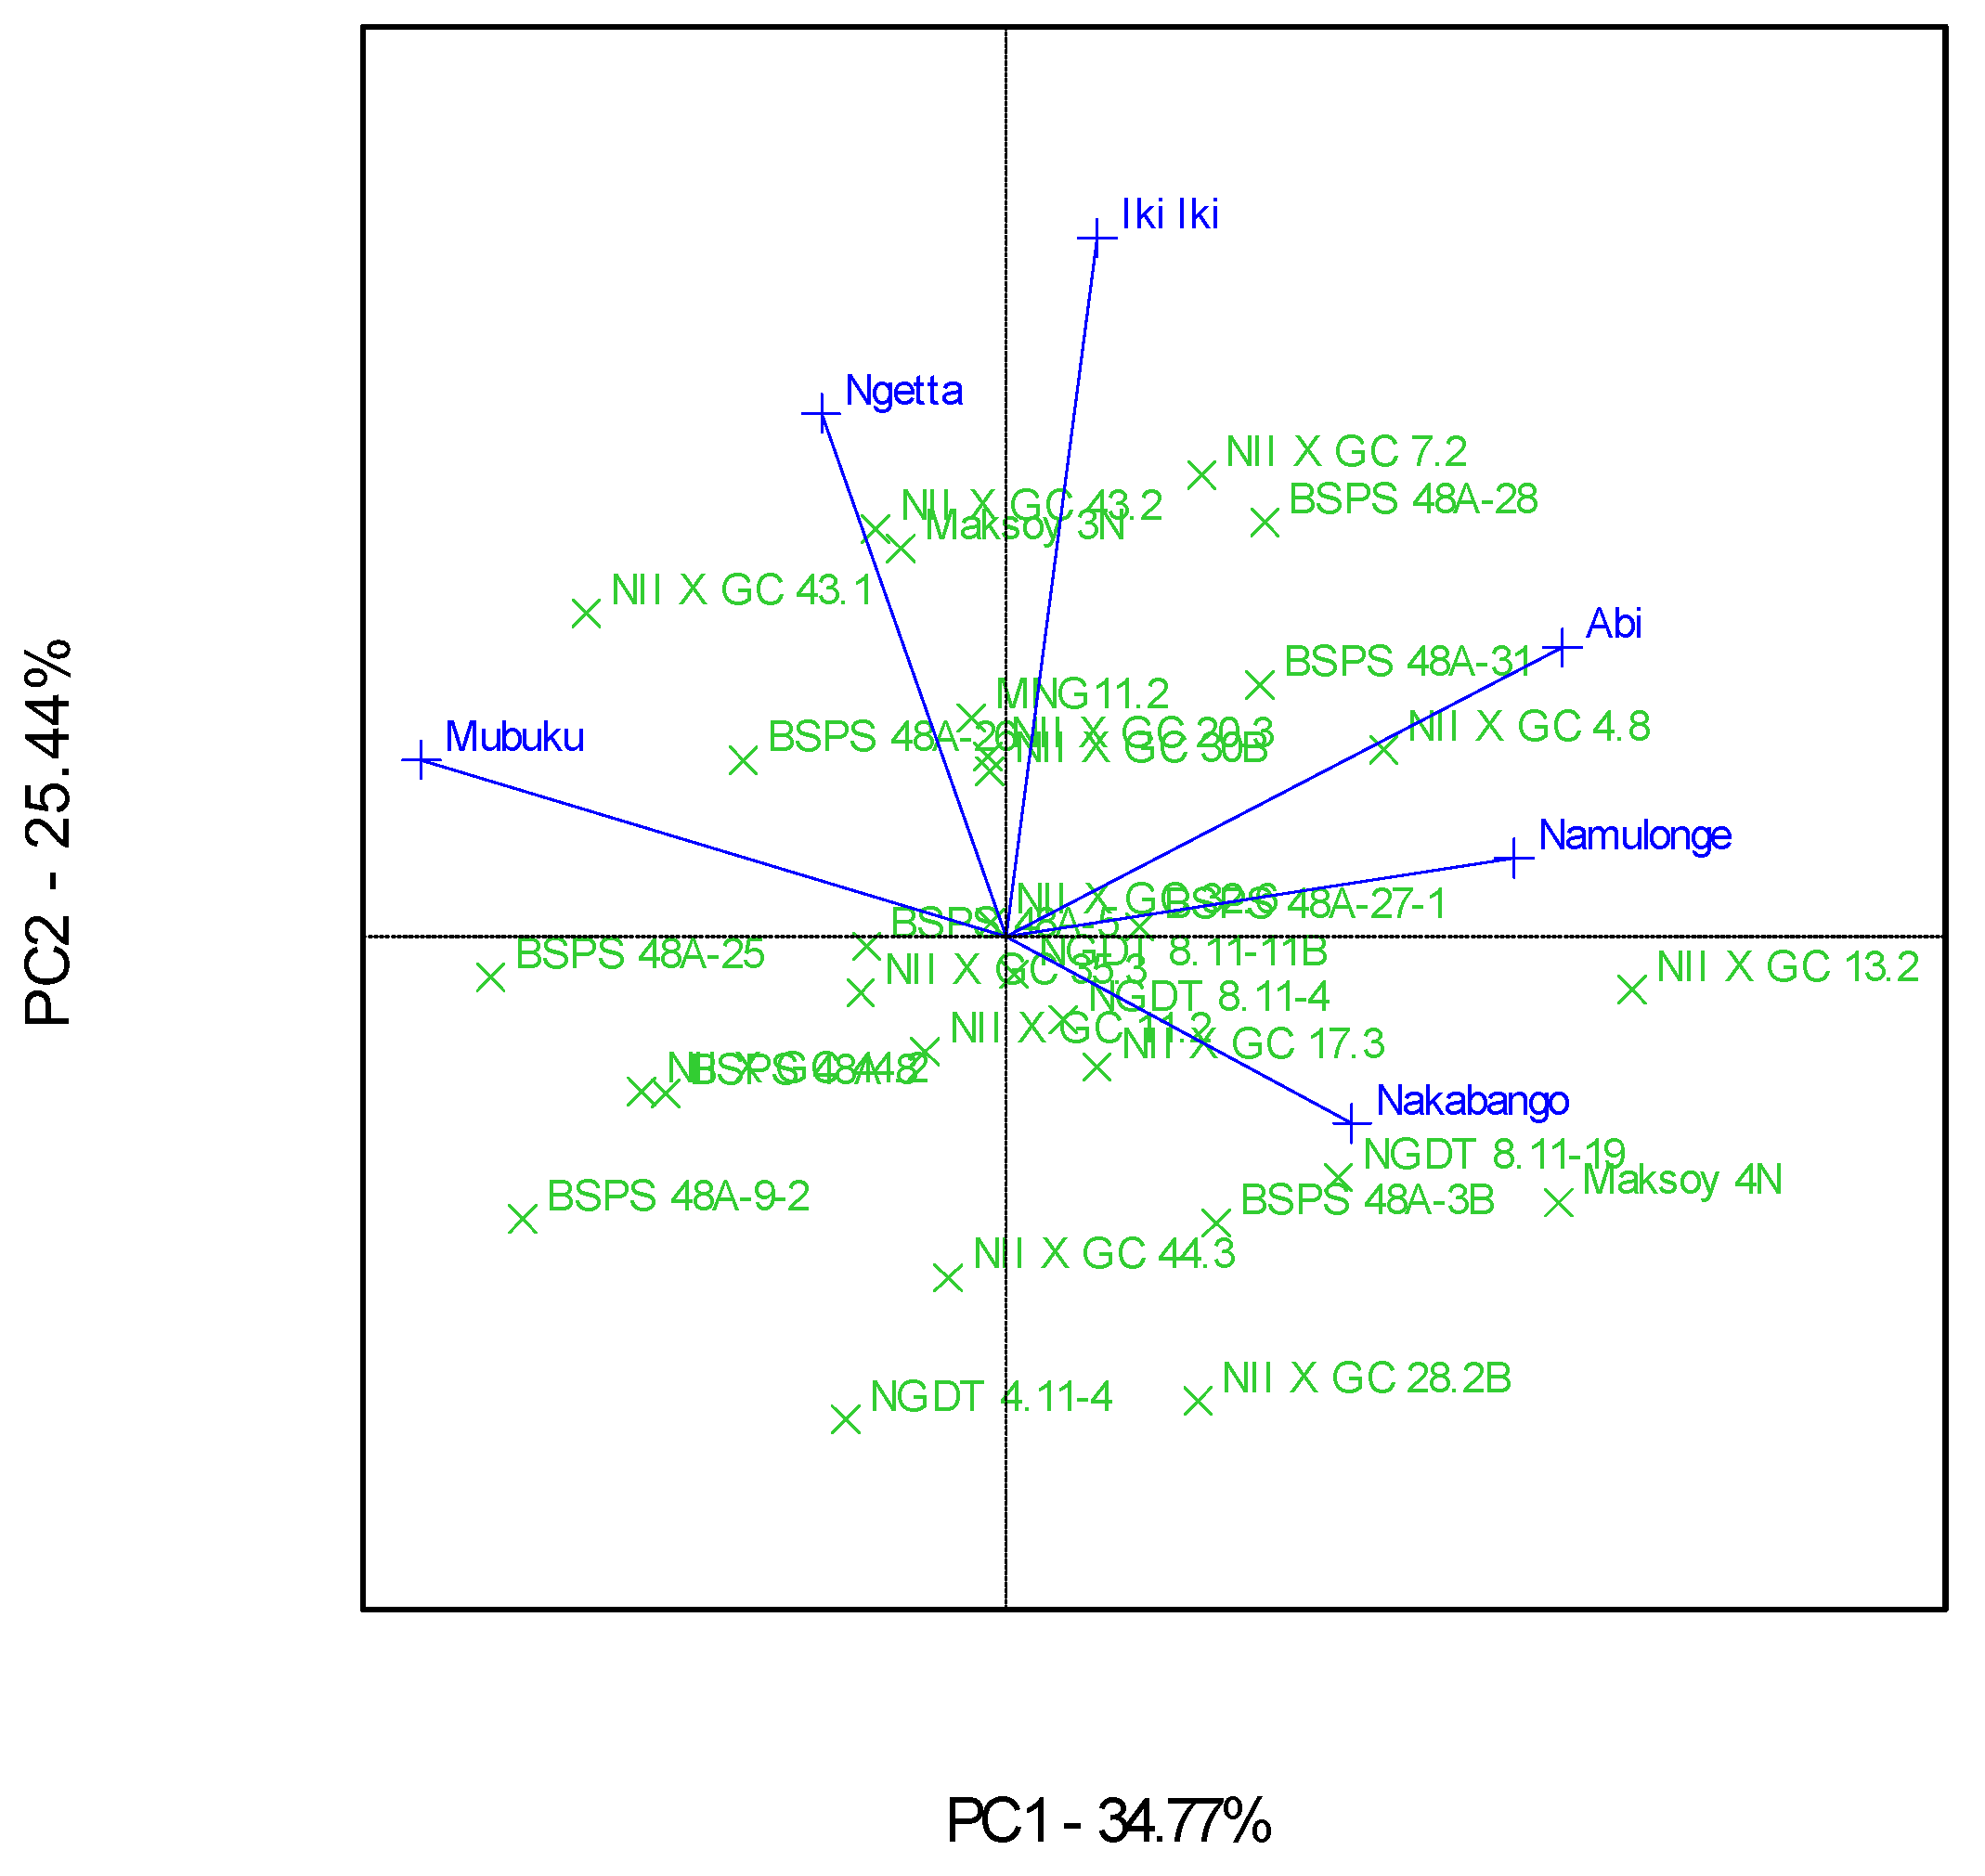
4.2. Clustering Test Environments Concerning Protein Content (%)

Nakabango had the highest protein content of 42.5%, followed by the Mubuku irrigation scheme and Iki-Iki. These three locations had higher protein contents than the others, because they had higher temperatures and lower rainfalls during the bean formation stage. Previous studies have shown that high temperatures and low rainfalls during the bean formation stage significantly lead to increased protein contents. Ojo et al. [15] reported that locations with higher temperatures have higher protein contents than locations with low temperatures. Similarly, Mudenda [35] reported a significant negative correlation between the soybean protein content and high rainfall. The four mega-environments for protein contents observed could be associated with the differences in the temperatures and rainfalls in the locations. This probably resulted in the differences in the behaviors of the genotypes for the protein contents in the test environments.
Additionally, the biplots identified Iki-Iki as the most discriminating location for the protein contents. This observation implies that Iki-Iki is the best location for evaluation of the protein contents in soybeans in Uganda. Namulonge was identified as the most representative location for protein contents in Uganda because of the narrow angle between their respective vectors and “average environment axis”. This implies that Namulonge can represent the other test environments used in this study for their protein contents [29,32].

4.3. Yield Performance and Stability

The majority of the genotypes performed better than Maksoy 3N and Maksoy 4N, which are the most farmer-preferred and high-yielding varieties in Uganda. BSPS 48A-9-2, derived through a single plant selection from BSPS 48A, had the highest yield level compared to all the other genotypes. BSPS 48A was released in Uganda as Maksoy 3N as the highest-yielding genotype [11]. However, through continuous single-plant selection, this variety’s yield has been greatly improved and stabilized. BSPS 48A-9-2 had a high yield and average stability, implying that its yield responds following the prevailing conditions. Such genotypes that display high yields and average-to-low stability tend to have higher yields when the prevailing conditions like moisture and soil fertility are favorable. Therefore, with increased input use such as fertilizer, such genotypes tend to have high yields, useful for both smallholder and commercial farmers. On the other hand, Nam 2 × GC 44.2 was consistent in yield performance irrespective of the prevailing conditions, because it displayed narrow adaption [36,37]. Thus, genotype Nam 2 × GC 44.2 will have stable yields irrespective of the prevailing conditions. Such genotypes are recommended for low-input farming systems, because their performance does not change with the prevailing environmental conditions [37].

4.4. Clustering Test Environments Concerning Yield

Bulindi had the highest mean seed yield compared to the other seven locations. This was probably because of the soil’s high moisture content, since this location receives much rainfall for most of the time in the season. This contradicts a previous study by Tukamuhabwa et al. [12] that reported that Namulonge had the highest yields due to the high rainfall received throughout the different seasons. Yet another study by Tukamuhabwa et al. [11] showed that Nakabango was instead the highest-yielding test environment across five locations due to the high soil fertility and high amounts of rainfall received. According to Obua [38], Mubuku was reported as the highest-yielding environment compared to the other four test locations because of the available water in the soil through flood irrigation. These results suggest that soil moisture and soil fertility during the cropping season are the significant drivers of soybean seed yield in Uganda. The results further indicated that environmental conditions across Uganda vary significantly in space and time. The soybean-growing environments were clustered into three mega-environments. This is contrary to Tukamuhabwa et al.’s [11] observations, which showed that Uganda had two mega-environments for soybean seed yields when evaluating 24 soybean genotypes for three seasons in five locations. However, in the current study, evaluations were conducted in six seasons, and eight locations represented the diverse agro-ecological zones compared to those reported by Tukamuhabwa et al. [11]. The three mega-environments observed in this study suggest that successful soybean breeding and selections must be made in at least each of the selected mega-environments.
Bulindi, characterized by moderate rainfall and fertile loam soils, with a high moisture retention capacity, was the most discriminating test environment for soybean yields in Uganda in this study. This implies that Bulindi provides much information about the differences among the genotypes evaluated, which was in agreement with the study conducted by Tukamuhabwa et al. [11]. Although the test genotypes used in the current study were different from those used by Tukamuhabwa et al. [11], Bulindi was reported as the most discriminating environment. The high discriminative power of Bulindi makes it an excellent location to be used as a primary testing location for differentiating soybean genotypes for yields and can be used as a “culling environment” for the quick elimination of unstable genotypes during the evaluation process [39]. On the other hand, Bulindi was also the most representative environment, because it had the smallest angle between its vector and “average environment axis”. This implies that Bulindi can represent the other test environments used in this study for soybean yields.

4.5. Correlation between Protein Content (%) and Yield (kg ha−1)

The study showed a negative correlation between the protein contents and yields of the studied soybean genotypes. The negative correlation between the protein contents and yields of the studied soybean genotypes agrees with previous studies. Helms and Orf [24] evaluated ten soybean populations in seven environments. They found out that the selection among the studied populations for increased protein contents led to a decrease in yield by 110 kg ha−1, while the protein contents increased by 5 g kg−1. Cober and Voldeng [40] evaluated single-cross and rapid backcross-breeding methods to achieve protein contents and high seed yields; the studied populations exhibited very low or no association between the two traits (r = −0.06 to −0.21). Another study by Filho et al. [23] reported a negative and significant correlation between the protein contents and grain yields when eight populations were evaluated to assess the effect of selection on high protein contents and yields. The negative correlation between the protein contents and yields implied that the selection for high protein contents negatively affects the grain yields.

5. Conclusions

Genotype Nam II × GC 7.2 had a high and stable protein content, while its yield was low. Soybean breeders will require special efforts to introgress high grain yield quantitative trait loci in such genotypes through appropriate breeding methods like recurrent selection or marker-assisted breeding. The breeding method should minimize the loss of high protein content alleles, given the negative correlation between the traits. Furthermore, the soybean breeding program should also explore more new sources of superior alleles for their protein contents due to the smaller range in protein contents observed. The genotypes BSPS 48A-9-2, BSPS 48A-31, and Nam 2 × GC 44.2, with high and stable yields, should be further tested under farmers’ production conditions for the selection and release as new soybean varieties in Uganda. BSPS 48A-9-2 is recommended for high-input farming systems, because it has broad stability, while Nam 2 × GC 44.2, with narrow stability, for low-input production systems. Therefore, genotypes with broader stability should be recommended for commercial farmers who have access to production inputs, while genotypes with narrow stability should be recommended for resource-poor farmers who have limited access to suitable production technologies. A highly discriminating environment such as Bulindi should be used as a primary location for evaluating or producing soybean genotypes. The negative correlation between protein and grain yield implies that the two traits cannot be improved simultaneously. Therefore, soybean breeders can select for either high protein contents and moderate grain yields or high grain yields and moderate protein contents.

Author Contributions

Conceptualization: T.O., T.L.O. and P.T.; methodology: T.O. and F.N.; formal analysis: J.P.S. and B.A.; writing—original draft preparation: T.O., B.A. and J.P.S. and writing—review and editing: G.T., S.B.M. and M.N. All authors have read and agreed to the published version of the manuscript.

Funding

This research was funded by the BecA-ILRI Hub through the Africa Biosciences Challenge Fund (ABCF) program. The ABCF program is funded by the Australian Department for Foreign Affairs and Trade (DFAT) through the BecA-CSIRO partnership, the Syngenta Foundation for Sustainable Agriculture (SFSA), the Bill & Melinda Gates Foundation (BMGF), the UK Department for International Development (DFID) and the Swedish International Development Cooperation Agency (Sida).

Acknowledgments

The authors thank Makerere University for providing the experimental materials used in this research and the BecA-ILRI Hub for the laboratory space to conduct the research.

Conflicts of Interest

The authors declare no conflict of interest.

References

  1. Tukamuhabwa, P.; Obua, T.; Namara, M.; Okii, D.; Kabayi, P.; Yiga, G. Soybean Research and Development in Uganda: Highlights 2002–2018; Makerere University: Kampala, Uganda, 2019. [Google Scholar]
  2. Agralytica, United Soybean Board Connections 2012: Soybean Market Scan. 2012. Available online: https://unitedsoybean.org/wp-content/uploads/Soybean-Market-scan-report-final.pdf (accessed on 21 June 2021).
  3. FAO. 2018. Available online: http://www.fao.org/faostat (accessed on 21 June 2021).
  4. WWF. The Growth of Soy Impacts and Solutions. 2014. Available online: http://issuu.com/wwfsoyreport/docs/wwf_soy_report_final_jan_19/1?e=10667775/6569194 (accessed on 21 June 2021).
  5. Singh, P.; Kumar, R.; Sabapathy, S.N.; Bawa, A.S. Functional and Edible Uses of Soy Protein Products. Compr. Rev. Food Sci. Food Saf. 2008, 7, 14–28. [Google Scholar] [CrossRef]
  6. Graham, P.H.; Vance, C.P. Update on Legume Utilization Legumes: Importance and Constraints to Greater Use. Plant Physiol. 2003, 131, 872–877. [Google Scholar] [CrossRef] [Green Version]
  7. Sanginga, P.C.; Adesina, A.A.; Manyong, V.M.; Otite, O.; Dashiell, K.E. Social Impact of Soybean in Nigeria’s Southern Guinea Savanna; IITA: Ibadan, Nigeria, 1999; pp. 1–34. [Google Scholar]
  8. Tukamuhabwa, P.; Oloka, H.K. Soybean Research and Development in Uganda. A Case of Paradigm Shift in an African University; Makerere University: Kampala, Uganda, 2016. [Google Scholar]
  9. Obua, T.; Nabasirye, M.; Namara, M.; Tusiime, G.; Maphosa, M. Yield stability of tropical soybean genotypes in selected agro-ecologies in Uganda Yield stability of tropical soybean genotypes in selected agro-ecologies in Uganda. S. Afr. J. Plant Soil 2020. [Google Scholar] [CrossRef]
  10. Mukuze, C. Genetic Diversity and Genotype × Environment Interaction of Advanced Elite Soybean Genotypes in Uganda. Master’s Thesis, Makerere University, Kampala, Uganda, 2019. [Google Scholar]
  11. Tukamuhabwa, P.; Asiimwe, M.; Nabasirye, M.; Kabayi, P.; Maphosa, M. Genotype by Environment Interaction of Advanced Generation. Afr. Crop Sci. J. 2012, 20, 107–115. [Google Scholar]
  12. Tukamuhabwa, P.; Oloka, H.K.; Sengooba, T.; Kabayi, P. Yield stability of rust-resistant soybean lines at four mid-altitude tropical locations. Euphytica 2012, 183, 1–10. [Google Scholar] [CrossRef]
  13. Kumar, V.; Rani, A.; Solanki, S.; Hussain, S.M. Influence of growing environment on the biochemical composition and physical characteristics of soybean seed Influence of growing environment on the biochemical composition and physical characteristics of soybean seed. J. Food Compos. Anal. 2006. [Google Scholar] [CrossRef]
  14. Arslanoglu, F.; Aytac, S.; Oner, E.K. Effect of genotype and environment interaction on oil and protein content of soybean (Glycine max (L.) Merrill) seed. Afr. J. Biotechnol. 2011, 10, 18409–18417. [Google Scholar] [CrossRef]
  15. Ojo, D.K.; Adebisi, M.A.; Tijani, B.O. Influence of environment on protein and oil contents of soybeans seed (Glycine max (L.) Merril). Glob. J. Agric. Sci. 2002, 1, 27–32. [Google Scholar] [CrossRef]
  16. Piper, E.L.; Boote, K.I. Temperature and cultivar effects on soybean seed oil and protein concentrations. J. Am. Oil Chem. Soc. 1999, 76, 1233–1241. [Google Scholar] [CrossRef]
  17. Mulugeta, A.; Kidane, S.; Abadi, S.; Fisha, Z. GGE biplots to analyze soybean multi-environment yield trial data in north Western Ethiopia. J. Plant Breed. Crop Sci. 2013, 5, 245–254. [Google Scholar] [CrossRef] [Green Version]
  18. Adie, M.M.; Krisnawati, A.; Gatut-Wahyu, A.S. Assessment of Genotype × Environment Interactions for Black Soybean Yield using Ammi and GGE Biplot. Int. J. Agric. Innov. Res. 2014, 2, 673–678. [Google Scholar]
  19. Cheelo, P.; Lungu, D.; Mwala, M. GGE Biplot Analysis for Identification of Ideal Soybean [Glycine max L. Merrill] Test and Production Locations in Zambia. J. Exp. Agric. Int. 2017, 15, 1–15. [Google Scholar] [CrossRef]
  20. Anthony, P.; Malzer, G.; Sparrow, S.; Zhang, M. Soybean Yield and Quality in Relation to Soil Properties. Agron. J. 2012. [Google Scholar] [CrossRef]
  21. Yin, X.; Vyn, T.J. Relationships of Isoflavone, Oil, and Protein in Seed with Yield of Soybean. Agron. J. 2005, 97, 1314–1321. [Google Scholar] [CrossRef] [Green Version]
  22. Assefa, Y.; Purcell, L.C.; Salmeron, M.; Naeve, S.; Casteel, S.N.; Kovács, P.; Archontoulis, S.; Licht, M.; Below, F.; Kandel, H.; et al. Assessing Variation in US Soybean Seed Composition (Protein and Oil). Front. Plant Sci. 2019, 10. [Google Scholar] [CrossRef] [PubMed]
  23. Filho, O.M.; Sediyama, C.S.; Piovesan, N. Grain yield and seed quality of soybean selected for high protein content Grain yield and seed quality of soybean selected for high protein content. Pesqui. Agropecuária Bras. 2004, 39, 445–450. [Google Scholar] [CrossRef]
  24. Helms, T.C.; Orf, J.H. Protein, oil, and yield of soybean lines selected for increased protein. Crop Sci. 1998, 38, 707–711. [Google Scholar] [CrossRef]
  25. Wilcox, J.R.; Shibles, R.M. Interrelationships among seed quality attributes in soybean. Crop Sci. 2001, 41, 11–14. [Google Scholar] [CrossRef]
  26. Rotundo, L.; Westgate, M.E. Meta-analysis of environmental effects on soybean seed composition Field Crops Research Meta-analysis of environmental effects on soybean seed composition. Field Crops Res. 2009. [Google Scholar] [CrossRef]
  27. Lowry, O.H.; Rosebrough, N.J.; Farr, A.L.; Randall, R.J. Protein measurement with the Folin phenol reagent. J. Biol. Chem. 1951, 193, 265–275. [Google Scholar] [CrossRef]
  28. R Core Team. R: A Language and Environment for Statistical Computing; R Foundation for Statistical Computing: Vienna, Austria, 2020. [Google Scholar]
  29. Yan, W. GGE Biplot—A Windows application for graphical analysis of multi-environment trial data and other types of two-way data. Agron. J. 2001, 93, 1111–1118. [Google Scholar] [CrossRef] [Green Version]
  30. Yan, W.; Rajcan, I. Biplot analysis of test sites and trait relations of soybean in Ontario. Crop Sci. 2002, 42, 11–20. [Google Scholar] [CrossRef] [PubMed]
  31. Simko, V.; Wei, T. R Package ‘Corrplot’: Visualization of a Correlation Matrix. (Version 0.88). 2021. Available online: https://github.com/taiyun/corrplot (accessed on 21 June 2021).
  32. Yan, W.; Kang, M.S.; Ma, B.; Woods, S.; Cornelius, P.L. GGE biplot vs. AMMI analysis of genotype-by-environment data. Crop Sci. 2007, 47, 643–655. [Google Scholar] [CrossRef]
  33. Tukamuhabwa, P.; Obua, T. Soybean Production Guide in Uganda; Makerere University Agricultural Research Institute: Kabanyolo, Uganda, 2015. [Google Scholar]
  34. Gurmu, F.; Mohammed, H.; Alemaw, G. Genotype X environment interactions and stability of soybean for grain yield and nutrition quality. Afr. Crop Sci. J. 2010, 17. [Google Scholar] [CrossRef]
  35. Hampango, M. Stability Analysis for Oil and Protein Content in Soybean (Glycine max. L. merrill) Seed across Varying Environments. Master’s Thesis, University of Zambia, Lusaka, Zambia, 2016. [Google Scholar]
  36. Becker, H.C.; Leon, J. Stability Analysis in Plant Breeding. Plant Breed. 1988, 23, 1–23. [Google Scholar] [CrossRef]
  37. Lin, C.S.; Binns, M.R.; Lefkovitch, L.P. Stability Analysis: Where Do We Stand? Crop Sci. 1986, 26, 894–900. [Google Scholar] [CrossRef] [Green Version]
  38. Obua, T. Soybean Rust Diversity and Adaptation of Elite Soybean Lines to the Ugandan Environment. Master’s Thesis, Makerere University, Kampala, Uganda, 2013. [Google Scholar]
  39. Yan, W.; Kang, M.S. YGGE Biplot Analysis: A Graphical Tool for Breeders, Geneticists, and Agronomists; CRC Press: Boca Raton, FL, USA, 2003. [Google Scholar]
  40. Cober, E.R.; Voldeng, H.D. Developing high-protein, high-yield soybean populations and lines. Crop Sci. 2000, 40, 39–42. [Google Scholar] [CrossRef]
Figure 1. QQ plot showing the correlation between the protein content and normal distribution.
Agronomy 11 01265 g001
Figure 2. A GGE ranking biplot showing the mean performance and stability for the protein contents of 30 soybean genotypes evaluated in six locations.
Agronomy 11 01265 g002
Figure 3. GGE scatterplot based on symmetrical scaling for the “which-won-where” pattern of 30 soybean genotypes evaluated in six locations.
Agronomy 11 01265 g003
Figure 4. A GGE biplot showing the discriminating power and representativeness of test environments involving 30 soybean genotypes evaluated in eight locations and six seasons.
Agronomy 11 01265 g004
Figure 5. QQ plot showing the correlation between the grain yield and normal distribution.
Agronomy 11 01265 g005
Figure 6. A GGE ranking biplot showing the mean performance and stability for the seed yields of 30 soybean genotypes evaluated in eight locations and six seasons.
Agronomy 11 01265 g006
Figure 7. Polygon views of the GGE biplot based on the symmetrical scaling for the “which-won-where” pattern of 30 soybean genotypes evaluated in eight locations and six seasons.
Agronomy 11 01265 g007
Figure 8. A GGE biplot showing the discriminating power and representativeness of the test environments involving 30 soybean genotypes evaluated in eight locations and six seasons.
Agronomy 11 01265 g008
Figure 9. A corrplot showing the distribution and correlation between the protein contents and yields.
Agronomy 11 01265 g009
Table 1. Description of genotypes used in the study.
GenotypePedigreeComment
BSPS 48A-28 GC0038-29 × DuikerAdvanced line
BSPS 48A-9-2 GC0038-29 × DuikerAdvanced line
Nam 2 × GC 44.2 Nam 2 × GC0038-29Advanced line
BSPS 48A-25 GC0038-29 × DuikerAdvanced line
BSPS 48A-27-1 GC0038-29 × DuikerAdvanced line
BSPS 48A-3B GC0038-29 × DuikerAdvanced line
Nam 2 × GC 13.2 Nam 2 × GC0038-29Advanced line
MAKSOY 4N GC0038-29 × DuikerCheck Variety
BSPS 48A-31 GC0038-29 × DuikerAdvanced line
MAKSOY 3N GC0038-29 × DuikerCheck Variety
NGDT 8.11-11B Nam 2 × GC0038-29Advanced line
BSPS 48A-8 GC0038-29 × DuikerAdvanced line
BSPS 48A-26 GC0038-29 × DuikerAdvanced line
MNG 11.2 Nam 2 × GC0038-29Advanced line
Nam 2 × GC 35.3 Nam 2 × GC0038-29Advanced line
Nam 2 × GC 17.3 Nam 2 × GC0038-29Advanced line
Nam 2 × GC 44.3 Nam 2 × GC0038-29Advanced line
Nam 2 × GC 43.2 Nam 2 × GC0038-29Advanced line
BSPS 48A-5 GC0038-29 × DuikerAdvanced line
Nam 2 × GC 28.2B Nam 2 × GC0038-29Advanced line
Nam 2 × GC 11.2 Nam 2 × GC0038-29Advanced line
NGDT 8.11-4 Nam 2 × GC0038-29Advanced line
Nam 2 × GC 7.2 Nam 2 × GC0038-29Advanced line
Nam 2 × GC 20.3 Nam 2 × GC0038-29Advanced line
Nam 2 × GC 4.8 Nam 2 × GC0038-29Advanced line
NGDT 8.11-19 Nam 2 × GC0038-29Advanced line
NGDT 4.11-5 Nam 2 × GC0038-29Advanced line
Nam 2 × GC 30B Nam 2 × GC0038-29Advanced line
Nam 2 × GC 32.6 Nam 2 × GC0038-29Advanced line
Nam 2 × GC 43.1 Nam 2 × GC0038-29Advanced line
Table 2. Coordinates, altitude, annual temperature, and annual rainfall for the 8 locations used to evaluate the soybean genotypes for the yield and protein contents in Uganda.
LocationCoordinatesRegionAltitude (masl)Mean Annual Temperature (°C)Mean Annual Rainfall (mm)
Namulonge0°32′ N/32°37′ ECentral116022.61400
Nakabango0°29′ N/33°14′ EEastern121022.81400
Iki-Iki1°06′ N/34°00′ EEastern115624.71200
Ngetta2°17′ N/32°56′ ENorthern110324.71200
Mubuku0°13′ N/30°08′ EWestern100727.8750
Kabanyolo0°28′ N/32°36′ ECentral118021.41234
Bulindi1°41′ N/31°42′ EMid-West112222.91355
Abi3°04′ N/30°56′ EWest Nile121422.91404
Source: Meteorological station data at the study locations. masl = meters above sea level.
Table 3. Analysis of variance of 30 soybean genotypes evaluated for the protein contents (%) in six locations in Uganda.
SOVd.f.s.s.m.s.v.r.F pr.
Genotype291557.6553.713.50<0.001
Location5298.7974.704.87<0.001
Genotype × Location943256.3934.642.26<0.001
Reps27.813.910.250.775
Residual4136335.5115.34
Total54211,456.1521.14
SOV = Source of Variation, d.f. = degrees of freedom, s.s. = sum of squares, m.s. = mean square, v.r. = variance ratio and F pr. = Probability value.
Table 4. Protein content (%) of 30 soybean genotypes evaluated in six locations in Uganda.
GenotypeAbiIki-IkiMubukuNakabangoNamulongeNgettaMean
BSPS 48A-2534.6 45.239.739.243.140.3
BSPS 48A-2639.543.342.636.437.140.139.8
BSPS 48A-27-140.340.939.3-41.740.640.6
BSPS 48A-28-45.140.142.341.0-42.1
BSPS 48A-3143.242.439.844.741.242.042.2
BSPS 48A-3B42.037.536.541.739.839.639.5
BSPS 48A-540.240.045.244.438.9 41.7
BSPS 48A-838.341.043.840.935.138.639.6
BSPS 48A-9-2-37.1-42.235.841.039.0
Maksoy 3N-45.543.638.537.840.241.1
Maksoy 4N42.439.536.149.243.438.741.5
MNG11.241.242.3-40.6-41.541.4
NGDT 4.11-536.738.343.045.538.437.739.9
NGDT 8.11-11B42.041.341.439.638.438.540.2
NGDT 8.11-1941.139.434.9---38.4
NGDT 8.11-441.741.441.944.738.138.741.1
NII X GC 11.243.940.546.548.634.238.542.0
NII X GC 13.244.739.736.347.044.740.242.1
NII X GC 17.339.239.4--42.140.440.3
NII X GC 20.341.9 43.748.537.843.143.0
NII X GC 28.2B40.838.835.942.238.036.638.7
NII X GC 30B43.242.642.743.836.340.441.5
NII X GC 32.641.342.3-35.0-38.339.2
NII X GC 35.340.540.246.342.239.539.441.3
NII X GC 4.8-43.537.343.040.9-41.2
NII X GC 43.1- 46.536.539.6-40.9
NII X GC 43.240.743.5-42.4-43.242.5
NII X GC 44.2-38.941.238.335.340.738.9
NII X GC 44.340.538.242.945.3-38.441.1
NII X GC 7.244.146.140.443.438.741.142.3
Mean41.041.141.342.538.940.040.8
LSD3.10.03.55.33.01.44.5
CV5.612.38.210.911.97.29.2
LSD = least significant difference and CV = coefficient of variation.
Table 5. Analysis of variance of 30 soybean genotypes evaluated for the grain yield in eight locations and six seasons in Uganda.
SOVd.f.s.s.F ValueF pr.
Genotype2919,731,4204.37291.07 × 10−13
Location71.38 × 108126.761<2.2 × 10⁻¹⁶
Season51.44 × 108184.5312<2.2 × 10⁻¹⁶
Rep23,397,01410.91621.92 × 10−05
Genotype × Location20353,562,7301.69582.00 × 10−08
Genotype × Season14521,094,8740.9350.6958
Genotype × Location × Season6603.96 × 1083.8605<2.2 × 10⁻¹⁶
Residuals20943.26 × 108
SOV = Source of Variation, d.f. = degrees of freedom, s.s. = sum of squares, m.s. = mean square, v.r. = variance ratio and F pr. = Probability value.
Table 6. Seed yield (kg ha−1) of 30 soybean genotypes evaluated in eight locations and six seasons in Uganda.
Genotype AbiBulindiIki-IkiKabanyoloMubukuNakabangoNamulongeNgettaMean
BSPS48A-25 1180167481010241302148784211661186
BSPS48A-26 802139366010021348139183013571098
BSPS48A-27-1 1013138466910201372162889212601155
BSPS48A-28 131617097789391389149684311871207
BSPS48A-31 790179858089512591401133610001132
BSPS48A-3B 999172865793613591361104811431154
BSPS48A-5 64615486109731192136583811351038
BSPS48A-8 59616107619721524148386510171104
BSPS48A-9-2 1144134663893614001479150912051207
MAKSOY3N 945179766210621335127678311901131
MAKSOY4N 858159073510301316145380712891135
MNG11.2 83718146619961306139069710671096
NamII × GC30B 6371282767837125612287771015975
NamII × GC11.2 65514386678061463103890012271024
NamII × GC13.2 892121564910231564153696013161144
NamII × GC17.3 63890182895815281460109611871074
NamII × GC20.3 61911308639481414125382210721015
NamII × GC28.2B 86113107059501177132078211451031
NamII × GC32.6 5301180682950127112068161160974
NamII × GC35.3 61314656979691648129484910741076
NamII × GC4.8 493100973210081312140994411451006
NamII × GC43.1 931951649807115711487511070933
NamII × GC43.2 78310867298911572141781911661058
NamII × GC44.2 90316527499121411164997613251197
NamII × GC44.3 77274377191714831080170110391063
NamII × GC7.2 65111247079041520137585210151019
NGDT4.11-5 1052164163588411431014547945983
NGDT8.11-11B 95217796819541339132584810951122
NGDT8.11-19 8491763674898126010516269221005
NGDT8.11-5 70517336608211185124581410181023
Mean 93515986879811345143896311771141
LSD 504.37523.26413.13249.23328.40314.36485.84503.19
CV 37.2022.4471.9939.6236.1835.0780.4060.83
LSD = least significant difference and CV = coefficient of variation.
Publisher’s Note: MDPI stays neutral with regard to jurisdictional claims in published maps and institutional affiliations.

