Article

A Framework for Identification of Stable Genotypes Basedon MTSI and MGDII Indexes: An Example in Guar (Cymopsis tetragonoloba L.)

by
Niranjana Kumara Benakanahalli
1,*,
Shankarappa Sridhara
2,
Nandini Ramesh
2,
Tiago Olivoto
3,
Gangaprasad Sreekantappa
1,
Nissren Tamam
4,
Ashraf M. M. Abdelbacki
5,6,
Hosam O. Elansary
7,8,9,* and
Shaimaa A. M. Abdelmohsen
10
1
Department of Genetics and Plant Breeding, University of Agricultural and Horticultural Sciences, Shivamogga 577204, Karnataka, India
2
Center for Climate Resilient Agriculture, Universityof Agricultural and Horticultural Sciences, Shivamogga 577204, Karnataka, India
3
Department of Agronomic and Environmental Science, Federal University of Santa Maria, Santa Maria 97105-900, Brazil
4
Physics Department, Faculty of Science, Princess Nourah Bint Abdulrahman University, Riyadh 84428, Saudi Arabia
5
Applied Studies and Community Service College, King Saud University, Riyadh 11451, Saudi Arabia
6
Plant Pathology Department, Faculty of Agriculture, Cairo University, Cairo 12613, Egypt
7
Plant Production Department, College of Food and Agricultural Sciences, King Saud University, P.O. Box 2455, Riyadh 11451, Saudi Arabia
8
Floriculture, Ornamental Horticulture, and Garden Design Department, Faculty of Agriculture (El-Shatby), Alexandria University, Alexandria 21545, Egypt
9
Department of Geography, Environmental Management, and Energy Studies, University of Johannesburg, APK Campus, Johannesburg 2006, South Africa
10
Biophysics Department, Faculty of Science, Cairo University, Cairo 12613, Egypt
*
Authors to whom correspondence should be addressed.
Agronomy 2021, 11(6), 1221; https://doi.org/10.3390/agronomy11061221
Submission received: 19 March 2021 / Revised: 4 June 2021 / Accepted: 7 June 2021 / Published: 15 June 2021

Abstract

:
Guar, the most popular vegetable, is tolerant of drought and is a valuable industrial crop enormously grown across India, Pakistan, USA, and South Africa for pharmaceutically and cosmetically usable galactomannan (gum) content present in seed endosperm. Guar genotypes with productive traits which could perform better in differential environmental conditions are of utmost priority for genotype selection. This could be achieved by employing multivariate trait analysis. In this context, Multi-Trait Stability Index (MTSI) and Multi-Trait Genotype-Ideotype Distance Index (MGIDI) were employed for identifying high-performing genotypes exhibiting multiple traits. In the current investigation, 85 guar accessions growing in different seasons were assessed for 15 morphological traits. The results obtained by MTSI and MGIDI indexes revealed that, out of 85, only 13 genotypes performed better across and within the seasons, and, based on the coincidence index, only three genotypes (IC-415106, IC-420320, and IC-402301) were found stable with high seed production in multi-environmental conditions. View on strengths and weakness as described by the MGIDI reveals that breeders concentrated on developing genotype with desired traits, such as quality of the gum and seed yield. The strength of the ideal genotypes in the present work is mainly focused on high gum content, short crop cycle, and high seed yield possessing good biochemical traits. Thus, MTSI and MGIDI serve as a novel tool for desired genotype selection process simultaneously in plant breeding programs across multi-environments due to uniqueness and ease in interpreting data with minimal multicollinearity issues.

1. Introduction

‘Guar’, a synonym of cluster bean (Cyamopsis tetragonoloba (L.) Taub), is one of the underutilized legumes that finds a place as a popular vegetable and industrial-oriented crop. Its drought tolerance ability and wide application in industrial sectors due to galactomannan gum content present in the seed endosperm proves the significance of this crop. Guar is native to the Indian subcontinent of Asia, and it can be cultivated in various kinds of environment with least possible inputs requirement [1,2,3]. About 80 percent of the world’s guar production is contributed from India, USA, South Africa, and Pakistan [4]. Guar is extensively used for its gum content, called ‘Galactomannan’, which is a polysaccharide embedded in the endosperm of the seed and forms viscous gel even in cold water, and, due to its emulsifying and thickening, as well as stabilizing properties, this guar gum has been extensively used in food and other industries involving cosmetics, textiles, paper, oil drilling fracking, pharmaceuticals industries, and so on [5,6,7].
A seed of guar is comprised of nearly 14 to 17% of the seed coat, 35 to 42% of endosperm, and the remaining 43 to 47% is the germ content. The commercial component, guargum (galactomannan), will be in the endosperm of guar seeds up to an extent of 19–43%. The by-product obtained by processing of guar, known as Churi and Korma, has high protein content consisting of approximately 60% of the whole seed suitable for supplementing cattle and chicken fodder [8,9,10]. Indian and African people consume edible tender pods of guar as a vegetable because edible portion of tender pods contains 3.2 g protein, 10.8 g carbohydrates, 1.4 g fat, 57 mg Calcium, 4.5 mg Iron, and Vitamin A and C with 16 kcal energy and 80 g moisture per every 100 g [11,12]. Being a leguminous crop, guar can fix about 112.36 kg of N (Nitrogen) per hectare. There are reports that cotton rotated with guar has evidenced 15% increase in yield even without the application of nitrogen in cotton [13]. India occupies a major share in exporting different products of guar, like gum, splits, and meal, to many countries with 17.5% export share among the agricultural commodities during 2019–2020 The country has exported guar of 169.54 MT to various countries of the world, including Germany, Canada, United States of America, Australia, Russia, etc., accounting to worth of Rs. 1406 crores ≈186 million US$ in 2019–2020 [14] (Figure 1). Santonoceto et al. [15] used a novel set of SSR markers to characterize the guar accessions having desirable morphological and productive, as well as genetic, traits. But studies on guar genotypes performing better under varied environmental situations with desirable qualitative traits are meager. Thus, in the present study, it has been attempted to use multivariate techniques which could result in the selection of guar genotypes with economical yield and exportable gum content.
Assessing the interaction between genotypes and environment resulting in high yielding potential is needed. The yielding potential of the genotypes will be greatly affected if grown under different environmental conditions. The crop which performs better in varied climatic situations will be an ideal one [16]. Adaptability and stability of genotypes to different kinds of environments with low, marginal, and average, as well as high, yielding potential can be assessed by studying phenotypic characters of the crop cultivar. Grain yield is more complicated phenomena determined by polygenes and environmental factors. Thus, it becomes necessary to understand the effect of environment on genotype characters and its performance in a specified environmental condition, which can be achieved by studying genotype and environment interactions (GEI), along with stability analysis. Sound knowledge on the degree and pattern of GEI helps in minimizing redundant replications of temporal and spatial yield trails which, in turn, reduces the cost for evaluating genotypes [17]. This selection can be made using multivariate selection indices and one such widely used index is SH (Smith-Hazel) index developed by Smith [18] and Hazel [19]. However, this SH index works using inversion of phenotypic covariance matrix which suffers from multicollinearity issues, leading to poor selection of desirable genetic traits across different environmental conditions [20,21,22]. To overcome these multicollinearity constraints, recently proposed indexes, viz. the Multi-Trait Stability Index (MTSI) [23] and the Multi-Trait Genotype-Ideotype Distance Index (MGIDI) [24], have emerged as novel tools for selecting superior genotypes which could perform better across different environmental conditions with high stability in yield and desirable traits. Based on this background, the current study proposes a framework to identify suitable stable genotypes of guar for cultivation in Karnataka by using MTSI and MGIDI indices for multi-factorial multi-trait stability analysis towards identifying ideal and high yielding genotypes of with higher galactomannan content across varied environmental conditions.

2. Materials and Methods

2.1. Details of the Experimental Site and Study Environment

The genotypes stability experiment was set out in the campus of the University of Agricultural and Horticultural Sciences, Shivamogga, Karnataka, India, which resides at latitude of 13°55′, longitude of 75°34′, and an elevation of 640 m. The average annual rainfall of the station is 900 mm with the soil type of red sandy loam. The study was undertaken during consecutive three environments/seasons, i.e., kharif season in 2013, summer season of 2013–14, and kharif season in 2014. The details of date of sowing and harvesting during the different seasons are given in Table 1.

2.2. Plant Material, Design of the Experiment, and Cultural Practices

Eighty-five genotype accessions were collected from NBPGR (National Bureau of Plant Genetic Resources), Regional Research Station situated at Jodhpur, Rajasthan. Details of the genotypes employed in the present work are given in Table 2.
The design followed was a randomized complete block design (RCBD) to conduct the experiment in the field having three replications for all the 85 genotypes. The seeds of each genotype were sown at 30 × 10 cm spacing apart in five 1-m length cropping rows.

2.3. Traits Assessed

Ten quantitative traits and five biochemical parameters accounting for 15 traits in total were assessed.

2.3.1. Quantitative

Plant height represented as PH (cm), days to 50% flowering (DFF), days to maturity (DM), number of branches plant−1 (BRAN), clusters plant−1 (CP), pods plant−1 (PP), grains pod−1 (GP), Hundred seed weight as 100SW (g), and grain yield plot−1 as GY (g) are the quantitative traits assessed in this study.

2.3.2. Biochemical

Gum percent (GP), crude protein (PROTEIN), crude fat (FAT), ash, and carbohydrate (CARB) percent were analyzed.

Gum Percent

Estimation of guar gum involved galactomannan extraction followed by purification. A standardized procedure given by Das et al. [25], and then modified by Joshi [26] for gum extraction, was adopted in this study, and gum percent was estimated as follows:
Gum   percent = Weight   of   gum   powder   obtained × 100 Initial   weight   of   seeds   taken

Crude Protein Content, Crude Fat, Crude Fiber (FIBER), and Ash (ASH)

The seed samples of guar were grinded, sieved (1 mm size), and dried at 135 ± 2 °C for 2 h. This dried sample was then subjected to incineration in an electric muffle furnace to determine ash content at 600 °C for two hours. Crude protein, crude fat, and crude fiber contents were also determined by the procedures given by AOAC [27].

Total Carbohydrates

The percentage of total carbohydrates present in guar seeds was assessed by the differential method of nitrogen-free extraction as described by McDonald et al. [28], and the total carbohydrate percentage was calculated using the equation as follows:
% Carbohydrate = 100 − ∑ (% crude protein + % crude fat + % crude fiber + % ash + % moisture).

2.4. Analysis of Data with Statistical Method

Pooled analysis of variance and individual analysis of variance (ANOVA) was performed for each environment (E1, E2, and E3). The MTSI index was used to identify genotypes performing better and stable with multiple traits, thus exploiting wide adaptations. The MGIDI index was applied within each season to select genotypes that perform well in specific conditions, thus exploiting narrow adaptations. To identify the stable genotypes, stability analysis was carried out among the genotypes. In the present study, stability analysis over three environments by “metan” package, developed by Olivoto and Lúcio [29], was used. Since the data available under this study is limited, we propose here a framework for the identification of stable genotypes with multi-traits as an example by using Guar as test crop. This framework can be extended to other crops, as well as data sets, spread over several locations and seasons.
Based on the ideotype concept, the MTSI/MGIDI index the traits were rescaled by assigning 0–100 value for all the traits, where 0 defines the least valued trait, and 100 defines the most valuable/desired trait, which facilitates to define ideotype [30]. In the present investigation, most of the traits were assigned with increased values defining quantitative morphological traits of guar crop, which directly or indirectly correlates to the yield and quality of the gum content. Days taken to 50% flowering and days taken to maturity were assigned with decreased trait value to identify the short crop cycle, leading to high seed yield coupled with high gum content.

2.4.1. Mean Performance and Stability of Multiple Traits

Rescaling the Traits

The first step was to compute a stability analysis and obtain the WAASB index that is the Weighted Average of Absolute Scores from the singular value decomposition of the matrix of BLUPs for the genotype-environment interaction effect [31] for each genotype. Then, we rescaled both the mean performance (e.g., grain yield) and stability (WAASB index) to a 0–100 range, in which 0 is the most undesired value and 100 the most desired value [31]. The rescaled value of a given trait for the ith genotype for both mean performance (rYi) and stability (rWi) is given by Equation (1):
r Y i = r W i = η n j φ n j η o j φ o j   ×   ( θ i j η o j ) + η nj ,
where: ηnj = New maximum value for the jth trait after rescaling; φnj = New minimum value for the jth trait after rescaling; ηoj = Original maximum value of the jth trait after rescaling; φoj = Original minimum value of the jth trait after rescaling; θij = Original value for the jth trait of the ith genotype/treatment.
The values for ηnj and φnj for the traits in which negative gains are desired and for the stability of all traits (lower WAASB values are desired) would be ηnj = 0 and φnj = 100, whereas the traits in which positive gains are desired, then, the values will be vice-versa, i.e., φnj = 100 and ηnj = 0. In the rescaled two-way table (rYi or rWi), each column will have 0–100 range that considers the desired sense of selection (increase or decrease) and maintains the correlation structure of the original set of variables representing that the ideal treatment will be having a value of 100 for almost all the traits after rescaling.

The WAASBY Index

To account for the mean performance and stability of individual traits, the WAASBY index [31] was then computed.
W A A S B Y i = r Y i × θ Y + r W i × θ W θ Y + θ W ,
where WAASBYi is the superiority index for the ith genotype; rYi and rWi are the rescaled values (0–100) for the response trait (Y) and the stability (WAASB), respectively; and θ Y and θ W are the weights for the mean performance (e.g., grain yield) and stability (WAASB), respectively. In our study, we considered a higher weight for mean performance at the expense of stability. A two-way table containing the WAASBY index of each genotype in each trait (rXij) was then obtained and used in the following procedure.

Factor Analysis

The third main step is to compute an exploratory factor analysis with rXij to group correlated traits into factors and then estimate the factorial scores for each genotype as follows:
X = μ+ Lf + ɛ,
where: X = p × 1 vector of observations; μ = p × 1 vector of standardized means; L = p × f matrix of factorial loadings; f = p × 1 vector of common factors; and ɛ = p × 1 vector of residuals, being p and f the number of traits and common factors retained, respectively.
The eigen values and eigen vectors were obtained from the correlation matrix of rXij. The initial loadings were obtained considering only factors with eigenvalues higher than one. Then, the varimax rotation criteria [32] was used for estimating final loadings and for the analytic rotation. Then, the genotypes were scored following the equation:
F = Z (AT R−1)T,
where: F = gx × f matrix with the factorial scores; Z = g × p matrix with the (rescaled) standardized means; A = p × f matrix of canonical loadings; R = p × p correlation matrix between the traits; and g, f, and p refers to the number of genotypes, factors retained, and analyzed traits, respectively.

Ideotype Planning and the MTSI Index

By definition (Equation (1)), the ideotype has the highest rescaled value (100) for all the analyzed desirable traits. Thus, the ideotype can be defined by a l × p vector I such that I = [100,100…,100]. The scores for I is also estimated according to Equation (3).
The fourth step of the analysis is to estimate the multi-trait stability index [23] using the Equation (5):
MSTI i = j = 1 f F i j F j 2 0.5 ,
where the MTSI is the multi-trait stability index for the ith genotype, Fij is the jth score of the ith genotype, and Fj is the jth score of ideotype. The genotype with the lowest MTSI is then closer to the ideotype and, therefore, presents a high mean performance and stability (MPE) for all variables analyzed. The functions waasb and mtsi of the “metan” package [29] were used to compute the MTSI index.

2.4.2. Mean Performance of Multiple Traits within Environments

The multi-trait genotype-ideotype distance index (MGIDI) proposed by Olivoto and Nardino [24] was used to identify genotypes that perform well for most of the traits within each environment. The MGIDI has the same theoretical foundation as the MTSI (rescaling the trait, computing the factor analysis, and the distance from each genotype to the ideotype), with a key difference that the re-scaled matrix used to compute the factor analysis in the MGIDI is obtained with the BLUP for genotype (mean performance), rather than the WAASBY (mean performance and stability), in the MTSI. It is important to note that, if the weight for the mean performance ( θ Y ) in the MTSI is 100 for all traits under study, the genotype classification by the MTSI will become identical to the MGIDI since stability will not take into account. The genotype with the lowest MGIDI is then closer to the ideotype representing desired values for all the assessed traits within each environment.
The proportion of the MGIDI index of the ith genotype explained by the jth factor (ωij) was used to show the strengths and weaknesses of genotypes within each environment, and it was computed as:
ω i j = D i j 2 j = 1 f D i j 2 ,
where D2ij is the distance between the ith genotype and the ideotype for the jth factor. Factor with low contributions represents that the traits will be closer to ideotype. The functions gamem and mgidi of the “metan” package [29] were used to compute the MGIDI index. The analyses were conducted in collaboration with colleagues from King Saud and Princess Nourahbint Abdulrahman Universities.

2.4.3. Estimation of Heritability and Selection Differential

Heritability

Estimation of heritability in broad-sense heritability (h2) of all traits was calculated according to the formula as described by Allard and Bradshaw [33]:
h2 (Heritability)= [(σ2 G) / (σ2 P)] × 100,
where: h2 = heritability; σ2G = Genotypic variance; σ2P = Phenotypic variance.

Selection Differential(S)

It is computed as the difference between the mean of the selected parents (PS) and mean of the population before selection (PO) and is symbolized as (S). It is a measure of the phenotypic superiority of the selected parents over the population from which the parents were selected [34].
S = mean of PS—means of PO.

3. Results

3.1. Outcome by Analysis of Variance (ANOVA)

Typical multi-environment trials data was used to compute ANOVA by the function anova_ind for each environment with a randomized complete block design [35]. The outcome of ANOVA depicts that all the fifteen traits were statistically significant (p ≤ 0.05) in each of the environments studied (E1, E2, and E3). The variation in traits for 85 genotypes is depicted in Figure 2 for grain yield, and the remaining 14 traits in Figure 3 as box plots. Box plots represent the information on the range, mean, and variation concerning the trait it represents. Irrespective of the seasons and genotypes, the grain yield (GY) plant−1 ranged from 75 to 780 g with a coefficient of variation (CV) of 37.37 percent. Maximum variability is noticed for traits, like pods per plant and plant height. Meanwhile, the variation is least for gum percent and 100 seed weight. The CV was highest for the number of branches plant−1 (67.14%) with a range of 0 to 22, followed by clusters plant−1 (36.53%), carbohydrates (11.08), and the variation was least for days taken for maturity (3.97) with a range of 87–110 days. This indicates the variability of genotypes for different traits considered in this study.

3.2. Selection Across the Seasons with MTSI

Linear Correlation between Traits, Loadings, and Factor Delineation

The traits, such as pods plant−1 with plant height, pods plant−1 with clusters plant−1, number of branches with pods plant−1, No. of branches and grain yield with grains per pod, and gum trait with 100 seed weight, were positive and strongly correlated (r > 0.75 and p < 0.001), whereas the plant height with days to fifty percent flowering were negatively correlated.
The factors with eigen values >1 were retained (six factors). Table 3 depicts that these six factors account for about 68 percent out of the total variation recorded among the traits. Therefore, there are possibilities to reduce the dimensionality of data by keeping high explanatory strength. The 15 traits under study were grouped into the six factors (FA) as follows:
FactorsTraits Considered
FA1Days taken to 50% flowering, Clustersplant−1, Pods plant−1, andcarbohydrates
FA2Plant height, Grains per pod−1, Grain Yield
FA3Days taken to maturity and Fiber traits
FA4Number of branches plant−1
FA5Protein andFat
FA6100 seed weight, Gum and Ash
Orthogonal rotation results to factor loadings which range from −1 to +1 and are the correlation coefficients among the traits and the factor.
MTSI index analysis assigns rank to all the 85 studied genotypes based on desired value of the trait (Figure 4). The selection pressure (~15%) was used to identify the top thirteen genotypes, which included IC-415106, IC-373480, IC-420373, IC-420332, IC-402299, IC-415131, IC-421798, IC-402301, IC-415115, IC-420320, IC-415158, IC-415123, and IC-415151, and which were further used to compute selection differentials. The selection differential is the difference in mean phenotype between individuals selected and the population mean.
The MTSI Index provided desired selection differential (SD) for 12 out of 15 studied traits with success frequency of 80% in selecting desired traits. The remaining three traits with undesired SD were Days to fifty percent flowering (SD = −2.11), Protein (SD = −0.12), and Ash (SD = −0.03). The top thirteen genotypes across the environment showed desired values for most of the guar traits. The selection differential (SD) percent for traits ranged from −5.80% (Days to 50% flowering) to 39.71% (Grain yield). The traits with high heritability were Grain yield (99%), followed by Protein and Gum (94%). The next best heritability percentage was observed in Days taken to 50% flowering (93%) and Fat, as well as the Carbohydrates (90%). The remaining traits showed little less heritability coupled with a high value of selection differential (Table 4).

3.3. Selection Within Seasons with MGIDI

Table 5 shows 13 superior guar genotypes selected in three different environments, i.e., E1, E2, and E3, based on the MGIDI index.

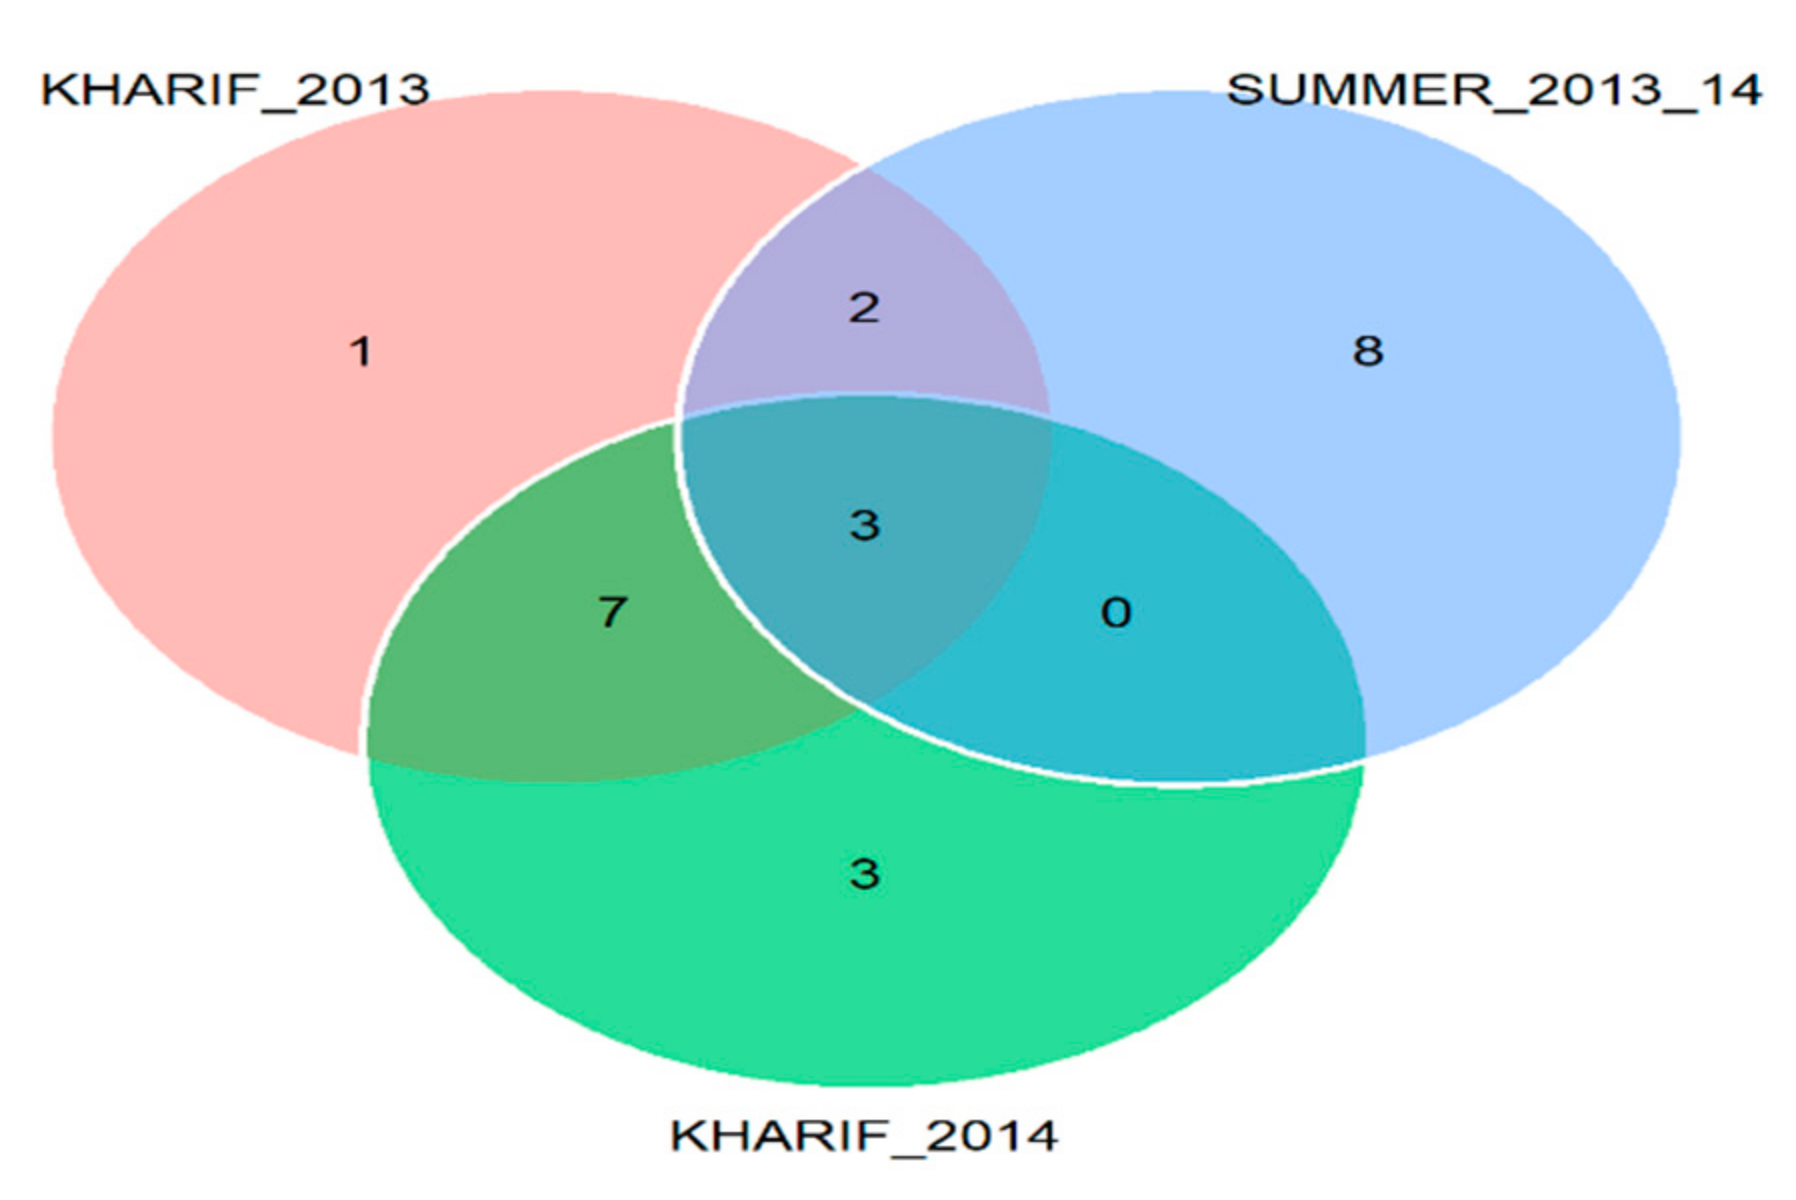
3.3.1. Coincidence Index

The coincidence index was computed based on comparing the genotypes selected within each environment. Three genotypes were found common across the environments, i.e., IC-415106, IC-420320, and IC-402301, as indicated in Venn plot (Figure 5 and Table 6).

3.3.2. Selection Gains within the Seasons

MTSI index provided selection gains within the seasons, and the results revealed that most of the traits under study contributed towards the selection of desired guar genotype during E1 and E2. Traits, viz. protein, DM, and DFF during E1 and gum content and protein, as well as DFF during E2,was found least contributing in the selection gain process. The selection differential percent in both the seasons was found higher for the grain yield and lower for the protein content (−5.16 and 37.21% in E1; and −6.88 and 31.39% in E2, respectively. However, the heritability percentage (h2) was highest for the grain yield, i.e., 97 and 96% in E1and E2,respectively, followed by protein content, with 94% during both seasons. In the case of E3, the SD percent varied from −10.33 (DFF) to 46.35 percent (Branches). The h2 was highest for grain yield (0.99%), followed by pods per plant (0.97%) (Table 7).

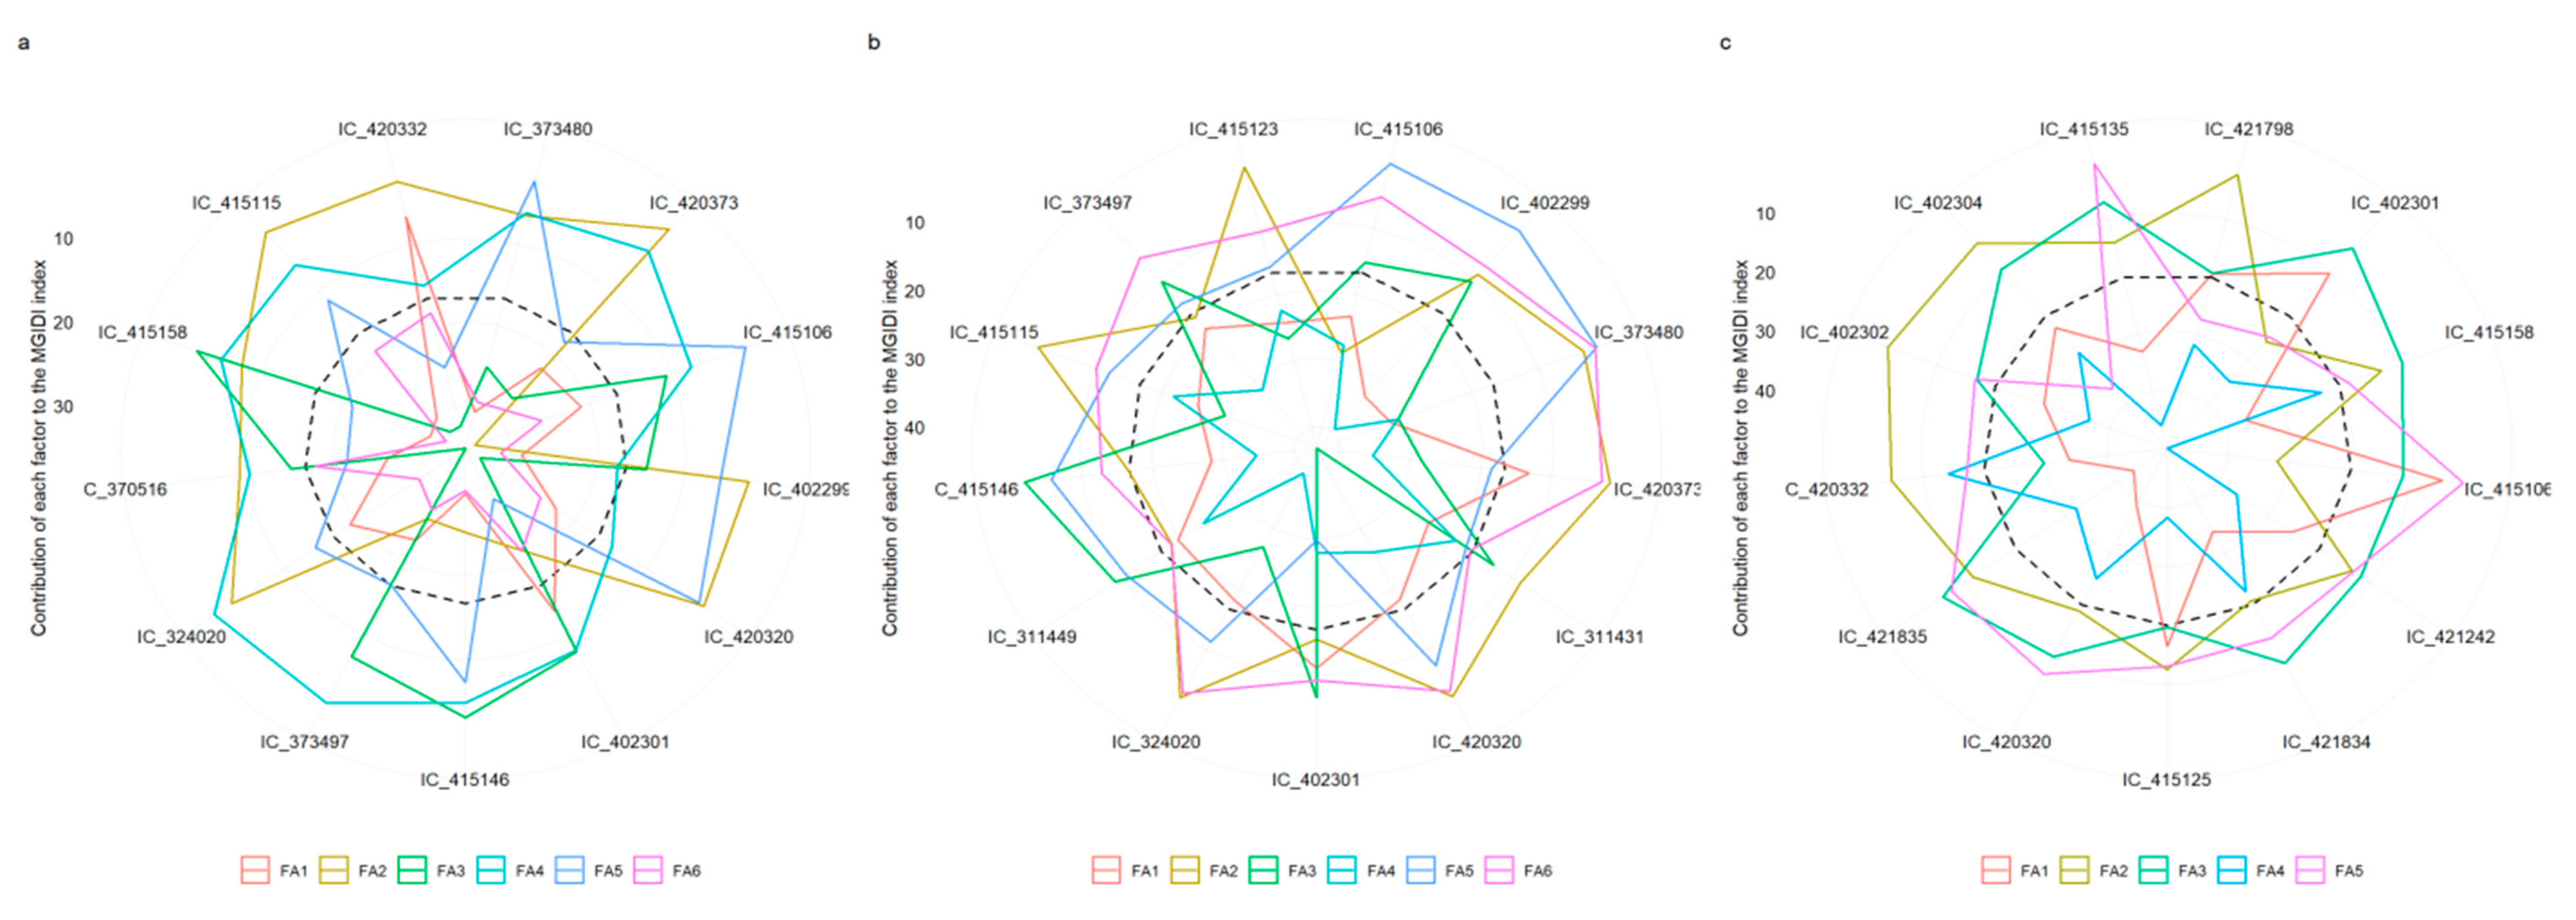
3.3.3. View on Strengths and Weakness of the Genotypes

Figure 6a–c depicts the genotype’s strengths and weaknesses. Factor’s contribution towards MGIDI is categorized into two as less and more contributing factors. The factors which contribute more were plotted close to the center, whereas lesser contributing factors were plotted towards the edge.
A view on strengths and weakness during E1 reveals that 13 selected genotype’s performance was more towards majority of traits in FA1 group, such as plant height, pods plant−1, and clusters plant−1, as well as the grain yield. Out of 13 genotypes, ten showed strength towards gum, protein, ash, and carbohydrates grouped under FA2. Days to maturity and fat (FA3) were found more contributing factors towards the selection of most of the genotypes, except IC-415158 and IC-415146. FA4 group was found less contributing in selecting genotypes. However, FA5 and FA6 groups showed strength towards the selection of genotypes in environment 1 (Figure 6a).
Figure 6b reveals that the selected genotypes in E2 had strength towards FA4, which was the most contributing factor for most of the genotypes selection. FA2 strength towards the selection of the genotypes IC_373497 and IC_415115. Most of the genotypes performed well in FA3 group, except IC-402301, IC-311431, and IC-402299. FA5 group stands out for the selection of genotypes, viz. IC_415106 and IC_402299, in the corresponding environment, whereas FA1 and FA6 showed little strength to the selected genotypes.
The strength and weakness view during E3isdepicted in the Figure 6c. Factor FA1 showed greater strength towards the most selected genotypes in the corresponding environment; however, IC-415125, IC-415106, and IC-402301 performed weakly. The factors FA2 and FA3 have weakness towards most selected genotypes. Most of the selected genotypes performed well within FA4. However, FA5 contribution was only for few selected genotypes, viz. IC-402302, IC-415135, and IC-415106 (Figure 6c).
The data pertaining to the traits of selected genotypes in comparison with the overall mean traits of all the genotypes, along with the coefficient of variation and the mean, as well as the range, is presented in the Table 8. It can be inferred that the selected genotypes were found to be superior for most of the traits compared to the overall mean traits of all the genotypes across the seasons. This clearly indicates the ability of the presented methodology in identifying the superior genotypes that can be employed as ideotypes for further breeding of guar towards high grain yield with superior biochemical traits.

4. Discussion

Guar/clusterbean is one of the most popular vegetable and commercially important crop extensively grown in semi-arid regions of India. Its drought tolerating capacity and nitrogen-fixing ability have made this crop suitable to drought-prone areas of India [12,13]. Among many leguminous crops grown in India, guar stands as a unique crop due to its gum content commercially known as galactomannan. The gum and its derivatives extracted from guar have significant role in various forms of industries, like textiles, cosmetics, paper, food, oil fricking and drilling, pharmaceuticals, and so on. Due to its wider applications in different industrial sectors, many countries import guar gum from India, contributing maximum towards foreign exchange earnings [14]. This urges a need to develop genotype/cultivar of guar with optimum yielding potential and qualitative gum content even when grown under varied environmental conditions. In this context, MET (Multi-Environmental Testing) serves as a tool that describes the adaptability, as well as stability, of genotypes across different environments [33]. To develop a stable genotype that performs better under different environmental situations, interaction between genotype and environment needs to be clearly understood [36]. Genotype-environment interaction is a very complicated process involving genetic and non-genetic factors. The genotype which outrages all the climatic vagaries and performs better at both congenial, as well as in unfavorable, environments is termed as ‘stable genotype’. Despite the good yielding potential, if the cultivar is not stable, that is of no use [37,38,39]. The selected genotype should be amenable towards crop management practices and soil fertility status which serves as a precursor for increasing yield and yield attributing traits of guar, along with qualitative commercially important gum content.
Genotypes cultivated under different environmental conditions will not respond similarly due to fluctuations in seasons, locational heterogeneity, and their complex interactions [40]. Thus, it is a great challenge to identify genotypes that remain stable across divergent environmental conditions [41]. Even though many researchers have identified genetic variation towards the adaptability process, inbreeding variation of the genotypes has not been exploited due to difficulties in describing and measuring phenotypic characters that determine stability [42]. Scientists also attempted to examine genotypic behavior under diverse climatic conditions, and a few such examples are: Comstock and Robinson [43], who studied interaction between genotype and environment involving genotype means at different locations in different years; and Finlay and Wilkinson [44], who measured phenotypic stability using statistical approach that was proved efficient in determining the genotype performance. They also showed that the relationship between genotype-environment would be linear if both the environment and genotypic factors follow similar scale of measurement. These results were based on two parameters they studied, i.e., means of genotypes and coefficients of regression. Highly fluctuating environmental conditions in the targeted area lead to bad performance of genotypes [45]. Blum [46] reported that yield trait should not be considered in selection procedure as it is highly influenced by environmental factors, leading to misinterpretation during estimation of genetic basis.
The traditional methods of stability analysis employed based on univariate and analyzed on mean, regression, and deviation from regression. Multivariate techniques were used to assess genotypic stability across divergent environments as univariate method proved inefficient in stability assessment [47]. As advanced in breeding techniques adoption of multi-trait selection index [18,19], most of the plant breeders are not interested in adopting this index either for initial trials [48] or advanced plant breeding trials [49] that are usually demonstrated in diverse environmental conditions [23,50,51,52]. As the efficiency of multivariate techniques to solve the multicollinearity issues seems to be high when dealing with multi-traits [21,23,53], therefore, to bridge the gaps in traditional methods of stability analysis, Olivoto and Nardino [24] developed an index that can overcome the defects of all the traditional methods, wherein all the selected traits favorably satisfy the breeding applications [54].
In this context, multivariate novel techniques, viz. MTSI and MGIDI indexes, were employed for identifying stable genotypes with multiple traits suitable for wider adaptations.

4.1. Analysis of Variance

The ANOVA being an additive technique fairly describes the main effects in stability analysis [55]. All the fifteen traits in each environment were found significant (p ≤ 0.05), and these results corroborate with the data reported in the literature of Jain and Patel [56]. They carried out an experiment to identify stable guar genotypes with phenotypic traits based on the performance of seed yield and stability index of thirteen guar genotypes at two stations for two years, wherein the variance shown significant for studied traits.

4.2. Genotypes Selection Based on Multivariate Approach

The results of the present investigation suggest that selection of stable guar genotypes based on multivariate analysis is effective and that most of the productive and adopted guar genotypes were influenced by most of the climatic factors, edaphic factors, and genetic factors, as well as with genetic and environmental interactions. Rashidi et al. [57] performed Additive Main Effects and Multiplicative Interaction (AMMI) technique to study chickpea grain yield as influenced by diverse environmental conditions, and the outcome revealed that the yield was mainly determined by genotype, environment, and their interaction. They also indicated nearly 82 percent variation in genetic traits and high fluctuating environment lead to larger differences in grain yield of bengalgram. The data analyzed in the present stability assessment study recommended that the three genotypes’, IC-415106, IC-420320, and IC-402301, performance was stable under divergent environmental conditions with desired values for the selected traits, such as plant height, grain yield, clusters plant−1, pods plant−1, and biochemical traits. These findings corroborate with Arunkumar et al.’s [58] report, where they conducted the multi-location trials on yield significance and a stability index based on the Eberhart and Russel [59] model and were also able to identify two genotypes out of ten genotypes shown stable performance across five locations to corresponding traits. The major issue is that the seeds of the guar crop become black for rain at the time of harvest. The selected guar genotypes are shown tolerance to discoloration for excess moisture at harvest.
View on the strengths and weaknesses (Figure 6) provided by MGIDI made an easy identification of genotype’s strengths, as well as weaknesses, depending on multiple trait framework. The selected genotypes (IC-415106, IC-420320, and IC-402301) had the high productive capability not only with grain yield also with gum, protein, fiber, and ash contents of the guar crop. A similar study was performed by Gabriel et al. [60] and Olivoto and Nardino [24], who studied 13 strawberry cultivars, wherein the strengths were reported towards high productivity, TSS, and flesh firmness for the Albion cultivar employing MGIDI index R-based package.
Most of plant breeders employed traditional stability indices analysis based on first-degree statistics. The decision to select the stable genotype on mean, regression, and deviation from regression parameters may be not sufficient to provide a simple interpretation of mean performance and stability of multiple traits. Therefore, the MTSI technique as “metan” R package is an advanced quantitative genetic tool to exploit suitable varieties in all crop species. These findings were similar to the work of Koundinya et al. [61], who tried to assess twenty-five cassava genotypes using MTSI to analyze genotype-environment interaction involving the traits, viz. leaf area index, yield per plant, harvest index, dry matter, and starch yield per plant. Out of 25 genotypes, four cassava genotypes namely, 8S501, Sree Athulya, CR43-7, and 9S127 stand out as desirable genotypes with better mean performance and stability under multi-environment conditions.
The importance/promptness of the MGIDI in evaluating field or commercial crop cultivars is known to expand extensively, and it is called adopting to Speed breeding. The essential point needs to be understood, and the ultimate goal of plant breeders is to explore the application of multivariate techniques in selecting suitable genotype with effective productivity performing better in varied environmental conditions. In the present investigation, the genotypes were categorized as desired and undesired based on multiple traits information (Figure 4). The genotype’s strengths and weakness assessment (Figure 6) serves as a novel tool to formulate better crop management strategies. Adoption of MTSI and MGIDI indexes in future stability assessment studies are known to minimize unnecessary calculations; thus, the recommendation of superior cultivars in plant breeding studies concerning field/commercial crops will be at ease.

5. Outcome of the Study

The multi-trait framework provided by the multi-trait stability index (MTSI) provides an easy way to select high-performance and stable cultivars in plant breeding experiments with guar (Cyamopsis tetragonoloba L.) that perform better at varied environmental conditions. In the present investigation, the genotypes selected by the MTSI index presented desired values for 13 out of 15 productive and biochemical traits. The view on genotype’s strengths and weakness assessed by selection procedure performed within environments using multi-trait genotype-ideotype distance index (MGIDI) indicated the importance of an ideal genotype with improved morphological quantitative traits, such as clusters plant−1, pods cluster−1, grains pod−1, branches plant−1, and plant height. In addition, the strengths of selected genotypes are due to productive crude protein, fiber, and gum. Overall, MTSI to identify wide adaptations, and MGIDI to identify superior genotypes within environments, provides a new framework of multivariate techniques to carry out stability assessment that will optimize the use of resources, as well as time, thus contributing to the sustainability of guar breeding programs worldwide.

Author Contributions

N.K.B. Field experimentation, collection of field data and lab analysis. S.S. Conceptualization, Methodology and final draft. N.R. Data curation, Writing—Original draft preparation. T.O. Software development, visualization and data analysis. G.S. Writing—Reviewing and Editing. N.T., A.M.M.A., H.O.E., S.A.M.A. financial support for manuscript publication, reviewing and editing. All authors have read and agreed to the published version of the manuscript.

Funding

This research received no external funding.

Data Availability Statement

The data presented in this study are available on request from the corresponding author.

Acknowledgments

This research was funded by the Deanship of Scientific Research at Princess Nourah Bint Abdulrahman University through the Fast-track Research Funding Program.

Conflicts of Interest

The authors declare not to have any conflict of interest.

References

  1. Krishnan, S.G.; Dwivedi, N.K.; Singh, J.P. Primitive weedy forms of guar, adak guar: Possible missing link in the domestication of guar [Cyamopsis tetragonoloba (L.) Taub.]. Genet. Resour. Crop. Evol. 2011, 58, 961–966. [Google Scholar] [CrossRef]
  2. Mudgil, D.; Barak, S.; Khatkar, B.S. Guar gum: Processing, properties and food applications—A Review. J. Food Sci. Technol. 2014, 51, 409–418. [Google Scholar] [CrossRef] [PubMed] [Green Version]
  3. Gresta, F.; De Luca, A.I.; Strano, A.; Falcone, G.; Santonoceto, C.; Anastasi, U.; Gulisano, G. Economic and environmental sustainability analysis of guar (Cyamopsis tetragonoloba L.) farming process in a Mediterranean area: Two case studies. Ital. J. Agron. 2014, 9, 20–24. [Google Scholar] [CrossRef] [Green Version]
  4. Sharma, P. Guar Industry Vision 2020: Single Vision Strategies; NIAM Research Report; Anurag Bhatnagar, IAS: Jaipur, India, 2012. [Google Scholar]
  5. Pathak, R.; Singh, M.; Henry, A. Genetic divergence in Cluster bean (Cyamopsis tetragonoloba) for seed yield and gum content under rainfed conditions. Indian J. Agric. Sci. 2009, 79, 559–561. [Google Scholar]
  6. Senapathi, M.K.; Srinatha, A.; Pandit, J.K. In vitro release characteristics of matrix tablets: Study of karya gum and guar gum as release modulators. Indian J. Pharm. Sci. 2006, 68, 824–826. [Google Scholar]
  7. Manivannan, A.; Anandakumar, C.; Ushakumari, R.; Dahiya, G. Genetic diversity of Guar genotypes (Cyamopsis tetragonoloba (L.) Taub.) based on Agro-Morphological traits. Bangladesh J. Bot. 2015, 44, 59–65. [Google Scholar] [CrossRef]
  8. Gheisari, A.; Zavareh, M.S.; Bahadoran, R.; Toghyani, M. Application of incremental program, an effective way to optimize dietary inclusion rate of guar meal in broiler chicks. Livest. Sci. 2011, 140, 117–123. [Google Scholar] [CrossRef]
  9. Sharma, P.; Gummagolmath, K.C. Reforming Guar Industry in India: Issues and Strategies. Agric. Econ. Res. Rev. 2012, 25, 37–48. [Google Scholar] [CrossRef] [Green Version]
  10. Gresta, F.; Ceravoloa, G.; LoPrestib, V.; D’Agatac, A.; Raoc, R.; Chiofalob, B. Seed yield, galactomannan content and quality traits of different guar (Cyamopsis tetragonoloba L.) genotypes. Ind. Crops Prod. 2017, 107, 122–129. [Google Scholar] [CrossRef]
  11. Rai, P.S. Genetic variability studies in cluster bean genotypes (Cyamopsis tetragonoloba (L.) Taub. Master’s Thesis, The University of Agricultural Sciences, Dharwad, India, 2012. [Google Scholar]
  12. Kumar, D.; Rodge, A.B. Status, scope and strategies of arid legumes research in India—A review. J. Food Legume. 2012, 25, 255–272. [Google Scholar]
  13. Rogers, C.E.; Stafford, R.E. Budding phenology of guar in the rolling plains of texas. Agron. J. 1976, 68, 496–499. [Google Scholar] [CrossRef]
  14. APEDA-Agriculture Produce Export Development Authority Reports, 2020–2021. 2020. Available online: https://apeda.gov.in/apedawebsite/Latest_Notification/Trade_Notice.html (accessed on 10 March 2021).
  15. Santonoceto, C.; Mauceri, A.; Lupini, A.; Gresta, F.; Chiera, E.; Sunseri, F.; Mercati, F.; Anastasi, U. Morpho-agronomic characterization and genetic variability assessment of a guar germplasm collection by a novel SSR panel. Ind. Crop. Prod. 2019, 138, 111568. [Google Scholar] [CrossRef]
  16. Gresta, F.; Avolab, G.; Cannavòa, S.; Santonocetoa, C. Morphological, biological, productive and qualitative characterization of 68 guar (Cyamopsis tetragonoloba (L.) Taub.) genotypes. Ind. Crops Prod. 2018, 114, 98–107. [Google Scholar] [CrossRef]
  17. Basford, K.; Cooper, M. Genotype x environment interactions and some considerations of their implications for wheat breeding in Australia this review is one of a series commissioned by the Advisory Committee of the Journal. Aust. J. Agric. Res. 1998, 49, 153–174. [Google Scholar] [CrossRef]
  18. Smith, H.F. A discriminant function for plant selection. Ann. Eugen. 1936, 7, 240–250. [Google Scholar] [CrossRef]
  19. Hazel, L.N. The Genetic Basis for Constructing Selection Indexes. Genetics 1943, 28, 476–490. [Google Scholar] [CrossRef] [PubMed]
  20. Bizari, E.H.; Unêda-Trevisoli, S.H.U.; Val, B.H.P.; Pereira, E.D.M.; Di Mauro, A.O. Selection indices for agronomic traits in segregating populations of soybean. Rev. Ciênc. Agron. 2017, 48, 110–117. [Google Scholar] [CrossRef] [Green Version]
  21. Rocha, J.R.D.A.S.D.C.; Machado, J.C.; Carneiro, P.C.S. Multi-trait index based on factor analysis and ideotype-design: Proposal and application on elephant grass breeding for bioenergy. GCB Bio-Energy 2018, 10, 52–60. [Google Scholar] [CrossRef]
  22. Burdon, R.D.; Li, Y. Genotype-environment interaction involving site differences in expression of genetic variation along with genotypic rank changes: Simulations of economic significance. Tree Genet. Genomes 2019, 15, 2. [Google Scholar] [CrossRef]
  23. Olivoto, T.; Lúcio, A.D.C.; Da Silva, J.A.G.; Sari, B.G.; Diel, M.I. Mean Performance and Stability in Multi-Environment Trials II: Selection Based on Multiple Traits. Agron. J. 2019, 111, 2961–2969. [Google Scholar] [CrossRef]
  24. Olivoto, T.; Nardino, M. MGIDI: Toward an effective multivariate selection in biological experiments. BioRxiv 2020. [Google Scholar] [CrossRef]
  25. Das, B.; Arora, S.K.; Luthra, Y.P. A rapid method for determination of gum in guar (Cyamopsis tetragonoloba (L.) Taub.). In Proceedings of the 1st ICAR Guar Research Workshop, Jodhpur, India, 11–12 January 1997; pp. 117–123. [Google Scholar]
  26. Joshi, U.N. Advances in Chemistry, Biochemistry and Industrial Utilization of Guar Seed; Singh, J.V., Dahiya, B.S., Eds.; Guar, Indian Society of Forage Research, Hisar and Agricultural and Processed Food Products Export Development (APEDA): New Delhi, India, 2004; pp. 197–229. [Google Scholar]
  27. AOAC International—Association of Official Analytical Chemists. Official Method of Analysis, 19th ed.; AOAC International: Arlington, VA, USA, 2012. [Google Scholar]
  28. McDonald, P.; Edwards, R.A.; Green-halgh, J.F.D. Animal Nutrition; T and A Constable Ltd.: Edinburgh, UK, 1973; pp. 2–5. [Google Scholar]
  29. Olivoto, T.; Lúcio, A.D. metan: An R package for multi-environment trial analysis. Methods Ecol. Evol. 2020, 11, 783–789. [Google Scholar] [CrossRef]
  30. Donald, C.M. The breeding of crop ideotypes. Euphytica 1968, 17, 385–403. [Google Scholar] [CrossRef]
  31. Olivoto, T.; Lúcio, A.D.; Da Silva, J.A.; Marchioro, V.S.; De Souza, V.Q.; Jost, E. Mean Performance and Stability in Multi-Environment Trials I: Combining Features of AMMI and BLUP Techniques. Agron. J. 2019, 111, 2949–2960. [Google Scholar] [CrossRef]
  32. Kaiser, H.F. The varimax criterion for analytic rotation in factor analysis. Psychometrika 1958, 23, 187–200. [Google Scholar] [CrossRef]
  33. Allard, R.W.; Bradshaw, A.D. Implications of genotype—Environmental interactions applied plant breeding. Crop Sci. 1964, 4, 503–508. [Google Scholar] [CrossRef] [Green Version]
  34. Falconer, D.S.; Mackay, T.F.C. Introduction to Quantitative Genetics, 4th ed.; Addison Wesley Longman: Harlow, UK, 1996. [Google Scholar]
  35. Patterson, H.D.; Williams, E.R. A New Class of Resolvable Incomplete Block Designs. Biometrika 1976, 63, 83–92. [Google Scholar] [CrossRef]
  36. Comstock, R.E.; Moll, R.H. Genotype-environment interactions. In Statistical Genetics and Plant Breeding, National Academy of Sciences–National Research Council Publ.; Hanson, W.D., Robinson, H.F., Eds.; NASNRC: Washington, DC, USA, 1963; pp. 164–196. [Google Scholar]
  37. Eskridge, K.M. Selection of Stable Cultivars Using a Safety-First Rule. Crop. Sci. 1990, 30, 369–374. [Google Scholar] [CrossRef]
  38. Kang, M.S.; Pham, H.N. Simultaneous Selection for High Yielding and Stable Crop Genotypes. Agron. J. 1991, 83, 161–165. [Google Scholar] [CrossRef]
  39. Evans, L.T. Crop Evolution, Adaptation, and Yield; Cambridge University Press: New York, NY, USA, 1993. [Google Scholar]
  40. Mehrotra, N.; Malik, D.S.; Chaudhary, B.D. Studies in stability parameters in cluster bean (Cyamopsis tetragonaloba (L.) Taub.) for seed yield in rainfed conditions. Haryana Agric. Univ. J. Res. 1980, 10, 77–80. [Google Scholar]
  41. Paroda, R.S.; Rao, G.V.S. Genotype x environmental interactions for seed yield in cluster bean. Forage Res. J. 1981, 7, 169–172. [Google Scholar]
  42. Pathak, R.M.; Singh, M.; Henry, A. Genetic diversity and interrelationship among clusterbean (Cyamopsis tetragonoloba) genotypes for qualitative traits. Indian J. Genet. 2011, 81, 402–406. [Google Scholar]
  43. Comstock, R.K.; Robinson, H.F. Estimation of average dominance genes. Heterosis 1952, 2, 494–516. [Google Scholar]
  44. Finlay, K.W.; Wilkinson, G.N. Analysis of adaptation in plant breeding programme. Aust. J. Agric. Res. 1963, 14, 742–754. [Google Scholar] [CrossRef] [Green Version]
  45. Scapim, C.A.; Oliveira, V.R.; Braccini, A.L.; Cruz, C.D.; Andrade, C.A.B.; Vidigal, M.C.G. Yield stability in maize (Zea mays L.) and correlations among the parameters of the Eberhart and Russell, Lin and Binns and Huehn models. Genet.Mol. Biol. 2000, 23, 387–393. [Google Scholar] [CrossRef]
  46. Blum, A. Plant Breeding for Stress Environments; CRC Press: Boca Raton, FL, USA, 2018. [Google Scholar]
  47. Dehghani, H.; Ebadi, A.; Yousefi, A. Bioplot analysis of genotype by environment interaction for barley yield in Iran. Agron. J. 2006, 98, 388–393. [Google Scholar] [CrossRef]
  48. Bhering, L.L.; Laviola, B.G.; Salgado, C.C.; Sanchez, C.F.B.; Rosado, T.B.; Alves, A.A. Genetic gains in physic nut using selection indexes. Pesqui. Agropecu. Bras. 2012, 47, 402–408. [Google Scholar] [CrossRef] [Green Version]
  49. Jahufer, M.Z.Z.; Casler, M.D. Application of the Smith-Hazel Selection Index for Improving Biomass Yield and Quality of Switchgrass. Crop. Sci. 2015, 55, 1212–1222. [Google Scholar] [CrossRef]
  50. Dalló, S.C.; Zdziarski, A.D.; Woyann, L.G.; Milioli, A.S.; Zanella, R.; Conte, J.; Benin, G. Across year and year-by-year GGE biplot analysis to evaluate soybean performance and stability in multi-environment trials. Euphytica 2019, 215, 113. [Google Scholar] [CrossRef]
  51. Woyann, L.G.; Meira, D.; Matei, G.; Zdziarski, A.D.; Dallacorte, L.V.; Madella, L.A.; Benin, G. Selection indexes based on linear-bilinear models applied to soybean breeding. Agron. J. 2020, 112, 175–182. [Google Scholar] [CrossRef]
  52. Jarquin, D.; Howard, R.; Crossa, J.; Beyene, Y.; Gowda, M.; Martini, J.W.R.; Pazaran, G.C.; Burgueño, J.; Pacheco, A.; Grondona, M.; et al. Genomic Prediction Enhanced Sparse Testing for Multi-environment Trials. G3 Genes Genomes Genet. 2020, 10, 2725–2739. [Google Scholar] [CrossRef]
  53. Zuffo, A.M.; Steiner, F.; Aguilera, J.G.; Teodoro, P.E.; Teodoro, L.P.R.; Busch, A. Multi-trait stability index: A tool for simultaneous selection of soya bean genotypes in drought and saline stress. J. Agron. Crop. Sci. 2020, 206, 815–822. [Google Scholar] [CrossRef]
  54. Bermudez, F.; Pinheiro, J.B. Selection to high productivity and stink bugs resistance by multivariate data analyses in soybean. Bragantia 2020, 79, 250–259. [Google Scholar] [CrossRef]
  55. Snedecor, G.W.; Cochran, W.G. Statistical Methods, 7th ed.; Lowa State University Press: Ames, IA, USA, 1980. [Google Scholar]
  56. Jain, S.K.; Patel, P.R. Stability analysis for seed yield and their component traits in breeding lines of guar (Cyamopsis tetragonoloba L.). Legume Res. 2012, 35, 327–331. [Google Scholar]
  57. Rashidi, M.; Farshadfar, E.; Jowkar, M.M. AMMI analysis of phenotypic stability in chickpea genotypes over stress and non-stress environments. Int. J. Agric. Crop Sci. 2013, 5, 253–260. [Google Scholar]
  58. Arunkumar, B.; Viswanatha, K.P.; Yogesh, N.L.; Krishnamurthy, D.; Muniswamy, S.; Kuchanur, P.H. Yield stability analysis of gum guar genotypes in North Eastern Karnataka. J. Pharm. Phytochem. 2017, SP1, 812–815. [Google Scholar]
  59. Eberhart, S.A.; Russell, W.A. Stability Parameters for Comparing Varieties. Crop. Sci. 1966, 6, 36–40. [Google Scholar] [CrossRef] [Green Version]
  60. Gabriel, A.; De Resende, J.T.; Zeist, A.R.; Resende, L.V.; Resende, N.; Zeist, R.A. Phenotypic stability of strawberry cultivars based on physicochemical traits of fruits. Hortic. Bras. 2019, 37, 75–81. [Google Scholar] [CrossRef]
  61. Koundinya, A.V.V.; Ajeesh, B.R.; Hegde, V.; Sheela, M.N.; Mohan, C.; Asha, K.I. Genetic parameters, stability and selection of cassava genotypes between rainy and water stress conditions using AMMI, WAAS, BLUP and MTSI. Sci. Hortic. 2021, 281, 109949. [Google Scholar]
Figure 1. Statistics of guar gum export from India to top ten countriesof the world in the year 2019–2020.
Agronomy 11 01221 g001
Figure 2. Box plots depicting the variation in grain yield (GY) for individual genotypes over seasons. The dashed line shows the overall mean.
Agronomy 11 01221 g002
Figure 3. Box plot depicting the variation in different characters (traits) of genotypes over seasons used in this study.
Agronomy 11 01221 g003
Figure 4. Ranking of genotypes based on MGIDI index.
Agronomy 11 01221 g004
Figure 5. Common genotypes (Table 6) shared across the environments shown in Venn chart.
Agronomy 11 01221 g005
Figure 6. Strengths and weakness view of the stable genotypes identified in E1 (a), E2 (b), and E3 (c).
Agronomy 11 01221 g006
Table 1. Various genotype accessions adopted in this study.
ParametersEnvironments
E1 (Kharif:2013)E2 (Summer:2013–14)E3 (Kharif:2014)
Date of sowing15 August 201319 February 201418 August 2014
Date of Harvesting20 December 201328 June 201422 December2014
Table 2. Various genotype accessions adopted in this study.
IDAccession No.IDAccession No.IDAccession No.
1IC-42181631IC-37050961IC-415145
2IC-42181732IC-37051662IC-415146
3IC-31139233IC-37056363IC-415148
4IC-31139334IC-37342764IC-415151
5IC-31140335IC-37343865IC-415153
6IC-31141736IC-37348066IC-415154
7IC-31143137IC-37349767IC-415157
8IC-31143238IC-37355768IC-415158
9IC-31144039IC-40229469IC-415159
10IC-31144440IC-40229570IC-415160
11IC-31144941IC-40229671IC-415161
12IC-32399242IC-40229872IC-415163
13IC-32402043IC-40229973IC-415166
14IC-32402344IC-40230174IC-415168
15IC-32574345IC-40230275IC-420320
16IC-32580046IC-40230376IC-420332
17IC-32580647IC-40230477IC-420373
18IC-32581148IC-41510278IC-421242
19IC-32581949IC-41510679IC-421798
20IC-32582150IC-41510880IC-421809
21IC-32583251IC-41511081IC-421812
22IC-32584652IC-41511582IC-421815
23IC-32903053IC-41512383IC-421834
24IC-32903354IC-41512584IC-421835
25IC-32903655IC-41512885RGC1003
26IC-32906256IC-415131
27IC-36983857IC-415135
28IC-37047858IC-415137
29IC-37049059IC-415138
30IC-37050260IC-415140
Table 3. Factorial loadings obtained using varimax rotation and communalities resulted during the factor analysis.
VariableFA1FA2FA3FA4FA5FA6CommunalityUniqueness
DFF−0.50−0.09−0.14−0.43−0.340.070.580.42
DM−0.200.22−0.57−0.02−0.140.090.440.56
PH−0.31−0.69−0.120.07−0.120.140.630.37
CP−0.87−0.060.020.14−0.040.070.790.21
PP−0.85−0.16−0.100.050.05−0.040.760.24
GP0.20−0.490.33−0.410.250.100.630.37
Branches−0.02−0.200.130.83−0.15−0.030.770.23
100SW−0.260.330.170.360.140.490.590.41
GY0.02−0.820.120.120.160.000.740.26
Gum0.08−0.090.10−0.150.000.870.810.19
Protein0.10−0.090.10−0.020.750.340.710.29
Fat−0.010.030.100.10-0.860.070.770.23
Fiber−0.200.110.740.15−0.130.040.650.35
Ash−0.080.140.39−0.04−0.16−0.740.750.25
Carbohydrates−0.600.180.20−0.12−0.14−0.250.540.46
FA: Factors analysis, DFF: Days taken to 50% flowering, DM: Days taken to Maturity, PH: Plant Height, CP: Clusters plant−l, PP: Pods plant−l, GP: Grains pod−1, 100SW: Hundred Seed Weight, GY: Grain Yield.
Table 4. Factors linked to correlated traits, selection differential, heritability, and indicators.
VariablesFactorXoXsSDSD Percenth2Indicators
DFFFA 136.4334.32−2.11−5.800.93Decrease
CPFA 116.3521.365.0130.620.60Increase
PPFA 174.6491.9517.3123.190.77Increase
CarbohydratesFA 144.5245.901.393.120.91Increase
PHFA 270.2678.758.4912.080.68Increase
GPFA 24.955.420.479.580.72Increase
GYFA 2377.39527.27149.8839.710.99Increase
DMFA 398.9999.240.260.260.87Decrease
FiberFA 35.926.250.325.470.90Increase
BranchesFA 45.006.461.4529.070.77Increase
ProteinFA 528.9928.86−0.12−0.420.94Increase
FatFA 53.763.900.143.800.93Increase
100SWFA 63.443.590.154.270.86Increase
GumFA 627.8428.931.093.930.94Increase
AshFA 64.794.76−0.03−0.660.91Increase
Table 5. Genotypes selected in the individual environment and across the environments.
E1E2E3Common Genotypes to All Seasons
IC-373480IC-415106IC-421798IC-415106
IC-420373IC-402299IC-402301IC-420320
IC-415106IC-373480IC-415158IC-402301
IC-402299IC-420373IC-415106
IC-420320IC-311431IC-421242
IC-402301IC-420320IC-421834
IC-415146IC-402301IC-415125
IC-373497IC-324020IC-420320
IC-324020IC-311449IC-421835
IC-370516IC-415146IC-420332
IC-415158IC-415115IC-402302
IC-415115IC-373497IC-402304
IC-420332IC-415123IC-415135
Table 6. Common genotypes between the environments based on coincidence index.
Variable-1Variable-2IndexCommon Genotypes
MGIDI-Kharif-2013MGIDI-Kharif-201472.85IC-373480, IC-420373,
IC-415106, IC-402299,
IC-420320, IC-402301,
IC-415146, IC-373497,
IC-324020, IC-415115
MGIDI-Kharif-2013MGIDI-Summer-2013–1427.60IC-415106, IC-420320,
IC-402301, IC-415158,
IC-420332
MGIDI-Kharif-2014MGIDI-Summer-2013–149.50IC-415106, IC-420320,
IC-402301
Table 7. Selection gains within the seasons assessed by MTSI index.
VARSD Percent (E1)h2
(E1)
SD Percent
(E2)
h2
(E2)
SD Percent
(E3)
h2
(E3)
PH12.350.9113.640.9418.150.91
CP29.360.7917.710.8224.100.89
PP21.060.9110.120.9028.480.97
GY37.210.9731.390.964.550.99
Gum0.540.93−2.390.87−0.820.69
Protein−5.160.94−6.880.94−3.180.73
Ash3.940.824.090.821.470.46
CARB2.910.714.100.712.770.53
DM−0.950.700.150.680.890.87
Fat5.740.885.870.882.290.54
DFF−1.060.85−0.840.89−10.330.92
Branches20.220.9321.810.7346.350.80
100 SW1.330.361.920.366.560.81
GP6.310.659.160.660.000.00
Fiber8.240.8110.250.811.970.36
Table 8. Comparison of traits of selected genotypes with the average values of the not selected genotypes.
Genotype DFFDMPHCPPPGPBRAN100SWGYGUMPROTEINFATFIBERASHCARB
IC-415106Mean33.3397.0066.8822.83103.376.2310.803.77676.6921.4122.974.626.676.5350.64
CV5.592.1619.5419.467.3922.5410.483.769.738.819.0811.7911.7312.024.33
MIN31.0094.0044.0018.0090.404.009.003.62622.0018.9620.204.045.375.6547.65
MAX36.00100.0079.5030.00110.007.4012.004.00779.9624.0025.405.607.407.7553.60
IC-420320Mean34.33102.6782.0228.3381.455.977.104.02547.5129.3531.532.676.264.7143.26
CV4.763.364.3211.319.3122.3853.852.4510.6316.0610.7338.3413.2121.577.31
MIN33.0098.0076.6024.0071.504.002.003.90486.4025.6427.151.855.033.2538.85
MAX37.00108.0086.5032.0090.007.4011.604.10652.8338.2036.404.507.406.1547.30
IC-402301Mean31.6795.8379.4825.93112.284.138.103.40355.7222.1023.224.306.695.4849.79
CV4.312.0318.8423.119.7030.4034.354.9212.389.809.227.7212.2419.733.65
MIN30.0093.0055.0020.00102.402.805.603.20315.0018.9620.403.905.374.0047.65
MAX33.0099.0092.5036.00132.805.6012.003.60423.0024.5025.404.807.806.9552.20
Not selectedMean36.4598.9970.1716.3474.594.945.003.44376.8627.8128.983.765.924.7944.50
CV11.183.9725.9436.5329.0021.6767.1410.3037.3718.9511.6421.0219.6519.6611.08
MIN24.0087.0019.004.0014.402.000.002.1075.0012.8419.351.852.692.8021.85
MAX49.00110.00115.0040.00146.008.5022.004.20779.9642.4036.405.608.558.7555.00
Publisher’s Note: MDPI stays neutral with regard to jurisdictional claims in published maps and institutional affiliations.

