Article

Carbon Mineralization Dynamics of Organic Materials and Their Usage in the Restoration of Degraded Tropical Tea-Growing Soil

by
Liyana Rallage Mahesh Chaminda Liyanage
1,2,
Muhammad Firdaus Sulaiman
3,
Roslan Ismail
3,
Gamini Perera Gunaratne
2,
Randombage Saman Dharmakeerthi
4,
Minninga Geethika Neranjani Rupasinghe
5,
Amoda Priyangi Mayakaduwa
5 and
Mohamed M. Hanafi
1,3,5,*
1
Laboratory of Sustainable Agronomy & Crop Protection, Institute of Plantation Studies, Universiti Putra Malaysia, Serdang 43400, Selangor, Malaysia
2
Soils and Plant Nutrition Division, Tea Research Institute of Sri Lanka, Talawakelle 22100, Sri Lanka
3
Department of Land Management, Faculty of Agriculture, Universiti Putra Malaysia, Serdang 43400, Selangor, Malaysia
4
Department of Soil Science, Faculty of Agriculture, University of Peradeniya, Peradeniya 20400, Sri Lanka
5
Laboratory of Climate-Smart Food Crop Production, Institute of Tropical Agriculture and Food Security, Universiti Putra Malaysia, Serdang 43400, Selangor, Malaysia
*
Author to whom correspondence should be addressed.
Agronomy 2021, 11(6), 1191; https://doi.org/10.3390/agronomy11061191
Submission received: 16 April 2021 / Revised: 4 May 2021 / Accepted: 7 May 2021 / Published: 10 June 2021
(This article belongs to the Section Soil and Plant Nutrition)

Abstract

:
Understanding carbon mineralization dynamics of organic amendments is essential to restore degraded lands. This study focused on the restoration potentials of tea-growing soils using organic materials available in tea ecosystems. The Selangor-Briah soil series association (Typic Endoaquepts) consisted of a high- (soil A) and a low-carbon (soil B) soils were incubated with different organic materials and released carbon dioxide (CO2) measured. Two kinetic models were applied to depict the mineralization process. Soil health parameters including microbial biomass carbon and nitrogen, dehydrogenase and catalase activities were determined to assess the restoration potentials. The parallel first-order kinetic model fitted well for all amendments. Gliricidia markedly enhanced the net cumulative CO2 flux in both soils. Charged biochar, tea waste and Gliricidia improved the microbial biomass carbon by 79–84% in soil A and 82–93% in soil B, respectively. Microbial quotients and biomass nitrogen were increased over 50 and 70% in amended soils, respectively. Dehydrogenase activity was significantly accelerated over 80% by compost, charged biochar and tea waste. Charged biochar remarkably increased the soil catalase activity by 141%. Microbial biomass, dehydrogenase and catalase activities, and cumulative CO2 flux were positively correlated (r > 0.452) with one another. The studied amendments showed greater potential in improving the soil quality, while charged biochar, raw biochar and compost enrich the soil recalcitrant C pool ensuring the soil health in long term. Even though biochar sequesters carbon, it has to be charged with nutrients to achieve the soil restoration goals.

Graphical Abstract

1. Introduction

The depletion in soil organic matter (SOM) has become an inevitable consequence in many tropical regions, where intensive farming is practiced particularly under present climate-changing scenarios [1]. Tea is an upland crop grown as a rainfed perennial mostly in tropical and subtropical regions where the soil has been continuously subjected to degradation. It has been estimated that more than 4.883 million hectares of land around the world are under tea by the year 2018 [2]. Most soils in most of the tropical tea-producing countries are highly weathered and continuously declining in SOM leading to poorer soil quality [3]. Warm humid tropical climate accelerates the faster decomposition and mineralization of SOM reducing the terrestrial stock particularly in arable lands.
As a result of the continuous exploitation of tea cultivating lands over 150 years, soil degradation has become inescapable particularly in the South and East Asian regions questioning the sustainability of tea cultivation in the future [4,5]. Moreover, the degradation process has been further aggravated by unfavorable environmental factors including high rainfall and temperature arisen due to climate change and the continuous loading of agrochemicals [6].
Application of organic amendments (OA) has become a worldwide accepted agricultural practice to arrest or even reverse the degradation of soils [7]. Further, it is considered as a sustainable approach in achieving restoration aims through the improvements in chemical, physical, biological and ecological functionality of the soil [8,9]. More specifically, improvement in SOM influences the soil microclimate, microbial community structure, biomass turnover and mineralization of nutrients [10].
Compost, Gliricidia, biochar and tea waste are some of the organic soil amendments freely available in the tea ecosystem. There is a greater potential to prepare compost in the tea garden itself as large quantities of materials are available. Gliricidia is the most popular low-height shade tree in tea gardens additionally providing green manure [11]. Tea waste is a waste byproduct of the tea processing system. It is generated about 4–6% of the total made tea production depending on the quality of the harvested fresh leaves [12]. Although tea waste is a feedstock to produce biochar, the potential of using tea waste as a soil amendment to improve degraded lands is yet to be studied. Spent tea, tea pruning materials and shade tree lopping are other potential feedstocks available for biochar production. However, biochar itself is poor in supplying nutrients for plant growth [13]. Hence, fortification of biochar with plant nutrients is required [14,15].
Numerous researchers have identified the beneficial effects of crop residues as organic amendments for soil fertility improvement [9,16]. The processes of organic matter mineralization are critical for preserving soil quality. The mineralization process could be studied by quantifying either the utilization of substrate or the generation of CO2. The emission of CO2 is directly related to the mineralization of organic materials in the soil [17]. The CO2 flux is recommended as a robust soil health indicator [18]. Increases in microbial biomass, microbial diversity and functional enzyme activities are other measures of quality improvement and restoration of soil [19,20]. These measures are early and sensitive indicators of soil ecological stresses [21,22]. Soil degradation could severely harm the microbial and enzyme activities, which play a fundamental role in manipulating the state of the organic matter [23].
Dehydrogenase activity is one of the most significant measures of overall soil microbial activity and an indicator of biological processes including C mineralization in soils [24]. Catalase activity in soils is another indicator of aerobic microbial activity [25]. Therefore, the measurement of dehydrogenase and catalase enzyme activities allows researchers to quantify the potential benefits of organic materials to restore the soil.
Nonetheless, to quantify the potential benefits of organic matter management on soil quality, detailed information on C and N mineralization dynamics is needed. Moreover, there is a dearth of information on the long-term contribution of OM to soil quality improvement [26]. Further, the research studies done on OM mineralization in the tea ecosystem are scanty. Thus, it was hypothesized that the application of different organic materials available in the tea ecosystem would improve soil C storage, soil microbial activities, soil enzymatic processes and other related soil chemical properties with consequential effects on degraded tea growing lands under tropical soils. Therefore, the primary objective of this study was to find the restoration potentials of organic materials frequently available in tea gardens to restore the degraded tea-growing soils. The specific objectives were to examine the changes in microbial biomass and soil enzymes DH and CAT with the addition of the organic materials.

2. Materials and Methods

2.1. Sampling Site and Soil Characteristics

The soils of two distinct organic carbon (C) levels (high C-soil A, low C- soil B) were collected from the top 15 cm depth representing Ap and A horizons from a low grown tea garden in Banting at Selangor, Malaysia (2°56′05.7′′ N, 101°34′16.6′′ E). The climate of the area is a warm humid tropical climate with a mean annual temperature of 30 °C and a year-round distributed mean annual rainfall of 2500 mm. The soil belongs to Typic Endoaquepts great group showing Selangor-Briah soil series association. Collected soils were air-dried and sieved through a 2 mm sieve for the chemical characterization and incubation study and a fresh sub-sample was stored in 4 °C for the analysis of biological properties.

2.2. Preparation of Organic Amendments and Their Characteristics

Freely available organic materials in the tea ecosystem namely crop residues, Gliricidia leaves, and tea waste were used to prepare five different organic treatments including compost (CMP), Gliricidia green manure (GLI), charged biochar (CBC), tea waste (TW) and raw biochar (RBC). Compost was prepared by decomposing lawns and roadsides grasses for four months. The RBC was produced by pyrolyzing tea waste at 450 °C ± 10 °C for 4 h under limited oxygen concentration. The slow pyrolyzing process was carried out to obtain the biochar properties, which are more suitable for agricultural purposes [27,28]. Then RBC was fortified with an organic nutrient solution comprising cow dung, cow urine, sugar molasses and water at 2:1:2:5 into 20 parts of biochar ratio to produce CBC. Soil (Table 1) and all amendments (Table 2) were characterized for their nutritional values using standard methods of chemical analysis. Briefly, total C, N and S in organic amendments and soil were measured using a TruSpec CNS analyzer (Leco, Saint Joseph, MI, USA). Soil pH and electrical conductivity were measured using a ratio of 1:2.5 and 1:5, respectively by using a pH meter (Model Metrohm 827, Riverview, FL, USA) and electrical conductivity meter (Mettler Toledo SevenEasyTM Conductivity Meter S30, Hamilton, New Zealand). Organic C was determined using wet oxidation method [29]. Soil exchangeable K, Mg, and Ca were determined in 1M ammonium acetate, pH 7 extraction method and measured using atomic absorption spectroscopy (AAS) (AAnalyst 400, PerkinElmer, Waltham, MA, USA). Phosphorous, K, Mg and Ca in organic amendments were determined using dry ashing method. Potassium, Mg and Ca in the extracting solution were measured by AAS and P was measured using UV-visible spectrophotometer (UV-1700 PharmaSpec, Shimadzu Instruments, Kyoto, Japan) at 882 nm wavelength. The NH4-N and NO3-N were determined using 2 M KCl extraction method [30]. The N in the extracting solution was measured by auto-analyzer (QuikChem FIA+, 8000 series, LACHAT Instruments, HACH Company, Colorado, USA). All the chemicals used in this study were analytical grade having the purity of 99.9% from Sigma Aldrich Chemie GmbH (Munich, Germany).

2.3. Soil Incubation

The C mineralization potential of added organic amendments was investigated in a laboratory incubation experiment conducted in the dark; (90–95% humidity and 27–30 °C temperature) under an aerobic condition for 90 and 120 days, respectively for low C soil (1.87%) and high C soil (3.43%). Fifty grams of 2 mm sieved air-dried soil was weighed into a 750 mL incubation flask and brought into 55% of its field capacity (FC) with distilled water [31]. Samples were pre-incubated for a week to reduce the effects of readily available C in the soil. All treatment materials were shredded to pass through a 5 mm sieve and then applied at a rate of 0.5 g C/100 g of soil to each flask followed by mixing thoroughly. Each flask was then sealed with a rubber plug having two holes to fix two rubber tubes enabling to measure the emitted CO2 and to replenish the air inside. Two types of soil and six organic amendments (including the control) were triplicated and the two-factor factorial experiment was arranged as a CRD. An automated CO2 flux analyzer (Licor-CO2 flux system, LI-COR Biosciences, Lincoln, NE USA) was used to measure the emitted CO2 and after the measurement, fresh air was pumped to replenish the air inside [32]. Measurements were done from 10:00 to 12:00 daily in the first week and then every other day for two weeks followed by once in three days for the next month. After that readings were taken once in 5 days for another month and finally during the last month, readings were taken weekly for soil A.

2.4. Mineralization Kinetics

The cumulative C mineralization kinetics data were studied by fitting into two different kinetic models. Initially, a first-order exponential equation proposed by Stanford and Smith [33] was used to fit CO2 flux data:
C m i n = C 0 1 e k t
Cmin is the cumulative mineralized organic C (CO2-C mg kg−1 soil) at time t (days), C0 denotes the amount of total potentially mineralizable C (mg kg−1), and k is the mineralization rate constant (day−1). Later, Molina et al. [34] suggested a parallel first-order model to explain net mineralization with two simultaneous reactions as follows:
C m i n = C f 1 e k f t + C s 1 e k s t
where Cf and Cs represent the active/faster and resistant/slower mineralizable pools of C decomposing at specific rates of kf and ks. The sum of Cf and Cs gives the same physical meaning as C0 in the first-order exponential model.

2.5. Microbial Biomass Carbon and Nitrogen

Microbial biomass C (MBC) and microbial biomass N (MBN) were determined using the chloroform fumigation extraction method as described by Sparling et al. [35]. Briefly, for MBC, 20 g of fresh soil was fumigated with alcohol-free chloroform for 30 min and incubated for 10 days under dark conditions. Then, carbon was extracted with 0.5N K2SO4 and syringe filtered with GF/F filter. About 10 mL of 0.167N K2Cr2O7 was added into a 75 mL digestion tube containing 10 mL of filtrate. The mixture was heated with 20 mL of conc. H2SO4 at 135 °C for 30 min and then volumed up to 75 mL after cooling. Finally, the color intensity was read at 600 nm. Sucrose solution (0–25 mg kg−1) was used to develop the calibration curve. The same procedure was repeated for a set of unfumigated samples. The same soil extract was used to determine the MBN, undertaking the Kjeldahl digestion procedure. The NH4+ content was measured using an auto-analyzer and MBN content was calculated as follows:
MBN = TN f u TN u f K e n
TNfu is total N extracted from fumigated soil and TNuf is the total N extracted from unfumigated soil. Ken = 0.45 [36,37]. Soil microbial quotient (SMQ) was obtained using the ratio of soil MBC to soil organic C.

2.6. Soil Enzyme Activities

Dehydrogenase (DH) (EC 1.1.1) activity was measured according to Casida et al. [38]. Fresh soil (equivalent of 4 g dry soil) was mixed with 70 mg of CaCO3 in a 50 mL centrifuge tube and followed by adding 1 mL 3% 2,3,5-triphenyl tetrazolium chloride (TTC) and 2.5 mL D H2O. Mesocosm was sealed tightly and incubated at 37 °C for 24 h under dark conditions. Then the sample was centrifuged at 3000 rpm and the supernatant was discarded. Produced triphenyl formazan (TPF) was extracted using 3–4 slots of 5 mL methanol by mixing, centrifuging and filtering until extract becomes colorless. Then, the collected extract was marked up with methanol to 25 mL and the intensity of the developed red color was measured at 485 nm. The dehydrogenase activity was expressed as µg TPF g soil−1 24 h−1.
Catalase (CAT) (EC 1.11.6) activity was determined according to Ladd [39]. In a 125 mL Erlenmeyer flask, 2 g of soil was mixed with 5 mL 0.3% H2O2 and 40 mL distilled water, and then shaken for 20 min at 27 °C. After that, 20 mL of 1.5 M H2SO4 was added and the mixture was filtered immediately. Control samples were carried out similarly but H2O2 was added just before the filtration. Finally, a 25 mL aliquot was titrated with 0.1 M KMnO4. The catalase activity was calculated by subtracting sample reading from control and expressed as mmol H2O2 g−1 20 min−1.

2.7. Statistical Analysis

Daily CO2 emission, cumulative CO2, MBC, MBN, dehydrogenase and catalase activities were statistically analyzed following GLM procedure using SAS version 9.4. The least-square means (LSM) was used to compare means when significant differences were found at a probability level (p) of 0.05. Pearson’s correlation analysis was performed to test relationships between variables and two tailed t test was used to test the significance of correlations. Regression and model fitting kinetics were executed using SigmaPlot 14 (Systat Inc., San Jose, CA, USA).

3. Results

The physicochemical properties of the two soils showed a contrasting difference (Table 1). Soil having an organic C content of 3.04% (soil A) was a dark silty clay soil and soil B was a clay loam soil having 1.43% of organic C. Generally, soil organic matter (SOM) was higher in the silty clay soil than in the clay loam soil [40]. Both soils are highly acidic and poor in plant-available nutrients. Soil B showed greater degradation status than soil A concerning the soil fertility status.

3.1. Carbon Mineralization Dynamics

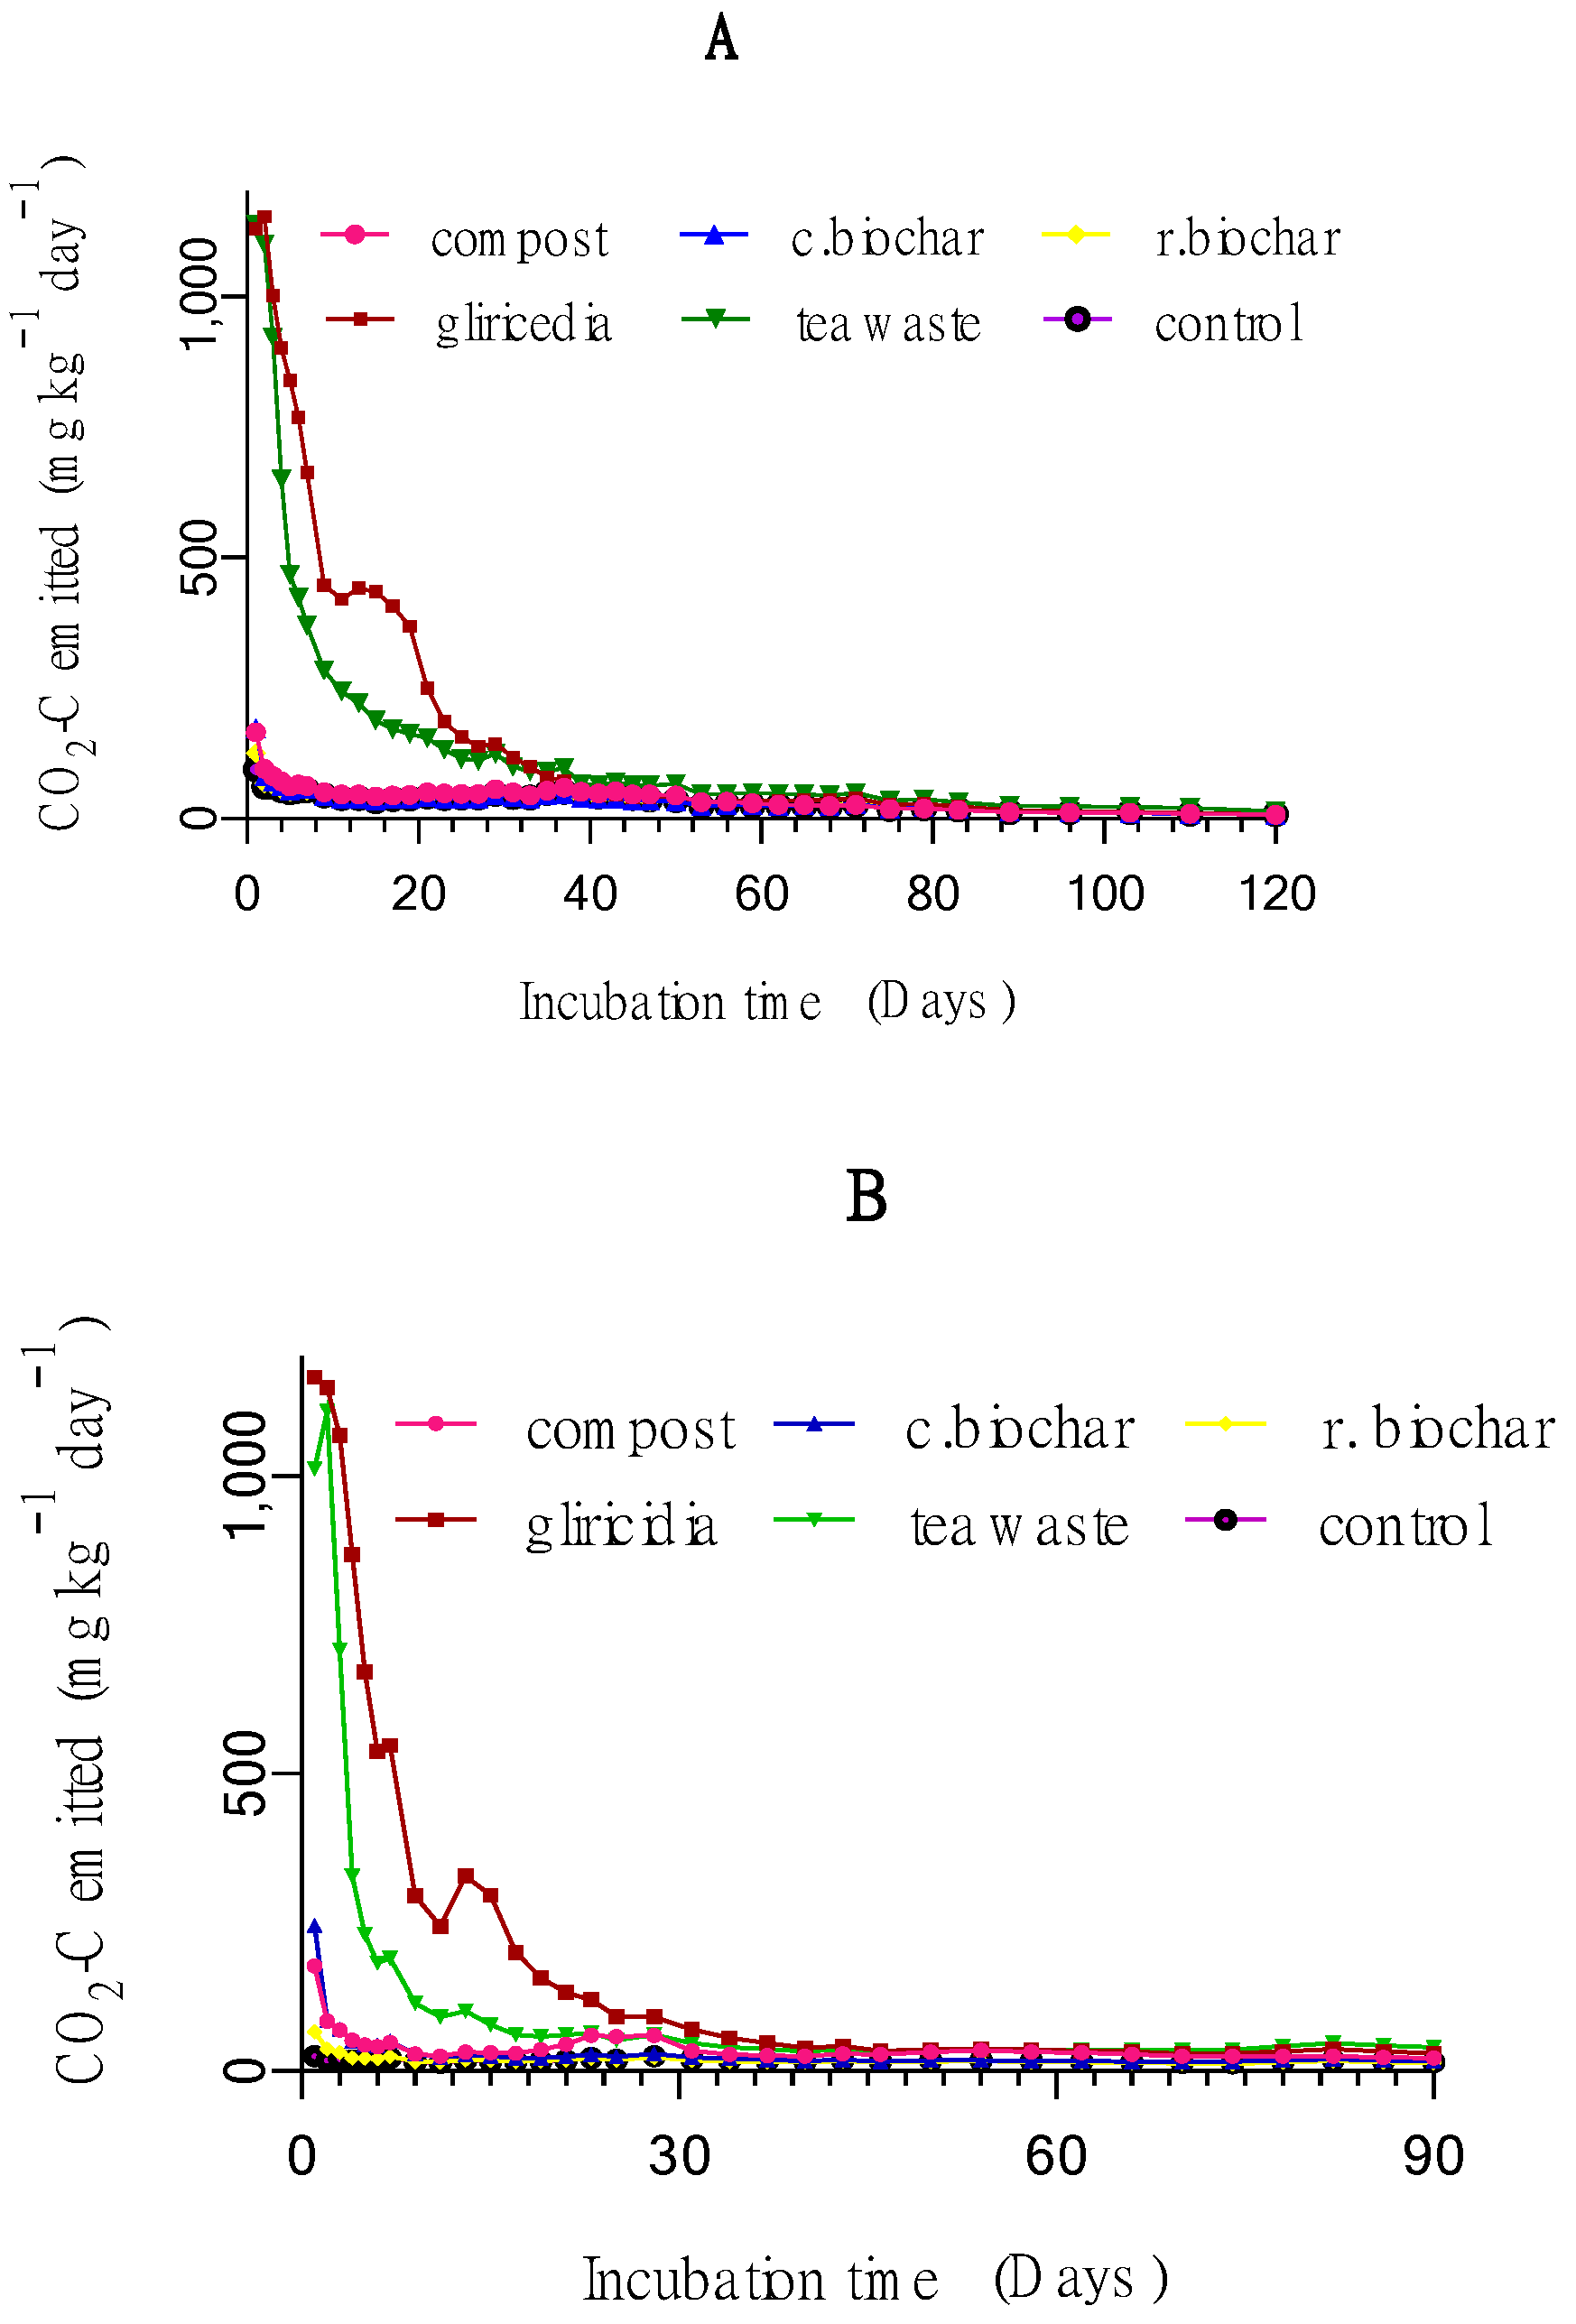
3.1.1. Daily CO2 Emission

Basal respiration rate was high in soil A showing CO2-C of 468 mg kg−1 day−1, whereas it was 448 mg kg−1 day−1 for soil B. This could be attributed to the higher initial organic C content in soil A. The emission of CO2 varied significantly (p < 0.05) among organic materials (Figure 1). A rapid CO2 emission was observed in each organic treatment at the beginning of the experiment in both soils. Thereafter, it was gradually decreased and leveled off to constant after 40 and 30 days in soil A and soil B, respectively. The highest CO2 emission was recorded in each soil a day after incubation in all treatments except Gliricidia and tea waste which recorded the highest emission on the second day in soil A and soil B, respectively [41,42]. Gliricidia showed the highest rate of CO2 emission (1167 mg kg−1 day−1 in soil1 B) followed by tea waste (1138 mg kg−1 day−1 in soil A) and the lowest was observed in unamended soil. Charged biochar recorded its maximum CO2 emission rate of 244 mg kg−1 day−1 in soil B on the first day. In both soils, basal respiration of tested organic materials was in the order of Gliricidia > tea waste > charged biochar > compost > raw biochar > control.
The treatments demonstrated substantial variation at the beginning of the incubation period, however, the variations were minimal by day 40 and 30 of the incubation, respectively in soil A and soil B. The CO2 fluxes decreased thereafter in all treatments yet remained higher in the organic materials amended treatments than in the control (Figure 1).

3.1.2. Cumulative CO2-C Emission

The total cumulative emission of CO2 by the end of the incubation period ranged from 3198 to 15,807 mg kg−1 and from 1505 to 12,305 mg kg−1, respectively in soil A and soil B amended with different organic materials (Figure 2). The addition of organic residues resulted in a substantial rise in total soil CO2 efflux over the control.
Among the added organic materials, Gliricedia produced the highest CO2 efflux amounting to 15,807 and 12,305 mg kg−1 in soil A and B, respectively. In soil A, the lowest CO2 efflux was recorded by CBC (3172 mg kg−1), while RBC in soil B (1505 mg kg−1). The CO2 efflux of respective OM showed a similar trend in both soils. Carbon emission loss during the incubation period was in the order of Gliricidia > tea waste > compost > charged biochar > raw biochar in both soils but charged biochar produced the lowest CO2 for soil A.

3.1.3. Kinetics of Carbon Mineralization

The amount of mineralized C following the addition of different organic amendments was dramatically increased to a maximum at the early stages of incubation in all treatments. After that, it reached a relatively steady-state condition implying the exhaustion of the labile component of OM. Parallel first order model was fitted well having R2 > 0.99 for all organic amendments (Figure 3).
The kinetic information for mineralization of C based on the first-order model is illustrated in Table 3. Mineralization rate constants, k range from 0.0137 to 0.0707 day−1 in soil A and 0.0094 to 0.1004 day−1 in soil B. The highest rate constants were recorded in Gliricidia and tea waste in soil A and B, respectively, whereas the lowest was raw biochar in both soils. The total mineralizable C, C0 was highest in Gliricidia in both soils and CBC had the lowest C0 in soil A while it was RBC in soil B.
The double exponential model illustrates a two-phase mineralization mechanism that is influenced by the properties of organic matter applied. The Cf denotes the proportion of readily decomposable C in the added organic material, whilst Cs denotes the slow degradable C pool in the added organic material. The mineralization rates of the labile C fraction, kf varied between 0.0137 and 0.2660 day−1 in soil A and 0.1624 to 1.5697 day−1 in soil B. The RBC recorded the lowest kf in soil A and it was CBC in soil B. Observed readily mineralizable C was also highest in Gliricidia in both soils and it was lowest in RBC.

3.2. Microbial Biomass Changes

The microbial biomass C (MBC) in soil A is higher (612 µg C g−1) than soil B 358 µg C g−1 (data not shown) across all the treatments. This could be due to the comparatively higher initial C and N contents present in soil A with the silty texture.
Interestingly, the MBC values observed in this study are statistically similar in all amended soils except that of RBC. The unamended control treatments recorded the lowest MBC in both soils (Table 4). The MBC was varied from 375 to 662 µg C g−1 in soil A and 211 to 409 µg C g−1 in soil B.
Soil MBN different significantly among soils as well as organic amendments (Table 4). Soil A recorded the higher MBN content than soil B, maybe due to the native C sources for microbes. Gliricidia recorded the significantly highest MBN in both soils and it was lowest in control treatments. With the addition of biochar, we observed an increase in MBC by 83 and 93% in soil A and B, respectively. However, Ameloot et al. observed suppression of microbial activities [43].
All treatments showed significantly higher SMQ over the control and it was highest in Gliricidia (p < 0.05). However, SMQ was not significantly different (p < 0.05) among the organic amendments except in RBC amended soils, which showed the lowest SMQ in both soils (Table 4). The SMQ ranges from 1.24 to 2.86% across both soils. Further, soil B showed higher SMQ than soil A indicating the faster decomposition of added organic matter.

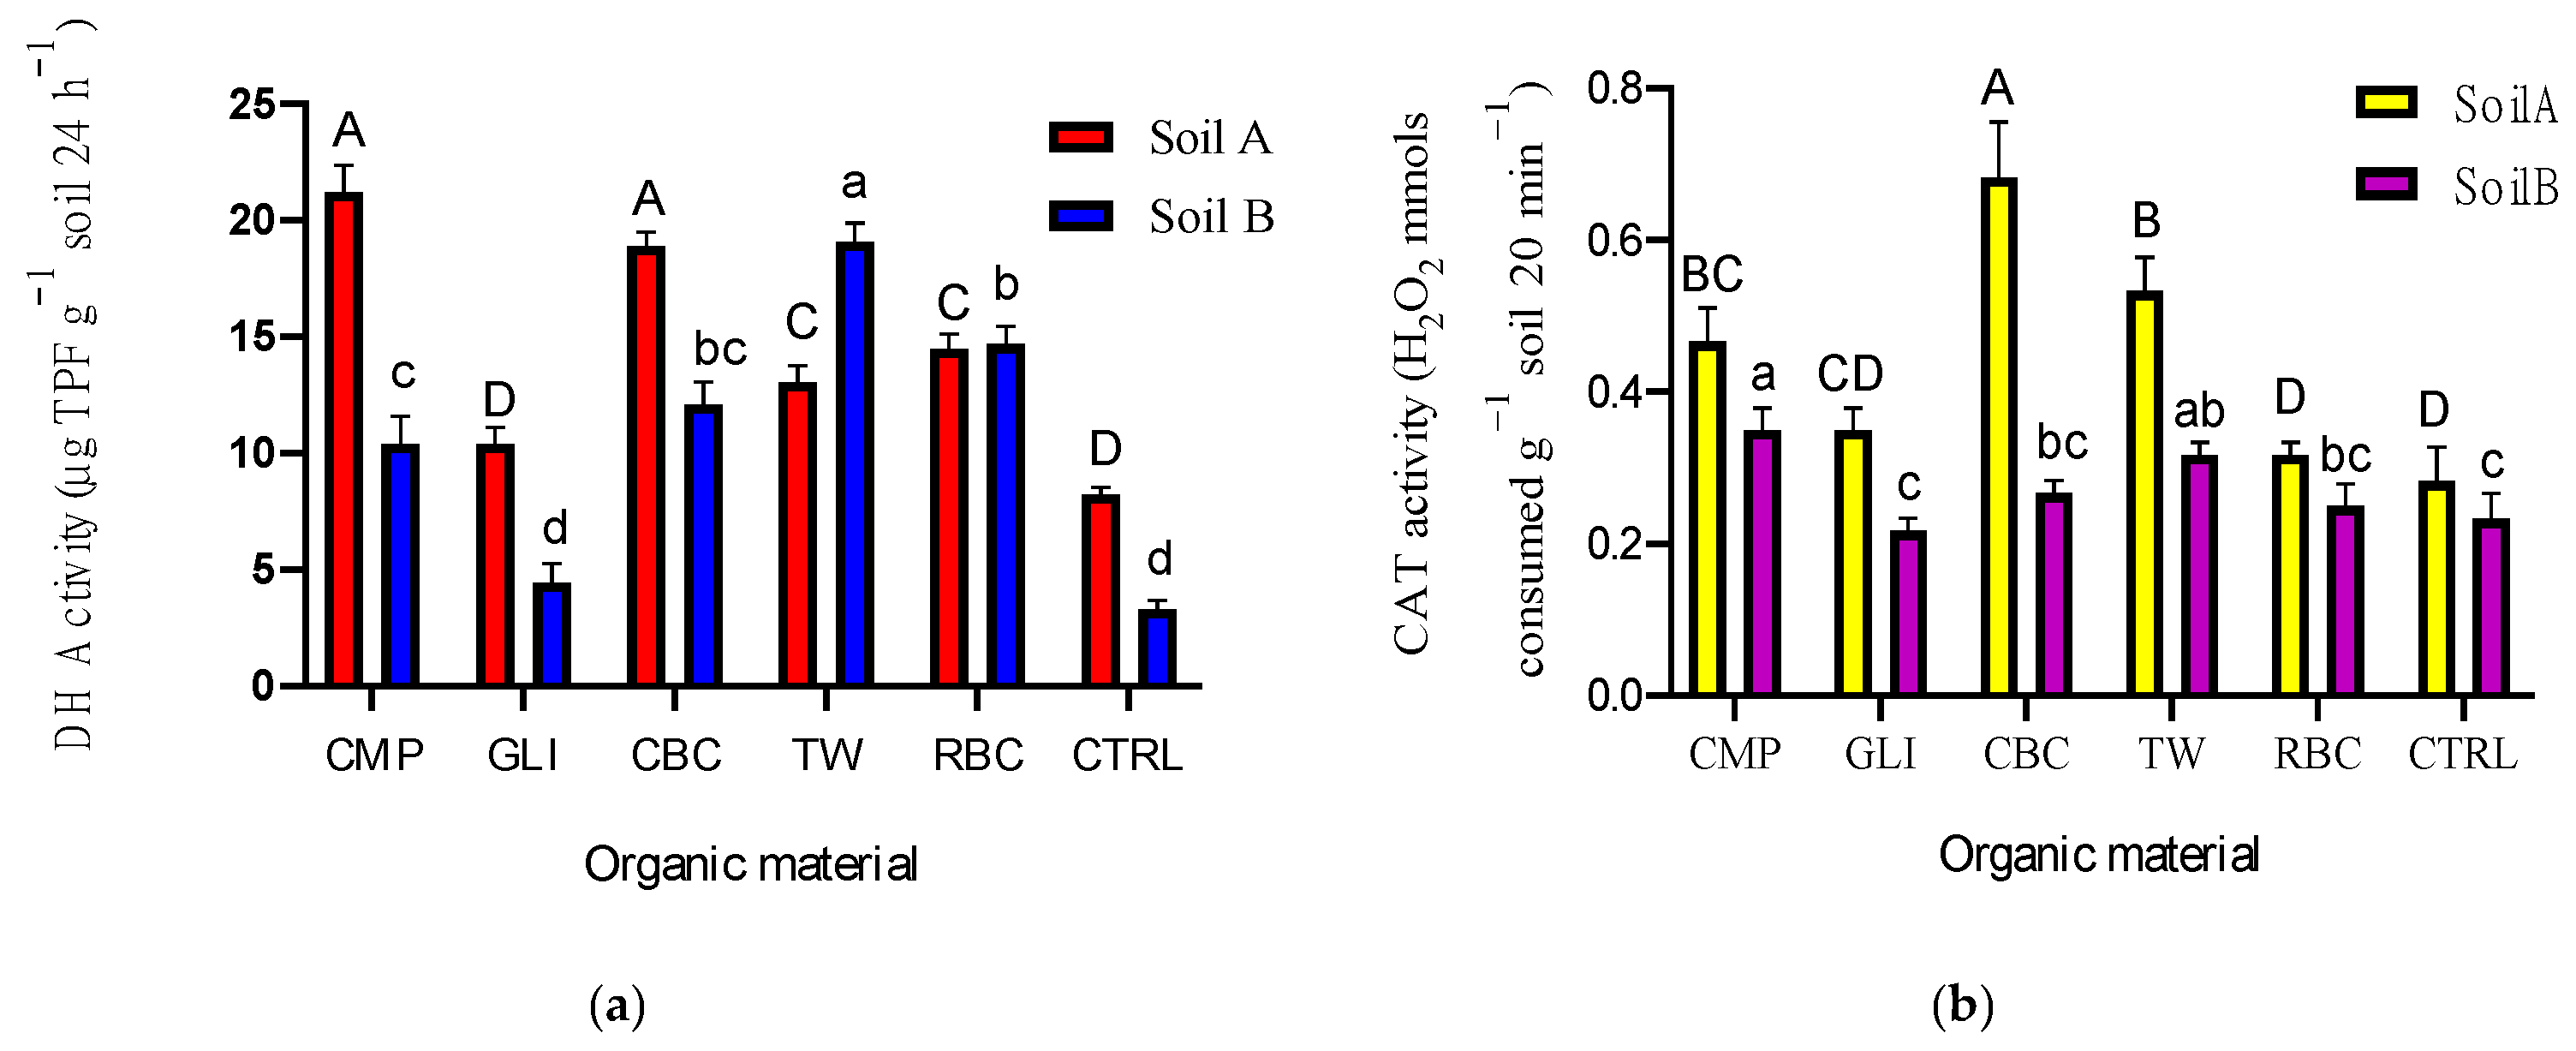
3.3. Soil Enzymes Activities

The DH activity was significantly highest in soil A compared to soil B, which recorded 14.38 and 10.66 µg g−1 24 h−1, respectively. Compost recorded the highest DH activity followed by CBC when compare the treatments in soil A, whereas in soil B the highest DH was observed in tea waste followed by RBC (Figure 4). Interestingly, CBC showed higher DH activity indicating greater microbial activities.
A significant difference in catalase enzyme activity was observed between soil A and B (Figure 4). Soil A showed the catalase activity of 0.44 H2O2 mmols g−1 20 min−1, whereas soil B had 0.27 H2O2 mmols g−1 20 min−1. Surprisingly, the addition of Gliricidia did not show a significant increase of catalase activity in both soils after the incubation of 4 and 3 months, respectively. Further, a significant interaction was also observed between soil to organic amendment type (p < 0.05).

3.4. Correlation Analysis

Significant positive correlations were observed among DH, MBC, MBN, CAT, Ccum and OC% (Table 5). The MBC showed a significant positive correlation with DH (r = 0.524), CAT (r = 0.702), OC% (r = 0.826) and moderate correlation with Ccum, (r = 0.452). The MBN was positively correlated with MBC and cumulative C. The MBC had a significant positive correlation with catalase activity (r = 0.702). Further, CAT had a strong positive correlation with OC% (r = 0.626).

4. Discussion

4.1. Carbon Mineralization Dynamics

4.1.1. Daily CO2 Emission

Higher CO2 emission recorded in soil A could be attributed to the higher initial organic C content in soil A. The compost charged biochar and raw biochar were mineralized at a slower rate than Gliricidia and tea wastes in both soils. It could be due to the presence of higher stable organic components that were formed during the process of composting and biochar production [44,45]. In comparison to other organic materials tested, Gliricidia has a higher total N content and the lowest C:N ratio (Table 2), which favors a higher CO2 release. Manures with higher N and moisture contents are liable to decompose rapidly emitting a large amount of CO2 [46,47].
The CO2 emission pattern of this study is in accordance with the results of Ali and Nabi [48] who observed a gradual decline in differences among treatments within 30 days after incubation of soil with rice or wheat straws. In our study, we observed the highest peaks for the emission of CO2-C during the first week of the incubation. Many other researchers also have observed that the CO2-C emission peaks during the first week [7,9,48,49,50] and this could be due to the presence of the easily decomposable organic compounds including carbohydrates and amino acid in the organic amendments [51,52,53]. The readily decomposable organic C promotes microbial growth in the early days of the incubation stage and then decreases gradually may be attributed to the enervation of those substances.

4.1.2. Cumulative CO2-C Emission

Adding organic matter to soils increased the diversity and population of the microbial community resulting in higher C mineralization [54]. The dark soil A having higher silt content, combined with higher organic matter, may have created optimal conditions for increased microbial activity [55]. Therefore, CO2 efflux was higher in soil A.
Among the added organic materials, garden compost yielded comparatively lower cumulative CO2 as it is an already decomposed and partially mineralized material with low organic C content thus limiting the microbial activity. Higher N content, lower C:N ratio and the presence of readily available organic molecules in Gliricidia caused to emit the highest cumulative CO2 of 69 and 58% of the total C added into soil A and B, respectively. Rapid decomposition of Gliricidia was also noted by Zaharah and Bah as 81% of the carbon and 69% of dry matter lost within 70 days of incubation [56]. It is interesting to note that the CBC produced lower CO2 efflux among the added organic amendments for soil A and it was RBC for soil B. The lower CO2 emission observed in CBC may be attributed to the initial abiotic precipitation of soil-borne CO2 as carbonates, which will reduce the apparent amount of CO2 emitted and this mechanism accelerates as pH rises. Emitted CO2 could be dissolved in soil moisture forming HCO3 preventing emission. Furthermore, lower C mineralization could indicate the suppression of microbial activities resulted from the inclusion of recalcitrant biochar. Adsorption of labile OC from native soil C pool may prevent the attraction of microbes for those resulting in reduced CO2 emission [43].

4.1.3. Kinetics of Carbon Mineralization

The typical model used to describe C mineralization is the first-order kinetic model. Most researchers have suggested that the first-order kinetic model describes the C mineralization process virtuously [7,33,50]. In this model the rate of C mineralization is proportional to the C concentration at the given time, considering all C sources as one C pool. Therefore, this model gives integrated k values for all C pools. Moreno-Cornejo et al. pointed out that the initial soluble fraction of organic carbon controls the mineralization process determining a single rate constant k [9]. Gliricidia was decomposed quickly having the highest k along with the highest C0. Even though Cs is greater than Cf in general [54], we found Gliricidia showing a higher amount of faster decomposing materials than its resistant pool in soil A in line with Zaharah and Bah [56]. This could be due to the priming effect of existing high organic C content in the soil and amalgamated with a low C:N ratio. All other treatments showed a larger slow decomposing C fraction in both soils. Considering two models, the parallel first-order model describes the C mineralization process even better than the first-order model and gives better goodness of fit values (Table 3). Unlike the first-order model, the parallel first-order model identifies two C pools with different decomposition rates and confirms the different coefficients (Cf and Cs) [42,54,57,58]. Considering mineralization rate constants, the kf values, which indicate the faster decomposing C pools, were generally greater than ks (Table 3). Comparing regression coefficient, R2 and standard error of estimate, SEE, the parallel first-order model fitted well and explained C mineralization dynamics for all tested organic amendments in this study better than the first-order single pool model. Among treatments, raw biochar showed the best goodness of fit estimates but Gliricidia showed the least goodness of fit values. Findings of this study suggest that the widely held C in the tested organic amendments are the least decomposable components thus, contribute to sequestrate C in the soil but the least contribution by Gliricidia.

4.2. Microbial Biomass Changes

Soil MBC has been proposed as an index of soil quality and health assessments or as an index of soil stress and disturbance, and therefore its measurement is often essential for soil ecological studies [21]. The MBC values of our study were within the accepted range of 1–4% of the TOC, also in line with values reported by Moreno-Cornejo et al. [9]. However, higher MBC contents (800–1720 µg C g−1) were observed by Turrión et al. in their study on the addition of compost into burnt and unburnt soils [57]. The charged biochar also behaved like Gliricidia showing greater potentials as soil conditioners in terms of biological properties. Higher N content in Gliricidia could be the main reason to flourish microbes. However, some other factors, such as providing better space for habitat, aeration, a substrate to attach and buffering of pH may have positively affected the better microbial proliferation in charged biochar that resulted in similar values as Gliricidia in both soils [59]. The RBC also showed a higher MBC than control in both soils, which contradicted with the CO2-C emission, where RBC recorded the lowest CO2 than the control in soil B.
In general, the incorporation of organic matter into the soil results in a significant rise in soil MBC compared to the control [45,57]. The addition of easily degradable organic C, which activates the soil’s zymogenous microbial activity and also the introduction of exogenous microorganisms with organic amendments, such as manure, are primarily responsible for this initial rise in MBC [60]. Analogous to MBC data; charged biochar, tea waste and Gliricidia also gave similar values for MBN in both soils. Thus, all these materials can be used to improve the soil biological properties.
The ratio of Cmic: Corg (SMQ) illustrates the C equilibrium in the soil and gives early notice of whether soil quality is improving or deteriorating as a result of various management practices [61]. Thus, the changes in MBC measured over relatively short periods reveal the trends in total organic matter content well before detected by other chemical analyses. According to Sparling, soil Cmic generally accounts for around 1–4% of total soil organic C [62]. Additionally, Pascual et al. suggest that this SMQ is an indicator of the potential of organic matter mineralization rather than its stability; the lower the ratio, the lower the tendency for organic matter to get mineralized [21]. This would describe why soils amended with fresh wastes at any rate displayed a higher ratio as found in this study as well. It may be speculated that, in that period, the Gliricidia was rapidly decomposed leading to a relatively low soil Corg and a relatively high MBC. However, in contrast to Pascual et al. CBC also resulted a higher SMQ like Gliricidia in soil B [21] and it could be attributed to the charging materials of biochar which contained organic solution having all nutrients for the microbial proliferation.

4.3. Soil Enzymes Activities

Soil enzymes were shown to have been significantly influenced by microbial behavior and nutrient cycling and are promising measures of soil quality. Since DH is an intracellular enzyme [63], it reflects the microbial activity, and this was further confirmed by MBC data in our study as well. The DH is a measure of the soil’s metabolic capacity, and its activity is proportional to the biomass of microorganisms in the soil [64]. The CBC creates a favorable microclimate for microbes thus could proliferate comfortably resulting in increased DH activity [65]. Though, we observed increased DH with the addition of both CBC and RBC, Brtnicky et al. found a dramatic decrease [66]. The increased DH activity in our study reflects the oxidative potentials of soil microorganisms particularly in biochar amended soil. However, DH measurements cannot be directly used in evaluating the soil degradation process because of its’ entirely intracellular nature [67].
Catalase is also an intracellular enzyme present in all aerobic bacteria and played a crucial role in microbial oxidoreductase metabolism [25,68]. Like DH, higher OC content in soil A may be the reason for the higher CAT activity in soil A. The addition of CBC has increased CAT activity significantly in soil A, while compost increased CAT in soil B (Figure 4). A significant increase of catalase activity through the addition of compost was also noted by García-Gil et al. under the continental semi-arid condition in Spain [25]. The increase in CAT activity implies that the biochar is useful to improve the oxidative ability of soil microbes. This is because catalase activity regulates microbial oxidative-reductase metabolism, which is linked to aerobic soil microbe metabolic activity [69].

4.4. Correlation Analysis

Significant positive correlations among DH, MBC, MBN, CAT, Ccum and OC% (Table 5) reveals the interrelationships of these biological parameters. The soil MBC showed a significant positive correlation with DH, CAT, OC% and Ccum, suggesting the increment in MBC is a reliable indicator of higher DH and CAT activities and higher C mineralization taking place in the soil. The significant positive correlation MBC had with CAT activity indicates aerobic decomposition is dominant during C mineralization. Further, CAT had a strong positive correlation with OC% (r = 0.626), which also observed by Oladele, in paddy growing Alfisol soil amended with biochar [69].

4.5. Restoration Potential of Degraded Tea Soil

The application of all organic amendments that are easily found in the tea ecosystem and used in this study showed potential benefits in restoration processes of degraded tea lands. Microbiological and biochemical parameters, including SOC, MBC, MBN, SMQ, and soil enzyme activities are the key components of soil quality measurements and they are highly vulnerable to any environmental stresses [70]. These properties provide fast and precise reports on improvements or deterioration of soil quality.
Gliricidia decomposed rapidly escaping higher amount of C from the soil, thus sequestration potential is low [55]. However, it improved the microbial activities, which reflected through improved MBC, MBN and SMQ regardless of the initial C content of the soils indicating Gliricidia has a large potential to restore the soil in short periods of time. Application of compost also showed a high capacity of conditioning the soil. It has comparatively a higher stable C, thus emission of CO2 was as low as 3–8% of added C. Compost showed the highest DH activity, while showing increased MBC, MBN and SMQ (Table 4), which demonstrate a high restoration capacity. Tea waste also showed faster mineralization next to Gliricidia but the slow mineralizable component (Cs) is higher than Gliricidia (Table 2) indicating C sequestrating potential once applied into the soil. It also behaved like compost in terms of MBC, MBN, SMQ and catalase activity. The RBC showed the lowest mineralization rate (Table 3) resulting in the highest C sequestration ability. Further, MBC, MBN, SMQ and catalase activities are also lower in RBC than that of other amendments. In the overall context, CBC had the greater potentials among tested amendments in restoring the degraded soil. It had the highest catalase activity and MBC, MBN and SMQ are like that of Gliricidia, which illustrates improved microbial activities. Increased DH and catalase activities in CBC amended soil is an indication of restoring degraded soil [69]. Further, the pH raised by CBC indirectly benefitted the microbial activities. Benefits observed in CBC would be sustainable due to its recalcitrant nature.

5. Conclusions

The addition of organic materials used in this study increased MBC, MBN, soil respiration and soil enzyme activities in varying degrees. Initial OC content in soil has a greater influence on organic matter mineralization. Further, various C pools present in the added organic materials influence C mineralization, thereby alter soil quality. Gliricidia has the highest mineralizable C content (17,818 and 13,146 mg kg−1 for soil A and B) and it improves soil biological activities in the short term. A greater amount of mineralizable C in Gliricidia on the other hand indicates the least contribution for C sequestration. Compost can be replaced with CBC concerning soil fertility and health due to having similar cumulative C mineralization, MBC, MBN and enzyme activities. The parallel first-order kinetic model fits much better than the single first-order kinetic model to explain the C mineralization process in tropical humid conditions.
Gliricidia, tea waste and charged biochar improve the soil MBC by 79–84% in soil A and 82–93% in soil B, respectively and MBN by more than 70% in both soils, when compared to the controls. Hence, they can be considered as good soil conditioners to restore degraded tropical tea-growing soils. The elevated level of enzyme activities in amended soils may reflect the improved protective sites because of enhanced humus content. All amendments except Gliricidia increased dehydrogenase activity by more than 76% over the control. There were positive correlations (r > 0.452) among cumulative CO2-C, MBC, MBN, dehydrogenase and catalase in the studied organic amendments. Considering all aspects, it can be concluded that charged biochar has greater advantages over raw biochar for improving soil quality, soil fertility and sequestrating carbon in the soil. All the tested organic materials have the potential to improve degraded tea-growing soils either in short-term or long-term periods. Gliricidia is a better source of organic material used to replenish the soil health in a shorter period, thus, needs to incorporate frequently. Incorporation of RBC, CBC and compost enrich the soil recalcitrant C pool ensuring the greater potential of restoring the soil health in long term. We observed the beneficial effects of incorporation of OM available in tea ecosystem to restore the degraded tea growing soil. Further, use of these amendments enhance soil C stock benefitting in maintaining the ecological balance with recycling of plant nutrients, mitigating climate changes and ensuring the sustainable tea yield. Additionally, these findings should be prioritized in decision making in relation to restoration of degraded tea lands.

Author Contributions

Conceptualization, L.R.M.C.L., M.M.H., R.S.D. and G.P.G.; methodology, L.R.M.C.L.; software and instrumentation, M.F.S. and L.R.M.C.L.; formal analysis, L.R.M.C.L., M.G.N.R. and A.P.M.; investigation, L.R.M.C.L.; resources, M.F.S. and R.I.; data curation, M.M.H.; writing—original draft preparation, L.R.M.C.L.; writing—review and editing, L.R.M.C.L. and M.G.N.R.; visualization, L.R.M.C.L. and M.M.H.; supervision, M.M.H., M.F.S., R.I., G.P.G. and R.S.D.; project administration, L.R.M.C.L.; funding acquisition, M.M.H. All authors have read and agreed to the published version of the manuscript.

Funding

This research received no external funding.

Institutional Review Board Statement

Not Applicable.

Informed Consent Statement

Not Applicable.

Data Availability Statement

The data presented in this study are available on request from the corresponding author. The data are not publicly available.

Acknowledgments

The authors acknowledge the assistance of the Sri Lanka Council for the Agricultural Research Policy (SLCARP) and Tea Research Institute (TRI), Sri Lanka for facilitating to conduct of this research and for the laboratory staff at the Department of Land Management, Faculty of Agriculture, Universiti Putra Malaysia (UPM) who helped with soil analysis. Thanks to the editor and anonymous reviewers for their shrewd comments and suggestions.

Conflicts of Interest

The authors declare no conflict of interest.

References

  1. Sierra, C.A.; Trumbore, S.E.; Davidson, E.A.; Vicca, S.; Janssens, I. Sensitivity of Decomposition Rates of Soil Organic Matter with Respect to Simultaneous Changes in Temperature and Moisture. J. Adv. Model. Earth Syst. 2015, 7, 335–356. [Google Scholar] [CrossRef]
  2. International Tea Committee. Annual Bulletin of Statistics; ITC: London, UK, 2019. [Google Scholar]
  3. Abera, G.; Wolde-Meskel, E.; Bakken, L.R. Carbon and Nitrogen Mineralization Dynamics in Different Soils of the Tropics Amended with Legume Residues and Contrasting Soil Moisture Contents. Biol. Fertil. Soils 2012, 48, 51–66. [Google Scholar] [CrossRef]
  4. Saha, A.K.; Biswas, A.; Khan, A.Q.; Farazi, M.M.; Rahman, M.H. Improvement of Tea (Camellia Sinensis L.) Soil Properties by Growing Different Green Crops. Agriculturist 2014, 12, 34–38. [Google Scholar] [CrossRef] [Green Version]
  5. Anandacoomaraswamy, A.; Ekanayake, S.A.; Ananthacumaraswamy, S.; Chishom, A.; Jayasuriya, S. Effect of Land Degradation on Tea Productivity in Sri Lanka. In Soil Erosion Research for the 21st Century, Proceedings of the Int. Symp., Honolulu, HI, USA, 3–5 January 2001; Ascough, J.C., II, Flanagan, D.C., Eds.; American Society of Agricultural and Biological Engineers: St. Joseph, MI, USA, 2001; pp. 75–78. [Google Scholar] [CrossRef]
  6. Lal, R. Restoring Soil Quality to Mitigate Soil Degradation. Sustainability 2015, 7, 5875–5895. [Google Scholar] [CrossRef] [Green Version]
  7. Khalil, M.I.; Hossain, M.B.; Schmidhalter, U. Carbon and Nitrogen Mineralization in Different Upland Soils of the Subtropics Treated with Organic Materials. Soil Biol. Biochem. 2005, 37, 1507–1518. [Google Scholar] [CrossRef]
  8. Amoah-Antwi, C.; Kwiatkowska-Malina, J.; Thornton, S.F.; Fenton, O.; Malina, G.; Szara, E. Restoration of Soil Quality Using Biochar and Brown Coal Waste: A Review. Sci. Total Environ. 2020, 722, 1–21. [Google Scholar] [CrossRef]
  9. Moreno-Cornejo, J.; Zornoza, R.; Faz, A. Carbon and Nitrogen Mineralization during Decomposition of Crop Residues in a Calcareous Soil. Geoderma 2014, 230–231, 58–63. [Google Scholar] [CrossRef]
  10. Li, J.; Wu, X.; Gebremikael, M.T.; Wu, H.; Cai, D.; Wang, B.; Li, B.; Zhang, J.; Li, Y.; Xi, J. Response of Soil Organic Carbon Fractions, Microbial Community Composition and Carbon Mineralization to High-Input Fertilizer Practices under an Intensive Agricultural System. PLoS ONE 2018, 13, e0195144. [Google Scholar] [CrossRef] [Green Version]
  11. Ekanayake, P.B. Planting and Management of Shade Trees Green Manure Crops and Wind Belts. In Handbook on Tea; Zoysa, A.K., Ed.; Tea Research Institute of Sri Lanka: Talawakelle, Sri Lanka, 2008; pp. 86–93. [Google Scholar]
  12. Mohamed, M.T.; Zoysa, A.K. An Overview of Tea Industry in Sri Lanka. In Handbook on Tea; Zoysa, A.K., Ed.; Tea Research Institute of Sri Lanka: Talawakelle, Sri Lanka, 2008; pp. 4–9. [Google Scholar]
  13. Teutscherova, N.; Vazquez, E.; Santana, D.; Navas, M.; Masaguer, A.; Benito, M. Influence of Pruning Waste Compost Maturity and Biochar on Carbon Dynamics in Acid Soil: Incubation Study. Eur. J. Soil. Biol. 2017, 78, 66–74. [Google Scholar] [CrossRef]
  14. Pandit, N.R.; Mulder, J.; Hale, S.E.; Schmidt, H.P.; Cornelissen, G. Biochar from “Kon Tiki” Flame Curtain and Other Kilns: Effects of Nutrient Enrichment and Kiln Type on Crop Yield and Soil Chemistry. PLoS ONE 2017, 12, e0176378. [Google Scholar] [CrossRef] [Green Version]
  15. Schmidt, H.; Pandit, B.; Martinsen, V.; Cornelissen, G.; Conte, P.; Kammann, C. Fourfold Increase in Pumpkin Yield in Response to Low-Dosage Root Zone Application of Urine-Enhanced Biochar to a Fertile Tropical Soil. Agriculture 2015, 5, 723–741. [Google Scholar] [CrossRef] [Green Version]
  16. Tratsch, M.V.M.; Ceretta, C.A.; da Silva, L.S.; Ferreira, P.A.A.; Brunetto, G. Composition and Mineralization of Organic Compost Derived from Composting of Fruit and Vegetable Waste. Rev. Ceres 2019, 66, 307–315. [Google Scholar] [CrossRef]
  17. Kotroczó, Z.; Juhos, K.; Biró, B.; Kocsis, T.; Pabar, S.A.; Varga, C.; Fekete, I. Effect of Detritus Manipulation on Different Organic Matter Decompositions in Temperate Deciduous Forest Soils. Forests 2020, 11, 675. [Google Scholar] [CrossRef]
  18. Laffely, A.; Erich, M.S.; Mallory, E.B. Evaluation of the CO2 Flush as a Soil Health Indicator. Appl. Soil Ecol. 2020, 154, 103594. [Google Scholar] [CrossRef]
  19. Dick, R.P. Soil Enzyme Activities as Indicators of Soil Quality. In Defining Soil Quality for a Sustainable Environment; Doran, J.W., Coleman, D.C., Bezdicek, D.F., Stewart, B.A., Eds.; Soil Science Society of America: Madison, WI, USA, 1994; Volume 35, pp. 107–124. [Google Scholar] [CrossRef]
  20. Xue, D.; Yao, H.; Huang, C. Microbial Biomass, N Mineralization and Nitrification, Enzyme Activities, and Microbial Community Diversity in Tea Orchard Soils. Plant Soil 2006, 288, 319–331. [Google Scholar] [CrossRef]
  21. Pascual, J.A.; Garcıcia, C.; Hernandez, T.; Ayuso, M. Changes in the Microbial Activity of an Arid Soil Amended with Urban Organic Wastes. Biol. Fertil. Soils 1997, 24, 429–434. [Google Scholar] [CrossRef]
  22. Ramesh, T.; Bolan, N.S.; Kirkham, M.B.; Wijesekara, H.; Kanchikerimath, M.; Srinivasa Rao, C.; Sandeep, S.; Rinklebe, J.; Ok, Y.S.; Choudhury, B.U.; et al. Soil Organic Carbon Dynamics: Impact of Land Use Changes and Management Practices: A Review. Adv. Agron. 2019, 156, 1–107. [Google Scholar] [CrossRef]
  23. García, C.; Hernández, T.; Costa, F. Microbial Activity in Soils under Mediterranean Environmental Conditions. Soil Biol. Biochem. 1994, 26, 1185–1191. [Google Scholar] [CrossRef]
  24. Campos, J.A.; Peco, J.D.; García-Noguero, E. Antigerminative Comparison between Naturally Occurring Naphthoquinones and Commercial Pesticides. Soil Dehydrogenase Activity Used as Bioindicator to Test Soil Toxicity. Sci. Total Environ. 2019, 694, 1–7. [Google Scholar] [CrossRef] [PubMed]
  25. García-Gil, J.C.; Plaza, C.; Soler-Rovira, P.; Polo, A. Long-Term Effects of Municipal Solid Waste Compost Application on Soil Enzyme Activities and Microbial Biomass. Soil Biol. Biochem. 2000, 32, 1907–1913. [Google Scholar] [CrossRef]
  26. Ghabbour, E.A.; Davies, G.; Misiewicz, T.; Alami, R.A.; Askounis, E.M.; Cuozzo, N.P.; Filice, A.J.; Haskell, J.M.; Moy, A.K.; Roach, A.C.; et al. National Comparison of the Total and Sequestered Organic Matter Contents of Conventional and Organic Farm Soils. Adv. Agron. 2017, 146, 1–35. [Google Scholar] [CrossRef]
  27. Fernandes, B.C.C.; Mendes, K.F.; Dias Júnior, A.F.; da Silva Caldeira, V.P.; da Silva Teófilo, T.M.; Silva, T.S.; Mendonça, V.; de Freitas Souza, M.; Silva, D.V. Impact of Pyrolysis Temperature on the Properties of Eucalyptus Wood-Derived Biochar. Materials 2020, 13, 5841. [Google Scholar] [CrossRef]
  28. Gaffar, S.; Dattamudi, S.; Baboukani, A.R.; Chanda, S.; Novak, J.M.; Watts, D.W.; Wang, C.; Jayachandran, K. Physiochemical Characterization of Biochars from Six Feedstocks and Their Effects on the Sorption of Atrazine in an Organic Soil. Agronomy 2021, 11, 716. [Google Scholar] [CrossRef]
  29. Nelson, D.; Sommers, L. Total Carbon, Organic Carbon, and Organic Matter. In Methods of Soil Analysis; Sumner, D.L., Sparks, A., Page, E., Helmke, P., Loeppert, R., Soltanpour, P., Tabatabai, M., Johnston, M., Sumner, M., Eds.; Soil Science Society of America: Madison, WI, USA, 1996. [Google Scholar]
  30. Markus, D.K.; McKinnon, J.P.; Buccafuri, A.F. Automated Analysis of Nitrite, Nitrate, and Ammonium Nitrogen in Soils. Soil Sci. Soc. Am. J. 1985, 49, 1208–1215. [Google Scholar] [CrossRef]
  31. Masunga, R.H.; Uzokwe, V.N.; Mlay, P.D.; Odeh, I.; Singh, A.; Buchan, D.; De Neve, S. Nitrogen Mineralization Dynamics of Different Valuable Organic Amendments Commonly Used in Agriculture. Appl. Soil Ecol. 2016, 101, 185–193. [Google Scholar] [CrossRef]
  32. Mohan, D.; Abhishek, K.; Sarswat, A.; Patel, M.; Singh, P.; Pittman, C.U. Biochar Production and Applications in Soil Fertility and Carbon Sequestration a Sustainable Solution to Crop-Residue Burning in India. RSC Adv. 2018, 8, 508–520. [Google Scholar] [CrossRef] [Green Version]
  33. Stanford, G.; Smith, S.J. Nitrogen Mineralization Potentials of Soils. Soil Sci. Soc. Am. J. 1972, 36, 465–472. [Google Scholar] [CrossRef]
  34. Molina, J.A.E.; Hadas, A.; Clapp, C.E. Computer Simulation of Nitrogen Turnover in Soil and Priming Effect. Soil Biol. Biochem. 1990, 22, 349–353. [Google Scholar] [CrossRef]
  35. Sparling, G.P.; Feltham, C.W.; Reynolds, J.; West, A.W.; Singleton, P. Estimation of Soil Microbial c by a Fumigation-Extraction Method: Use on Soils of High Organic Matter Content, and a Reassessment of the Kec-Factor. Soil Biol. Biochem. 1990, 22, 301–307. [Google Scholar] [CrossRef]
  36. Brookes, P.C.; Landman, A.; Pruden, G.; Jenkinson, D.S. Chloroform Fumigation, and the Release of Soil Nitrogen: A Rapid Direct Extraction Method to Measure Microbial Biomass Nitrogen in Soil. Soil Biol. Biochem. 1985, 17, 837–842. [Google Scholar] [CrossRef]
  37. Jenkinson, D.S. Determination of Microbial Biomass Carbon and Nitrogen in Soil. In Advances in Nitrogen Cycling in Agricultural Systems; Wilson, J.R., Ed.; CAB International: Wallingford, UK, 1988; pp. 368–386. [Google Scholar]
  38. Casida, L.; Klein, D.; Santoro, T. Soil Dehydrogenase Activity. Soil Sci. 1964, 98, 371–376. [Google Scholar] [CrossRef]
  39. Ladd, J.N. Origin and Range of Enzymes in Soil. In Soil Enzymes; Burns, R., Ed.; Academic Press: London, UK, 1978; pp. 51–96. [Google Scholar]
  40. Abdelhafez, A.A.; Abbas, M.H.H.; Attia, T.M.S.; El Bably, W.; Mahrous, S.E. Mineralization of Organic Carbon and Nitrogen in Semi-Arid Soils under Organic and Inorganic Fertilization. Environ. Technol. Innov. 2018, 9, 243–253. [Google Scholar] [CrossRef]
  41. Hagemann, N.; Joseph, S.; Schmidt, H.P.; Kammann, C.I.; Harter, J.; Borch, T.; Young, R.B.; Varga, K.; Taherymoosavi, S.; Elliott, K.W.; et al. Organic Coating on Biochar Explains Its Nutrient Retention and Stimulation of Soil Fertility. Nat. Commun. 2017, 8, 1–11. [Google Scholar] [CrossRef] [PubMed]
  42. Martín, J.V.; Miralles De Imperial, R.; Calvo, R.; Garcia, M.C.; Leon-Cfreces, C.; Delgado, M.M. Carbon Mineralisation Kinetics of Poultry Manure in Two Soils. Soil Res. 2012, 50, 222–228. [Google Scholar] [CrossRef]
  43. Ameloot, N.; Sleutel, S.; Case, S.D.C.; Alberti, G.; McNamara, N.P.; Zavalloni, C.; Vervisch, B.; delle Vedove, G.; De Neve, S. C Mineralization and Microbial Activity in Four Biochar Field Experiments Several Years after Incorporation. Soil Biol. Biochem. 2014, 78, 195–203. [Google Scholar] [CrossRef]
  44. Sánchez-García, M.; Alburquerque, J.A.; Sánchez-Monedero, M.A.; Roig, A.; Cayuela, M.L. Biochar Accelerates Organic Matter Degradation and Enhances N Mineralisation during Composting of Poultry Manure without a Relevant Impact on Gas Emissions. Bioresour. Technol. 2015, 192, 272–279. [Google Scholar] [CrossRef] [PubMed]
  45. Tejada, M.; Hernandez, M.T.; Garcia, C. Soil Restoration Using Composted Plant Residues: Effects on Soil Properties. Soil Tillage Res. 2009, 102, 109–117. [Google Scholar] [CrossRef]
  46. Hossain, M.B.; Rahman, M.M.; Biswas, J.C.; Miah, M.M.U.; Akhter, S.; Maniruzzaman, M.; Choudhury, A.K.; Ahmed, F.; Shiragi, M.H.K.; Kalra, N. Carbon Mineralization and Carbon Dioxide Emission from Organic Matter Added Soil under Different Temperature Regimes. Int. J. Recycl. Org. Waste Agric. 2017, 6, 311–319. [Google Scholar] [CrossRef] [Green Version]
  47. Rahman, F.; Rahman, M.; Rahman, G.K.M.M.; Hossain, A.T.M.S.; Miah, G. Effect of Organic and Inorganic Fertilizers and Rice Straw on Carbon Sequestration and Soil Fertility under a Rice—Rice Cropping Pattern. Carbon Manag. 2016, 7, 41–53. [Google Scholar] [CrossRef]
  48. Ali, I.; Nabi, G. Soil Carbon and Nitrogen Mineralization Dynamics Following Incorporation and Surface Application of Rice and Wheat Residues. Soil Environ. 2016, 35, 207–215. [Google Scholar]
  49. Mishra, A.; Kumar, N.; Kumar, R.; Kumar, R.; Tomar, D. Mineralization of Carbon, Nitrogen, Phosphorus and Sulphur from Different Organic Wastes in Silty Clay Loam Soils. J. Appl. Nat. Sci. 2016, 8, 16–22. [Google Scholar] [CrossRef]
  50. Wu, H.; Hu, J.; Shaaban, M.; Xu, P.; Zhao, J.; Hu, R. The Effect of Dolomite Amendment on Soil Organic Carbon Mineralization Is Determined by the Dolomite Size. Ecol. Process. 2021, 10. [Google Scholar] [CrossRef]
  51. Mohanty, S.; Nayak, A.K.; Kumar, A.; Tripathi, R.; Shahid, M.; Bhattacharyya, P.; Raja, R.; Panda, B.B. Carbon and Nitrogen Mineralization Kinetics in Soil of Rice-Rice System under Long Term Application of Chemical Fertilizers and Farmyard Manure. Eur. J. Soil Biol. 2013, 58, 113–121. [Google Scholar] [CrossRef]
  52. Zacháry, D.; Filep, T.; Jakab, G.; Varga, G.; Ringer, M.; Szalai, Z. Kinetic Parameters of Soil Organic Matter Decomposition in Soils under Forest in Hungary. Geoderma Reg. 2018, 14, e00187. [Google Scholar] [CrossRef] [Green Version]
  53. Puttaso, P.; Namanusart, W.; Thumanu, K.; Kamolmanit, B.; Brauman, A.; Lawongsa, P. Assessing the Effect of Rubber (Hevea Brasiliensis (Willd. Ex A. Juss.) Muell. Arg.) Leaf Chemical Composition on Some Soil Properties of Differently Aged Rubber Tree Plantations. Agronomy 2020, 10, 1871. [Google Scholar] [CrossRef]
  54. Marzi, M.; Shahbazi, K.; Kharazi, N.; Rezaei, M. The Influence of Organic Amendment Source on Carbon and Nitrogen Mineralization in Different Soils. J. Soil Sci. Plant Nutr. 2020, 20, 177–191. [Google Scholar] [CrossRef]
  55. Cai, A.; Feng, W.; Zhang, W.; Xu, M. Climate, Soil Texture, and Soil Types Affect the Contributions of Fine-Fraction-Stabilized Carbon to Total Soil Organic Carbon in Different Land Uses across China. J. Environ. Manag. 2016, 172, 2–9. [Google Scholar] [CrossRef] [PubMed]
  56. Zaharah, A.R.; Bah, A.R. Patterns of Decomposition and Nutrient Release by Fresh Gliricidia (Gliricidia Sepium) Leaves in an Ultisol. Nutr. Cycl. Agroecosyst. 1999, 55, 269–277. [Google Scholar] [CrossRef]
  57. Turrión, M.B.; Lafuente, F.; Mulas, R.; López, O.; Ruipérez, C.; Pando, V. Effects on Soil Organic Matter Mineralization and Microbiological Properties of applying Compost to Burned and Unburned Soils. J. Environ. Manag. 2012, 95, 1–6. [Google Scholar] [CrossRef]
  58. Zhang, H.; Zhou, Z. Recalcitrant Carbon Controls the Magnitude of Soil Organic Matter Mineralization in Temperate Forests of Northern China. For. Ecosyst. 2018, 5. [Google Scholar] [CrossRef]
  59. Kocsis, T.; Kotroczó, Z.; Kardos, L.; Biró, B. Optimization of Increasing Biochar Doses with Soil–Plant–Microbial Functioning and Nutrient Uptake of Maize. Environ. Technol. Innov. 2020, 20, 101191. [Google Scholar] [CrossRef]
  60. Blagodatsky, S.A.; Heinemeyer, O.; Richter, J. Estimating the Active and Total Soil Microbial Biomass by Kinetic Respiration Analysis. Biol. Fertil. Soils 2000, 32, 73–81. [Google Scholar] [CrossRef]
  61. Li, J.; Zhao, B.-Q.; Li, X.-Y.; Jiang, R.-B.; Bing, S.H. Effects of Long-Term Combined Application of Organic and Mineral Fertilizers on Microbial Biomass, Soil Enzyme Activities and Soil Fertility. Agric. Sci. China 2008, 7, 336–343. [Google Scholar] [CrossRef]
  62. Sparling, G.P. Ratio of Microbial Biomass Carbon to Soil Organic Carbon as a Sensitive Indicator of Changes in Soil Organic Matter. Aust. J. Soil Res. 1992, 30, 195–207. [Google Scholar] [CrossRef]
  63. Garcia-Ruiz, R.; Ochoa, V.; Hinojosa, M.B.; Carreira, J.A. Soil Biology & Biochemistry Suitability of Enzyme Activities for the Monitoring of Soil Quality Improvement in Organic Agricultural Systems. Soil Biol. Biochem. 2008, 40, 2137–2145. [Google Scholar] [CrossRef]
  64. Wolińska, A.; Zofia, S. Dehydrogenase Activity in the Soil Environment; Intech: London, UK, 2012; Volume I, p. 38. [Google Scholar] [CrossRef]
  65. Lehmann, J.; Rillig, M.C.; Thies, J.; Masiello, C.A.; Hockaday, W.C.; Crowley, D. Biochar Effects on Soil Biota—A Review. Soil Biol. Biochem. 2011, 43, 1812–1836. [Google Scholar] [CrossRef]
  66. Brtnicky, M.; Dokulilova, T.; Holatko, J.; Pecina, V.; Kintl, A.; Latal, O.; Vyhnanek, T.; Prichystalova, J.; Datta, R. Long-Term Effects of Biochar-Based Organic Amendments on Soil Microbial Parameters. Agronomy 2019, 9, 747. [Google Scholar] [CrossRef] [Green Version]
  67. Kujur, M.; Kumar Patel, A. Kinetics of Soil Enzyme Activities under Different Ecosystems: An Index of Soil Quality. Chil. J. Agric. Res. 2014, 74, 96–104. [Google Scholar] [CrossRef] [Green Version]
  68. Gianfreda, L.; Ruggiero, P. Enzyme Activities in Soil. In Nucleic Acids and Proteins in Soil; Nannipieri, P., Smalla, K., Eds.; Springer: Berlin/Heidelberg, Germany, 2006; pp. 257–311. [Google Scholar]
  69. Oladele, S.O. Effect of Biochar Amendment on Soil Enzymatic Activities, Carboxylate Secretions and Upland Rice Performance in a Sandy Clay Loam Alfisol of Southwest Nigeria. Sci. Afr. 2019, 4, e00107. [Google Scholar] [CrossRef]
  70. Garcia, C.; Hernandez, T.; Pascual, J.; Moreno, J.L.; Ros, M. Microbial Activity in Soils of SE Spain Exposed to Degradation and Desertification Processes. Strategies for Their Rehabilitation. In Research and Perspectives of Soil Enzymology in Spain; Garcia-Izquierdo, C., Hernandez, M.T., Eds.; CEBAS CSIC: Espinardo, Murcia, Spain, 2000; pp. 93–143. [Google Scholar]
Figure 1. Typical daily CO2 emission from soil A (A) and soil B (B) mixed with different organic amendments.
Agronomy 11 01191 g001
Figure 2. Cumulative CO2-C efflux after the incubation of soil A and soil B with CMP-compost, GLI-Gliricidia, CBC-charged biochar, TW-tea waste, RBC-raw biochar, and CTRL-control (Means with the same letters in same soil are not significantly different at p < 0.05).
Agronomy 11 01191 g002
Figure 3. The patterns of carbon mineralization for different organic materials in two soils silty clay (soil A) and clay loam (soil B) with CMP-compost, GLI-Gliricidia, CBC-charged biochar, TW-tea waste, and RBC-raw biochar.
Agronomy 11 01191 g003
Figure 4. Dehydrogenase (DH) (a) and catalase (CAT) (b) activities in high carbon (Soil A) and low carbon (Soil B) soils after incubation of different organic materials. Means with the same letters within the soil are not significantly different at p < 0.05 level.
Agronomy 11 01191 g004
Table 1. Properties of soils used in the incubation study. Values are the mean ± standard deviation (n = 3).
Soil PropertyHigh C Soil (SA)Low C Soil (SB)
Soil textureSilty clayClay loam
Bulk density (g cm−3)1.581.66
pH (H2O)3.96 ± 0.083.56 ± 0.07
pH (KCl)3.46 ± 0.033.32 ± 0.04
pH (CaCl2)3.62 ± 0.123.34 ± 0.03
Electrical conductivity (µS cm−1)102.4 ± 5.6174.1 ± 8.4
Total carbon (%)3.441.87
Organic C (%)3.041.43
Total Nitrogen (%)0.240.12
Total sulphur (%)0.070.06
KCl extractable NH4–N (mg kg−1)68 ± 864 ± 3
KCl extractable NO3–N (mg kg−1)79 ± 445 ± 2
NH4OAc extractable K (mg kg−1)41 ± 464 ± 4
Available P (Bray) (mg kg−1)194 ± 6144 ± 5
NH4OAc extractable Mg (mg kg−1)98 ± 373 ± 2
NH4OAc extractable Ca (mg kg−1)312 ± 14172 ± 11
Table 2. Key chemical properties of organic materials used in incubation study.
Organic
Material
Total (g kg−1)%
CNSPK #Mg #Ca #C/NC/PC/SMoisture
Compost234.311.71.73.40.340.090.2020326512.90
Gliricidia478.041.23.02.30.230.221.031220815977.20
Charged BC642.76.61.24.90.490.250.419713153639.80
Tea waste466.311.42.02.30.230.140.22412032339.50
Raw BC667.45.81.55.30.530.240.381151264454.10
Note: # NH4OAc extractable K, Ca and Mg, respectively.
Table 3. First-order and parallel first-order kinetic models fitting information for C mineralization from added organic materials into high carbon soil and low carbon soil.
SoilOrganic AmendmentFirst-Order Model
Cmin = C0 (1 − e−kt)
Parallel First-Order Model
Cmin = Cf (1 − e−kft) + Cs (1 − e−kst)
C0kR2SEECfCskfksR2SE
mg kg−1day−1 mg kg−1mg kg−1mg kg−1mg kg−1 mg kg−1
3.44% carbon soil (Silty clay)Compost4691.070.01620.995083.732217.562473.500.01620.01620.995085.85
Gliricidia15,349.540.07070.9944317.3113,228.334590.960.08700.00840.9991230.39
CBC4070.220.01560.995467.941924.982145.240.01560.01560.995369.66
Tea waste11,514.350.05950.9479693.614432.878571.350.26600.02470.999662.23
Raw biochar4371.990.01370.997650.472078.312293.680.01370.01370.998851.75
1.87% carbon soil (Clay loam)Compost4504.630.01220.992380.99175.765983.691.56970.00730.999139.97
Gliricidia11,367.720.09190.9750489.317687.305459.070.16240.01930.9991118.46
CBC2199.870.02650.9505128.59395.373322.020.60220.00830.997217.59
Tea waste6358.440.10040.8214676.853703.117196.000.37050.00830.997483.76
Raw biochar2570.420.00940.995430.7575.943902.740.96210.00500.999707.76
Table 4. Soil microbial biomass carbon, microbial biomass nitrogen and soil microbial quotient in soils after the incubation with different organic materials. Means with the same letters within the soil are not significantly different at the p < 0.05 level.
SoilOrganic MaterialMBCMBNSMQ
µg C g−1 ± SEMµg N g−1 ± SEM% ± SEM
Soil ACompost662.3 ± 22.0 a70.03 ± 4.45 b2.18 ± 0.07 a
Gliricidia692.3 ± 14.4 a90.68 ± 3.41 a2.28 ± 0.05 a
Charged biochar687.7 ± 18.6 a85.53 ± 9.75 ab2.26 ± 0.06 a
Tea waste672.7 ± 32.1 a82.34 ± 7.64 ab2.21 ± 0.10 a
Raw biochar579.2 ± 13.0 b50.80 ± 2.31 c1.90 ± 0.04 b
Control375.0 ± 29.1 c45.95 ± 4.47 c1.24 ± 0.10 c
Soil BCompost390.5 ± 10.2 ab58.89 ± 7.45 ab2.73 ± 0.07 ab
Gliricidia409.0 ± 16.4 a74.98 ± 8.36 a2.86 ± 0.12 a
Charged biochar409.0 ± 29.3 a68.51 ± 7.37 ab2.86 ± 0.21 a
Tea waste386.1 ± 13.6 ab69.29 ± 7.58 a2.70 ± 0.10 ab
Raw biochar340.7 ± 14.5 b48.12 ± 3.55 bc2.38 ± 0.10 b
Control211.8 ± 11.8 c45.90 ± 4.22 b1.48 ± 0.10 c
Note: Soil microbial biomass carbon, MBC; microbial biomass nitrogen, MBN; and soil microbial quotient, SMQ.
Table 5. Pearson’s correlation analysis between selected parameters.
ParameterDHMBCMBNCATCcumOC%
DH1.0000.524 **0.1920.542 **−0.1560.349 *
MBC 1.0000.397 *0.702 **0.452 **0.826 **
MBN 1.0000.2450.529 **0.137
CAT 1.0000.0800.626 **
Ccum 1.0000.328
OC% 1.000
* significant at p < 0.05. ** significant at p < 0.01.
Publisher’s Note: MDPI stays neutral with regard to jurisdictional claims in published maps and institutional affiliations.

