Article

Assessing the Genetic Diversity and Population Structure of a Tunisian Melon (Cucumis melo L.) Collection Using Phenotypic Traits and SSR Molecular Markers

1
Regional Research Centre on Horticulture and Organic Agriculture (CRRHAB/IRESA), LR21AGR03, University of Sousse, 4042 Sousse, Tunisia
2
National Gene Bank of Tunisia, Boulevard Leader Yasser Arafat, 1080 Tunis, Tunisia
3
Research Unit of Organic and Conventional Vegetable Crops UR13AGR03, High Institute of Agronomy of Chott Mariem, University of Sousse, 4042 Sousse, Tunisia
4
LICEF Research Center, TELUQ University, 5800 Rue Saint-Denis, Quebec, QC H2S3L5, Canada
5
Centro de Investigación y Tecnología Agroalimentaria de Aragón, Instituto Agroalimentario de Aragón-IA2 (CITA-Universidad de Zaragoza), 50059 Zaragoza, Spain
*
Author to whom correspondence should be addressed.
These authors contributed equally to this work.
Agronomy 2021, 11(6), 1121; https://doi.org/10.3390/agronomy11061121
Submission received: 23 April 2021 / Revised: 26 May 2021 / Accepted: 28 May 2021 / Published: 31 May 2021
(This article belongs to the Special Issue Old Germplasm for New Needs: Managing Crop Genetic Resources)

Abstract

:
The assessment of genetic diversity and structure of a gene pool is a prerequisite for efficient organization, conservation, and utilization for crop improvement. This study evaluated the genetic diversity and population structure of 24 Tunisian melon accessions, by using 24 phenotypic traits and eight microsatellite (SSR) markers. A considerable phenotypic diversity among accessions was observed for many characters including those related to agronomical performance. All the microsatellites were polymorphic and detected 30 distinct alleles with a moderate (0.43) polymorphic information content. Shannon’s diversity index (0.82) showed a high degree of polymorphism between melon genotypes. The observed heterozygosity (0.10) was less than the expected heterozygosity (0.12), displaying a deficit in heterozygosity because of selection pressure. Molecular clustering and structure analyses based on SSRs separated melon accessions into five groups and showed an intermixed genetic structure between landraces and breeding lines belonging to the different botanical groups. Phenotypic clustering separated the accessions into two main clusters belonging to sweet and non-sweet melon; however, a more precise clustering among inodorus, cantalupensis, and reticulatus subgroups was obtained using combined phenotypic–molecular data. The discordance between phenotypic and molecular data was confirmed by a negative correlation (r = −0.16, p = 0.06) as revealed by the Mantel test. Despite these differences, both markers provided important information about the diversity of the melon germplasm, allowing the correct use of these accessions in future breeding programs. Together they provide a powerful tool for future agricultural and conservation tasks.

1. Introduction

Melon (Cucumis melo L., 2n = 24) is a morphologically diverse and outcrossing horticultural crop of economic importance that belongs to the Cucurbitaceae family. The species is subdivided into two subspecies, namely, subsp. agrestis (Naud.) and subsp. melo, on the basis of vegetative morphological characteristics and fruit variation, length, and distribution of hairs on the ovary and young fruit [1]. Melons have been grouped into several horticultural groups [2], with the cantalupensis, inodorus, and reticulatus market types being the most economically important ones in American, Asian, and Mediterranean countries [3].
Melon diversity is spread across primary and secondary centers. Whereas the primary centers are located in central and southern Asia, the Far East Asian and Mediterranean regions comprise the secondary centers [2]. Because of its strategic position and the diversity of ecosystems and climatic conditions, Tunisia has been a crossroad of several civilizations, and itis considered one of the richest Mediterranean countries in terms of plant genetic resources including landraces and wild relatives. Being genetically diverse and well adapted to local environmental conditions, landraces are considered as an important reservoir of useful genes that could be exploited in crop breeding programs.
Tunisian melon landraces have been identified as highly tolerant to many biotic stresses such as Powdery mildew [4], Fusarium wilt [5], aphids [6], and viruses [7]. Although some Tunisian landraces are still cultivated in rural areas through traditional farming systems, the adoption of modern varieties at the expense of autochthonous germplasm has reduced the genetic diversity. This has contributed to genetic erosion resulting in significant loss of valuable genetic diversity for technological quality, adaptation to low inputs, and tolerance to stress conditions [8,9]. Moreover, little attention has been paid to the conservation of this germplasm. The extensive collection, preservation, and genetic diversity assessment of Tunisian melon landraces are vital in order to prevent genetic erosion, increase genetic variability for melon breeding, and introduce new traits into modern melon cultivars.
Several studies have been carried out to estimate the genetic variation within the melon germplasm through different approaches such as morphological descriptors [10,11] and molecular markers [12]. The evaluation of morphological traits has been frequently combined with agronomical [8,13], physiological, and biochemical data such as pH, total soluble solids, polysaccharide content, organic acids, and vitamins [14,15]. However, the expressions of most of these morphological traits are generally influenced by environmental factors and cultivation practices. Molecular markers that reveal polymorphism at the DNA level have been considered a powerful tool for the estimation of plant genetic diversity characterization and for the discrimination of different morphological individuals from different sources [16]. Various molecular markers have been successfully used to characterize the melon germplasm including restriction fragment length polymorphisms (RFLPs) [17], random amplified polymorphic DNA (RAPDs) [18], amplified fragment length polymorphisms (AFLPs) [19], and simple sequence repeats, also called microsatellites (SSRs) [12]. Specifically, SSRs have proven to be useful marker systems in recent melon genetic diversity and population structure studies [14,20,21] due to their abundance in the genome, high polymorphism, reliability, and codominant nature [20,21].
To the best of our knowledge, few studies have addressed the genetic diversity of Tunisian melon landraces using either morphological [8,22] or molecular markers [23,24]. This investigation is the first report on the assessment of the genetic diversity and structure of the Tunisian melon germplasm by combining both morphological descriptors and SSR markers. Landraces and local breeding lines belonging to different botanical groups were included to evaluate the intra and inter variation among accessions and among botanical groups and to examine the level of untapped genetic variation in the local germplasm that could be exploited in future melon improvement programs.

2. Materials and Methods

2.1. Plant Material and Experimental Design

A melon collection including 14 landraces and 10 breeding lines was considered in this study (Table 1). Native landraces adapted to their growing conditions represent an opportunity to explore their variability and identify promising traits. The landraces, named as indicated by the farmers, were open-pollinated landraces collected during 2016 and 2017 from different geographic regions of Tunisia. The breeding lines, derived from landrace individuals, were selected at the CRRHAB Tunisia research center for their resistance to fungal diseases (Fusarium wilt or Powdery mildew) and maintained by self-pollination for 4 years. Characterization of both landraces and breeding lines is necessary for an efficient breeding program and to release new elite cultivars. The accessions were previously morphologically classified into five botanical groups of C. melo subsp. melo (inodorus, reticulatus, cantalupensis, flexuosus, and chate; 16, 3, 2, 2, and 1 accessions, respectively) according to Pitrat [2].
The experiment was carried out from February to July during two seasons, 2018 and 2019, at the experimental station of Sahline-CRRHAB located in the Central East Region of Tunisia (35°45′02″ N, 10°42′44″ E). Accessions were initially sown in compost, and seedlings at the three-leaf stage were transplanted into a greenhouse. Three replications containing 10 plants of each accession were arranged in a randomized complete block design with a row spacing of 80 cm and a within-row spacing of 40 cm. During culture, agronomic practices including irrigation, weeding, and fertilization were conducted uniformly as required in all plots.

2.2. Phenotypic Characterization

Melon accessions were scored for 12 quantitative and 12 qualitative traits related to leaf, stem, flower, fruit, and seed. Five central plants of each accession in each replication were selected for sampling. The traits were selected following the descriptor lists of the International Union for the Protection of New Varieties of Plants (UPOV). Quantitative data were recorded on (1) days to maturity, from sowing to harvest, (2) stem diameter and length, (3) number of fruits per vine, (4) fruit weight, length, diameter, and thickness, (5) cavity diameter, (6) total soluble solids, and (7) 100-seed weight. Qualitative data concerned (1) sex expression (andromonoecious or monoecious), (2) leaf color and blade size, (3) separation of peduncle from fruit, (4) fruit grooves and netting, (4) fruit shape, (5) fruit skin and flesh color, (6) fruit firmness andshelf life, and (7) seed color.
The quantitative traits (length, width, and diameter) were measured with a ruler or caliper, fruit weight was measured with an electronic balance, and fruit firmness was measured with a penetrometer, while qualitative traits were evaluated by attributing a code to each character states mentioned in UPOV guidelines. Total soluble sugars (TSS), expressed as degree Brix (°Brix) in fruit juice, were determined using a digital refractometer (Atago, Tokyo, Japan). Skin and flesh colors of marketable fruits were assessed using the Royal Horticultural Society Color Chart.Observations on leaf blade were made on fully developed but not old leaves, and those related to fruits were made on fully ripe ones. Fruit skin and flesh colors were assessed using the Royal Horticultural Society Color Chart.
Analysis of variance (ANOVA) followed by the Duncan test was performed for quantitative traits to test the significance of variation between the accessions (p < 0.05) using the statistical procedures in SAS software version 9.1 [25].
Pearson correlation analysis was also carried out to estimate the relationship between all quantitative traits and two qualitative traits (fruit firmness and fruit shelf life) using R Studio software version 1.1.456 [26].
To evaluate the levels of phenotypic variation among accessions, Euclidean similarity coefficients were calculated using the Simlnt procedure implemented in NTSYSpc software version 2.1 [27] and served for dendrogram construction using the unweighted pair-group method of averages (UPGMA).

2.3. DNA Extraction and Microsatellite Analysis

Six to seven plants per accession were randomly selected for molecular characterization. Genomic DNA was extracted from young leaves of individual plants using a modified CTAB method [28]. The quality and quantity of DNA were determined using a NanoDrop ND-10000 spectrophotometer (NanoDrop Technologies, Wilmington, DE, USA), and the diluted DNA (10 ng/μL) was stored at −20 °C until PCR analysis.
A set of eight SSRs, previously proven to be highly performant for genetic melon characterization, were used to assess the genetic diversity between and among accessions in our collection [29,30]. These SSRs were selected for their high polymorphism, for their equitable distribution throughout the genome, for their similar annealing temperature (55 °C) to facilitate the multiplexing of several loci into one capillary electrophoresis run, and because they were mapped on the consensus genetic map in melon published by Diaz et al. [31].
PCR amplification reactions were carried out according to Mallor et al. [32]. Amplifications were performed in a total volume of 20µL containing 12.5 ng of genomic DNA, 1 × PCR buffer (20 mM Tris–HCl pH 8.4 + 50 mM KCl), 2 mM MgCl2, 65 µM of each dNTP (Invitrogen, Carlsbad, CA, USA), 0.0625 µM of forward primer extended by 18 nt M13 tail at its 5′ end, 0.25 µM of each reverse and M13-forward primer (5′-CACGACGTTGTAAAACGAC-3′) labeled with one of the four fluorescent dyes (6-FAM, VIC, PET, or NED; Applied Biosystems, Foster City, CA, USA), and 0.2 U of Taq DNA polymerase (Invitrogen). Amplification reactions were performed in a Perkin-Elmer 9700 thermocycler (Norwalk, CT, USA) with the following program: 5 min denaturation at 94 °C followed by 35 cycles at 94 °C for 15 s, 55 °C for 15 s, and 72 °C for 15 s, with a final extension at 72 °C for 10 min. Amplified fragments were separated by capillary electrophoresis on an ABI 3130XL Genetic Analyzer (Applied Biosystems, Foster City, CA, USA). The raw data produced and the size of the SSR alleles were analyzed using Peak Scanner software (Applied Biosystems).
The polymorphism of each locus was scored as presence (1) versus absence (0) of a specific allele, and data were transformed into a biallelic matrix using allele size. Genetic parameters (number of alleles per locus (N), number of genotypes per locus (G), observed heterozygosity (Ho), expected heterozygosity (He), Shannon’s information index (I), fixation index (Fis), or inbreeding coefficient) were determined using GenAlEx software version 6.5 [33]. The polymorphism information content (PIC) value was calculated using the formula described by Botstein et al. [34].
The genetic distance between accessions based on the simple matching (SM) coefficient was estimated using the software NTSYSpc 2.1 [27]. The resulting matrix served as input data for the cluster analysis using the UPGMA to generate a dendrogram.
Moreover, analysis of the molecular variance (AMOVA) among and within populations was performed using GenAlEx 6.5 program.
A joint analysis based on a combination of phenotypic and genotypic similarity matrix was also conducted. Quantitative traits were converted into three discrete classes as reported in Yildiz et al. [35].
To measure the goodness of fit for the phenotypic and molecular cluster analysis, cophenetic correlation values between the original similarity matrices and the cophenetic matrices given by the UPGMA clustering process were calculated by a Mantel test procedure [36]. Correlation between morphological characters and molecular markers was also tested using the same procedure.

2.4. Population Structure

The software package STRUCTURE version 2.3.1 [37] was used to provide the most reliable grouping of the 24 melon accessions, which was analyzed using a Bayesian method (100,000 burn-ins, 100,000 Markov Chain Monte Carlo) under the admixture model. To determine the proper number of clusters (K), criteria set by Evanno et al. [38] were followed.
Several population numbers (from K = 1 to 10) were tested, and the logarithm posterior probability for each K was recorded. The total number of populations was set when the probability reached a plateau for higher K. Genotypes were assigned to defined populations if the value of the corresponding membership probability was higher than 0.8; otherwise, they were considered to be admixed.

3. Results

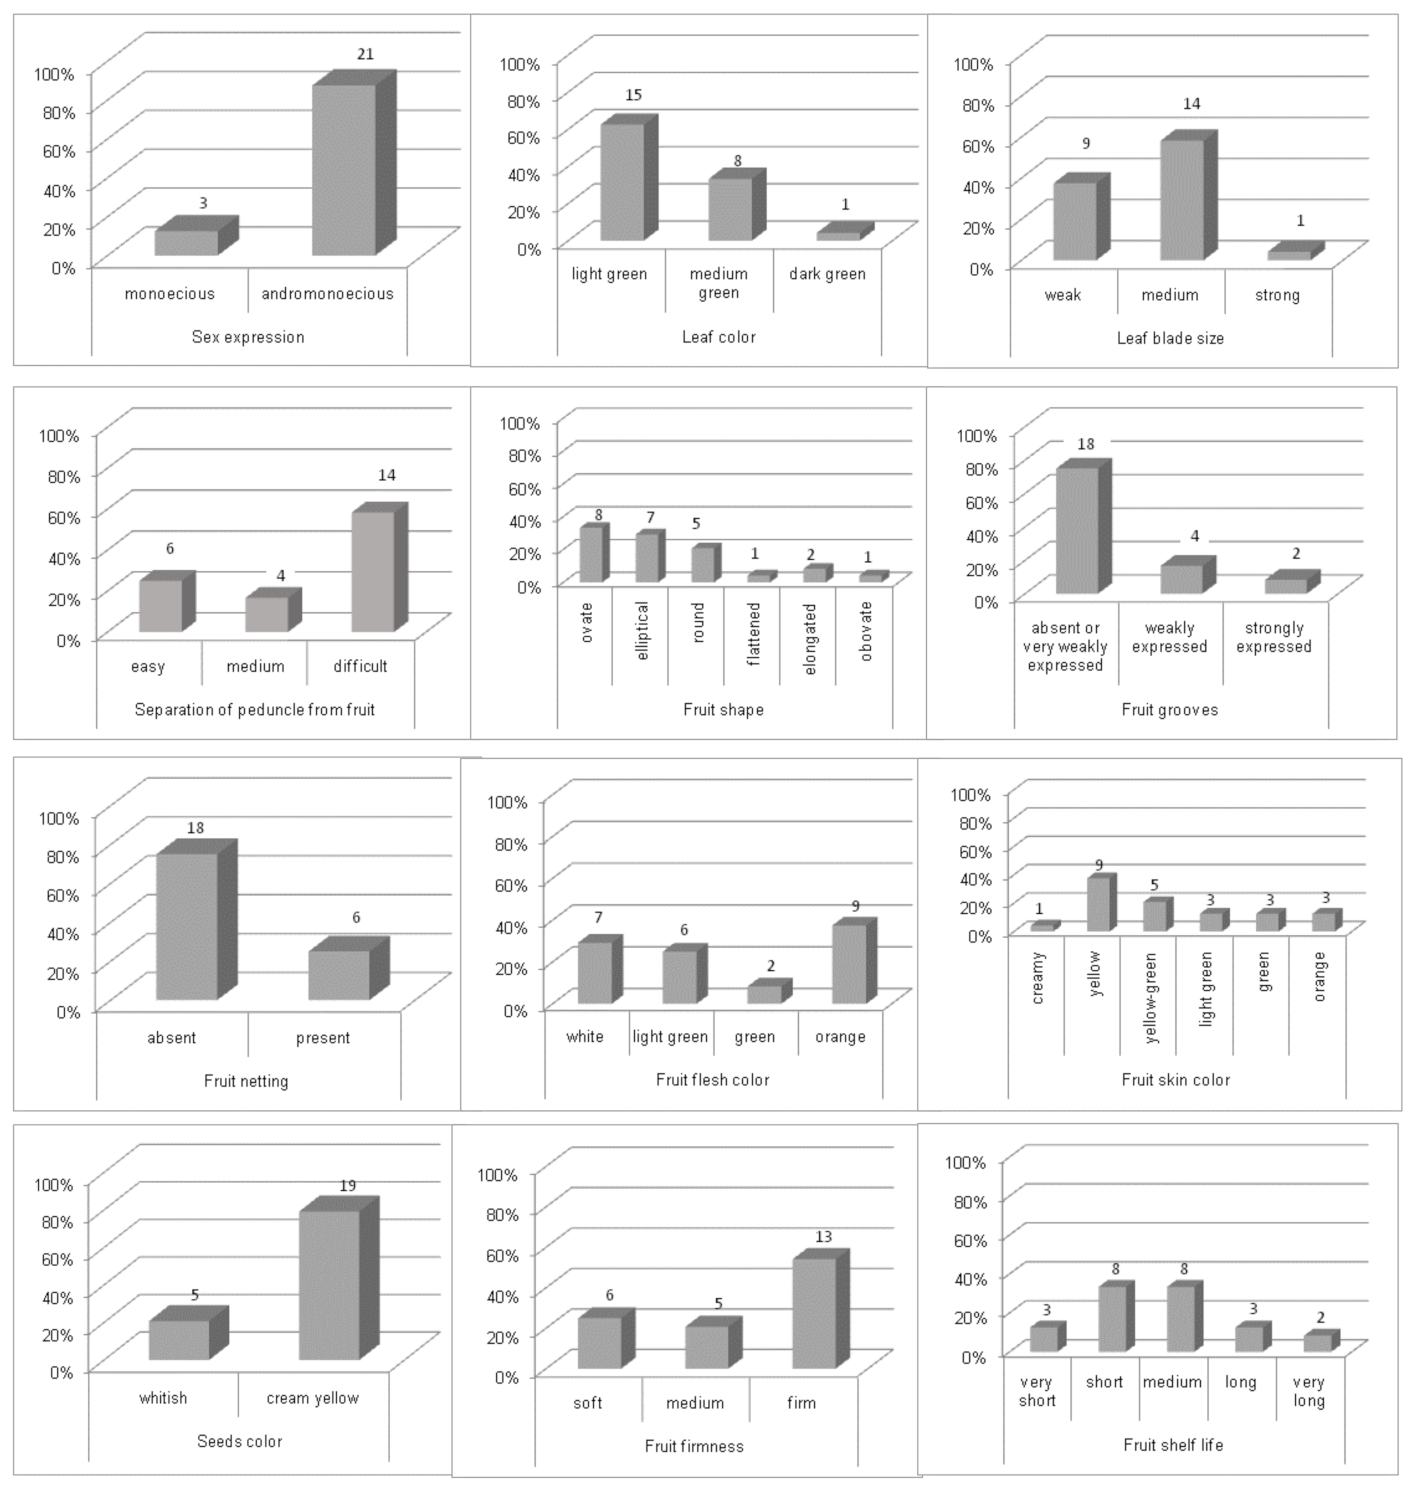
3.1. Phenotypic Characterization

The melon accessions under study showed a wide range of variability for almost all the phenotypic traits studied. The frequency distribution for 12 qualitative characters (discontinuous variables) is shown in Figure 1, in which fruit characters showed the highest level of polymorphism. Six fruit shapes were observed in the studied accessions, whereby ovate (33.3%) and elliptical (29.2%) shapes were the most abundant followed by round shape (20.8%); elongated fruits were observed at 8.4% for the accessions of flexuosus group, while flattened and obovate fruits were observed at 4.2%.
Fruit skin color was also distributed into six classes including yellow (37.5%), yellow-green (20.8%), light green, green, and orange with the same frequency (12.5%), and creamy (4.2%). Flesh color was distributed into four classes; the majority had orange flesh (37.5%). The majority of accessions were found to be non-sutured (75%), without netting (75%), and presented a strong attachment of the peduncle to the fruit (58.3%).
For improving the shelf life of melon fruits, firmness is an important trait for maintaining the quality of fruits; 54.2% of the accessions were firm, 20.8% were moderately firm, and 25% were soft. A short (15 days) to medium (25–30 days) shelf life was observed in 66.6% of accessions; 12.5% of accessions had a very short (approximately 1 week) or long shelf life (55 days), and 8.3% of the accessions showed a very long shelf life (approximately 3 months) for some accessions of inodorus group. Melon accessions were andromonoecious (87.5%) for those belonging to inodorus, cantalupensis, and reticulatus groups, and monoecious (12.5%) for those belonging to flexuosus and chate groups (Figure 1).
Analysis of variance applied to quantitative characteristics (Table 2) showed significant (p < 0.05) to highly significant (p < 0.0001) differences between accessions for all recorded traits. The coefficient of variation ranged from 5.5% (lowest) to 46.5% (highest) for the date to maturity (DM) and fruit length (FL), respectively. Accessions of the non-sweet group (FL, L2-FL (flexuosus), and Horch (chate)) presented the lowest values for date to maturity (103–105 days), fruit weight (84–204.9 g), fruit diameter (3–4.4 cm), fruit thickness (0.5–2 cm), and total soluble solids (4.7–7.4 °Brix), whereas accessions L10-Anan and Arbi5 belonging to the reticulatus group had the highest fruit weight (1765.2 g and 1489.6 g, respectively) followed by L13-Raf (1373 g, inodorus). This accession was also distinguished by its latest maturity (DM = 159 days), as well as its largest and thickest fruits (FD and FT = 13.9 cm and 3.8 cm, respectively), whereas the accession Arbi2 of the inodorous group showed the lowest TSS (8.4 °Brix) among the sweet group (reticulatus, cantalupensis, and inodorus).
Pearson correlation coefficients (r) were calculated to determine the relationships between all quantitative parameters and two qualitative parameters (fruit firmness and fruit shelf life). A total of 20 features were correlated at a p < 0.05 significance level (Figure 2). Date to maturity (DM) was significantly and positively correlated with fruit diameter (FD; r = 0.87), fruit thickness (FT; r = 0.75), cavity diameter (CD; r = 0.68), and total soluble solids (TSS; r = 0.68) but negatively correlated with fruit number (FN; r = −0.75). Fruit diameter was positively and significantly correlated with fruit weight (FW; r = 0.86), fruit thickness (FT; r = 0.83), and cavity diameter (CD; r = 0.83) but negatively correlated with fruit number (FN, r = −0.75). Significant and positive correlations were also observed between fruit weight (FW) and cavity diameter (CD; r = 0.81) and between CD and 100-seed weight (100-SW; r = 0.66), whereas TSS had a significant and negative correlation with fruit number FN (r = −0.83) and stem length (SL; r = −0.54).
A dendrogram combining quantitative and qualitative traits was generated to evaluate the general pattern of variance and to establish the relationship among melon accessions (Figure 3). Accessions were discriminated into two main clusters. The first cluster CL1 included three accessions of flexuosus and chate botanical groups characterized by a monoecious sex expression, the lowest fresh weights, and a non-sweet taste. The second cluster CL2 was formed by the remaining 21 accessions belonging to three groups (cantalupensis, reticulatus, and inodorus) characterized by an andromonoecious sex expression, an intermediate to high fresh weight, and a sweet taste. CL2 was subdivided into two subclusters, the first one (CL2-1) containing four accessions characterized by the highest fresh weights and the second one (CL2-2) containing 17 accessions characterized by intermediate fresh weights.

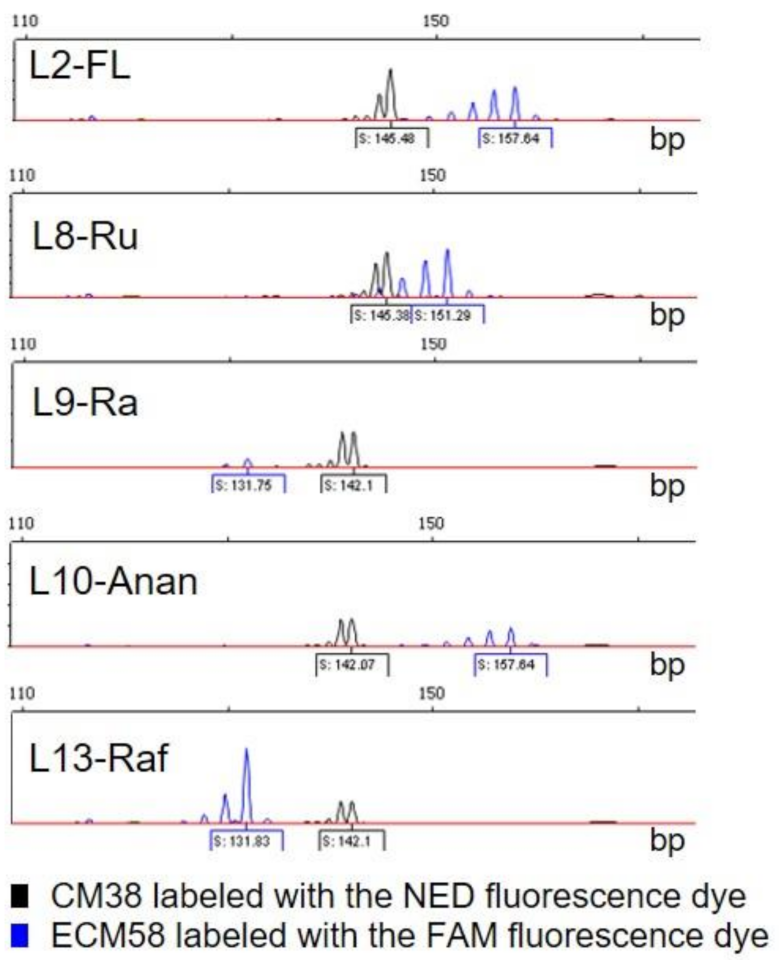
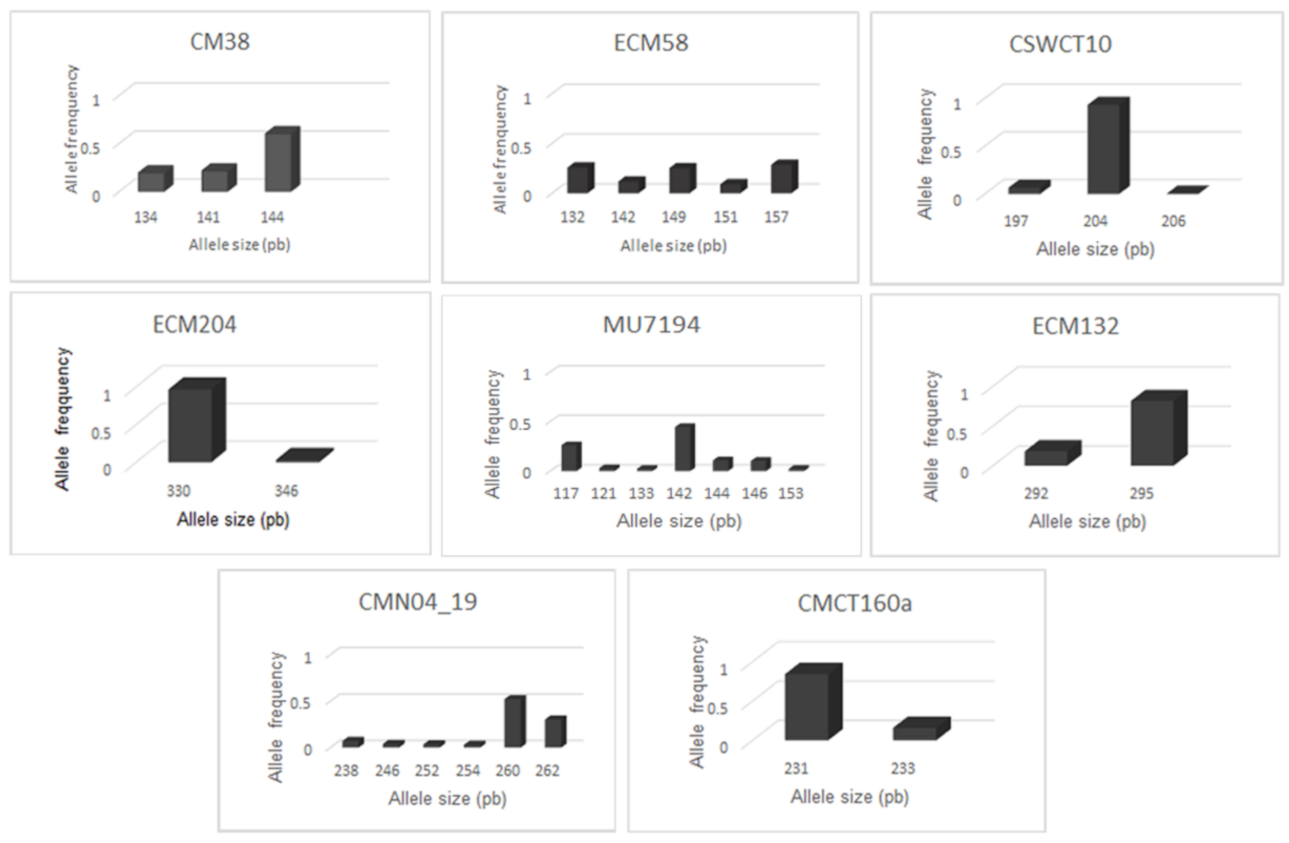
3.2. Molecular Characterization

All SSR markers were polymorphic, and there were no duplicates in the collection. An example of a capillary SSR profile using CM38- and ECM58- labeled primers is shown in Figure 4. A total of 30 alleles were identified in 166 plants representing 24 accessions. The number of identified alleles ranged from two for ECM204, ECM132, and CMCT160 to seven for MU7194, with an average of 3.75 alleles per locus. The length of the amplified fragments ranged from 117 to 346 bp. A total of 53 genotypes were generated (Table 3). Allele frequencies ranged from 0.003 for locus CSWCT10 allele 206 to 0.96 for locus ECM204 allele 330 (Figure 5). Allele 206 (CSWCT10; 0.003) and allele 153 (MU7194; 0.024) were specific to the Arbi4 and Horchay accessions, respectively.
The PIC value, estimating the discriminatory power of loci, ranged from 0.06 (ECM204) to 0.76 (ECM58) with an average of 0.43 (Table 3). Shannon’s information index (I) was between 0.14 (ECM204) and 1.5 (ECM58) with an average of 0.82. The observed heterozygosity (Ho) ranged between 0.01 for ECM204 and 0.19 for ECM58 with an average of 0.1, being lower than expected (He = 0.12). He was lower for the loci with a low number of alleles and higher for the loci with a high number of alleles. The low level of heterozygosity within accessions wasconfirmed by a positive inbreeding coefficient (Fis = 0.04).
The pattern of relationships among the 24 accessions is depicted in the UPGMA dendrogram based on simple matching (SM) coefficient (Figure 6). There was no clear clustering between the accessions in relation to the collection site and botanical group. However, two major clusters could be defined by cutting the dendrogram at the lowest range of similarity value (0.57). The first cluster (CL1) included two landraces FL and Arbi2. The second one (CL2) contained the remaining 12 landraces intermixed with the 10 breeding lines. At about a 0.70 similarity level, CL2 was subdivided into four groups; the first group (G1) consisted of 13 accessions (Maaz1, Maaz2, L1-Maaz, L3-Trab, Dz1, L9-Ra, L10-Anan, L4-Gal, Arbi5, L2-FL, L5-Dz, L7-Sara, and L8-Ru), with most of them (nine) being breeding lines. The remaining nine accessions (Maaz3, Maaz4, Horch, Arbi6, L13-Raf, Dz2, Arbi1, Arbi3, and Arbi4) were spread by pairs or triplets into the three other groups (G2–G4). Intermixing of landrace and breeding line accessions belonging to different taxa indicated a genetic resemblance with each other.
According to the genetic distance matrix (data not shown), the most similar accessions were Arbi6 and L13-Ra (SM = 0.99) followed by L7-Sarac and L8-Ru (0.96) and L9-Ra and L3-Trab or Dz1 (0.90); the most dissimilar ones were FL and Maaz3 (0.38) followed by FL and Dz1 or Dz2, Horch, and Dz2 with asimilar coefficient of 0.48.
Analysis of molecular variance (AMOVA) was used to estimate the partitioning of genetic variance among and within populations (Table 4). AMOVA results based on SSR data revealed that the largest proportion (75%) of the total genetic variance occurred among accessions, and only 25% occurred within accessions.

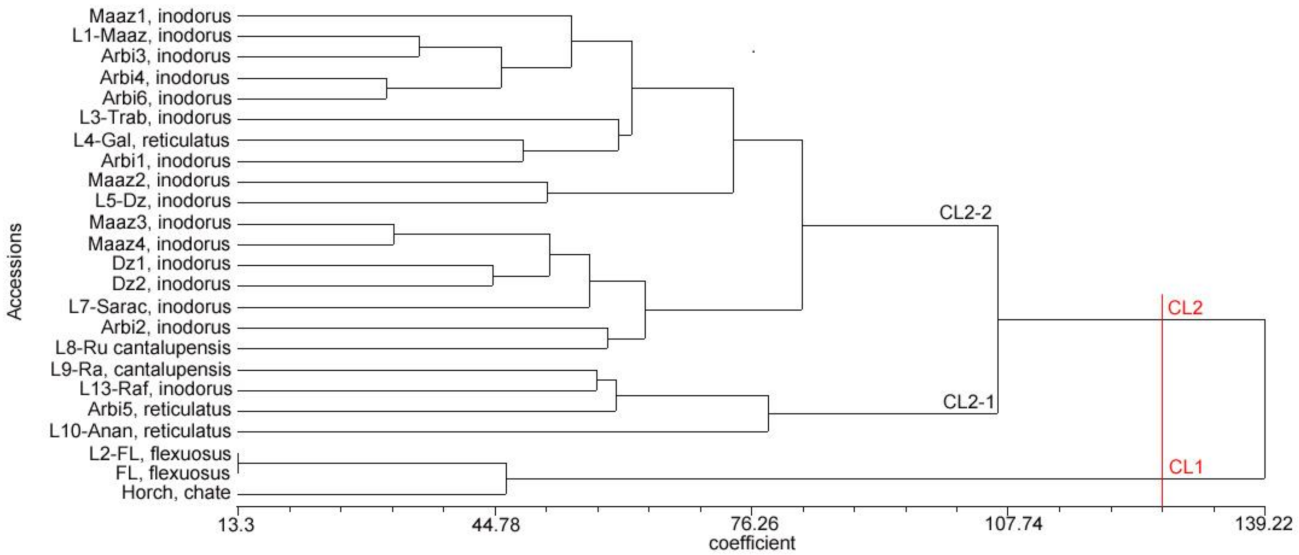
3.3. Combined Analysis of Phenotypic and Genotypic Data

At the lowest range of similarty 0.62, the combined phenotypic–molecular dendrogram (Figure 7) separated melon accessions into two main clusters, CL1 (non sweet melon) and CL2 (sweet melon), as shown by the phenotypic dendrogram, but with a more precise grouping of accessions in CL2, according to the botanical group. Thus, this cluster was formed by four groups (G1–G4) with G1 containing most (12) of the inodorus accessions except for Arbi1 (G2), L7-Sarac (G2), Dz2 (G3), and Arbi2 (G4), whereas cantalupensis accessions (L8-Ru and L9-Ra) and reticulatus accessions (L4-Gal, L10-Anan, and Arbi5) were clustered together in G2 with L10-Anan and Arbi5 and L8-Ru and L9-Ra being located close to each other.

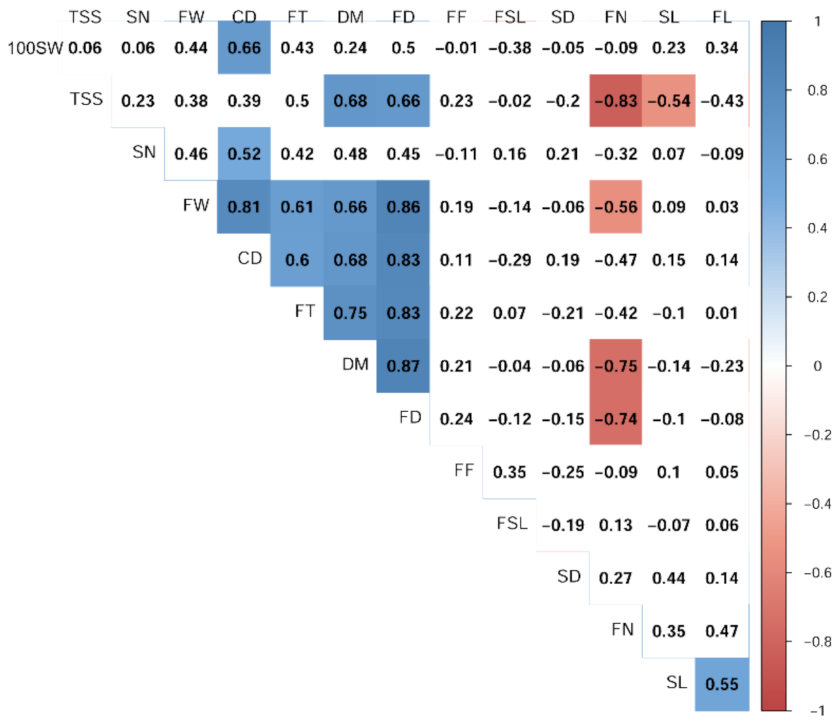
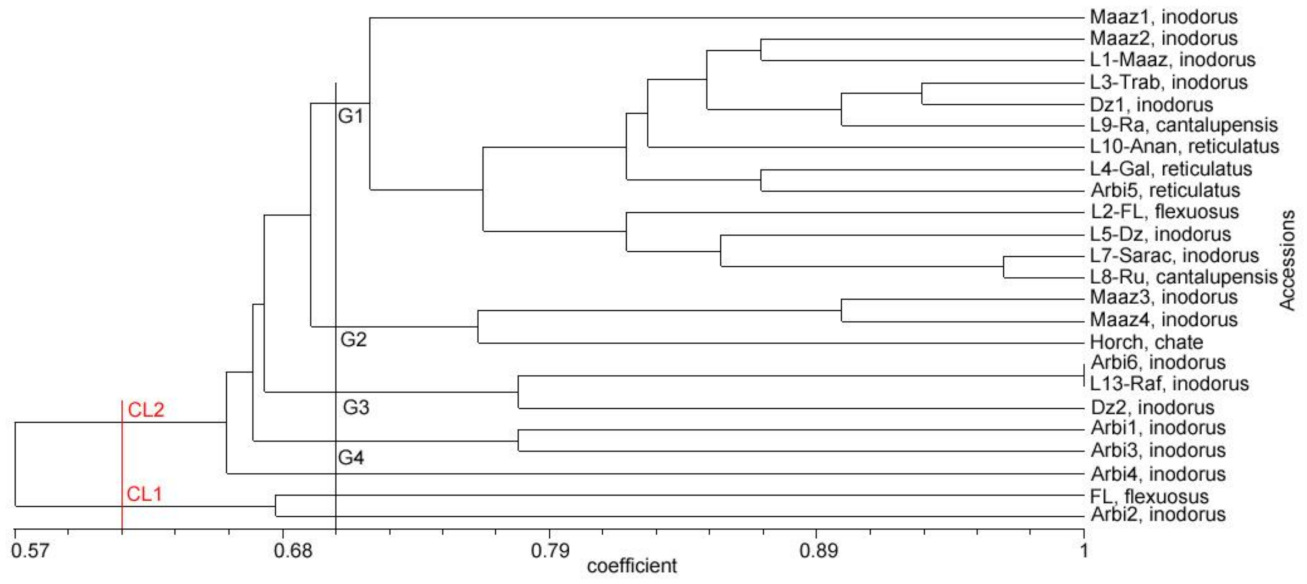
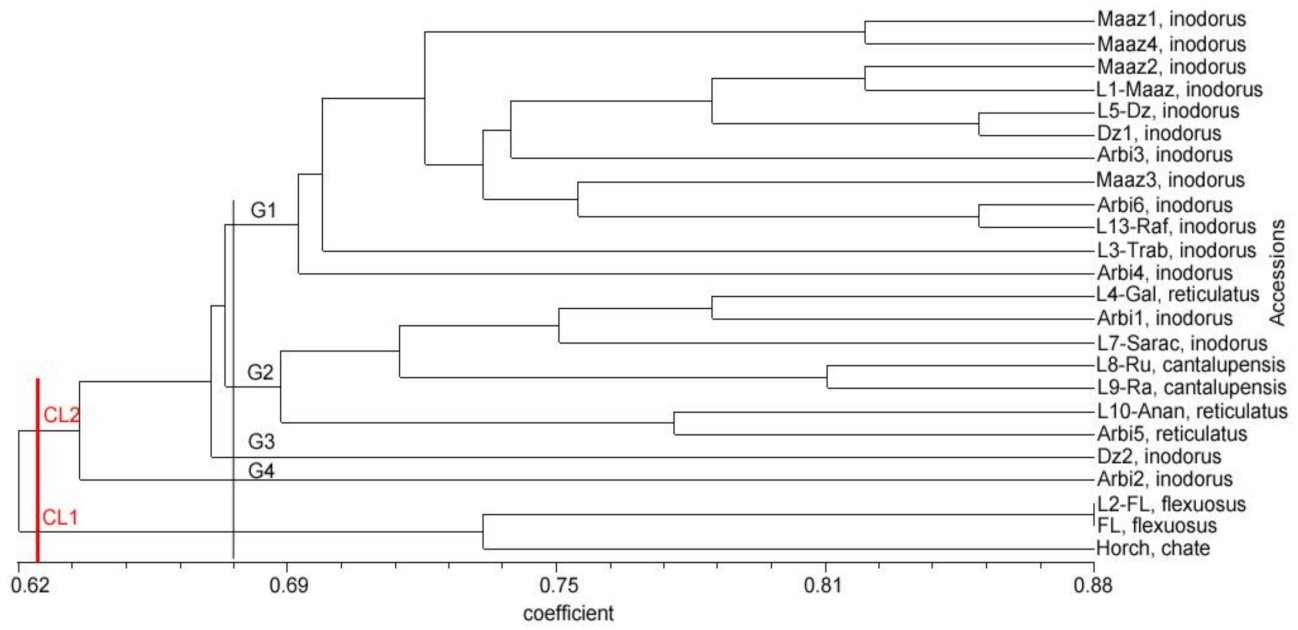
3.4. Relationships and Concordance between Phenotypic and Molecular Markers

The cophenetic correlation coefficient value between the dendrogram and the original distance matrix estimated from the phenotypic and SSR markers was rmorph = 0.71 and rSSR = 0.75, respectively (data not shown), indicating a good fit for both data. A negative and non significant correlation between morphological characters and molecular markers (r = −0.16, p = 0.06) was found, confirming the disparity between morphological variation and genetic polymorphism of the studied accessions.

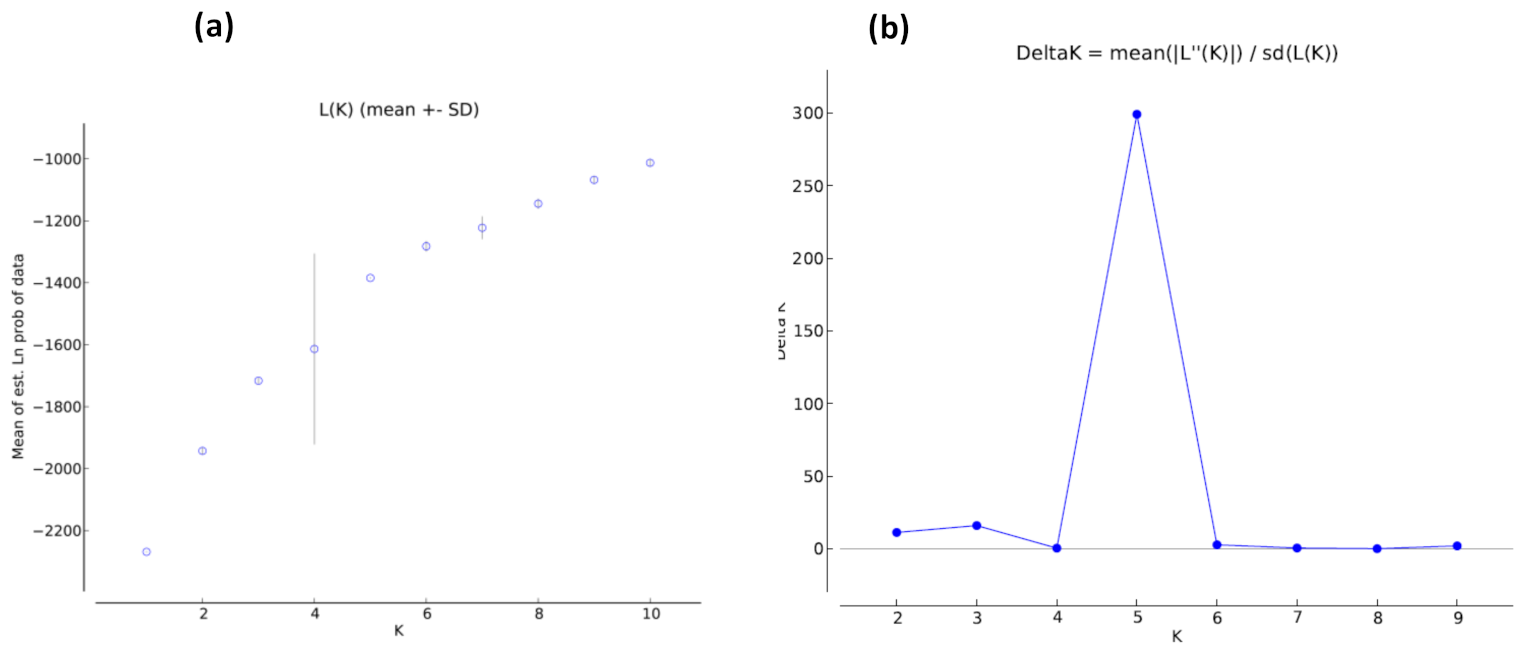
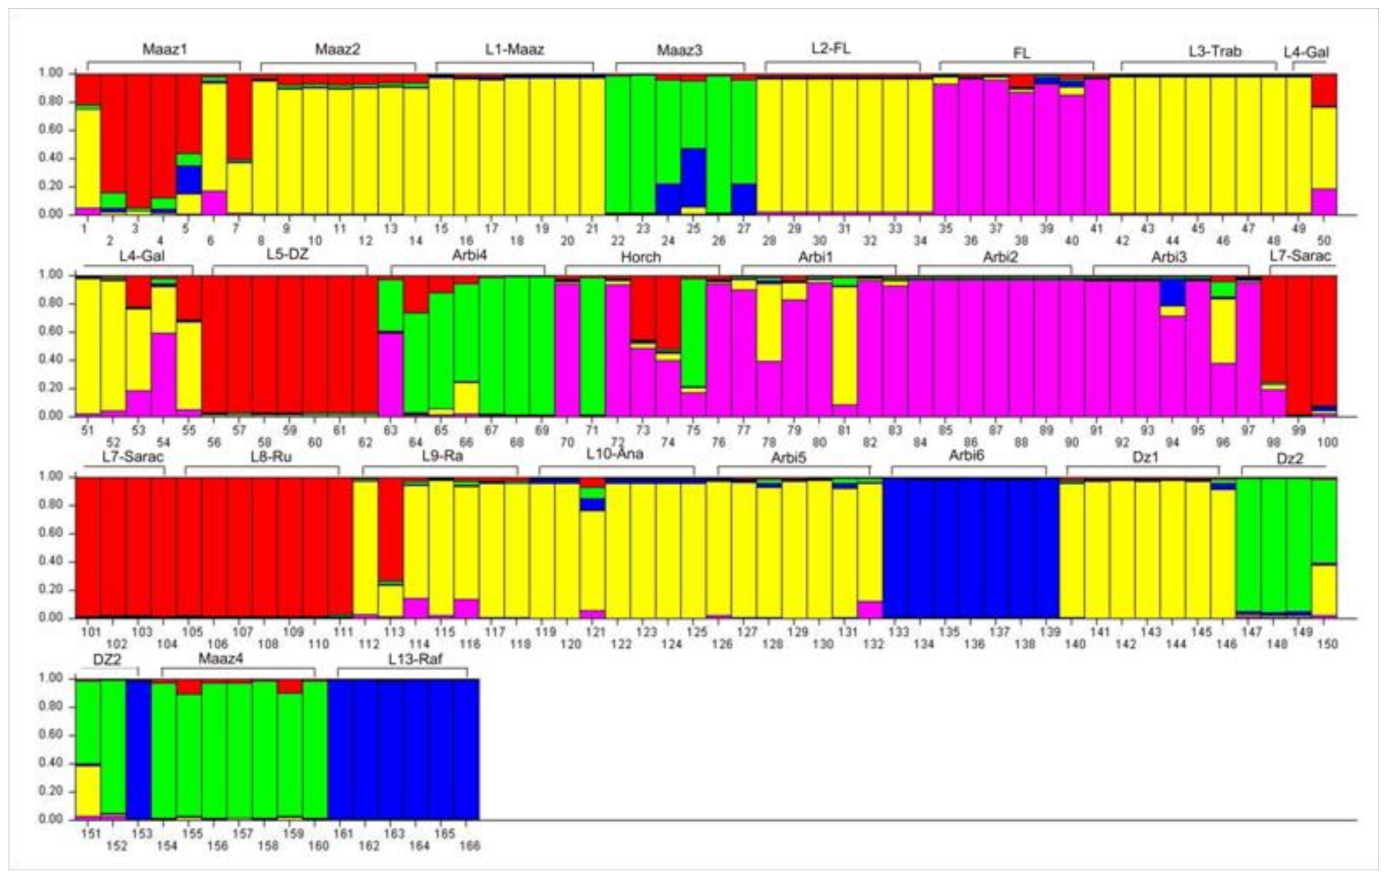
3.5. Population Structure

Genetic structure analysis of the individual samples using STRUCTURE was used to provide the most reliable discrimination of the melon accessions. The analysis indicated an intermixed genetic structure between landraces and breeding lines, as well as among botanical groups. Evanno’s test indicated that the most informative number of subpopulations (K) was 5 (Figure 8) suggesting the existence of five major groups in the collection, as previously revealed by the molecular cluster analysis. The different groups were defined by five colors (Figure 9). The yellow color predominated the genetic profile of the tested accessions, followed by the red, pink, green, and blue colors. The first group, with a genetic profile dominated by a yellow color, included accessions Maaz2, L1-Maaz, L2-FL, Dz1, L3-Trab, L9-Ra, L10-Ana, and Arbi5 grouped in the UPGMA tree (G1). The second group, with a red color, contained breeding lines L5-Dz, L7-Sarac, and L8-Ru (G1). The third group, dominated by blue color, included landraces Arbi6 and L13-Raf (G3 with SM coefficient = 0.99). The fourth group, with a pink color, included landraces FL, Arbi2 (cluster 1), and Arbi3. Lastly, the fifth group, dominated by a green color, was formed by Arbi4, Dz2, and Maaz4. Accessions belonging to these groups had all individuals with a membership higher than 0.8, indicating that they were strongly assigned to subpopulations, except for Arbi 4, Arbi 3, L9-Ra, and Dz2, each displaying one to three individuals with an admixture allelic form (membership < 0.8). The remaining accessions, with membership probabilities lower than 0.8 for almost all individuals, were classified into an admixture group. This group included five accessions: Maaz1, Maaz3, L4-Gal, Horch, and Arbi1 (Figure 9).

4. Discussion

Landraces are a valuable repository of gene pool for breeding in a changing environment. They often harbor rich genetic diversity, important for traditional agriculture sustainability under climatic change conditions [39]. The Tunisian melon germplasm is a reservoir of genes for unique traits related to biotic stress resistance [4,5,6,40] and fruit quality [15] which can be transferred to modern cultivars through hybridization. The assessment of genetic diversity and structure of such a unique gene pool is a prerequisite for its efficient organization, conservation, and utilization for melon improvement, new cultivar deployment, and hybrid seed production.
In the present study, we investigated the genetic diversity and population structure for 24 Tunisian melon accessions including landraces and local breeding lines. Phenotypic characterization showed a wide range of variability among accessions of different botanical groups for almost all the phenotypic traits studied, and each group presented specific traits consistent with the horticultural taxonomy proposed by Pitrat [2]. High morphological variability among botanical groups and among melon landraces was previously reported in many countries [18,35,41].
In the UPGMA dendrogram combining quantitative and qualitative phenotypic traits, the accessions of the non-sweet group (flexuosus and chate) were separated from the other ones on the basis of fruit shape, weight, and sweetness, in addition to their monoecious sex expression, whereas accessions of the sweet group (cantalupensis, reticulatus, and inodorus) were intermixed. The lack of consistency in the clustering of accessions from the same botanical groups was also observed by Soltani et al. [42] and Aragão et al. [43]. However, Yildiz et al. [35] showed that the accessions of the flexuosus group were clustered with the sweet ones. One of the reasons for this variation is the inevitable out-crossing among melon genotypes. Intermediate forms might have been formed among the different groups due to the old farming practices employed by local small-scale melon producers in the different countries.
Compared with morphological traits, molecular analysis is independent of environmental effects and can provide additional and precise information for the assessment of genetic diversity [13,44]. In this study, all SSR markers were polymorphic and displayed a moderate polymorphic information content (PIC = 0.43). The number of alleles ranged from 2–7 with an average of 3.75 alleles per locus, being higher than the 2.54 alleles reported by Henane et al. [23] but lower than the 9.3 alleles reported by Trimech et al. [24]. Aragão et al. [43] and Malik et al. [41] considered that these differences were due to different genetic material and molecular markers used in each experiment.
Despite the allogamous reproductive system of melon and the significant phenotypic variation observed in our collection, the observed heterozygosity was lower (H0 = 0.1) than the expected heterozygosity (He = 0.12), which revealed an excess in homozygosis further confirmed by the positive value of fixation index or inbreeding coefficient (Fis = 0.04). It is likely that selection, practiced by farmers or CRRHAB’s breeders for traits of agronomic interest such as good growth and disease resistance, acted simultaneously upon many loci, controlling a variety of traits under selection. This would greatly reduce diversity throughout the genome and lead to inbreeding depression and higher homozygosity [45].
Two private alleles were detected in the screening collection, allele 206 (in Arbi4, inodorus group) and allele 153 (in Horchay, chate group). Private alleles were also observed in the inodorus ‘Yellow Canary’ commercial variety and in the dudaim ‘Chemoum’ landrace in Tunisia [24], in a wild and cultivated melon germplasm in China [46], and in heirloom and open-pollinated watermelon commercial cultivars in USA [47]. These alleles may be of interest to conservationists and breeders aiming to preserve and exploit diversity, as they are present only in a single population among a broader collection of populations [48,49].
Both STRUCTURE and SM tree analyses based on SSR markers displayed that landraces and breeding lines were intermixed into five clusters independent of the botanical groups. Insignificant distinctions among sweet and non-sweet genotypes and among inodorus and cantalupensis genotypes were previously reported by Yildiz et al. [50] and Sensoy et al. [51]. Intermixed clustering was also observed in accessions from different geographic regions. Malik et al. [41] showed an affinity between Indian and USA melons, and Singh et al. [14] indicated a significant genetic resemblance between Indian modern cultivars/newly derived inbred lines and exotic accessions; this was attributed to a human-mediated transportation of the melon germplasm across geographic locations and/or a great extent of outcrossing among melon genotypes because of the allogamy of the species.
Comparison of the morphological and molecular data in our study demonstrated discordance of grouping the accessions between the two data sets. This was confirmed by the negative correlation (r = −0.16) exhibited by the Mantel test, despite being weak and not significant (p = 0.06). The reasons might be that (i) the morphogenesis of melon accessions has been shaped not only by genes but also by environmental conditions, with some quantitative traits being especially greatly influenced by the environment [52], or (ii) the polymorphic loci amplified by SSR markers were not linked to the scored agro-morphological traits, such that the basis of classification was different [53]. Moreover, the number of SSR markers used might be one factor for this disparity, as an increased number of SSRs may lead to a greater similarity. Inconsistencies between phenotypic and genotypic data were reported in melon and in other vegetable species [18,35,52,53,54], and the use of a joint matrix derived from combined phenotypic and molecular matrices was performed in our study in order to increase precision. Indeed, a total discrimination of sweet and non-sweet accessions, as well as a more precise clustering among inodorus, cantalupensis, and reticulatus subgroups, was obtained compared to the separate morphological and molecular data analyses. Both markers are complementary and essential for the efficient conservation of genetic resources and selection of potentially valuable parent lines in breeding programs.

5. Conclusions

This study added further information about the intra and inter variation among local melon genetic resources. Both molecular and morphological features are useful and will facilitate the selection process; the results obtained in the present study can be used for the sustainable conservation and management of melon genetic resources. Landraces with agronomical performance and private alleles can potentially constitute a valuable gene pool for melon breeding, especially in a scenario of rapid climate change. Further phenotypic and molecular studies on national collections, including local varieties, landraces, hybrids, introduced accessions, breeding lines, and wild species, might be necessary for a better understanding of the Tunisian melon gene pool.

Author Contributions

Conceptualization, H.C.-R., N.M. (Najla Mezghani) and A.G.-C.; methodology, H.C.-R., N.M. (Najla Mezghani) and A.G.-C.; validation, H.C.-R., N.M. (Najla Mezghani) and A.G.-C.; formal analysis, H.C.-R., N.M. (Najla Mezghani), S.M. and N.M.; writing—original draft preparation, H.C.-R. and N.M. (Najla Mezghani); writing—review and editing, H.C.-R., N.M. (Najla Mezghani), S.M., N.M. (Neila Mezghani) and A.G.-C.; funding acquisition, A.G.-C. All authors have read and agreed to the published version of the manuscript.

Funding

This research was supported in part by the Spanish Ministerio de Ciencia, Innovación y Universidades, co-funded with FEDER (AGL2017-85563-C2-2-R) and partially financed by Aragon Government grant for Research group, A11-20R-PROVESOS.

Institutional Review Board Statement

Not applicable.

Informed Consent Statement

Not applicable.

Data Availability Statement

The data presented in this study are available on request from the corresponding author.

Acknowledgments

The authors are grateful to Rafika Sta-Baba in CRRHAB-Tunisia for providing seeds of some breeding lines.

Conflicts of Interest

The authors declare no conflict of interest.

References

  1. Whitaker, T.W.; Davis, G.N. Cucurbits: Botany, Cultivation and Utilization; Interscience Publishers: New York, NY, USA, 1962; 249p. [Google Scholar]
  2. Pitrat, M. Melon Genetic Resources: Phenotypic Diversity and Horticultural Taxonomy. In Genetics and Genomics of Cucurbitaceae; Grumet, R., Katzir, N., Garcia-Mas, J., Eds.; Springer: Cham, Switzerland, 2016; Volume 3, pp. 25–60. [Google Scholar]
  3. McCreight, J.D.; Nerson, H.; Grumet, R. Melon (Cucumis melo L.). In Genetic Improvement of Vegetable Crops, 7th ed.; Kalloo, G., Berch, B.O., Eds.; Pergamon Press: Oxford, UK, 1993. [Google Scholar]
  4. Chikh-Rouhou, H.; Kacem, K.; Letaief, S.; Sta-Baba, R. Evaluation of Tunisian melon genetic resources to biotic stress under greenhouse conditions. In Proceedings of the XIth International Agriculture Symposium (AGROSYM 2020), Jahorina, East Sarajevo, 8–9 October 2020; Book of abstracts. p. 276. [Google Scholar]
  5. Chikh-Rouhou, H.; Garcés-Claver, A.; Sta-Baba, R.; González, V.; Daami-Remadi, M. Screening for resistance to race 1 of Fusarium oxysporum f.sp melonis in Tunisian melon cultivars using molecular markers. Comm. Agric. Appl. Biol. Sci. 2018, 83, 87–92. [Google Scholar]
  6. Chikh-Rouhou, H.; Ben Belgacem, A.M.; Sta-Baba, R.; Tarchoun, N.; Gómez-Guillamón, M.L. New source of resistance to Aphis gossypii in Tunisian melon accessions using phenotypic and molecular marker approaches. Phytoparasitica 2019, 47, 405–413. [Google Scholar] [CrossRef]
  7. M’nari, M.; Jebari, H.; Cherif, C. Study of strains of cucumber mosaic virus (CMV) on Tunisian melon and identification of resistant genotypes. Cah. Agric. 1993, 2, 60–62. [Google Scholar]
  8. Chikh-Rouhou, H.; Tlili, I.; Ilahy, R.; Chaar, H.; Sta-Baba, R. Evaluation de la diversité morphologique de quelques accessions locales de melon (Cucumis melo L.). Annales de l’INRAT 2020, 93, 171–183. [Google Scholar]
  9. Elbekkay, M.; Hamza, H.; Haddad, M.; Ferchichi, A.; Kik, C. Genetic erosion in melon (Cucumis melo): A case study from Tunisia. In Cucurbitaceae 2008, Proceedings of the IXth EUCARPIA Meeting on Genetics and Breeding of Cucurbitaceae, Avignon, France, 21–24 May 2008; Pitrat, M., Ed.; INRA: Avignon, France.
  10. Escribano, S.; Lazaro, A.; Cuevas, H.E.; Lopez-Sesé, A.I.; Staub, J.E. Spanish melons (Cucumis melo L.) of the Madrid provenance: A unique germplasm reservoir. Genet. Resour. Crop Evol. 2012, 59, 359–373. [Google Scholar] [CrossRef]
  11. Fergany, M.; Kaur, B.; Monforte, A.J.; Pitrat, M.; Lecoq, C.H.; Dhillon, N.P.S.; Dhaliwal, S.S. Variation in melon (Cucumis melo) landraces adapted to the humid tropics of southern India. Genet. Resour Crop. Evol. 2011, 55, 225–243. [Google Scholar] [CrossRef] [Green Version]
  12. Garcia-Mas, J.; Monforte, A.J.; Arus, P. Phylogenetic relationships among Cucumis species based on the ribosomal internal transcribed spacer sequence and microsatellite markers. Plant. Syst. Evol. 2004, 248, 191–203. [Google Scholar] [CrossRef]
  13. Dhillon, N.P.S.; Singh, J.; Fergany, M.; Monforte, A.J.; Sureja, A.K. Phenotypic and molecular diversity among landraces of snapmelon (Cucumis melo var. momordica) adapted to the hot and humid tropics of eastern India. Plant Genet. Resour. 2009, 7, 291–300. [Google Scholar] [CrossRef]
  14. Singh, D.; Leskovar, D.I.; Sharma, S.P.; Sarao, N.K.; Vashisht, V.K. Genetic diversity and inter-relationship among Indian and exotic melons based on fruit morphology, quality components and microsatellite markers. Physiol. Mol. Biol. Plants. 2020, 26, 985–1002. [Google Scholar] [CrossRef]
  15. Chikh-Rouhou, H.; Tlili, I.; Ilahy, R.; R’him, T.; Sta-Baba, R. Fruit quality assessment and characterization of melon genotypes. Int. J. Veg. Sci. 2021, 27, 3–19. [Google Scholar] [CrossRef]
  16. Keneni, G.; Jarso, M.; Wolabu, T.; Dino, G. Extent and pattern of genetic diversity for morpho-agronomic traits in Ethiopian highl and pulse landraces II. Faba bean (Vicia faba L.). Genet. Resour. Crop Evol. 2005, 52, 551–561. [Google Scholar] [CrossRef]
  17. Neuhausen, S.L. Evaluation of restriction fragment length polymorphism in Cucumis melo. Theor. Appl. Genet. 1992, 83, 379–384. [Google Scholar] [CrossRef]
  18. Lopez-Sesé, A.I.; Staub, J.; Katzir, N.; Gómez-Guillamón, M.L. Estimation of between and within accession variation in selected Spanish melon germplasm using RAPD and SSR markers to assess strategies for large collection evaluation. Euphytica 2003, 127, 41–51. [Google Scholar] [CrossRef]
  19. Garcia-Mas, J.; Seros, M.O.; Gomez-Paniagua, H.; De Vicente, M.C. Comparing AFLP, RAPD and RFLP markers for measuring genetic diversity in melon. Theor. Appl. Genet. 2000, 101, 860–864. [Google Scholar] [CrossRef]
  20. Merheb, J.; Pawełkowicz, M.; Branca, F.; Bolibok-Bragoszewska, H.; Skarzynska, A.; Plader, A.; Chalak, L. Characterization of Lebanese germplasm of snake melon (Cucumis melo subsp. melo var. flexuosus) using morphological traits and SSR Markers. Agronomy 2020, 10, 1293. [Google Scholar]
  21. Lakshmana Reddy, D.C.; Sudurashini, K.V.; Anand, C.R.; Aswath, C.; Avinash, K.N.; Nandini, H.; Sreenivasa Rao, E. Genetic diversity and population structure of Indian melon (Cucumis melo L.) landraces with special reference to disease and insect resistance loci. Plant Breed. 2016, 13, 384–390. [Google Scholar] [CrossRef]
  22. Trimech, R.; Zaouali, Y.; Boulila, A.; Chabchoub, L.; Ghezal, I.; Boussaid, M. Genetic variation in Tunisian melon (Cucumis melo L.) germplasm as assessed by morphological traits. Plant Genet. Resour. 2013, 60, 1621–1628. [Google Scholar] [CrossRef]
  23. Henane, I.; Slimane, R.; Jebari, H. SSR-based genetic diversity analysis of Tunisian varieties of melon (Cucumis melo L.) and Fakous (Cucumis melo var. flexuosus). Int. J. Adv. Res. 2015, 3, 727–734. [Google Scholar]
  24. Trimech, R.; Afif, M.; Boussaid, M. Genetic diversity of Tunisian melon (Cucumis melo. L) landraces and their relationships with introduced varieties as assessed by simple-sequence repeat (SSR) markers. Afr. J. Biotec. 2015, 14, 86–95. [Google Scholar]
  25. SAS. Statistical Analysis System, version V.9.1. SAS/ STAT Users Guide. SAS Publishing: North Carolina, NY, USA, 1990. [Google Scholar]
  26. Ihaka, R.; Gentleman, R. R: A Language for data analysis and graphics. J. Comput. Graph Stat. 1996, 5, 299–314. [Google Scholar]
  27. Sokal, R.R.; Michener, C.D. A statistical method for evaluating systematic relationships. Univ. Kans. Sci. Bull. 1958, 38, 1409–1438. [Google Scholar]
  28. Rodríguez-Maza, M.J.; Garcés-Claver, A.; Park, S. A versatile PCR marker for pungency in Capsicum spp. Mol. Breed. 2012, 30, 889–898. [Google Scholar] [CrossRef]
  29. Fukino, N.; Sakata, Y.; Kunihsa, M.; Matsumoto, S. Characterisation of novel simple sequence repeat (SSR) markers for melon (Cucumis melo L.) and their use for genotype identification. J. Hortic. Sci. Biotec. 2007, 82, 330–334. [Google Scholar] [CrossRef]
  30. Fernandez-Silva, I.; Eduardo, I.; Blanca, J.; Esteras, C.; Pico, B.; Nuez, F.; Arus, P.; Garcia-Mas, J.; Monforte, A.J. Bin mapping of genomic and EST-derived SSRs in melon (Cucumis melo L.). Theor. Appl. Genet. 2008, 118, 139–150. [Google Scholar] [CrossRef] [PubMed]
  31. Diaz, A.; Fergany, M.; Formisano, G. A consensus linkage map for molecular markers and Quantitative Trait Loci associated with economically important traits in melon (Cucumis melo L.). BMC Plant Biol. 2011, 11, 111. [Google Scholar] [CrossRef] [PubMed] [Green Version]
  32. Mallor, C.; Arnedo-Andrés, M.S.; Garcés-Claver, A. Assessing the genetic diversity of Spanish Allium cepa landraces for onion breeding using microsatellite markers. Sci. Hortic. 2014, 170, 24–31. [Google Scholar] [CrossRef]
  33. Peakall, R.; Smouse, P.E. GenAlEx 6: Genetic analysis in Excel. Population genetic software for teaching and research. Mol. Ecol. Notes 2006, 6, 288–295. [Google Scholar] [CrossRef]
  34. Botstein, D.; White, R.L.; Skalnick, M.; Davis, R.W. Construction of a genetic linkage map in man using restriction fragment length polymorphism. Am. J. Hum. Genet. 1980, 32, 314–331. [Google Scholar]
  35. Yildiz, M.; Akgul, N.; Sensoy, S. Morphological and Molecular Characterization of Turkish Landraces of Cucumis melo L. Not. Bot. Horti. Agrobo. 2014, 42, 51–58. [Google Scholar] [CrossRef] [Green Version]
  36. Mantel, N.A. The detection of disease clustering and generalized regression approach. Cancer Res. 1967, 27, 209–220. [Google Scholar]
  37. Pritchard, J.K.; Stephens, M.; Donnelly, P. Inference of population structure using multilocus genotype data. Genetics. 2000, 155, 945–959. [Google Scholar] [CrossRef] [PubMed]
  38. Evanno, G.G.; Regnaut, S.; Goudet, J. Detecting the number of clusters of individuals using the software structure: A simulation study. Mol. Ecol. 2005, 14, 2611–2620. [Google Scholar] [CrossRef] [PubMed] [Green Version]
  39. Omari, S.; Kamenir, Y.; Benichou, J.I.C.; Pariente, S.; Sela, H.; Perl-Treves, R. Landraces of snake melon, an ancient Middle Eastern crop, reveal extensive morphological and DNA diversity for potential genetic improvement. BMC Genet. 2018, 19, 34. [Google Scholar]
  40. Chikh-Rouhou, H.; Gómez-Guillamón, M.L.; González, V.; Sta-Baba, R.; Garcés-Claver, A. Cucumis melo L. in Tunisia: Unexploited sources of resistance to Fusarium wilt. Horticulturae 2021. submitted. [Google Scholar]
  41. Malik, A.A.; Vashisht, V.K.; Singh, K.; Sharma, A.; Singh, D.K.; Singh, H.; Monforte, A.J.; McCreight, J.D.; Dhillon, N.P.S. Diversity among melon (Cucumis melo L.) landraces from the Indo-Gangetic plains of India and their genetic relationship with USA melon cultivars. Genet. Resour. Crop Evol. 2014, 61, 1189–1208. [Google Scholar] [CrossRef]
  42. Soltani, F.; Akashi, Y.; Kashi, A.; Zamani, Z.; Mostofi, Y.; Kato, K. Characterization of Iranian melon landraces of Cucumis melo L. groups flexuosus and dudaim by analysis of morphological characters and random amplified polymorphic DNA. Breed. Sci. 2010, 60, 34–45. [Google Scholar] [CrossRef] [Green Version]
  43. Aragão, F.A.S.; Torres Filho, J.; Nunes, G.H.S.; Queiróz, M.A.; Bordallo, P.N.; Buso, G.S.C.; Ferreira, M.A.; Costa, Z.P.; Bezerra Neto, F. Genetic divergence among accessions of melon from traditional agriculture of the Brazilian Northeast. Genet. Mol. Res. 2013, 12, 6356–6371. [Google Scholar] [CrossRef]
  44. Scarano, D.; Rubio, F.; Ruiz, J.J.; Rao, R.; Corrado, G. Morphological and genetic diversity among and within common bean (Phaseolus vulgaris L.) landraces from the Campania region (Southern Italy). Sci. Hortic. 2014, 180, 72–78. [Google Scholar] [CrossRef]
  45. Tanksley, S.D.; McCouch, S.R. Seed banks and molecular maps: Unlocking genetic potential from the wild. Science 1997, 277, 1063–1066. [Google Scholar] [CrossRef] [Green Version]
  46. Jianbin, H.; Panqiao, W.; Qiong, L.; Yan, S. Microsatellite analysis of genetic relationships between wild and cultivated melons in Northwest and Central China. Mol. Biol. Rep. 2014, 41, 7723–7728. [Google Scholar]
  47. Stone, S.; Boyhan, G. Inter- and intra cultivar variation of heirloom and open-pollinated watermelon cultivars. HortScience 2019, 54, 212–220. [Google Scholar] [CrossRef] [Green Version]
  48. Szpiech, Z.A.; Rosenberg, N.A. On the size distribution of private microsatellite alleles. Theor. Popul. Biol. 2011, 80, 100–113. [Google Scholar] [CrossRef] [PubMed] [Green Version]
  49. Kalinowski, S.T. Counting alleles with rarefaction: Private alleles and hierarchical sampling designs. Conserv. Genet. 2004, 5, 539–543. [Google Scholar] [CrossRef]
  50. Yildiz, M.; Ekbicb, E.; Kelesc, D.; Sensoy, S.; Abak, K. Use of ISSR, SRAP, and RAPD markers to assess genetic diversity in Turkish melons. Sci. Hortic. 2011, 130, 349–353. [Google Scholar] [CrossRef]
  51. Sensoy, S.; Buyukalaca, S.; Abak, K. Evaluation of genetic diversity in Turkish melons (Cucumis melo L.) based on phenotypic characters and RAPD markers. Genet.Resour.Crop Evol. 2007, 54, 1351–1356. [Google Scholar] [CrossRef]
  52. Nkhoma, N.; Shimelis, H.; Laing, M.D.; Shayanowako, A.; Mathew, I. Assessing the genetic diversity of cowpea (Vignaun guiculata L.Walp.) germplasm collections using phenotypic traits and SNP markers. BMC Genet. 2020, 21, 110–126. [Google Scholar] [CrossRef] [PubMed]
  53. Schaal, B.A.; Hayworth, D.A.; Olsen, K.M.; Rauscher, J.T.; Smith, W.A. Phylogeographic studies in plants: Problems and prospects. Molec. Ecol. 1998, 7, 465–474. [Google Scholar] [CrossRef]
  54. Guidoti, D.T.; Gonela, A.; Vidigal, M.C.; Conrado, T.V.; Romani, I. Interrelationship between morphological, agronomic and molecular characteristics in the analysis of common bean genetic diversity. Acta Sci. Agron. 2018, 40, 1–9. [Google Scholar] [CrossRef] [Green Version]
Figure 1. Frequency distribution of phenotypic qualitative traits in melon accessions. Values on each bar represent the number of accessions.
Agronomy 11 01121 g001
Figure 2. Pearson correlation coefficients between quantitative phenotypic traits and two qualitative traits (fruit firmness and fruit shelf life). DM: days to maturity, SD: stem diameter, SL: stem length; FN: fruit number, FW: fruit weight, FL: fruit length, FD: fruit diameter, CD: cavity diameter, FT: fruit thickness, FF: fruit firmness, FSL: fruit shelf life, TSS: total soluble solids, SN: seed number, 100-SW: 100-seed weight. Only the statistically significant correlation coefficients (p < 0.05) are colored. Among the significant coefficients, the color type and intensity indicate the direction and the strength of the association.
Agronomy 11 01121 g002
Figure 3. Dendrogram of the Tunisian melon accessions based on UPGMA analysis using Euclidean similarity coefficient for quantitative and qualitative phenotypic traits.
Agronomy 11 01121 g003
Figure 4. Phenogram image of molecular polymorphism for five melon accessions (L2-FL, L8-Ru, L9-Ra, L10-Anan, and L13-Raf) detected by CM38 and ECM58 SSR markers labeled with the NED and FAM fluorescence dyes, respectively.
Agronomy 11 01121 g004
Figure 5. Distribution of allele frequencies for the eight SSR loci studied in melon accessions.
Agronomy 11 01121 g005
Figure 6. Dendrogram of the Tunisian melon accessions based on UPGMA analysis using the simple matching coefficient after amplification with SSR primers.
Agronomy 11 01121 g006
Figure 7. Dendrogram of the Tunisian melon accessions based on UPGMA analysis using combined phenotypic and molecular SM similarity coefficient.
Agronomy 11 01121 g007
Figure 8. Estimation of the optimum number of clusters for melon accession according to Evanno’s method. (a) The graph displays the log likelihood (LnP(D)) for each K value. (b) The graph displays the ΔK for each K value. The sharp peak of ΔK at K = 5 suggests five subpopulations.
Agronomy 11 01121 g008
Figure 9. Model-based cluster membership of 24 melon accessions into five subpopulations identified with STRUCTURE analysis using SSR primers. The corresponding membership probability is presented in the vertical axis. Vertical bars represent each individual analyzed in this study, and bars are divided into several colors when there is evidence of admixture.
Agronomy 11 01121 g009
Table 1. Description of 24 melon accessions used in the study.
CodeLocal NameLocality OriginHorticultural GroupTypeDescription
Maaz1MaazounChott Mariem-Sousse inodorusLandraceSweet fruit without aroma; yellow skin
Maaz2MaazounMenzel Chaker-SfaxinodorusLandraceSweet fruit without aroma, yellow-green skin
Maaz3MaazounWardanine-MonastirinodorusLandraceSweet fruit without aroma; yellow-green skin
Maaz4MaazounSidi BouzidinodorusLandraceSweet fruit without aroma; yellow-green skin
Arbi1ArbiJammel-MonastirinodorusLandraceSweet fruit without aroma, yellow skin
Arbi2ArbiJendoubainodorusLandraceFruit without aroma; creamy-white skin
Arbi3ArbiJammel-MonastirinodorusLandraceSweet fruit without aroma; orange skin
Arbi4ArbiJammel-MonastirinodorusLandraceSweet fruit without aroma; yellow skin
Arbi5ArbiKairouanreticulatusLandraceFruit with aroma, netted skin
Arbi6ArbiEl Jem-MahdiainodorusLandraceSweet fruit without aroma, yellow skin
Dz1DziriManzel Kamel-MonastirinodorusLandraceSweet fruit without aroma; light-green skin
Dz2Dziri-arbiSidi Banour-MahdiainodorusLandraceSweet fruit without aroma of light-green color
FLFakous SalemWardanine- MonastirflexuosusLandraceElongated fruit, nonsweet, eaten raw before ripeness
HorchHarchayWardanine- MonastirchateLandraceFruit small-sized, nonsweet, eaten raw before ripeness
L1-MaazMaazoun-inodorusBreeding lineSweet fruit without aroma, skin of yellow-green color
L2-FLFakous-flexuosusBreeding lineElongated fruit, nonsweet, eaten raw before ripeness
L3-TrabTrabelsi-inodorusBreeding lineSweet fruit without aroma of orange color
L4-GalGalaoui-reticulatusBreeding lineSweet fruit with aroma, netted/corked skin
L5-DzDziri-inodorusBreeding lineSweet fruit without aroma; light-green skin
L7-SaracSarachika-inodorusBreeding lineSweet Fruit without aroma; yellow skin
L8-RuRD-cantalupensisBreeding lineSweet fruit with aroma and grooves
L9-RaRupa-cantalupensisBreeding lineSweet fruit with aroma and grooves
L10-AnanAnanas-reticulatusBreeding lineSweet fruit with aroma, netted skin
L13-RafV4-inodorusBreeding lineSweet fruit without aroma; orange skin
Table 2. Quantitative traits of 24 Tunisian melon accessions belonging to different botanical groups.
DM
(days)
SD
(mm)
FNSL
(cm)
FW
(g)
FL
(cm)
FD
(cm)
CD
(cm)
FT
(cm)
TSS
(°Brix)
SN100-SW
(g)
inodorus group
Maaz1139.3 ± 4.69.4 ± 1.13.2 ± 0.2178.3 ± 17.5881.0 ± 190.713.0 ± 2.111.1 ± 1.44.9 ± 0.72.7 ± 0.59.8 ± 0.6410.7 ± 85.95.5 ± 2.5
Maaz2150.0 ± 6.927.3 ± 0.52.4 ± 0.5168.7 ± 28.21063.4 ± 101.814.8 ± 1.113.5 ± 0.85.4 ± 1.54.5 ± 1.110.2 ± 1.1767.7 ± 193.46.5 ± 0.3
Maaz3139.3 ± 4.617.0 ± 1.13.2 ± 0.5112.3 ± 6.8735.8 ± 56.611.2 ± 0.810.6 ± 1.14.5 ± 0.53.2 ± 0.710.9 ± 0.5393.3 ± 84.16.0 ± 0.5
Maaz4133.0 ± 1.737.5 ± 0.93.1 ± 0.4158.0 ± 15.8845.3 ± 75.112.0 ± 1.29.8 ± 0.24.2 ± 0.82.6 ± 0.29.5 ± 0.6404.7 ± 53.865.1 ± 0.6
Arbi1137.3 ± 8.089.0 ± 2.52.0 ± 1.0180.3 ± 6.5915.5 ± 220.914.1 ± 2.210.2 ± 1.95.7 ± 0.92.4 ± 0.69.8 ± 0.1693.3 ± 110.17.5 ± 0.3
Arbi2136.7 ± 4.6112.6 ± 0.52.1 ± 0.8197.7 ± 17.7544.7 ± 62.411.9 ± 1.69.4 ± 0.55.3 ± 0.82.2 ± 0.48.4 ± 0.2428.3 ± 143.57.3 ± 0.5
Arbi3135.3 ± 12.711.3 ± 1.22.7 ± 0.3172.3 ± 14.7831.8 ± 40.516.8 ± 6.210.7 ± 0.55.6 ± 0.42.5 ± 0.211.2 ± 1.1571.7 ± 110.16.9 ± 0.8
Arbi4146.0 ± 10.58.9 ± 1.52.7 ± 1.2146.0 ± 20.11035.1 ± 111.915.9 ± 2.511.3 ± 1.75.6 ± 0.22.8 ± 0.311.1 ± 1.0529.3 ± 52.56.4 ± 1.2
Arbi6130.0 ± 3.469.5 ± 1.13.0 ± 0.3136.0 ± 22.5955.5 ± 102.317.1 ± 2.611.4 ± 0.95.8 ± 0.52.6 ± 1.011.5 ± 1.5500.0 ± 97.77.2 ± 0.2
Dz1154.0 ± 3.2610.3 ± 0.82.4 ± 0.5171.0 ± 28.8823.2 ± 67.518.5 ± 4.511.1 ± 2.15.1 ± 0.53.1 ± 0.711.3 ± 1.4415.0 ± 99.15.1 ± 0.9
Dz2150.0 ± 6.928.5 ± 1.22.3 ± 0.3177.3 ± 11.6702.0 ± 70.111.5 ± 0.39.8 ± 1.65.5 ± 0.42.3 ± 0.79.0 ± 1.1414.7 ± 53.56.6 ± 0.8
L1-Maaz150.3 ± 14.89.9 ± 0.82.1 ± 0.7179.7 ± 6.5971.7 ± 204.512.3 ± 1.612.0 ± 1.45.1 ± 1.43.7 ± 0.611.0 ± 1.9596.7 ± 66.36.6 ± 0.4
L3-trab134.7 ± 7.029.3 ± 1.12.4 ± 0.7213.3 ± 18.4801.4 ± 200.920.0 ± 9.29.0 ± 1.64.4 ± 0.82.5 ± 0.59.7 ± 0.3622.0 ± 80.06.7 ± 1.5
L5-Dz147.3 ± 11.510.4 ± 0.72.7 ± 0.6158.3 ± 17.51050.9 ± 38.916.9 ± 3.210.6 ± 2.15.8 ± 1.22.6 ± 1.09.6 ± 0.9955.3 ± 171.74.1 ± 0.9
L7-Sarac149.0 ± 12.17.7 ± 1.22.7 ± 0.1127.3 ± 8.5790.6 ± 124.812.1 ± 2.811.1 ± 2.04.5 ± 0.53.1 ± 0.39.8 ± 0.5466.0 ± 66.97.5 ± 1.0
L13-Raf159.0 ± 3.48.7 ± 0.62.3 ± 0.3136.0 ± 12.31373.0 ± 110.713.9 ± 1.813.90.8 ± 6.7 ± 0.63.8 ± 0.311.5 ± 1.3485.3 ± 77.19.5 ± 1.2
cantalupensis group
L8-Ru132.0 ± 3.56.8 ± 1.01.9 ± 1.092.7 ± 8.7436.1 ± 67.49.8 ± 0.69.7 ± 0.74.2 ± 0.23.3 ± 0.49.7 ± 0.7384.7 ± 86.46.0 ± 0.5
L9-Ra139.3 ± 9.210.5 ± 1.32.2 ± 0.9175.7 ± 25.011101.1 ± 48.513.1 ± 0.911.2 ± 2.05.7 ± 0.62.9 ± 0.311.8 ± 1.1382.3 ± 67.16.9 ± 0.8
reticulatus group
Arbi5130.0 ± 3.46.5 ± 1.02.4 ± 0.9195.7 ± 15.21489.6 ± 238.029.4 ± 9.212.9 ± 3.06.5 ± 1.82.9 ± 0.68.8 ± 0.4421.3 ± 82.610.7± 1.5
L4-Gal142.0 ± 8.012.4 ± 2.22.7 ± 0.8133.7 ± 14.161025.4 ± 123.114.1 ± 0.711.41.3 ± 5.9 ± 0.62.7 ± 0.410.1 ± 0.4674.0 ± 68.86.7 ± 0.4
L10-Anan144.7 ± 9.29.4 ± 1.51.8 ± 0.5196.7 ± 21.31765.2 ± 259.716.7 ± 3.912.4 ± 3.55.5 ± 1.52.9 ± 0.89.5 ± 0.2410.7 ± 70.65.9 ± 1.2
flexuosus group
L2-FL103.3 ± 4.111.0 ± 0.635.0 ± 5.0190.0 ± 25.8204.9 ± 32.729.3 ± 3.14.2 ± 1.14.0 ± 1.01.9 ± 0.54.9 ± 0.6301.0 ± 35.55.6 ± 0.6
FL105.3 ± 5.511.0 ± 0.536.7 ± 6.0226.7 ± 25.2203.3 ± 15.338.3 ± 3.54.4 ± 0.53.7 ± 1.12.0 ± 0.54.7 ± 0.5213.0 ± 24.15.3 ± 0.5
chate group
Horch103.3 ± 3.07.3 ± 0.68.0 ± 1.0112.3 ± 6.884.0 ± 16.44.3 ± 0.53.0 ± 0.31.9 ± 0.50.5 ± 0.17.4 ± 0.4197.3 ± 18.32.7 ± 0.3
CV5.511.937.618.641.946.517.722.523.110.636.325.4
F value11.5 **7.4 **92.4 **3.6 **3.9 **9.61 **6.8 **2.4 *4.4 **9.3 **2.46 *2.66 *
DM: days to maturity; SD: stem diameter, FN: fruit number, SL: stem length, FW: fruit weight, FL: fruit length, FD: fruit diameter, CD: cavity diameter, FT: fruit thickness, TSS: total soluble solids, SN: seed number, 100-SW: 100-seed weight. Values are Means ± standard deviation. CV: coefficient of variation, * significant at p < 0.05, ** highly significant at p < 0.0001.
Table 3. Genetic features of eight microsatellite markers used for the assessment of genetic diversity in 24 melon accessions. Ch: chromosome, N: number of alleles, G: number of genotypes, Ho and He: observed and expected heterozygosity, respectively, I: Shannon’s diversity index, Fis: inbreeding coefficient, PIC: polymorphic information content.
SSR LocusChPrimer SequencesNSize Range (bp)GHoHeIFisPIC
CM3810F:TAGCATCTGATCGGAAAACC
R:CAACTTCATCCGCCAAGAAT
3 134–14460.170.190.960.060.57
ECM581F:TTGAAGCTTCTTCACCTTCTCTTT R:CACCCCACAAGGGTTCAATA5132–157110.190.231.500.180.76
CSWCT103F:AGATCGGAATTGAAAAAG R:AAAGGGGCTTCCTCTCTA3197–20640.050.030.26−0.680.13
ECM2047F:CTCTCTTCATTTCCCCTCGTT R:TGGCCTGGAAAGTAAGGGTAT2330–34630.010.020.140.210.06
MU71944F:TACTCCTCGCTGATCTTCCC R:AAAGGAAGAAGCGCACAAAA7117–153120.130.221.480.420.71
ECM1326F:CCATTCGTCAAGCAAAGCTAC R:CAAAGGGTCCCTCAATTTCTC2292–29530.100.090.48−0.060.30
CMN04_199F:TTCTTCCCACCAAACCTACG R:AAATGGCAGAGAGCGAGAAA6238–262110.080.141.310.480.66
CMCT160a11F:GTCTCTCTCCCTTATCTTCCA
R:ACGGTGTTTGGTGTGAGAAG
2231–23330.040.040.43−0.270.26
Total 30------53---------------------------
Mean 3.75------------0.100.120.820.040.43
Table 4. Analysis of molecular variance (AMOVA) of 24 melon accessions based on eight microsatellite markers. SV: source of variation, df: degrees of freedom, SS: sum of squares, MS: mean squares, Est.var: estimated variance component, PV: proportion of variance.
SVdfSSMSEst.varPV (%)p-Value
Among populations23794.76334.5554.763750.01
Within populations142229.3331.6151.615250.01
Total1651024.096 6.378100
Publisher’s Note: MDPI stays neutral with regard to jurisdictional claims in published maps and institutional affiliations.

