Article

The Effect of the Proportion of Adjacent Non-Crop Vegetation on Plant and Invertebrate Diversity in the Vineyards of the South Moravian Region

1
Department of Vegetable Science and Floriculture, Faculty of Horticulture, Mendel University in Brno, 69144 Lednice, Czech Republic
2
Department of Plant Biology, Faculty of AgriSciences, Mendel University in Brno, 61300 Brno, Czech Republic
3
Department of Crop Science, Breeding and Plant Medicine, Faculty of AgriSciences, Mendel University in Brno, 61300 Brno, Czech Republic
*
Author to whom correspondence should be addressed.
Agronomy 2021, 11(6), 1073; https://doi.org/10.3390/agronomy11061073
Submission received: 30 March 2021 / Revised: 20 May 2021 / Accepted: 25 May 2021 / Published: 26 May 2021

Abstract

:
Increasing vulnerability of crops to pests and diseases, problems with soil erosion, a decline in biodiversity and a number of other negative impacts caused by agricultural intensification and monocultural production have been the subjects of many studies in recent decades. Today, cover cropping has become a promising practice to defuse these negative impacts, and it is emerging in many wine-producing regions, including the Czech Republic. However, the importance of permanent natural and semi-natural habitats in agricultural production should not be neglected. In this study, the effect of adjacent non-crop vegetation on plant and insect diversity was evaluated. The highest plant species richness of inter-row vegetation was found in vineyards with a high proportion (>40%) of non-crop vegetation within a 500-m radius. Regarding the agricultural impact of inter-row vegetation, the high proportion of non-crop vegetation could have been related to the higher presence of opportunistic and non-harmful weeds, compared with the presence of dangerous weed species. The number of insect families present in inter-rows was probably affected more by the vegetation coverage rate than by the proportion of adjacent non-crop vegetation. However, the occurrence of the Hymenoptera species, often representing beneficial organisms, was related to localities with a high proportion of adjacent non-crop vegetation.

1. Introduction

Agricultural intensification reduces the richness of plant species, resulting in simplified community structures and a decline in ecosystem stability and ecosystem service functionality [1,2,3,4]. Generally, the homogenisation of agricultural landscapes, including grapevine production, leads to a higher vulnerability of crops to pests and disease [5]. Maintaining landscape heterogeneity by keeping or creating natural or semi-natural habitats (non-crop vegetation) helps conserve biodiversity and provides more effective pest control [6,7,8,9]. According to Böller et al. [10], ecological infrastructures are any infrastructures at a farm or within a radius of the order of 150 m of the farm that have an ecological value to the farm and, due to their function, may be classified as (1) large permanent habitats of fauna, (2) stepping-stones (habitats of smaller size allowing the build-up of temporary animal populations) and (3) corridor structures (assisting animal species in moving between large habitats and small stepping-stones). Importance of non-crop vegetation for enhancing of some groups of natural enemies in vineyards, like those benefitting from nectar resources [11,12,13] or parasitoid populations [14,15] has already been reported. It was also stated that vegetation within the broader landscape can be important as well as vegetation directly adjacent to fields; however, the relative importance of these components was rarely evaluated [16,17]. Studies by Nascimbene et al. [18] and Mania et al. [19] showed a significant increase in the richness of plant species in vineyards in response to adjacent proportions and types of semi-natural habitats. However, according to Hall et al. [20], the landscape diversity or semi-natural habitat elements were less important parameters in explaining species diversity compared to vineyard management. The average proportion of adjacent non-crop vegetation at vineyard sites in the South Moravian wine-producing municipalities varies from 6 percent in e.g., Velké Bílovice to 12 percent in Mikulov [21]. This study investigates the effect of non-crop vegetation at selected vineyard sites in the South Moravian Region (Czech Republic), hypothesising that the proportion of adjacent semi-natural habitats affects (i) the plant species richness and the presence of aggressive weed species and (ii) the occurrence of invertebrates.

2. Materials and Methods

2.1. Locality Description, Vegetation Evaluation and Insect Sampling

Inter-row vegetation and invertebrate occurrence in three vineyard sites in the South Moravia Region were evaluated during two years (2018 and 2019). Evaluations were performed from June to September, always once per month, resulting in eight evaluation terms in total. In the Czech Republic, a vineyard site is a legislatively established area designated for growing grapevines. The vineyard sites selected for this study are Přední hora (PH) (48°51′59.7″ N, 16°52′39.5″ E) and Nová hora (NH) (48°52′22.4″ N, 16°52′03.7″ E) from the Velké Bílovice district and Pod Pálavou (PP) (48°50′15.7″ N 16°37′42.9″ E) in the Bavory (Mikulov) district. The distance between NH and PH is 1.5 km and site PP is located 17.5 km from those two. In all three vineyards grapes are grown for wine production; variety Sauvignon at PH, Blue Frankish at NH and Pinot blanc at PP. Grapevines at all three vineyards are vertical shoot position (VSP) trained and spacing is 2.3 m × 0.9 m at PP and PH, and 2.2 m × 0.85 m at NH. The age of the grapevine plants at all three localities ranged from 10 to 14 years. A radius of 500-m was selected in order to cover land structure with ecological infrastructures where insect migration and seed dispersal take place. The non-crop vegetation proportion within a 500-m radius of the place of evaluation was calculated using QGIS 3.10.2 A Coruña (Open Source Geospatial Foundation, Beaverton, OR, USA, 2020). The non-crop vegetation proportion within this area was 42 percent in PP, 7 percent in PH and 2 percent in NH (Figure 1). The area of non-crop vegetation includes natural and semi-natural habitats, such as meadows, shrubs, groves, forests and alleys. The weather conditions during the evaluating period are specified in Table 1.
The inter-row vegetation cover at all localities was classified as spontaneous (not a sowed commercial mixture), older than one year, and in all three localities, integrated production management (IPM) was practised. Soil type at all evaluated sites is chernozem. Similar operations are being carried out during vineyard cultivation; under-wine was cultivated by mechanical weeding and inter-row was mowed or mulched according to need (2–3 × during season). Regarding the use of fertilizers, organic manure was applied before vineyards’ planting. Later on, in order to keep crop yield, mineral fertilizes (NPK) are applied in the spring approximately once per three years. No fertilizers were applied during both experimental years at any of three evaluated localities. According to soil analysis of Nmin, P, K and Ca determined by the Mehlich III test method [22], nutrient content in localities Velké Bílovice and Bavory-Mikulov was similar (Supplemental Table S1). Mulching of inter-row vegetation served as a source of organic material every year.
Vegetation evaluation and invertebrate sampling were conducted in vineyard inter-rows. The inter-row vegetation was evaluated using a phytosociological survey [23] in three repetitions per each evaluation term. Each plot for the phytosociological surveys had a width and length of two meters. The plant species were determined and sorted into three categories (Table 2): (i) dangerous weeds, (ii) opportunistic weeds and (iii) non-harmful weeds, according to Urban and Šaraptka [24].
The sampling of invertebrates was done in three repetitions always at a six-meter-long plot, including the plot for phytosociological surveys. A 0.3-m diameter sweep net was used. As described by Doxon et al. [26], the upper 25 to 30 percent of vegetation was swept by a net in two-meter wide arc, while the researcher walked at a constant pace. Each invertebrate sampling plot was six metres long and represented approximately 20 sweeps. The invertebrate sampling and vegetation evaluation were always done in the first week of the month (June, July, August and September) during the morning hours (9–11 a.m.) on a day with suitable weather conditions: sunny, no rain and weak or no wind. To avoid disturbing the invertebrates, the sweep-netting was done prior to the phytosociological survey. All invertebrates caught by the sweep net were determined using the digital microscope Keyence VHX 6000 (Keyence International, Osaka, Japan) and sorted to orders and families. Vegetation evaluation and invertebrate sampling were done using the same plots.

2.2. Data Analysis

Collected data from the phytosociological survey and invertebrate sampling were analysed using Canoco 5 (Biometris, Wageningen University and Research Centre, Wageningen, The Netherlands; University of South Bohemia in České Budějovice, České Budějovice, Czech Republic) software for multivariate analysis of ecological data. The gradient of response data for vegetation-locality analysis was 0.6 SD (standard deviation) units long, and redundancy analysis (RDA) was chosen as a statistical method. The gradients of response data for insect occurrence analysis and analysis of the relationship between selected plant families and insect orders were 1.0 SD units long, and the redundancy analysis (RDA) was chosen as a statistical method as well. The statistical significance of the results was calculated with the Monte-Carlo permutation test (999 permutations) [27].

3. Results

3.1. Vegetation Diversity and Number of Plant Species

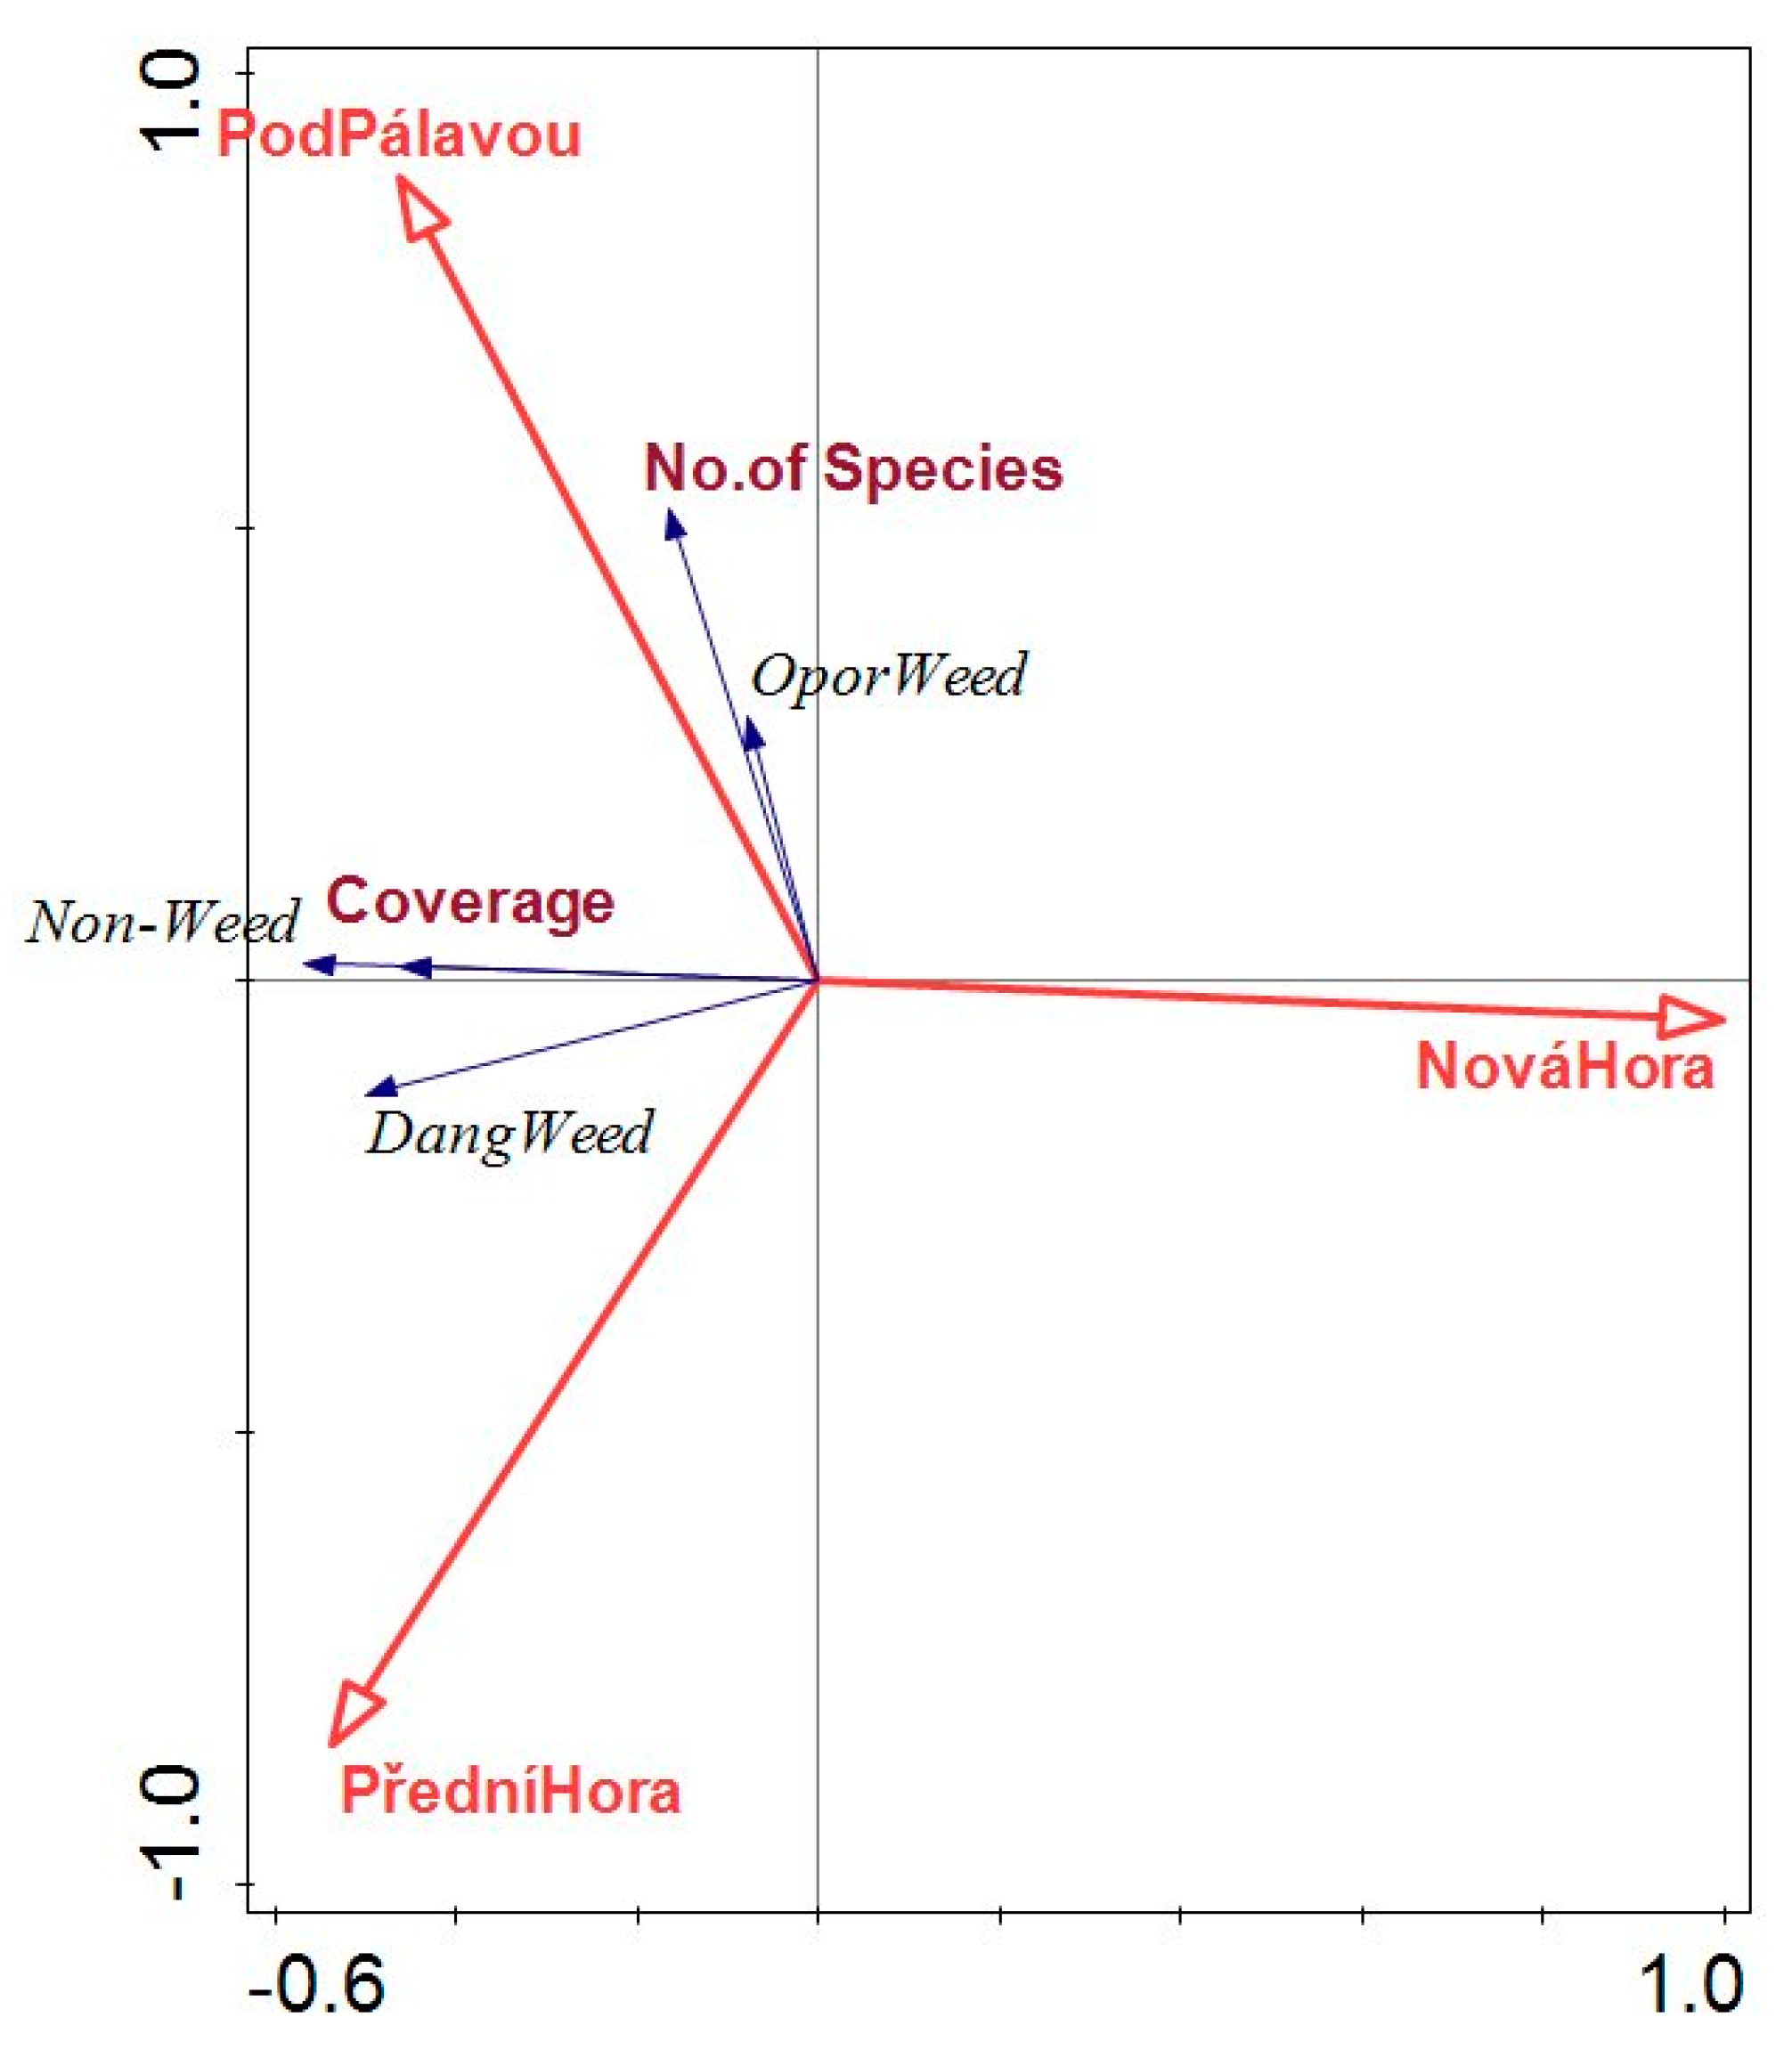
The results of the RDA (Figure 2) indicate that the highest plant species diversity (number of species) was at the Pod Pálavou (PP) vineyard site. Most of the plants at this site were classified as opportunistic weeds. The coverage rate of the evaluated inter-rows was similar in sites PP and PH, as was the presence of non-harmful weeds. By contrast, the presence of dangerous weeds was highest, and the number of species was lowest, at the PH site. Lowest coverage rate and presence of non-harmful weeds were assessed in the inter-row of NH, expressed by a strong negative correlation in the ordination diagram. Results are significant at the significance level p = 0.02.

3.2. Proportion of Grass, Leguminous and Other Dicotyledonous Species in Inter-Row Vegetation

The proportion of grass species (including genera Bromus, Echinochloa, Eltrygia, Festuca, Hordeum, Lolium, Poa and Setaria in this study) was similar at all locations, with the lowest proportion (39–48%) at the Pod Pálavou (PP) vineyard site, around 50 percent at Přední hora (PH) and the highest (~57–60%) at the Nová hora (NH) vineyard site. The proportion of leguminous species (including Astragalus, Lathyrus, Medicago, Onobrychis, Trifolium and Vicia spp. in this study) was slightly higher at the PP site than it was at the PH site. Within the evaluation plots of the inter-rows of site NH, no leguminous species occurred. The other dicotyledonous plants include many species from several families in this study (Amaranthaceae, Apiaceae, Asteraceae, Boraginaceae, Brassicaceae, Caryophyllaceae, Convolvulaceae, Geraniaceae, Hypericaceae, Lamiaceae Malvaceae, Papaveraceae, Polygonaceae, Portulacaceae, Plantaginaceae, Rosaceae and Violaceae), and the proportion was from 36 to 49 percent within all localities (Figure 3).
A list of all plant species of inter-row vegetation, sorted to families, found at three evaluated vineyards and their appearance on the phytosociological survey plot in all sampling terms is available in Supplemental Table S2.

3.3. Insect Occurrence and Diversity

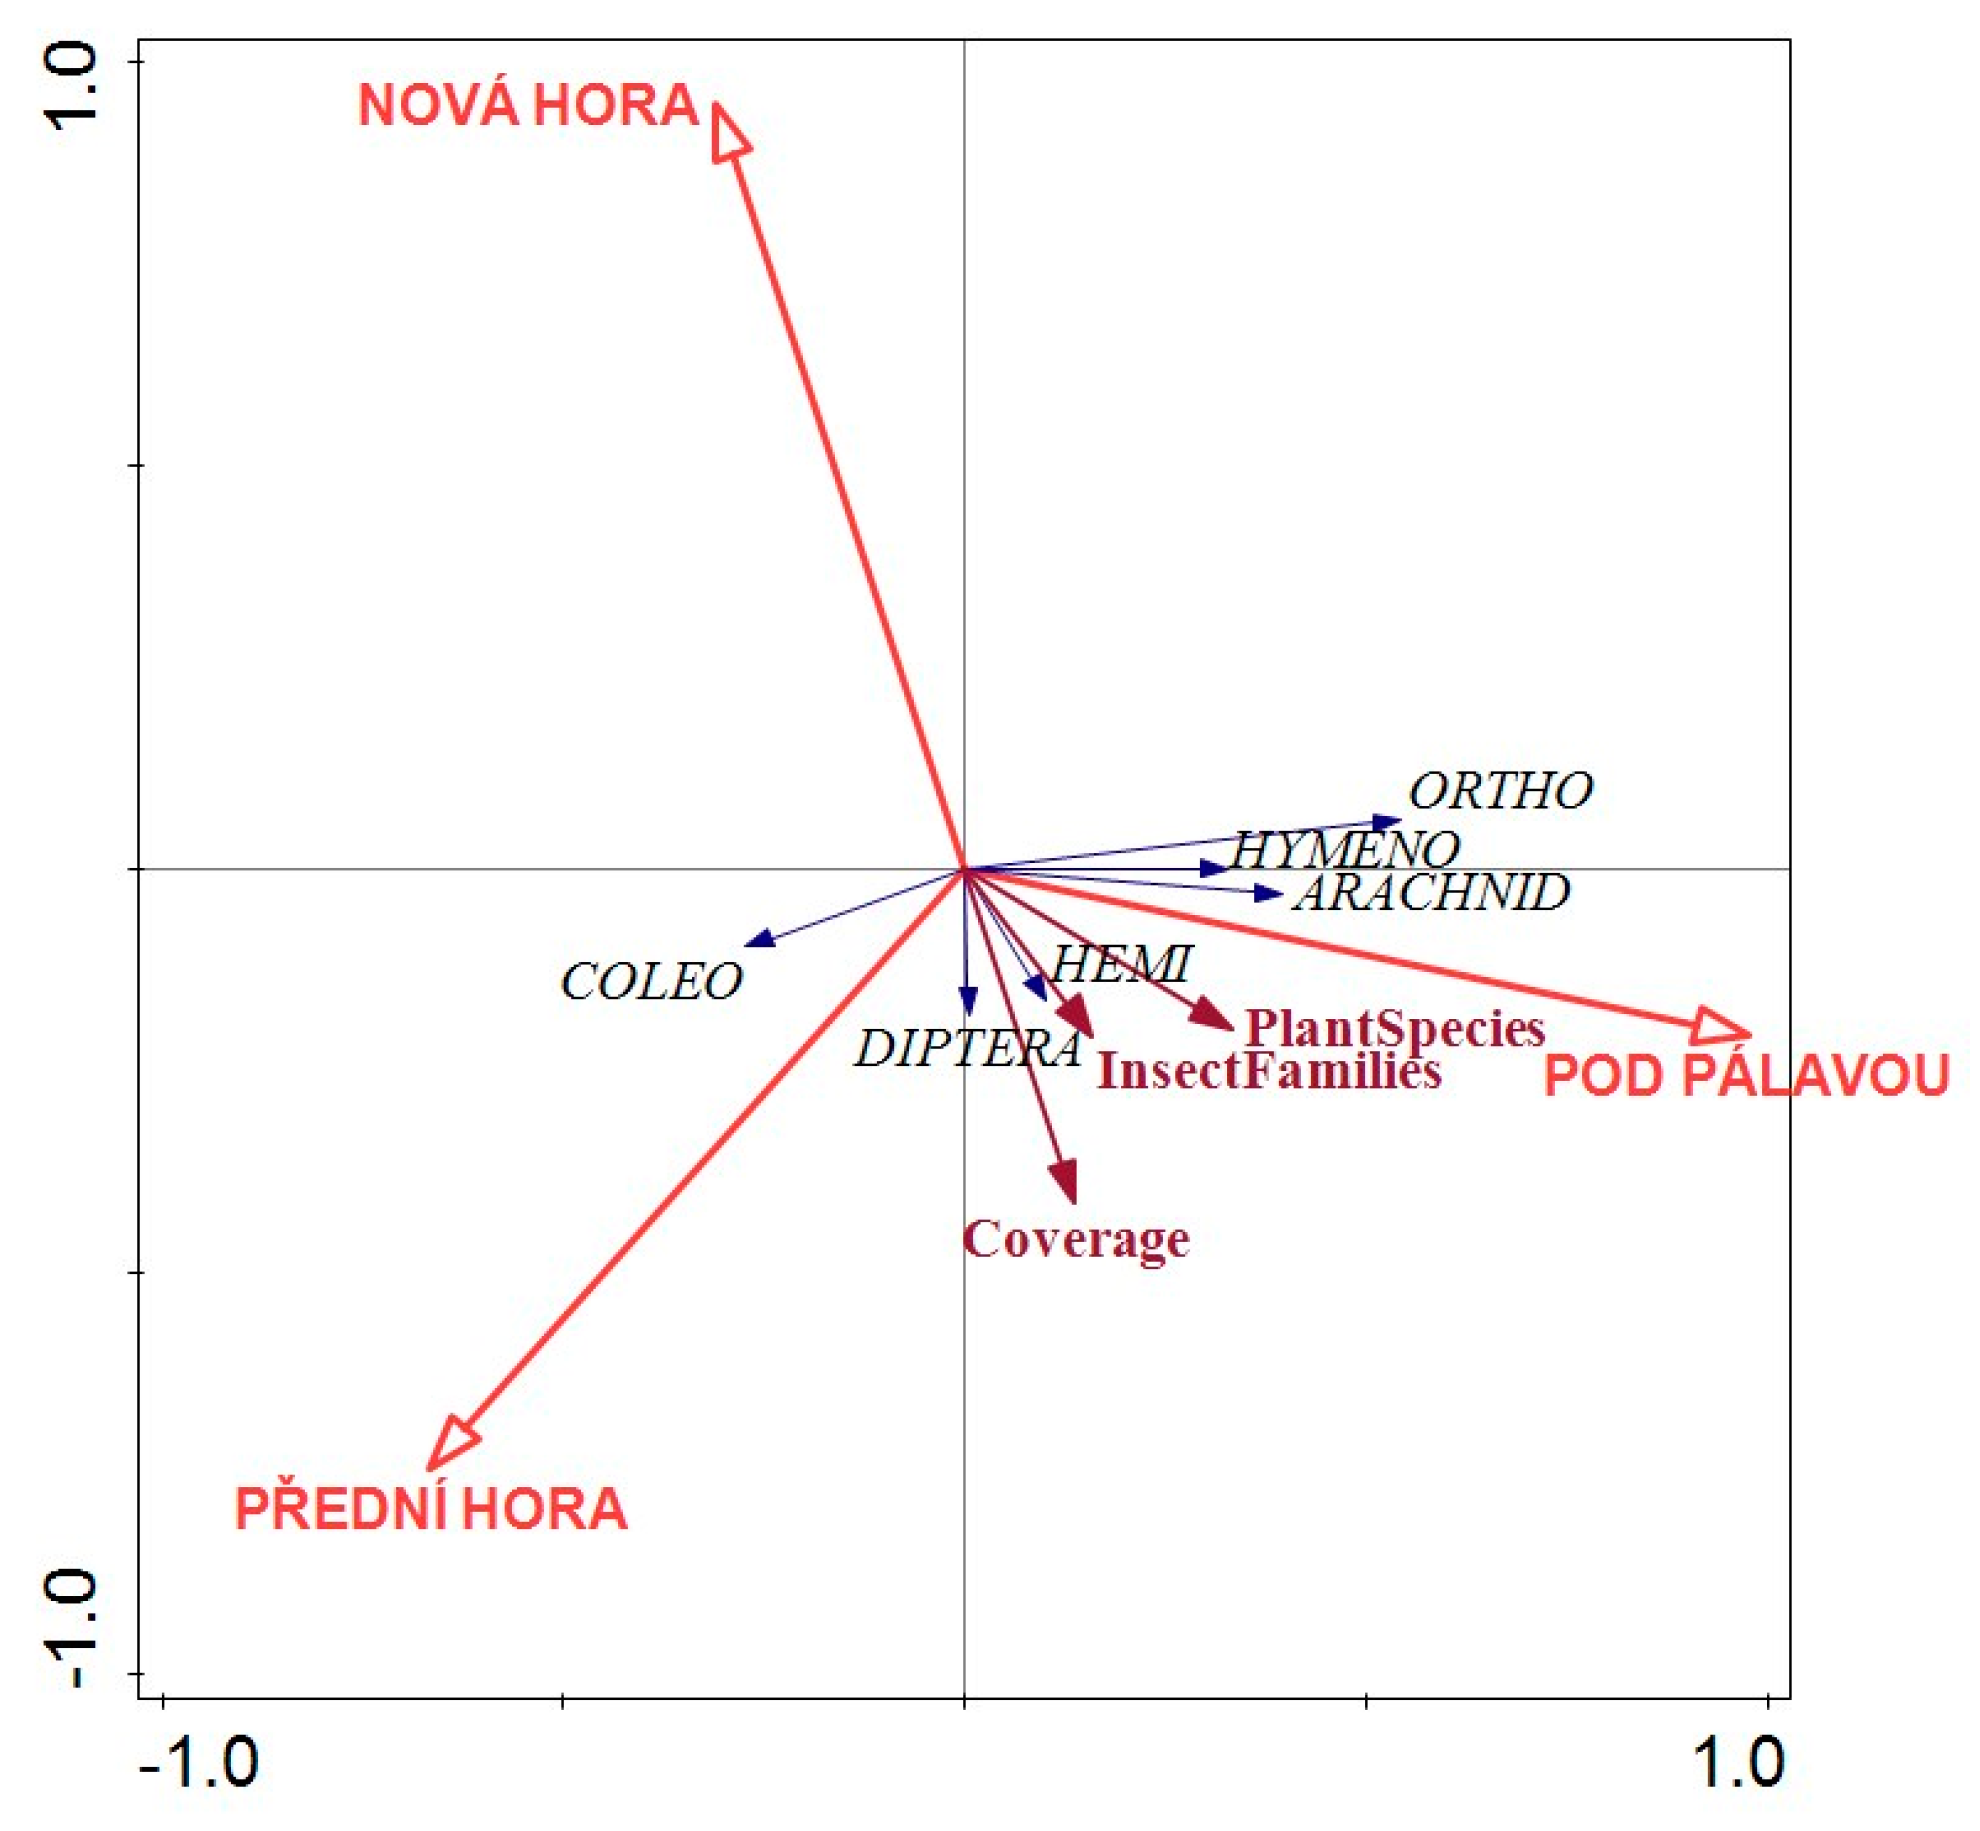
The results of the ordination analysis indicate a positive correlation between the number of present invertebrate families in the inter-rows and the number of plant species and the ground cover coverage rate in the inter-rows. The number of plant species was highest at the PP site, and also at this site was the highest number of present invertebrates from Orthoptera, Hymenoptera and Arachnida. The occurrences of the Diptera and Hemiptera species were similar at the PP and PH sites. The lowest presence of Coleoptera was found at the PP site and the highest at the PH site. Due to very low occurrence (0.1–0.04 on average per all sampling terms and plots) of Dermaptera, Lepidoptera, Neuroptera, Orthoptera and Thysanoptera species, those orders were not included in RDA analysis in order to maintain the lucidity of the analysis. The coverage rate, as well as the number of insect families, was lowest at the NH site (Figure 4). The results are significant at significance level p = 0.008.
The plant families selected for the next analysis (Figure 5) are those with a coverage rate higher than ten percent, at least in one locality and at least in one evaluation term. Since the families Amaranthaceae and Convolvulaceae included only dangerous weed species (Amaranthus sp., Atriplex sp., Chaenopodium sp. and Convolvulus sp.) in this study, those two families were separated from other dicotyledonous species. The sum of the coverage rates of those two families was also locally higher than ten percent. Selected insect orders included the most abundant orders regarding the average number of individuals per six-metre-long sampling plot per evaluation term. The plant families Asteraceae, Lamiaceae and Caryophyllaceae had a higher coverage rate at the PP site. The coverage rate of Amaranthaceae and Convolvulaceae was highest at the NH site. Species from the Poaceae family and other dicotyledons tended to have higher coverage at the PH site. The coverage rates of leguminous species (Fabaceae) were similar at PP and PH, and a negative correlation between NH and this plant family was found. The RDA ordination diagram indicates the positive correlation between the following insect orders and plant families: Diptera with Poaceae and other dicotyledons; Hemiptera with Fabaceae; Hymenoptera with Caryophyllaceae (Figure 5). The results are significant at significance level p = 0.008.
The two-year average numbers of invertebrates per sampling term (June, July, August, September) per six-meter-long sampling plot in inter-row at three evaluated vineyards sorted to orders and families are stated in Supplemental Table S3.
The average number of plant species and invertebrate families per evaluation plot from all repetitions and all evaluation terms was highest at the vineyard site with the highest proportion (42%) of adjacent non-crop vegetation (PP). The average coverage rate during the evaluation period was highest (71.21%) at the PH site and slightly lower (68.96%) at the PP site. Plant species richness was the highest at the PP site, where, during the eight sampling terms within two years, 30 plant species were found. The number of plant species at the NH and PH sites seems lower (21 and 17, respectively). Table 3 reports indicative results only.

4. Discussion

4.1. Plant Vegetation Diversity and Number of Plant Species

Congruently with studies by Nascimbene et al. [18] and Mania et al. [19], our results in this study suggest a possible positive impact of adjacent non-crop vegetation on plant species richness. According to Nascimbene et al. [18], the location of vineyards in landscapes with a proportion of semi-natural habitats higher than 40 percent significantly increases plant species richness in comparison to crop landscapes with less than 30 percent semi-natural habitats. In our study, the examined locality with a 42 percent non-crop vegetation proportion showed a positive correlation with the number of plant species (plant species richness). By contrast, the study by Hall et al. [20] showed only slightly higher plant species richness in vineyards with a high proportion of semi-natural habitats (44%) compared with those with a proportion of around nine percent of semi-natural habitats. However, in that study, the vineyards of various countries were evaluated, and perhaps the local climate conditions affected plant species richness more than semi-natural elements did [20]. Since our study was conducted in localities within the South Moravian Region, where the weather conditions are similar at all evaluated vineyards, the possible effects of weather conditions on the results of our study should be minimal.
Regarding the classification of the weeds present in vineyard inter-rows, in the vineyard with a high non-crop vegetation proportion (PP), mostly opportunistic weeds were present. No significant correlation was found in the occurrence of dangerous weeds (Figure 2); however, the detailed analysis of selected plant families (Figure 5) indicates a positive correlation of the NH locality with the occurrence of weed species from the Amaranthaceae and Convolvulaceae families. The coverage rate in the NH locality was generally lower than it was at the two other localities (Table 3), which might explain the higher occurrence of Amaranthaceae and Convolvulaceae weeds. Several authors have highlighted the importance of successful cover crop establishment and a sufficient coverage rate to achieve effective weed suppression [28,29]. Soil nutrient content is another important factor that affects vegetation cover composition [30,31]. For example, several studies reported a positive response of Amaranthus growth to content of nitrogen [32,33]. Phosphorus plays important role in development and growth of legumes [34]. In our study, soil nutrient (Nmin, P, K, Ca) content at locality NH and PP was similar (Supplemental Table S1), and no fertilizer was applied during two years of evaluation. Nevertheless, soil microbiome can significantly affect availability of nutrients for the plants [35,36]. Differences in nutrient content and nutrient availability for plants might contribute to considerable differences between vegetation cover in PP and NH, however, study of soil microbiome and nutrient availability were not included in this study to support this suggestion.
A higher occurrence of noxious weeds leads to more intensive management (mechanical weed control, herbicide use), resulting in lower plant species richness and supporting the noxious, often herbicide-tolerant weed species itself [20,37,38]. Even though cover cropping is a promising practice supporting plant species richness in vineyards, the establishing of such ground cover remains strongly dependent on weather conditions, and very often, the weeds from soil seed banks are present anyway [39,40]. Thus, as a source of biodiversity, the conservation and creation of semi-natural habitats that surround vineyards might support plant species richness better than only cover cropping by itself [1].
In our study, no significant difference was found between the ground cover coverage rates of the sites with a higher (42%) and a lower (7%) proportion of adjacent non-crop vegetation. However, at the site with two percent of adjacent non-crop vegetation, a negative correlation was found.

4.2. Proportion of Grass, Leguminous and Other Dicotyledonous Species in Inter-Row Vegetation

Legumes (Fabaceae) are important and valuable cover crops, since they fix atmospheric nitrogen. The accumulation of nitrogen by leguminous cover crops ranges from 45 to 220 kg per hectare [41]. According to a study by Sulas at al. [42], in Mediterranean vineyards (Sardinia), leguminous cover crops (Medicago sp.) were promoting 25 percent more of the total N compared with grass cover crops. Integrated pest management (IPM) production of grapevines in the Czech Republic requires the use of a cover crop in at least every other inter-row. In the case of using cover crop mixtures, the minimal sowing amount of the cover crop is 20 kg·ha−1. The sowing mixture has to consist of at least five leguminous species, at least two grass species, and at least three other dicotyledonous species [43]. In California, recommendations for vineyard cover crop includes various grass species e.g., Hordeum vulgare L., Secale cereale L., Poa, Bromus and Lolium spp. and several leguminous cover crops (Vicia dasycarpa Ten. Vicia atropurpurea L., Trifolium, Medicago spp.) [44]. In our study, the proportion coverage rate of legumes varies from 10 to 14 percent at PH and from 11 to 16 percent at PP. By contrast, no legumes were present at NH during the evaluation terms. Considering the short distance between NH and PH, and similar management during the evaluation period, the difference in proportion of Fabaceae might be caused by different management of surrounding vineyards and other landscape elements, soil microbiome, availability of nutrients, or other factors that were not included in our analysis. The coverage rates of legumes at PH and PP were similar; however, the composition of species differs. At locality PH, the dominant leguminous species covering the vineyard inter-row were Trifolium and Medicago spp., while at the PP locality, the Fabaceae with the highest coverage rates were Astragalus spp. grasses, as well as legumes, which are a very efficient cover crop. The dense and fibrous root systems of grasses reduce soil erosion and surface runoff [40,41,45]. The proportion of grass coverage rate was the highest (60%) at NH and 39 to 50 percent at PH and PP. Grasses are higher in carbon than legume cover crops [41]. Optimising the cover crop mixture for vineyard inter-rows is a challenging task, and many factors (e.g., soil type, local climate conditions, age of grapevine plants) have to be considered to achieve most of the benefits provided by cover crops.

4.3. Insect Occurrence and Diversity

At the Pod Pálavou (PP) location, the occurrence of insect species from Hymenoptera, Orthoptera and spiders (Arachnida) positively correlated with the high proportion of adjacent non-crop vegetation. Hymenoptera includes many beneficial species, such as parasitoid wasps (Braconidae, Ichneumonidae, Chalcidoidea), and spiders play an important role in the biological control of vineyard pests [46,47,48,49]. Our results are congruential with many studies, confirming that natural or semi-natural habitats (non-crop vegetation) help provide greater effective pest control [6,7,8,9]. Since the spiders are considered to be indicators of biodiversity and anthropogenic disturbance [50,51,52], a positive correlation of their occurrence to the high proportion of adjacent non-crop vegetation might be explained. According to a study by Wäckers [53], the attractiveness of flowering plants for parasitoid species (Hymenoptera) consists of more than nectar accessibility (e.g., Leucanthemum, Galium spp.). The results of our study could indicate a positive correlation of Hymenoptera species with plant families Asteraceae, Caryophyllaceae and Lamiaceae at the PP locality. However, the visual observation was not conducted in this study to confirm this relationship. By contrast, Wäckers [53] reported that some Fabaceae (e.g., Medicago lupulina, Trifolium repens, T. pratense) failed to attract parasitoids or, moreover, might have a repellent effect. In our study, those Fabaceae species were not present at the PP locality, or their presence was occasional and minor compared with the PH locality. Major Fabaceae species present at PP included Astragalus spp. The higher proportion of Fabaceae species described as non-attractive for parasitoids might contribute to the negative correlation between Hymenoptera occurrence and the PH locality indicated by both ordination diagrams. Plant species from the Caryophyllaceae family (Silene, Stellaria spp.) were the subject of several studies focused mostly on attraction for pollinators [54] or herbivore moths and their parasitoids [55,56]. In this study, the Caryophyllaceae found in vineyard inter-rows were Arenaria serpyllifolia L., Stellaria media L. (Vill.) and Silene latifolia subsp. alba (Miller) Greuter et Burdet. According to a study by Patt et al. [57], the parasitoid species (Edovum puttleri Grissell and Pediobius foveolatus Crawford) were, due to partially hidden nectaries in cup- or bowl-shaped flowers of e.g., chickweed (Stellaria media), not able to forage efficiently on these flowers. However, Kevan [58], in his study, observed and described a high rate of feeding or resting visits of various Hymenoptera parasitoids (Chalcididae, Eulophidae, Pteromalidae, Braconidae, Ichneumonidae) on the flowers of Stellaria longipes Goldie. Flowers with white blooms are considered the most commonly visited flowers by Hymenoptera parasitoid species [59,60]. Generally, Caryophyllaceae species (e.g., Arenaria, Stellaria and Silene spp.) are not included in the cover crop mixtures; however, these findings, as well as the results of our study, suggest that these small, ground-covering herbs should be considered to be included in mixtures designed for inter-row vegetation cover in vineyards.
The occurrence of Hemiptera (bug) and Diptera (fly) species was similar at the PP and PH sites, suggesting that the proportion of adjacent non-crop vegetation is probably not the main factor affecting the presence of these species. According to the ordination analysis, the presence of those large groups of insects, including many phytophagous species (leafhoppers, aphids) and several predatory species (Anthocoridae, Syrphidae), could be affected by the ground cover coverage rate or by other factors that were not included in this analysis. The possible positive effect of Poaceae on Diptera can probably be explained by the higher coverage rate provided by grass species. According to the study by Fiera et al. [49], the occurrence and species richness of phytophagous species increased with the plant coverage rate, and Gonçalves et al. [61] found that a higher plant species diversity increased phytophage occurrence. Both of these findings might explain the correlations (Figure 4 and Figure 5) found in our study, since the orders Diptera and Hemiptera included mostly phytophagous species in our study.
The results of both analyses in our study confirm the negative impact of a very low proportion (2%) of adjacent non-crop vegetation on plant species and invertebrate families’ richness.

5. Conclusions

The results of our study, comparing the number of plant species, ground cover coverage and the number of invertebrate families present in inter-rows located in three vineyards with various proportions of adjacent non-crop vegetation, conform to the results of other studies, suggesting a positive effect of natural and semi-natural habitats on plant and insect species richness. However, in this study, the ground cover coverage was not affected by the proportion of non-crop vegetation. The significant correlation between the presence of noxious weeds and the lower proportion of non-crop vegetation was not confirmed. Thus, the presence of noxious weeds was probably affected by other factors, such as a low coverage rate or nutrient content and availability. Managing the vineyards with a functional ecosystem service requires a very complex approach, and many factors, e.g., local climate and soil conditions or surrounding landscape elements, have to be considered. Nevertheless, the conservation and creation of natural and semi-natural permanent habitats is important for biodiversity conservation and therefore play a key role in supporting the presence and activity of beneficial organisms in vineyard ecosystems. The adjacent non-crop vegetation in vineyard sites seems to affect biodiversity and vineyard ecosystem functioning.

Supplementary Materials

The following are available online at https://www.mdpi.com/article/10.3390/agronomy11061073/s1, Table S1: Soil nutrient content determined by Mehlich III test method; Table S2: List of all plant species of inter-row vegetation, sorted to families, found at three evaluated vineyards and their appearance on the phytosociological survey plots in all sampling terms; Table S3: All insects, resp. spiders, found at three evaluated localities, sorted to families and their occurrence in inter-row sampling plot (two-year average).

Author Contributions

Conceptualisation, L.R. and T.K.; methodology, L.R., T.K. and J.W.; formal analysis, L.R. and J.W.; investigation, L.R., H.Š. and T.K.; resources, T.K., R.P.; data curation, L.R., H.Š. and J.W.; writing—original draft preparation, L.R.; writing—review and editing, T.K., H.Š., R.P. and J.W.; supervision, R.P.; project administration, T.K.; funding acquisition, T.K. All authors have read and agreed to the published version of the manuscript.

Funding

This research was supported by the project IGA-ZF/2021-ST2001 Evaluation of ecosystem services of vegetation in permanent crops; and project CZ.02.1.01/0.0/0.0/16_017/0002334 Research Infrastructure for Young Scientists, co-financed by Operational Programme Research, Development and Education.

Institutional Review Board Statement

Not applicable.

Informed Consent Statement

Not applicable.

Data Availability Statement

Data sharing not applicable.

Acknowledgments

The authors are thankful to Vladimír Tetur (Vladimír Tetur s.r.o. winery), Stanislav Holec and Kateřina Matoušková for providing vineyards for evaluation and cooperation during evaluation period.

Conflicts of Interest

The authors declare no conflict of interest.

References

  1. Altieri, M.A.; Nicholls, C.I. Biodiversity and Pest Management in Agroecosystems, 2nd ed.; Food Producss Press: New York, NY, USA, 2004; ISBN 15-602-2923-3. [Google Scholar]
  2. Báez, S.; Collins, S.L. Shrub Invasion Decreases Diversity and Alters Community Stability in Northern Chihuahuan Desert Plant Communities. PLoS ONE 2008, 3, e2332. [Google Scholar] [CrossRef] [PubMed]
  3. Bommarco, R.; Kleijn, D.; Potts, S.G. Ecological intensification: Harnessing ecosystem services for food security. Trends Ecol. Evol. 2013, 28, 230–238. [Google Scholar] [CrossRef]
  4. Tilman, D.; Isbell, F.; Cowles, J.M. Biodiversity and Ecosystem Functioning. Annu. Rev. Ecol. Evol. Syst. 2014, 45, 471–493. [Google Scholar] [CrossRef]
  5. Altieri, M.A.; Nicholls, C.I.; Wilson, H.; Miles, A. Habitat Management in Vineyards: A Growers’ Manual for Enhancing Natural Enemies of Pests; Laboratory of Agroecology, University of California: Berkeley, CA, USA, 2010. [Google Scholar]
  6. Altieri, M.A.; Nicholls, C.I.; Ponti, L.; York, A. Designing biodiverse, pest-resilient vineyards through habitat management. Pract. Winery Vineyard 2005, 27, 16–30. [Google Scholar]
  7. Schellhorn, N.A.; Gagic, V.; Bommarco, R. Time will tell: Resource continuity bolsters ecosystem services. Trends Ecol. Evol. 2015, 30, 524–530. [Google Scholar] [CrossRef]
  8. Kelly, R.M.; Kitzes, J.; Wilson, H.; Merenlender, A. Habitat diversity promotes bat activity in a vineyard landscape. Agric. Ecosyst. Environ. 2016, 223, 175–181. [Google Scholar] [CrossRef]
  9. Rusch, A.; Chaplin-Kramer, R.; Gardiner, M.M.; Hawro, V.; Holland, J.; Landis, D.; Thies, C.; Tscharntke, T.; Weisser, W.W.; Winqvist, C.; et al. Agricultural landscape simplification reduces natural pest control: A quantitative synthesis. Agric. Ecosyst. Environ. 2016, 221, 198–204. [Google Scholar] [CrossRef] [Green Version]
  10. Boller, E.F.; Häni, F.; Poehling, H.M. Ecological Infrastructures. Ideabook on Functional Biodiversity at the Farm Level; IOBCwprs Commission on Integrated Production Guidelines and Endorsement: Lindau, Switzerland, 2004. [Google Scholar]
  11. Winkler, K.; Wäckers, F.; Bukovinszkine-Kiss, G.; van Lenteren, J. Sugar resources are vital for Diadegma semiclausum fecundity under field conditions. Basic Appl. Ecol. 2006, 7, 133–140. [Google Scholar] [CrossRef]
  12. Kopta, T.; Pokluda, R.; Psota, V. Attractiveness of flowering plants for natural enemies. Hortic. Sci. 2012, 39, 89–96. [Google Scholar] [CrossRef]
  13. Thomson, L.J.; Hoffmann, A.A. Spatial scale of benefits from adjacent woody vegetation on natural enemies within vineyards. Biol. Control. 2013, 64, 57–65. [Google Scholar] [CrossRef]
  14. Gaigher, R.; Pryke, J.; Samways, M.J. High parasitoid diversity in remnant natural vegetation, but limited spillover into the agricultural matrix in South African vineyard agroecosystems. Biol. Conserv. 2015, 186, 69–74. [Google Scholar] [CrossRef]
  15. Smith, I.M.; Hoffmann, A.A.; Thomson, L.J. Ground cover and floral resources in shelterbelts increase the abundance of beneficial hymenopteran families. Agric. For. Ѐntomol. 2014, 17, 120–128. [Google Scholar] [CrossRef]
  16. Tscharntke, T.; Bommarco, R.; Clough, Y.; Crist, T.O.; Kleijn, D.; Rand, T.A.; Tylianakis, J.M.; van Nouhuys, S.; Vidal, S. Conservation biological control and enemy diversity on a landscape scale. Biol. Control. 2007, 43, 294–309. [Google Scholar] [CrossRef]
  17. Thomson, L.J.; McKenzie, J.; Sharley, D.J.; Nash, M.A.; Tsitsilas, A.; Hoffmann, A.A. Effect of woody vegetation at the landscape scale on the abundance of natural enemies in Australian vineyards. Biol. Control. 2010, 54, 248–254. [Google Scholar] [CrossRef]
  18. Nascimbene, J.; Zottini, M.; Ivan, D.; Casagrande, V.; Marini, L. Do vineyards in contrasting landscapes contribute to conserve plant species of dry calcareous grasslands? Sci. Total Environ. 2016, 545-546, 244–249. [Google Scholar] [CrossRef]
  19. Mania, E.; Isocrono, D.; Pedullà, M.; Guidoni, S. Plant Diversity in an Intensively Cultivated Vineyard Agroecosystem (Langhe, North-West Italy). S. Afr. J. Enol. Vitic. 2015, 36, 378–388. [Google Scholar] [CrossRef] [Green Version]
  20. Hall, R.M.; Penke, N.; Kriechbaum, M.; Kratschmer, S.; Jung, V.; Chollet, S.; Guernion, M.; Nicolai, A.; Burel, F.; Fertil, A.; et al. Vegetation management intensity and landscape diversity alter plant species richness, functional traits and community composition across European vineyards. Agric. Syst. 2020, 177, 102706. [Google Scholar] [CrossRef]
  21. Ragasová, L.; Kopta, T.; Winkler, J.; Pokluda, R. Assessing Diversity Levels in Selected WineRegions of South Moravia (Czech Republic). Pol. J. Environ. Stud. 2020, 29, 1315–1321. [Google Scholar] [CrossRef]
  22. Mehlich, A. Mehlich 3 soil test extractant: A modification of Mehlich 2 extractant. Commun. Soil Sci. Plant Anal. 1984, 15, 1409–1416. [Google Scholar] [CrossRef]
  23. Braun-Blanquet, J. Pflanzensoziologie: Grundzüge der Vegetationskunde [Phytosociology: Fundamentals of Vegetation Science], 3rd ed.; Springer: Vienna, Austria, 1964. (In German) [Google Scholar]
  24. Urban, J.; Šarapatka, B. Ekologické Zemědělství [Ecological Agriculture]; MŽP: Praha, Czech Republic, 2003; (In Czech). ISBN 80-7212-274-6.
  25. AMET—Sdružení Litschmann & Suchý. Available online: http://www.amet.cz/ (accessed on 5 January 2021).
  26. Doxon, E.D.; Davis, C.A.; Fuhlendorf, S.D. Comparison of two methods for sampling invertebrates: Vacuum and sweep-net sampling. J. Field Ornithol. 2011, 82, 60–67. [Google Scholar] [CrossRef]
  27. Ter Braak, C.J.F.; Šmilauer, P. Canoco Reference Manual and User’s Guide: Software for Ordination (Version 5.0); Microcomputer Power: Ithaca, NY, USA, 2012. [Google Scholar]
  28. Miglécz, T.; Valkó, O.; Török, P.; Deák, B.; Kelemen, A.; Donkó, Á.; Drexler, D.; Tóthmérész, B. Establishment of three cover crop mixtures in vineyards. Sci. Hortic. 2015, 197, 117–123. [Google Scholar] [CrossRef]
  29. Tardy, F.; Moreau, D.; Dorel, M.; Damour, G. Trait-based characterisation of cover plants’ light competition strategies for weed control in banana cropping systems in the French West Indies. Eur. J. Agron. 2015, 71, 10–18. [Google Scholar] [CrossRef]
  30. Cunha-Blum, J.; Oki, Y.; Solar, R.; Fernandes, G.W. More is not always better: Responses of the endemic plant Vellozia nanuzae to additional nutrients. Acta Bot. Bras. 2020, 34, 487–496. [Google Scholar] [CrossRef]
  31. David, T.I.; Storkey, J.; Stevens, C.J. Understanding how changing soil nitrogen affects plant–pollinator interactions. Arthropod-Plant Interact. 2019, 13, 671–684. [Google Scholar] [CrossRef] [Green Version]
  32. Dehariya, P.; Mishra, D.; Dhakad, R.; Kumar, A. Studies on Different Levels of Nitrogen Application on Growth and Yield of Amaranthus (Amaranthus tricolor L.). Int. J. Curr. Microbiol. Appl. Sci. 2019, 8, 1423–1427. [Google Scholar] [CrossRef]
  33. Toungos, M.; Babayola, M.; Shehu, H.; Kwaga, Y.; Bamai, N. Effects of Nitrogen Fertilizer on the Growth of Vegetable Amaranths (Amaranthus cruensis L.) in Mubi, Adamawa State Nigeria. Asian J. Adv. Agric. Res. 2018, 6, 1–12. [Google Scholar] [CrossRef]
  34. Mitran, T.; Meena, R.S.; Lal, R.; Layek, J.; Kumar, S.; Datta, R. Role of Soil Phosphorus on Legume Production. Legumes Soil Health Sustain. Manag. 2018, 487–510. [Google Scholar] [CrossRef]
  35. Kishi, R.N.I.; Júnior, R.F.G.; Val-Moraes, S.P.; Kishi, L.T. Soil Microbiome and Their Effects on Nutrient Management for Plants. Probiotics Agroecosyst. 2017, 117–143. [Google Scholar] [CrossRef]
  36. Miransari, M. Soil microbes and the availability of soil nutrients. Acta Physiol. Plant. 2013, 35, 3075–3084. [Google Scholar] [CrossRef]
  37. Nascimbene, J.; Marini, L.; Ivan, D.; Zottini, M. Management Intensity and Topography Determined Plant Diversity in Vineyards. PLoS ONE 2013, 8, e76167. [Google Scholar] [CrossRef] [Green Version]
  38. Vencill, W.K.; Nichols, R.L.; Webster, T.; Soteres, J.K.; Mallory-Smith, C.; Burgos, N.R.; Johnson, W.; McClelland, M.R. Herbicide Resistance: Toward an Understanding of Resistance Development and the Impact of Herbicide-Resistant Crops. Weed Sci. 2012, 60, 2–30. [Google Scholar] [CrossRef] [Green Version]
  39. Castillo, P.; Rapoport, H.F.; Palomares-Rius, J.E.; Díaz, R.M.J. Suitability of weed species prevailing in Spanish vineyards as hosts for root-knot nematodes. Eur. J. Plant Pathol. 2007, 120, 43–51. [Google Scholar] [CrossRef]
  40. Novara, A.; Gristina, L.; Saladino, S.; Santoro, A.; Cerdà, A. Soil erosion assessment on tillage and alternative soil managements in a Sicilian vineyard. Soil Tillage Res. 2011, 117, 140–147. [Google Scholar] [CrossRef] [Green Version]
  41. Goldammer, T. Grape Grower’s Handbook, 3rd ed.; APEX Publishers: Centreville, VA, USA, 2018; ISBN 978-0967521268. [Google Scholar]
  42. Sulas, L.; Mercenaro, L.; Campesi, G.; Nieddu, G. Different Cover Crops Affect Nitrogen Fluxes in Mediterranean Vineyard. Agron. J. 2017, 109, 2579–2585. [Google Scholar] [CrossRef]
  43. Czech Government Order on Conditions for Implementation of Agri-Environmental-Climate Measures and on Amendment to Government Order No. 79/2007 Coll., On Conditions for Implementation of Agri-Environmental Measures, as Amended. (Nařízení Vlády o Podmínkách Provádění Agroenvironmentálně-Klimatických Opatření a o Změně Nařízení Vlády č. 79/2007 Sb., o Podmínkách Provádění Agroenvironmentálních Opatření, ve Znění Pozdějších Předpisů). Available online: https://www.zakonyprolidi.cz/cs/2007-79 (accessed on 6 January 2021).
  44. Finch, C.U.; Sharp, W.C. Covercrops in California Orchards and Vineyards; US Department of Agriculture: Washington, DC, USA, 1976; p. 25.
  45. Ruiz-Colmenero, M.; Bienes, R.; Marques, M. Soil and water conservation dilemmas associated with the use of green cover in steep vineyards. Soil Tillage Res. 2011, 117, 211–223. [Google Scholar] [CrossRef]
  46. Bolduc, E.; Buddle, C.M.; Bostanian, N.J.; Vincent, C. Ground-Dwelling Spider Fauna (Araneae) of Two Vineyards in Southern Quebec. Environ. Ѐntomol. 2005, 34, 635–645. [Google Scholar] [CrossRef]
  47. Bruggisser, O.T.; Schmidt-Entling, M.H.; Bacher, S. Effects of vineyard management on biodiversity at three trophic levels. Biol. Conserv. 2010, 143, 1521–1528. [Google Scholar] [CrossRef] [Green Version]
  48. Caprio, E.; Nervo, B.; Isaia, M.; Allegro, G.; Rolando, A. Organic versus conventional systems in viticulture: Comparative effects on spiders and carabids in vineyards and adjacent forests. Agric. Syst. 2015, 136, 61–69. [Google Scholar] [CrossRef]
  49. Fiera, C.; Ulrich, W.; Popescu, D.; Bunea, C.-I.; Manu, M.; Nae, I.; Stan, M.; Markó, B.; Urák, I.; Giurginca, A.; et al. Effects of vineyard inter-row management on the diversity and abundance of plants and surface-dwelling invertebrates in Central Romania. J. Insect Conserv. 2020, 24, 175–185. [Google Scholar] [CrossRef] [Green Version]
  50. Birkhofer, K.; Rusch, A.; Andersson, G.K.; Bommarco, R.; Dänhardt, J.; Ekbom, B.; Jönsson, A.; Lindborg, R.; Olsson, O.; Rader, R.; et al. A framework to identify indicator species for ecosystem services in agricultural landscapes. Ecol. Indic. 2018, 91, 278–286. [Google Scholar] [CrossRef]
  51. Maelfait, J.P.; Hendrickx, F. Spiders as bio-indicators of anthropogenic stress in natural and semi-natural habitats in Flanders (Belgium): Some recent developments. In Proceedings of the 17th European Colloquium of Arachnology, Edinburgh 1997; Selden, P.A., Ed.; British Arachnological Society: Bucks, UK, 1998. [Google Scholar]
  52. Ossamy, S.; Elbanna, S.M.; Orabi, G.M.; Semida, F.M. Assessing the potential role of spider as bioindicators in Ashtoum el Gamil Natural Protected Area, Port Said, Egypt. Indian J. Arachnol. 2016, 5, 100–112. [Google Scholar]
  53. Wäckers, F. Assessing the suitability of flowering herbs as parasitoid food sources: Flower attractiveness and nectar accessibility. Biol. Control. 2004, 29, 307–314. [Google Scholar] [CrossRef]
  54. Buide, M.L. Pollination Ecology of Silene acutifolia (Caryophyllaceae): Floral Traits Variation and Pollinator Attraction. Ann. Bot. 2005, 97, 289–297. [Google Scholar] [CrossRef] [PubMed] [Green Version]
  55. Kephart, S.; Reynolds, R.J.; Rutter, M.T.; Fenster, C.B.; Dudash, M.R. Pollination and seed predation by moths on Silene and allied Caryophyllaceae: Evaluating a model system to study the evolution of mutualisms. New Phytol. 2006, 169, 667–680. [Google Scholar] [CrossRef] [PubMed]
  56. De Castro, C.V.; Hoffmeister, T.S. Friend or foe? A parasitic wasp shifts the cost/benefit ratio in a nursery pollination system impacting plant fitness. Ecol. Evol. 2020, 10, 4220–4232. [Google Scholar] [CrossRef] [PubMed] [Green Version]
  57. Patt, J.M.; Hamilton, G.C.; Lashomb, J.H. Foraging success of parasitoid wasps on flowers: Interplay of insect morphology, floral architecture and searching behavior. Ѐntomol. Exp. Appl. 1997, 83, 21–30. [Google Scholar] [CrossRef]
  58. Kevan, P.G. Parasitoid Wasps as Flower Visitors in the Canadian High Arctic. J. Pest Sci. 1973, 46, 3–7. [Google Scholar] [CrossRef]
  59. Müller, H. Die Befruchtung der Blumen Durch Insekten und Die Gegenseitigen Anpassungen Beider; Engelmann: Leipzig, Germany, 1873; Volume VIII, p. 478. [Google Scholar]
  60. Györfi, J. Beiträge zur Biologie und Ökologie der Schlupfwespen (Ichneumonidae). Z. Angew. Entomol. 2009, 51, 142–147. [Google Scholar] [CrossRef]
  61. Gonçalves, F.; Carlos, C.; Aranha, J.; Torres, L. Does habitat heterogeneity affect the diversity of epigaeic arthropods in vineyards? Agric. For. Ѐntomol. 2018, 20, 366–379. [Google Scholar] [CrossRef]
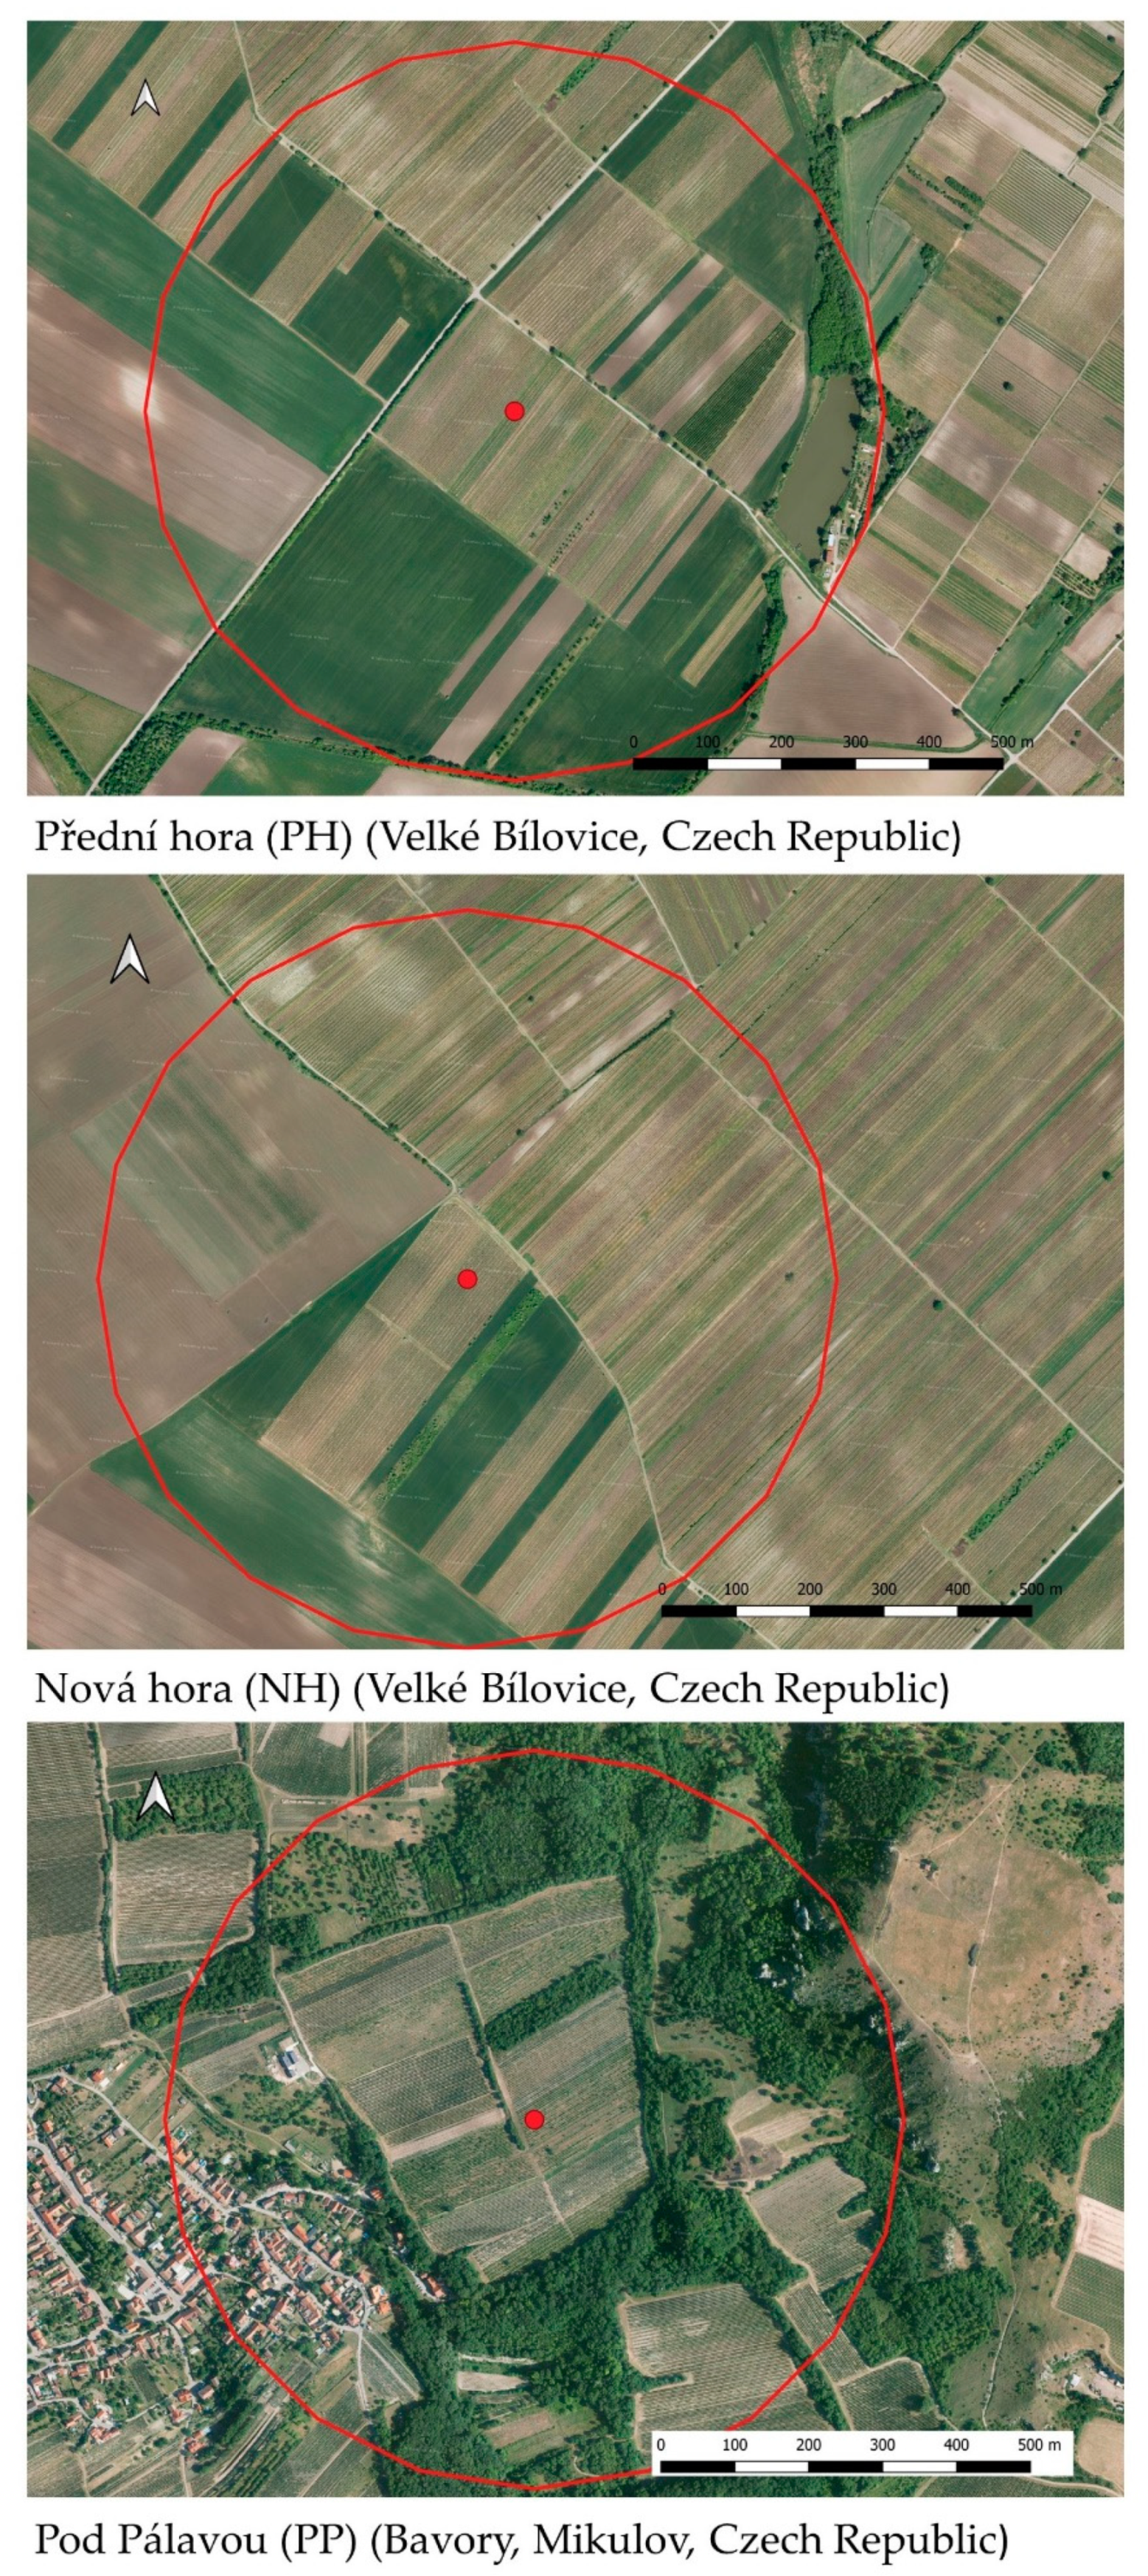
Figure 1. Aerial pictures of three selected vineyard sites, with a marked 500-m radius from the evaluated inter-row.
Agronomy 11 01073 g001
Figure 2. Ordination diagram of RDA, describing the distribution of three categories of weed species, the number of species and the coverage according to three different localities. Explanatory notes: OporWeed—opportunistic weeds; Non-weed—non-harmful weeds; DangWeed—dangerous weeds (average coverage rate [%] per two-metre-long plot in inter-row); Coverage—ground cover coverage rate (average coverage rate [%] per two-metre-long plot in inter-row); No. of Species—average number of plant species present in three two-metre-long plots in inter-row, pseudo-F = 3.2, p = 0.02.
Agronomy 11 01073 g002
Figure 3. Coverage rates of grasses (Poaceae), legumes (Fabaceae) and other dicotyledonous plants in inter-row vegetation from June to September at three localities.
Agronomy 11 01073 g003
Figure 4. RDA ordination diagram describing the relationship between the presence of insect orders, ground cover coverage, the number of insect families, the number of plant species and the three different localities, pseudo-F = 3.9, p = 0.008. Explanatory notes: ARACHNID—Arachnida, COLEO—Coleoptera, HEMI—Hemiptera, HYMENO—Hymenoptera, ORTHO—Orthoptera (average per six-metre-long sampling plot in inter-row; Coverage—ground cover coverage (%); InsectFamilies—average number of insect families per six-metre-long sampling plot in inter-row; PlantSpecies—average number of plant species per two-metre-long sampling plot in inter-row.
Agronomy 11 01073 g004
Figure 5. RDA ordination diagram of relationships between selected insect orders and plant families related to the three different localities, pseudo –F = 3.2, p = 0.008. The ’other dicotyledons’ group includes Apiaceae, Boraginaceae, Brassicaceae, Geraniaceae, Hypericaceae, Malvaceae, Papaveraceae, Polygonaceae, Portulacaceae, Plantaginaceae, Rosaceae and Violaceae.
Agronomy 11 01073 g005
Table 1. Weather conditions during months of evaluation in years 2018 and 2019 [25].
Vineyard Site MayJuneJulyAugust
t (°C) aRainfall (mm) bt (°C)Rainfall (mm)t (°C)Rainfall (mm)t (°C)Rainfall (mm)
Pod Pálavou201818.9042.7822.139.0622.336.5824.413.33
201913.1104.4723.626.9721.897.0322.163.86
Přední hora, Nová hora201818.287.7820.643.2321.758.082424.09
201912.4155.4322.995.721.1101.3121.7113.85
a average monthly air temperature, b sum of monthly precipitation amounts.
Table 2. Classification of weed species, according to Urban and Šarapatka [24], in the Czech Republic.
CategoryDescriptionExample (General)
Dangerous weedslarge plants in low amounts, very high ability to reproduce (noxious, invasive)Amaranthus retroflexus L., Atriplex spp., Avena fatua L. Chenopodium sp., Cirsium arvense (L.) Scop., Datura stramonium L., Echinochloa crus-galli (L.) P. B., Elytrigia repens (L.) Nevski, Hyoscyamus niger L., Rumex obtusifolius L., R. crispus L.
Opportunistic weedsmost common weeds, mid-growth, integrated in vegetation cover, not problematic, easily controlled by preventive measures, only problem when over-reproducedCapsella bursa-pastoris (L.) Med., Centaurea cyanus L., Mercurialis annua L., Papaver rhoeas L., Polygonum aviculare L., Setaria sp., Stellaria media (L.) Vill., Thlapsi arvense L., Viola arvensis Murray
Non-harmful weedslarge group of small plant species, with ground growth, no problems even when over- reproduced, controlled by common agrotechnical practicesAnagallis arvensis L., Daucus carota L., Geranium pusillum Burm.fil., Medicago lupulina L., Trifolium pratense L., Valerianella locusta (L.) Laterr., Veronica spp.
Table 3. Two-year average ground cover coverage rate, number of species and number of invertebrates’ families per evaluation plots at three vineyard sites with various proportions of surrounding non-crop vegetation.
Proportion of Non-Crop Vegetation a (%)Average b Coverage Rate (%)No. of Plant Species cTotal Number of Plant Species dNo. of Invertebrates’ Families e
S.E. S.E. S.E.
Přední Hora771.214.139.080.771710.250.76
Nová Hora252.085.417.790.59218.960.90
Pod Pálavou4268.961.9011.040.613011.080.75
a proportion of non-crop vegetation within 500-m radius of the place of evaluation; b average ground cover coverage rate per two-metre-long plot of inter-row from all evaluation terms, n = 24; c average number of plant species found on two-metre-long plot of inter-row from all eight evaluation terms, n = 24; d total number of plant species found within all three repetitions and all evaluation terms; e average number of invertebrate families per six-metre-long sampling plot in inter-rows from all evaluation terms, n = 24.
Publisher’s Note: MDPI stays neutral with regard to jurisdictional claims in published maps and institutional affiliations.