Article

Hyperspectral Detection and Monitoring of Salt Stress in Pomegranate Cultivars

by
Antonella Calzone
1,2,
Lorenzo Cotrozzi
1,*,
Giacomo Lorenzini
1,3,4,
Cristina Nali
1,3,4 and
Elisa Pellegrini
1,3,4
1
Department of Agriculture, Food and Environment, University of Pisa, Via del Borghetto 80, 56124 Pisa, Italy
2
CREA Research Centre for Engineering and Agro-Food Processing, Via Venezian 26, 20133 Milan, Italy
3
CIRSEC, Centre for Climate Change Impact, University of Pisa, Via del Borghetto 80, 56124 Pisa, Italy
4
Nutrafood Research Center, University of Pisa, Via del Borghetto 80, 56124 Pisa, Italy
*
Author to whom correspondence should be addressed.
Agronomy 2021, 11(6), 1038; https://doi.org/10.3390/agronomy11061038
Submission received: 20 April 2021 / Revised: 19 May 2021 / Accepted: 19 May 2021 / Published: 22 May 2021

Abstract

:
Advancements in the ability to detect plant responses to salinity are mandatory to improve crop yield, quality, and management practices. The present study shows the capability of hyperspectral reflectance (400–2400 nm) to rapidly and non-destructively detect and monitor the responses of two pomegranate cultivars (Parfianka, P, and Wonderful, W) under salt treatment (i.e., 200 mL of 100 mM NaCl solution every day) for 35 days. Analyzing spectral signatures from asymptomatic leaves, the two cultivars, as well as salinity conditions were discriminated. Furthermore, using a partial least squares regression approach, we constructed predictive models to concomitantly estimate (goodness-of-fit model, R2: 0.61–0.79; percentage of the root mean square error over the data range, %RMSE: 9–14) from spectra of various physiological leaf parameters commonly investigated in plant/salinity studies. The analyses of spectral signatures enabled the early detection of salt stress (i.e., from 14 days from the beginning of treatment, FBT), even in the absence of visible symptoms, but they did not allow the identification of the different degrees of salt tolerance between cultivars; this cultivar-specific tolerance to salt was instead reported by analyzing variations of leaf parameters estimated from spectra (W was less tolerant than P), which, in turn, allowed the detection of salt stress only at later times of analysis (i.e., slightly from 21 day FBT and, evidently, at the end of treatment). The proposed approach could be used in precision agriculture, high-throughput plant phenotyping, and smart nursery management to enhance crop quality and yield.

1. Introduction

Salinity is a major threat to modern agriculture, limiting crop growth and development [1]. Soil salinity is a global environmental constraint to crop production and is expected to increase due to climate change, especially in climate change hot-spots such as the Mediterranean area [2]. The strong multi-decadal salinification of the Mediterranean Sea and its intrusion into the aquifers, together with the accumulation of salts from irrigation and fertilization practices, are a serious issue for Mediterranean crops, particularly in coastal areas [3]. Salinity impairs plant growth and development through water stress, cytotoxicity, due to excessive uptake of ions (e.g., sodium, Na+, and chloride, Cl), and nutritional imbalance. Furthermore, salinity is usually accompanied by oxidative stress, due to overproduction of reactive oxygen species (ROS) [4]. Advancements in phenotyping techniques capable of rapidly and non-destructively detecting and monitoring the effects of salt stress on plants are necessary to increase crop yield, quality, and management promptness and effectiveness.
Vegetation spectroscopy is a high-throughput sensor technology based on optical features of living vegetation, such as leaf and canopy reflectance. It allows the rapid and non-destructive detection and monitoring of plant conditions, along with a simultaneous estimation of many plant traits [5]. The acquisition of this information from leaf spectra relies on variations of light-induced vibrational excitation of molecular organic bonds, primarily C-H, N-H and O-H, at specific wavelengths in the visible (VIS, 400–700 nm), near-infrared (NIR, 700–1100 nm), and short-wave infrared (SWIR, 1100–2400 nm) spectral regions [6]. Improvements in the portability and sensitivity of spectrometers, as well as in the computational capacity and chemometric modeling, have enabled the extensive exploitation of leaf hyperspectral data by (i) calculating simple vegetation spectral indices (VSI) developed because they are related to various plant traits (e.g., normalized difference vegetation index, NDVI [7]; photochemical reflectance index, PRI [8]); (ii) directly modeling commonly investigated foliar morphological, physiological, and biochemical parameters as a function of spectral data (e.g., [9,10,11,12,13]), using multivariate methods such as partial least squares regression (PLSR, [14]); and (iii) analyzing spectral signatures interpreted as a phenotypic expression of the aggregate signals of morphological, physiological, and biochemical characteristics of leaves under specific environmental conditions [6]. Furthermore, it is important to stress that vegetation spectroscopy can help us to monitor plant function over large geographic regions if scaled to remote sensing collections from air- or spaceborne platforms, where imaging sensors are usually preferable, since they can supply spectral information with spatial resolution of the imaged object [6,15].
Although the use of hyperspectral reflectance is broadly regarded as a promising phenotyping approach in agriculture (e.g., [16,17,18]), the potential of this technique is still not fully realized. At present, for example, studies aimed at understanding relationships among leaf optical properties and major plant processes such as photosynthesis and water regulation have focused on only a relatively small number of plant species and functional traits (e.g., ribulose bisphosphate carboxylation and foliar water content) [9,11], overlooking other commonly investigated parameters such as those related to photosynthetic performance (provided by measurements of chlorophyll a fluorescence, ChlF) or leaf osmotic potential (Ψπ). Then, the ability of reflectance data to rapidly and non-destructively detect and monitor crop salt stress remains underexplored. Using both imaging and non-imaging optical sensors at different scales (i.e., from leaf to spaceborne level), spectral data have been used to assess salt stress in some crops, such as wheat [19,20,21], rice [22], maize [23,24], soybean [25], barley [26,27], sugarcane [28], lettuce [5,29], melon [30], okra [31], and castor bean [32]. However, these studies were mostly carried out using limited spectral regions, and focused only on VSI, without combining these simple calculations with other approaches to better exploit information from spectra (e.g., multivariate-methods to predict leaf traits and analyses of spectral signatures). Furthermore, many crop species challenged by salinity worldwide have not been investigated using vegetation spectroscopy so far.
Pomegranate (Punica granatum L., Punicaceae) is a fruit-bearing deciduous shrub extensively grown in arid and semi-arid regions of the world, such as the Mediterranean area, because of its high potential as a functional food and nutraceutical source [33] and its adaptability to a wide range of environmental constraints, including drought and salinity [34,35]. Pomegranate plants are able to adopt water saving strategies at both ecophysiological and biochemical levels to preserve leaf functionality and water status under salt stress [36]. However, pomegranate salt tolerance, which is mainly related to stomatal regulation, Na+/Cl uptake and compartmentalization and osmolyte accumulation, has been shown to be highly cultivar-dependent [37,38]. To date, although spectral data have been used in some studies to determine the quality and maturity of pomegranate fruits and juice [39,40,41,42], only Calzone, et al. [43] collected hyperspectral data on pomegranate leaves to assess oxidative stress induced by ozone, by analyzing spectral signatures and variations of leaf parameters (e.g., photosynthetic activity, lipid peroxidation and antioxidant capacity) estimated from spectra by ad hoc developed PLSR models. To the best of our knowledge, the capability of vegetation spectroscopy to characterize the interaction of pomegranate with salt stress has never been investigated before.
This study aims to evaluate the capability of hyperspectral data to rapidly and non-destructively detect and monitor salinity stress in two widely cultivated pomegranate cultivars, Parfianka and Wonderful. In particular, the main purposes are to (a) evaluate the potential of full-range (400–2400 nm) hyperspectral phenotyping to pre-visually and accurately detect and classify moderate salt stress conditions in pomegranate cultivars at different treatment durations; (b) develop PLSR-models to estimate from spectra various leaf parameters which are pivotal to investigating plant-salinity interaction (i.e., those related to the photosynthetic performance and water status); and (c) investigate the salinity-induced variations of VSI and leaf parameters derived from spectra by PLSR-models, in order to elucidate any different degree of salt tolerance between pomegranate cultivars.

2. Materials and Methods

2.1. Plant Material and Experimental Design

Two-year-old container-grown pomegranate plants of the commercial cultivars Parfianka (P) and Wonderful (W) were collected from a local nursery and transported to the field-station of San Piero a Grado (Pisa, Italy; 43°40′48″ N, 10°20′46″ E, 2 m a.s.l.), owned by the Department of Agriculture, Food and Environment, University of Pisa. Subsequently, 20 plants per cultivar were selected for uniformity of height, transplanted into 5-L plastic pots containing sandy soil, and maintained well-watered in a greenhouse with natural lighting for 10 days. Plants were then subjected to two salinity treatments for 35 days by daily applications of 200 mL of 0 (EC = 0.05 mS/cm; controls) or 100 mM NaCl solutions (EC = 8.36 mS/cm) [38]. To avoid salinity shock, the NaCl concentration was gradually increased by 25 mM every other day until the final 100 mM concentration was reached (after 6 days), at which point, the salinity treatment was considered to have begun [44,45]. The greenhouse day and night mean temperatures were 27 and 21 °C, respectively; day and night mean relative humidity were around 60% and 50%, respectively.
Measurements were carried out at 0, 14, 21, 28, and 35 days from the beginning of treatment (FBT). At each time of measurement, leaf reflectance profiles of 24 plants equally distributed among cultivars and salinity treatments (one leaf per plant) were collected in a few minutes. These reflectance measurements (n = 120) were used for the analyses of spectral signatures and for the final estimations of VSI and other leaf parameters predicted by PLSR-models. Besides these spectral measurements, the remaining 16 plants were equally distributed among cultivars and salinity treatments and were measured at each time FBT (except at 0 days FBT) combining spectral collections and standard measurements of ChlF, relative water content (RWC), and Ψπ (one leaf per plant for each analysis). This iterated (n = 64) procedure produced a dataset that was used to build PLSR-models. Measurements of leaf water potential (Ψw) were also collected at each time FBT but only on 12 plants, equally distributed among cultivars and salinity treatments, and thus not included in PLSR modeling. All measurements were performed on the third/fourth highest, mature and fully-expanded leaves. The potential onset of foliar symptoms was checked throughout the whole experiment.

2.2. Collection of Leaf Spectra

Leaf reflectance profiles were collected using a full range (350–2500 nm) ASD FieldSpec 4 spectroradiometer (Analytical Spectral Devices, Boulder, CO, USA), provided with a plant probe including an internal halogen light source and assembled with a leaf-clip. Two randomly selected areas (∅ 1 cm) of the adaxial surface of each leaf were investigated, with one measurement per area, and collections were averaged for each leaf. The relative leaf reflectance was determined by dividing the leaf radiance by the radiance of a white reference panel included in the leaf-clip, which was collected every 10 spectral measurements. All spectral analyses and calculations were performed on untransformed reflectance profiles (only spectral jump correction and data interpolation were carried out).

2.3. Standard Measurements

After a 40 min dark-adaptation of leaves, the maximum quantum efficiency of the photosystem II (PSII) photochemistry (Fv/Fm), the PSII operating efficiency in light conditions (ΦPSII), the photochemical quenching (qP), and the non-photochemical quenching (qN) were determined by a PAM-2000 chlorophyll a fluorometer (Walz, Effeltrich, Germany), set as reported by Cotrozzi, et al. [46].
Water status parameters were determined on the same plants at mid-day, according to Stanton and Mickelbart, [47]. Relative water content was calculated as (FW-DW)/(TW-DW) × 100, where FW is the fresh weight, TW is the turgid weight after rehydrating samples for 24 h, and DW is the dry weight after oven-drying leaves at 60 °C until constant weight. Leaf osmotic potential was converted from osmolality (using the Van’t Hoff equation) determined by a VAPRO® Vapor Pressure Osmometer (EliTech Group, Puteaux, France). Leaf water potential was measured using a Scholander pressure chamber (model 600 Pressure Chamber Instrument, PMS Instrument Company, Albany, NY, USA).

2.4. Analyses of Spectral Signatures

The effects of cultivar, time, salinity and their interactions on the reflectance profiles of pomegranate leaves were determined by permutational analysis of variance (PERMANOVA, a non-parametric method based on permutation tests) [48], employing Euclidian measurements of dissimilarity and 10,000 permutations. Spectral responses were visualized using principal coordinates analysis (PCoA) on the same spectral data utilized for PERMANOVA, using the “vegan” package in R (www.r-project.org, accessed on 1 March 2021; [49]). This method uses a distance of uncorrelated variables, or principal coordinates, reducing the dimensionality of the data. Using Euclidean distances, PCoA was run only for the significant effects shown by PERMANOVA.
Partial least squares discriminant analysis (PLS-DA) [50] was additionally used to determine the ability of hyperspectral data to classify experimental groups that showed statistical significance by PERMANOVA. PLS-DA is a statistical approach used with high dimensional data to discriminate groups by projecting latent variables through the response and predictor variables to both reduce data dimensionality and maximize prediction accuracy and is an appropriate method for data in which predictor variables have a high degree of collinearity. The PLS model fits response variables that are indicators of groups of interest to the spectrum [5]. The analyses were applied 500 times by iteratively splitting observations into different groups of calibration (training) and validation (testing) sets, and the number of correct classifications both in the calibration and the validation sets were used to evaluate the accuracy of the tested model. The calibration:validation data ratio and the number of components (i.e., latent variables) used to obtain the models that would give the best discrimination accuracy were determined by iteratively running the PLS-DA models with different calibration:validation data ratios (i.e., 50:50, 70:30, 80:20) and numbers of components and was based on the highest Kappa values returned for the validation models. The PLS-DA was performed using the “caret” and “vegan” packages in R (www.r-project.org, accessed on 1 March 2021; [49,51]).

2.5. PLSR-Model Calibration and Validation

The PLSR [14] models were generated from the reflectance profiles to predict Fv/Fm, ΦPSII, qP, qN, RWC, and Ψπ. When predictor variables are highly correlated, as in the case with hyperspectral data, classical regression techniques can produce unreliable coefficients and error estimates. In contrast to standard regression techniques, PLSR reduces a large number of collinear predictor variables into relatively few, uncorrelated latent variables and has become the preferred method for chemometric approaches [5]. To avoid potential overfitting, in the PLSR models, the numbers of components (i.e., latent variables) to use were selected on the basis of the reduction of the predicted residual sum of squares (PRESS) statistics [52], using leave-one-out-cross-validation. Finally, the selected sets of extracted components were combined into linear models predicting leaf traits on the basis of leaf spectral profiles.
Similarly to PLS-DA, the model performance was evaluated by conducting 500 randomized permutations of the datasets iteratively using 80% of the data for calibration and the remaining 20% for validation. For each permutation, we calculated statistics to assess model performance when applied to the calibration and the validation data sets: the goodness-of-fit model (R2), the overall error rate (i.e., root mean square error, RMSE), the percentage of RMSE over the data range (%RMSE), and the bias. The strength contribution of PLSR loadings by individual wavelengths was also determined using the variable important to the projection (VIP) statistics [14,53]. The VIP statistic evaluates the importance of individual wavelengths in explaining the variation in both the response and predictor variables, with larger weightings conferring greater value to the contribution of individual wavelengths to the predictive model [5]. Before developing the final modeling, we tested preliminary models to identify poorly predicted outliers, following Couture et al., [10]. Outliers that were removed accounted for approximately 10% of the initial data. The modeling approach and data analyses were performed using the “pls” package in R (www.r-project.org, accessed on 1 March 2021).
Best practices suggest to further externally validate the developed PLSR-models (i.e., test their accuracy in prediction on other independent samples not used in model development). This operation was not performed in the current study because of the small sample number. Thus, although outputs for validation are usually in agreement with external validation (e.g., [54]), we encourage an external validation before using the coefficients from PLSR-models reported here.

2.6. Estimation of Leaf Traits by PLSR-Models and Vegetation Spectral Indices

Fv/Fm, ΦPSII, qP, qN, RWC, and Ψw were estimated from spectra by applying the coefficients of the PLSR-models developed in the present study, while estimates of lipid peroxidation determined in terms of malondialdehyde (MDA) accumulation, oxygen radical absorption capacity (ORAC), and total phenolic (Phen) and total anthocyanin (Ant) contents were generated from spectra using calibrations by Calzone et al. [43].
The following widely-used VSI were also calculated: PRI, an indicator of photosynthetic radiation use efficiency, (R531 − R570)/(R531 + R570) [8], scaled as sPRI = (PRI + 1)/2 to avoid negative values; NDVI, an indicator of leaf greenness, photosynthetic activity, and overall plant health, (R780 − R570)/(R780 + R570) [7]; normalized difference water index, NDWI, an indicator of vegetation water content, (R857 − R1241)/(R857 + R1241) [55]; plant senescence reflectance index, PSRI, an indicator of senescing processes, (R678 − R500)/R750 [56], scaled as sPSRI = (PSRI + 1)/2 to avoid negative values; chlorophyll index, CI, an indicator of chlorophyll content, (R750 − R705)/(R750 + R705) [57]; and carotenoid reflectance index, CRI, an indicator of carotenoid accumulation (R510)−1 − (R550)−1 [58]. Rx indicates reflectance at x nm wavelength.

2.7. Statistical Analysis of Leaf Traits Estimated from Spectra, Vegetation Spectral Indices, and Ψw

The Shapiro–Wilk test was used to evaluate the normal distribution of leaf traits derived from spectra by PLSR-models, VSI, and Ψw (standard measurements). The effects of cultivar, time, salinity, and their interactions on these parameters were then investigated by a three-way repeated measures analysis of variance (ANOVA; repeated measures were not used for Ψw), using Tukey’s test as the post hoc test. Statistically significant effects were considered for p ≤ 0.05. These ANOVA were run in JMP 13.2.0 (SAS Institute Inc., Cary, NC, USA).

3. Results

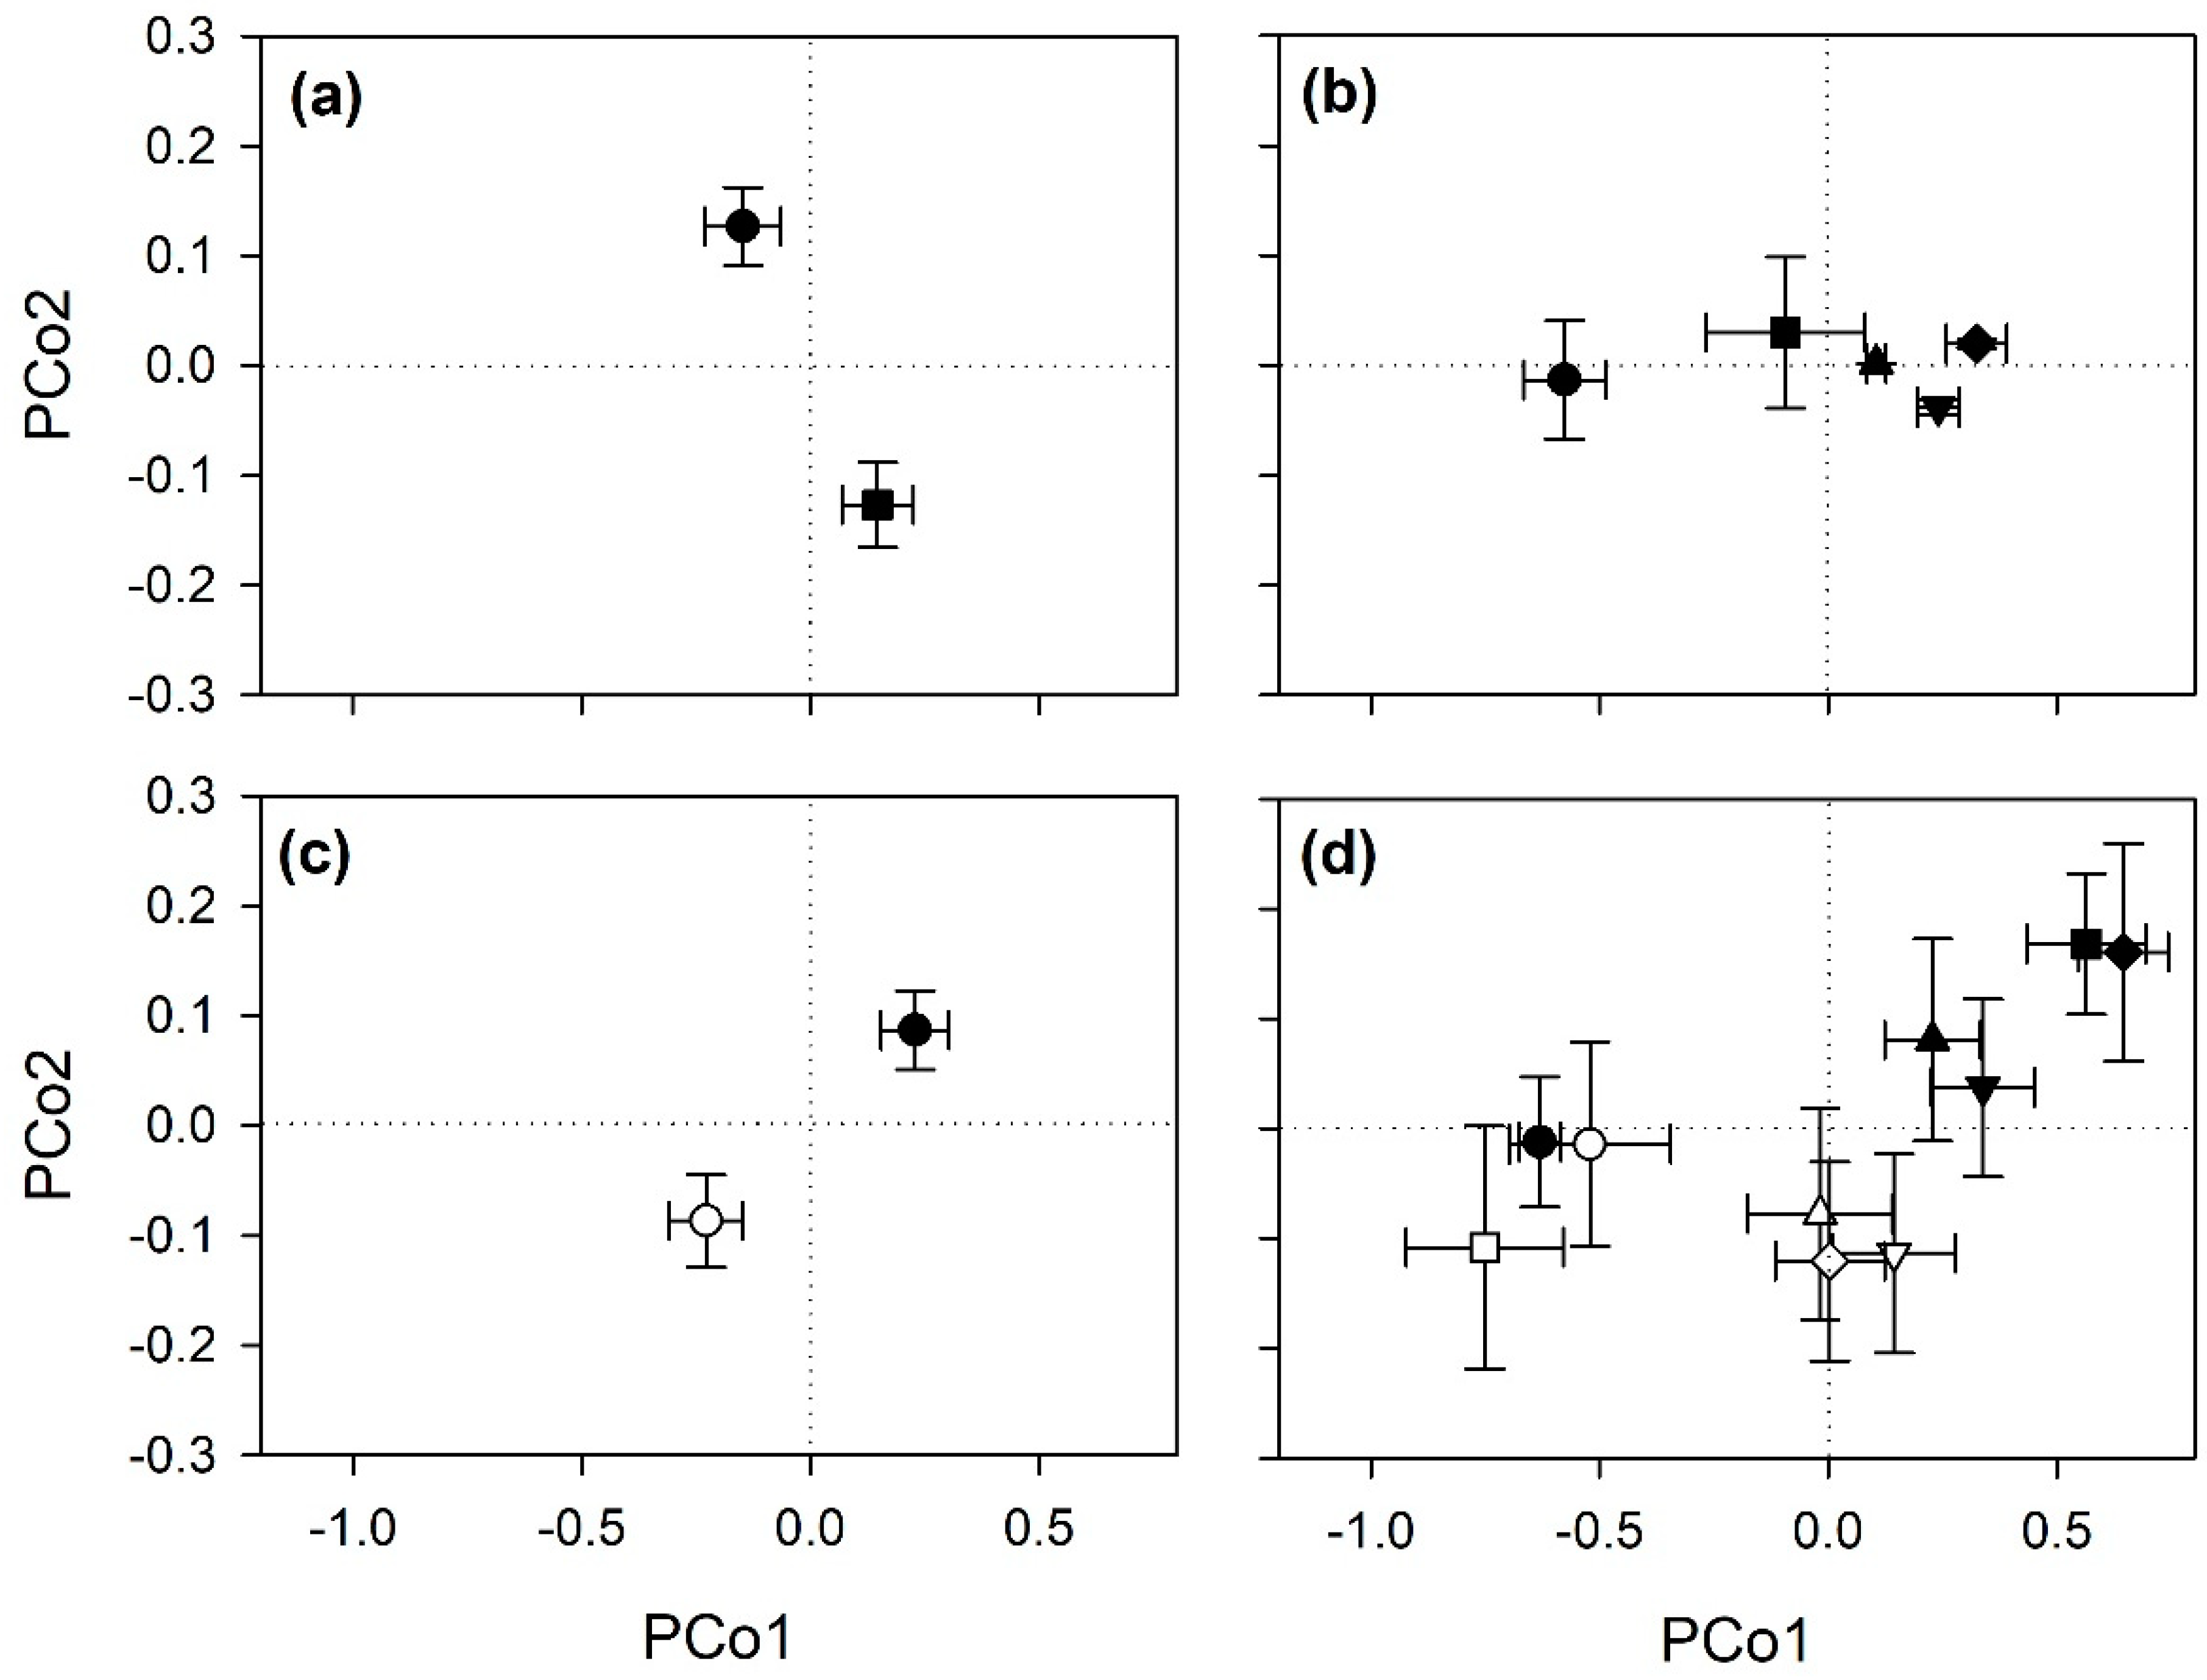
3.1. Analyses of Spectral Singatures

Multiple different spectral ranges were initially investigated to optimize the statistical outputs of the PERMANOVA (Table S1), and the best outputs were finally recorded using the full range (i.e., 400–2400 nm). Final PERMANOVA showed that cultivar, time and salinity affected the reflectance profiles of pomegranate leaves (Table 1). A significant effect was also found for the time × salinity interaction, while a marginally significant effect (p = 0.07) was observed for the trifactorial cultivar × time × salinity. Figure 1, which summarizes the outputs of PCoA, shows the significant effects reported on pomegranate spectra.
The best classifications of experimental conditions from spectra (i.e., highest Kappa) were recorded using a 80:20 ratio for calibration:validation data using 39, 26, 44, and 60 components (i.e., latent variables) for cultivar, time, salinity, and time × salinity, respectively. Cultivar and salinity conditions were very accurately classified from spectra (mean accuracy and Kappa were 0.89 and 0.79 for cultivar, and 0.79 and 0.58 for salinity; Table 2), and acceptable classification outputs were found for time conditions (0.66 and 0.58), since misclassification occurred only between consecutive times. Modest classification accuracy was instead reported for the bifactorial time × salinity conditions (0.53 and 0.48), since misclassification occurred among the controls measured at different times, as well as among controls and salt-treated plants measured at the first times of analysis (i.e., from 0 to 21 days FBT). A similar modest classification accuracy was found for the trifactorial cultivar × time × salinity conditions (data not shown).

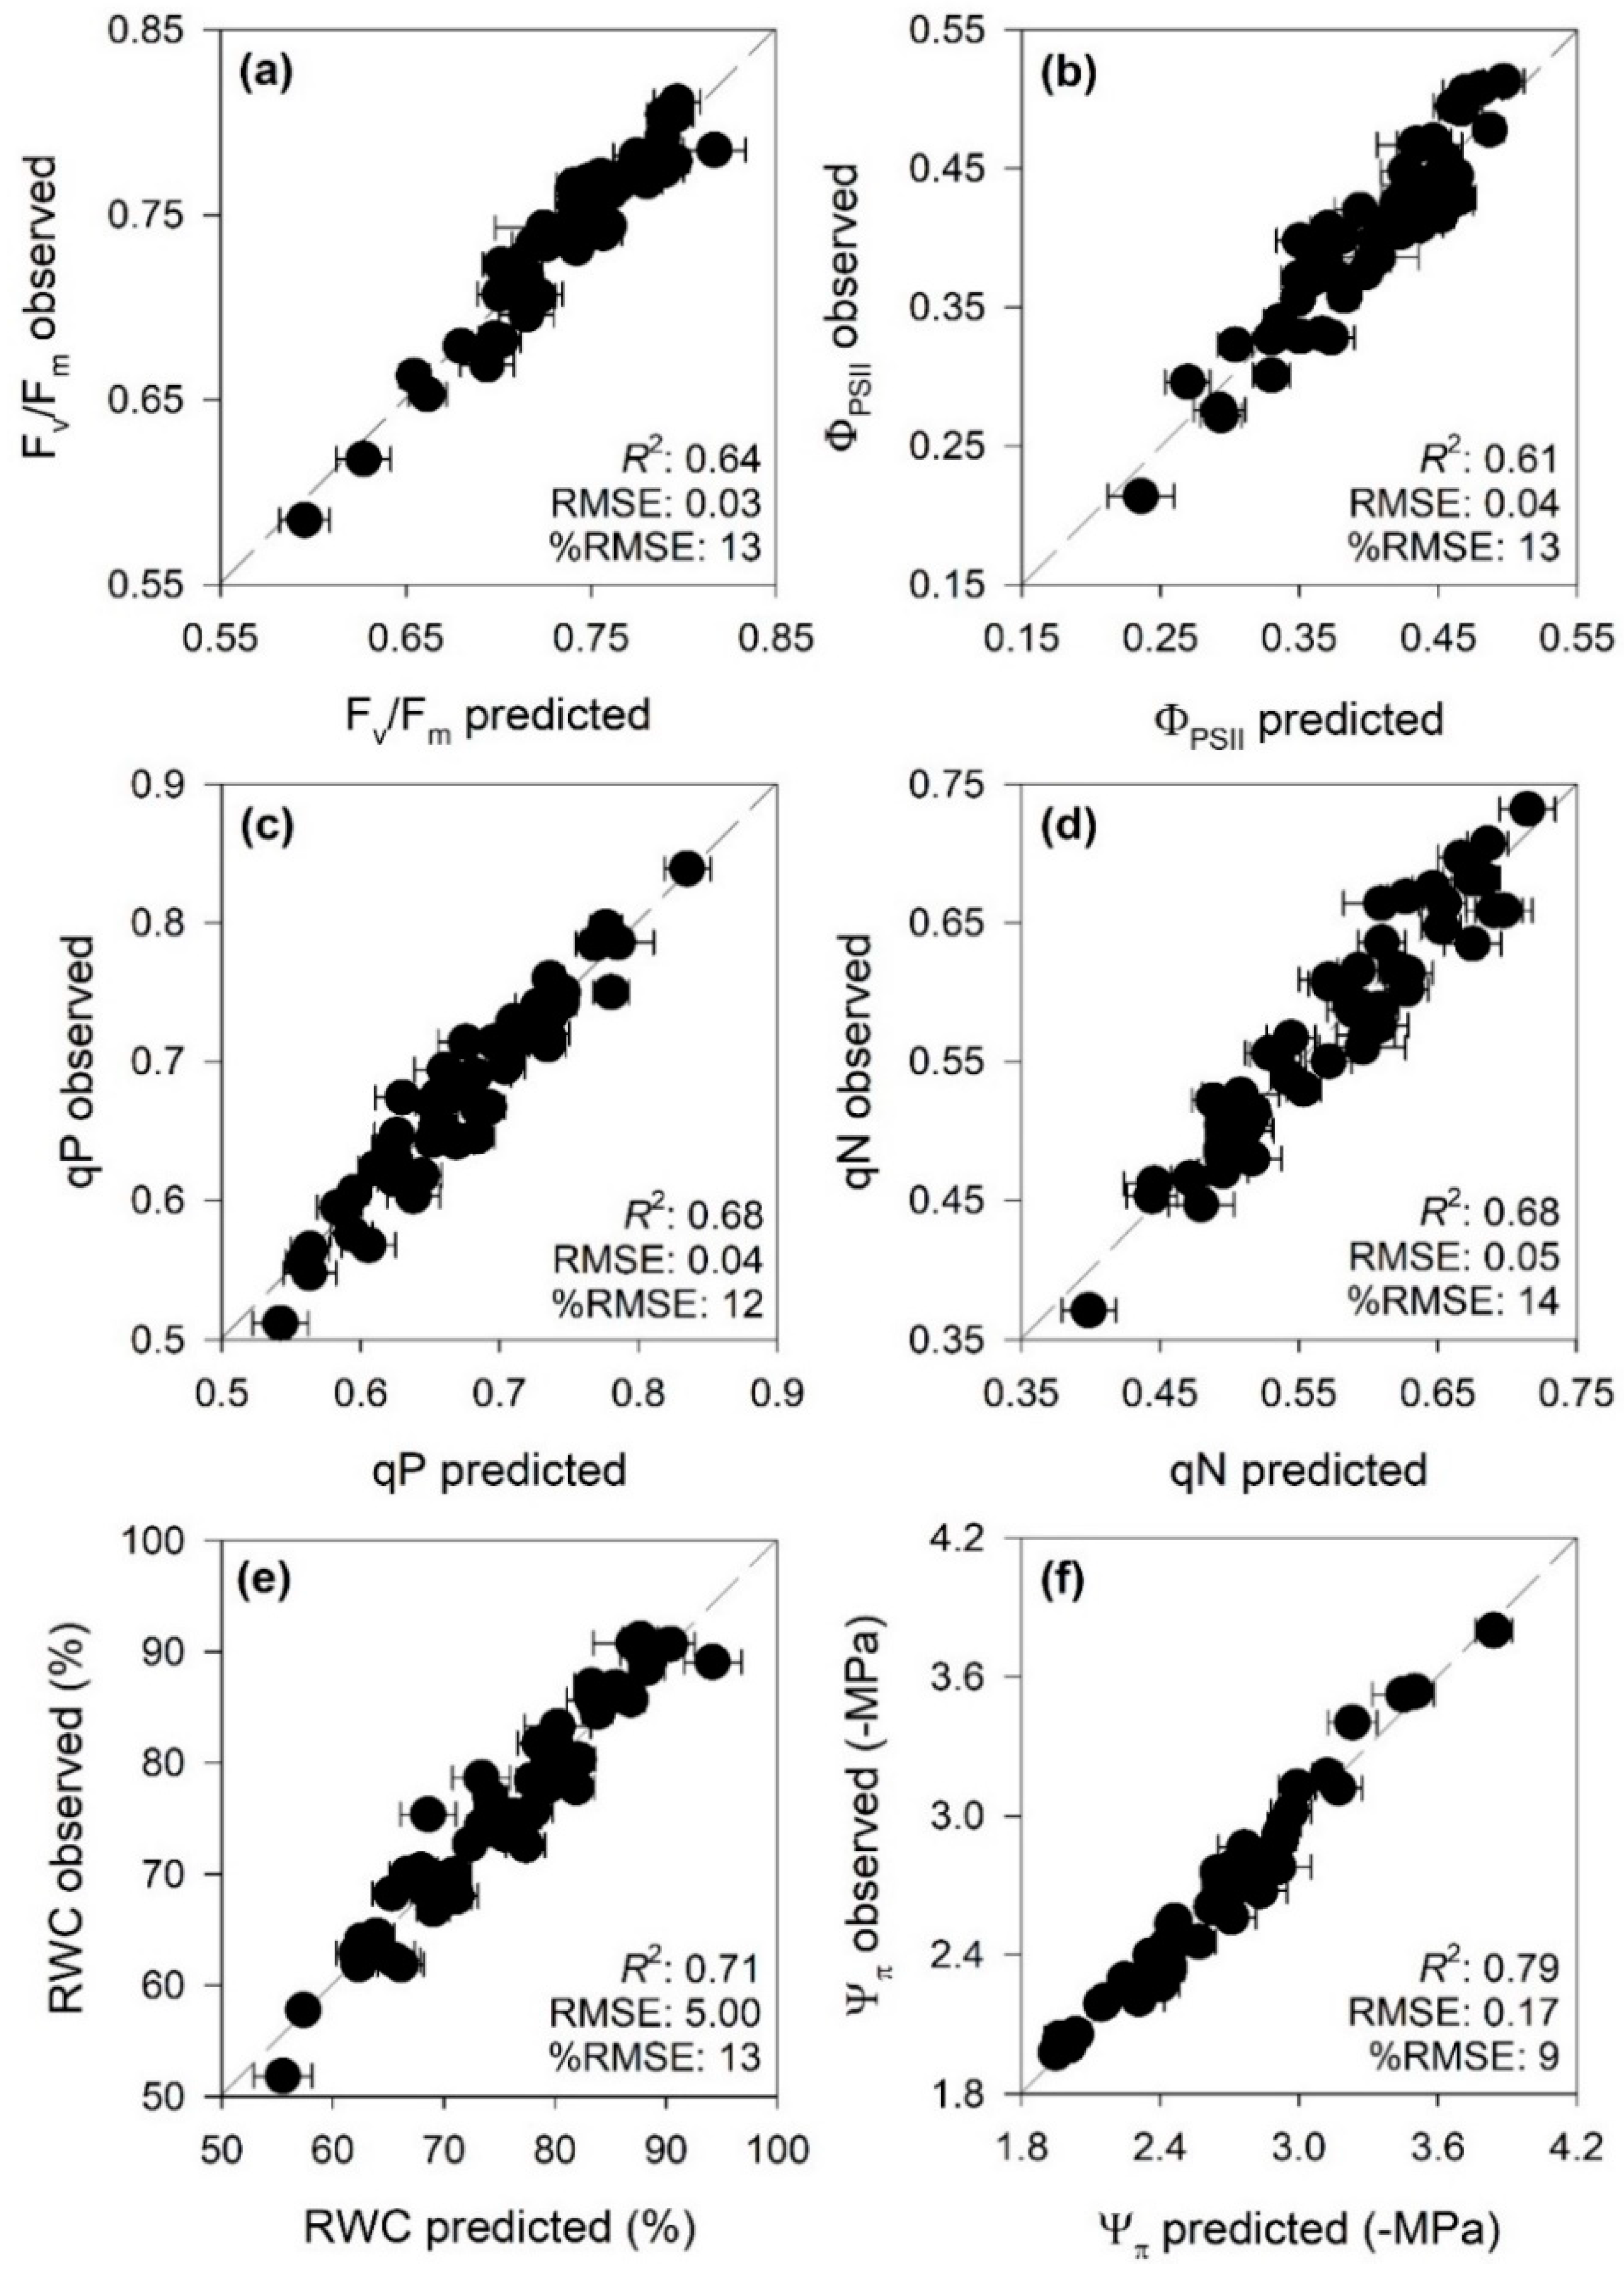
3.2. PLSR Prediction Models

Various spectral ranges (including specific absorption features reported in the literature that we expected to be directly or indirectly associated to specific parameters), and number of components (i.e., latent variables; Table S1) were firstly tested to obtain best prediction accuracy (i.e., highest R2 and lowest RMSE, %RMSE and bias) of the PLSR models developed for the prediction of Fv/Fm, ΦPSII, qP, qN, RWC, and Ψπ from spectra. The final models for estimations of Fv/Fm and ΦPSII utilized the wavelength range 400–1200 nm, including 12 and 11 components, respectively. The final qP and qN PLSR models utilized the 400–700 and 400–800 nm spectral regions, including 13 and 12 components, respectively. The 1400–2400 nm range was utilized in the final PLSR model for predictions of RWC and Ψπ, including 13 and 12 components, respectively (Table 3).
PLSR models very accurately characterized Fv/Fm, ΦPSII, qP, qN, and even more RWC and Ψπ (R2 and %RMSE for validation: 0.64 and 13, 0.61 and 13, 0.68 and 12, 0.68 and 14, 0.71 and 13, 0.79 and 9, respectively; Table 3 and Figure 2). Profiles of standardized coefficients (i.e., centered and scaled) and VIP metrics from PLSR models for chlorophyll a fluorescence parameters (i.e., Fv/Fm, ΦPSII, qP and qN) highlighted the 400–700 nm (i.e., VIS) wavelengths as particularly important for estimations. Standardized coefficients and VIP values of PLSR models for water status (i.e., RWC and Ψπ) parameters highlighted important spectral wavelengths from 1800 to 2000 nm (Figure S1).

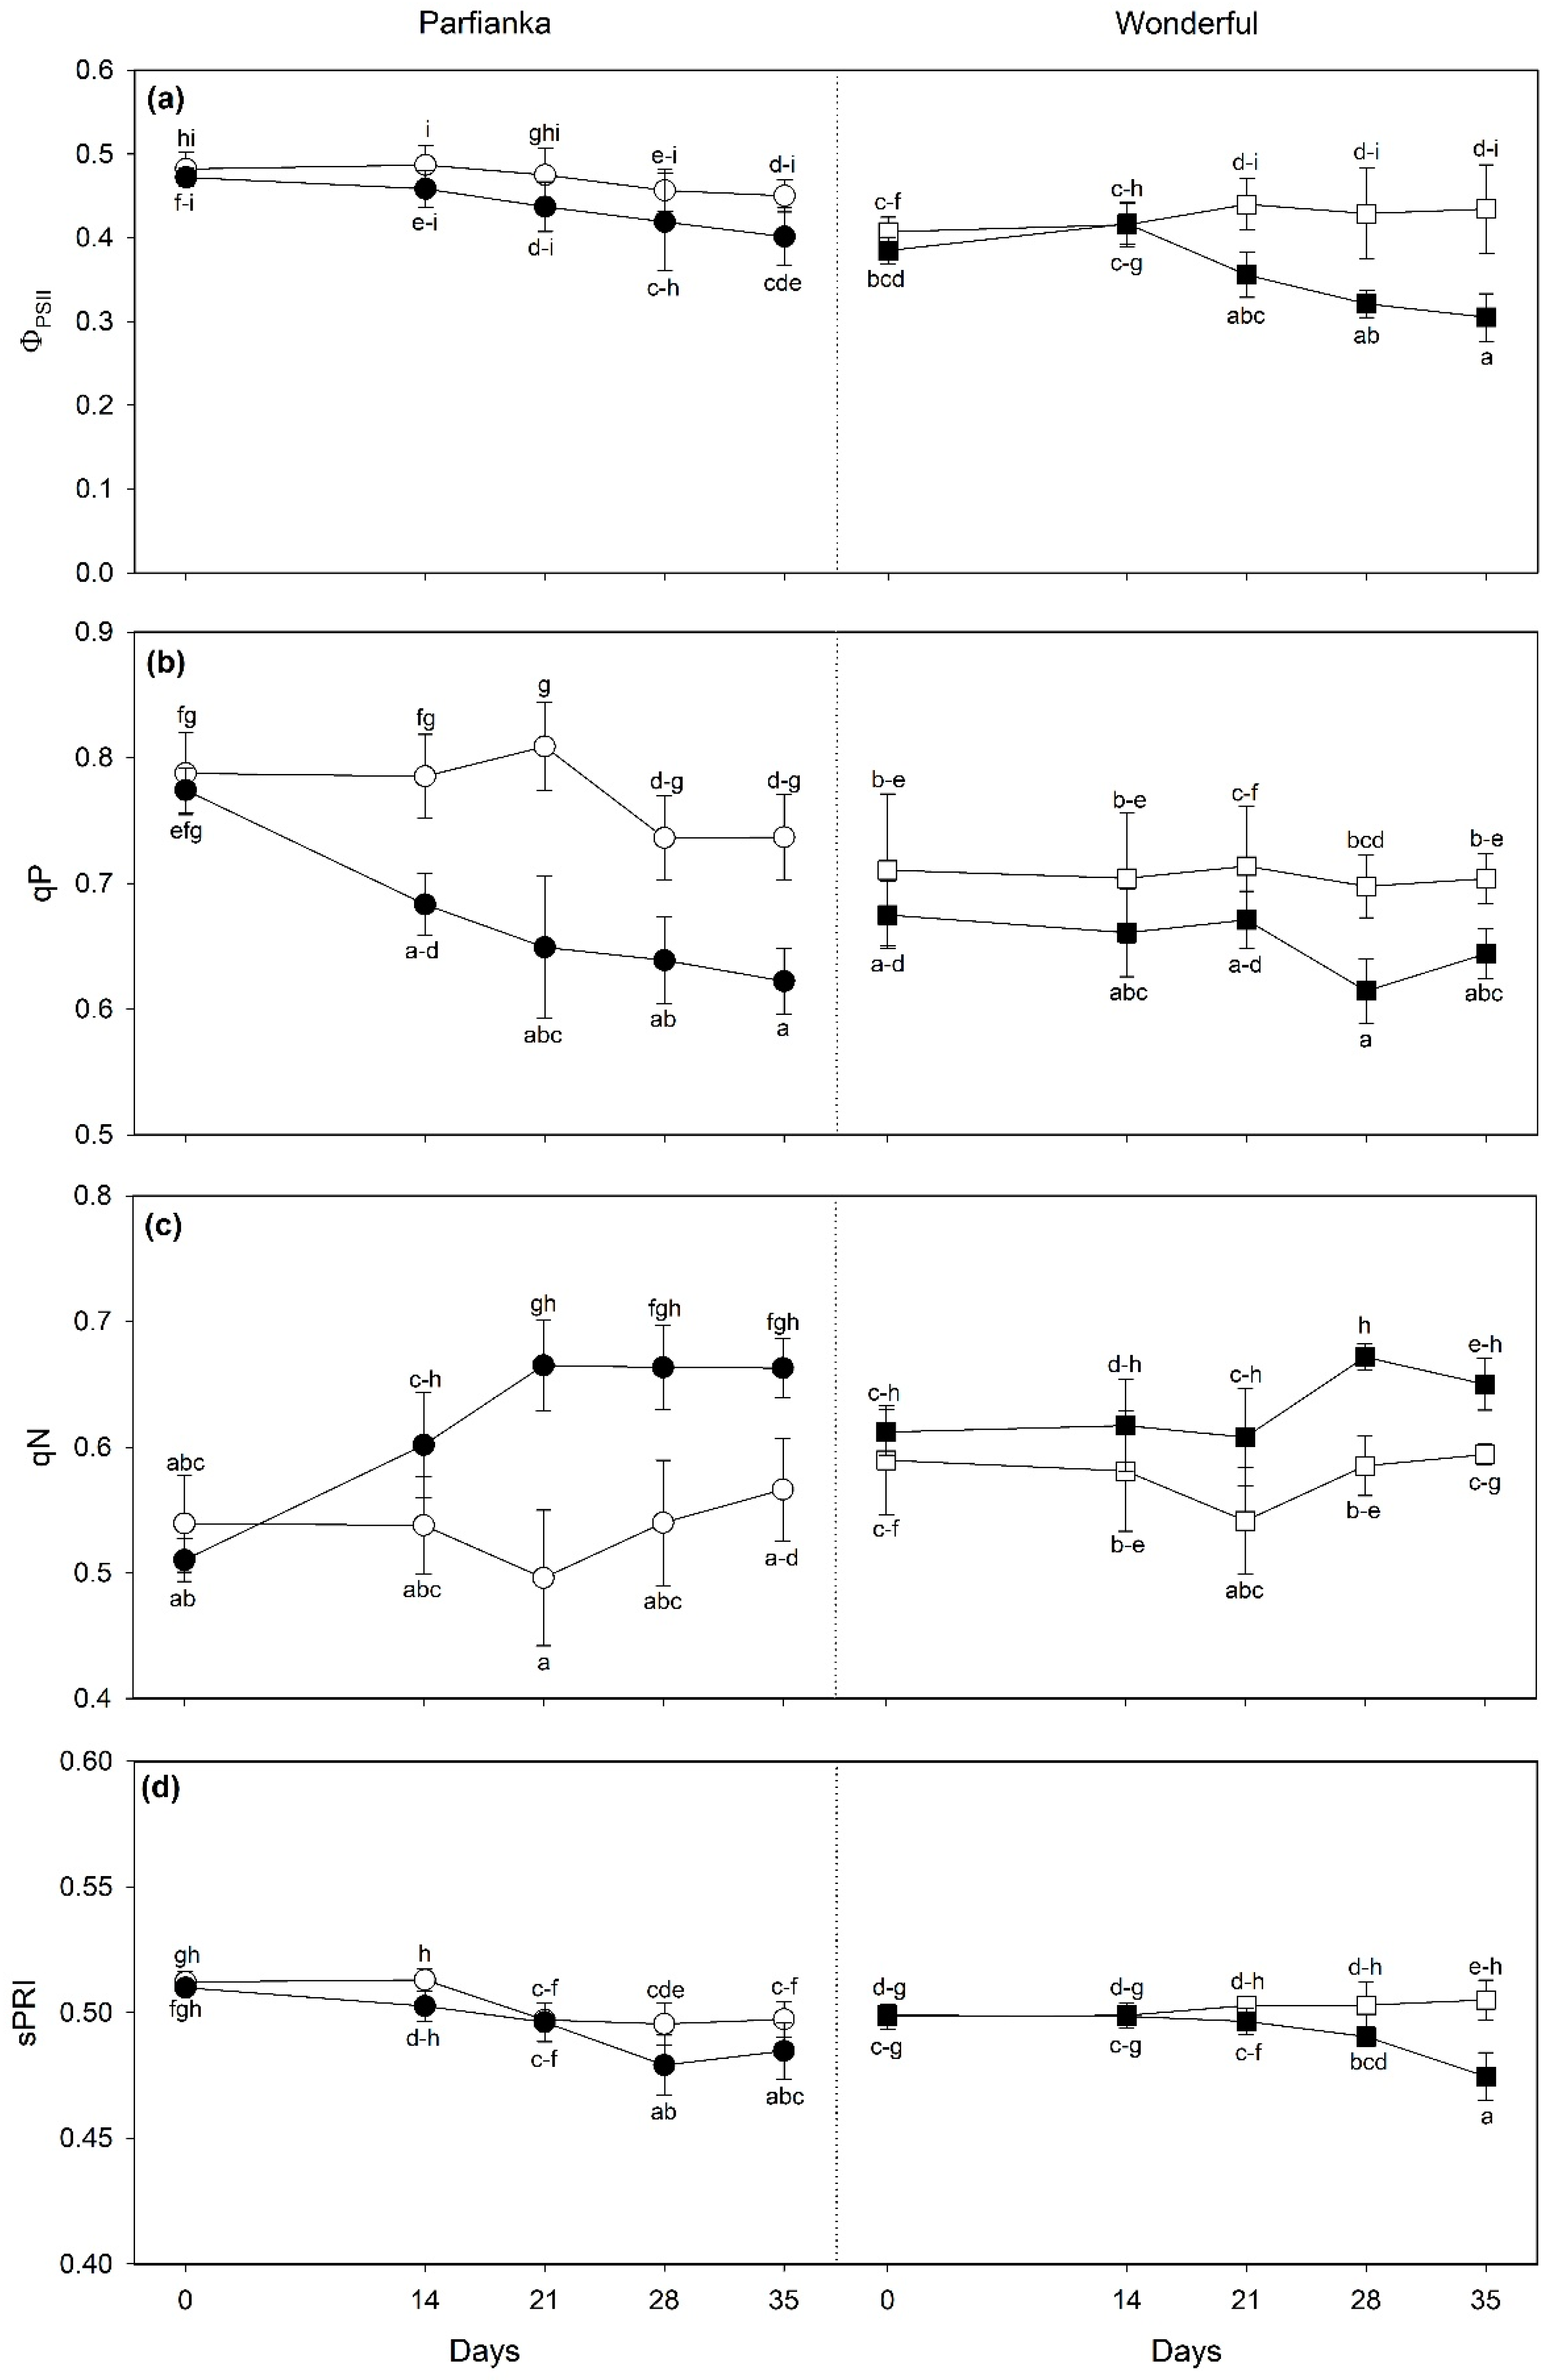
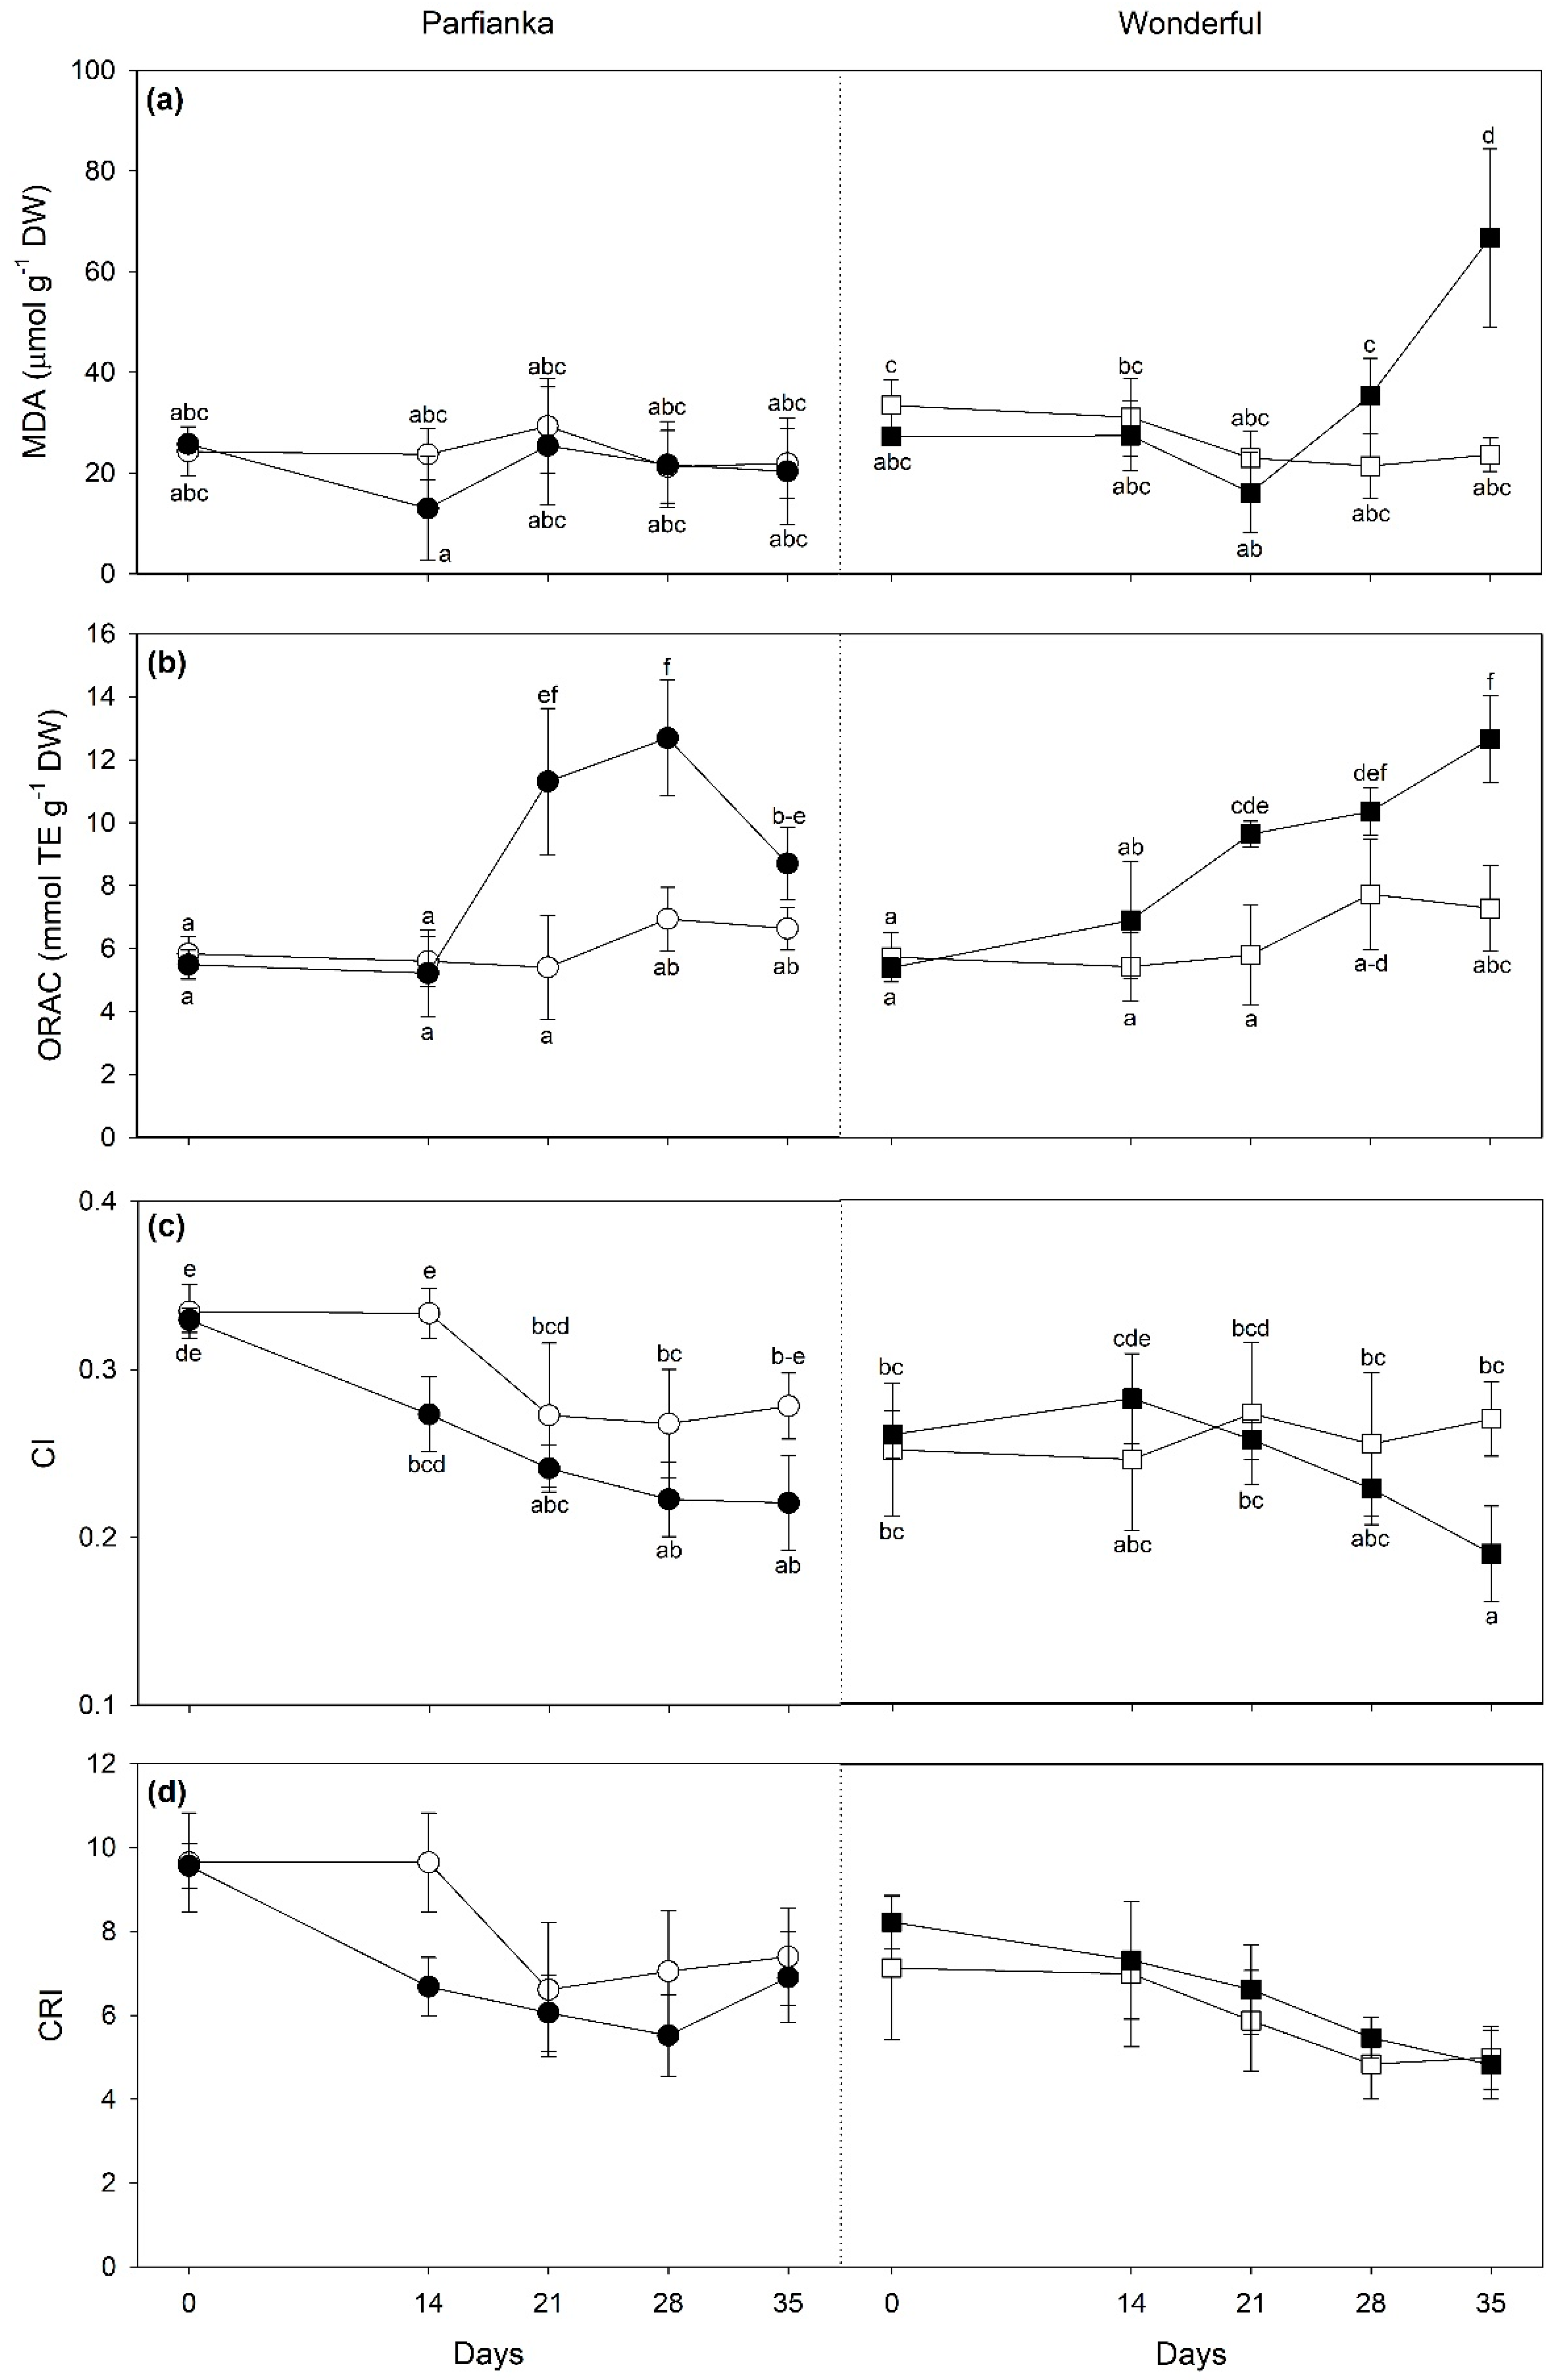
3.3. Variations of Spectra-Estimated Parameters and Vegetation Spectral Indices

Table 4 shows the effects of cultivar, time, salinity, and their interactions on leaf parameters predicted from spectra by PLSR-models, VSI, and Ψw. Fv/Fm showed significant effects only for unifactorial effects, with salinity slightly decreasing this parameter (−2%, as average among cultivars and times). Salinity decreased ΦPSII only in W from 21 to 35 days FBT (from −10 to −30%, in comparison with controls; Figure 3a). Differently, it decreased qP from 14 days FBT and increased qN from 21 days FBT only in P (−16 and +25%, respectively, as average among times), whereas similar responses were reported only at 28 days FBT in W (−12 and +15%, respectively; Figure 3b,c). sPRI decreased under salinity only in P at 28 days FBT and in W at 35 days FBT (−4 and −8%, respectively; Figure 3d). Although the three-way cultivar × time × salinity interaction was significant on NDVI, no significant differences were reported among samples exposed to different salinity conditions at each time of analysis and in both cultivars. Only a significant cultivar effect was reported on sPSRI (it was slightly lower in W).
Salinity decreased Ψw from 14 to 35 days FBT in both cultivars (two-fold, as average among times; Figure 4a), while it decreased Ψπ only at 14 and 35 days FBT in W (−19 and −46%, respectively) and only at 35 days FBT in P (−41%; Figure 4b). Although the three-way cultivar × time × salinity interaction was significant on RWC, no significant differences were reported among samples exposed to different salinity conditions at each time of analysis and in both cultivars. Differently, NDWI were reduced by salinity only in W (−20%, as the average among times; Figure 4c).
Salinity induced a strong increase of MDA only at 35 days FBE in W (around three-fold; Figure 5a). ORAC increased under salinity at 21 and 28 days FBT in P (around two-fold), to then go back to control levels at the end of the experiment; whereas it increased at 21 and 35 days in W (+66 and +74%, respectively; Figure 5b). Phen showed a time × salinity significant effect, but no significant differences were found between salt conditions at each time of analysis. Similarly, although the three-way cultivar × time × salinity interaction was significant on Ant, no significant differences were reported among samples exposed to different salinity conditions at each time of analysis and in both cultivars. Salinity decreased CI only at 14 days FBT in P (−18%), whereas only at 35 days in W (−30%; Figure 5c). A significant cultivar × salinity interaction was found on CRI, since this index was reduced by salinity only in P (−14%, as average among times; Figure 5d).

4. Discussion

4.1. Hyperspectral Discrimination of Cultivars and Salinity Conditions

Advancements in the ability to rapidly and non-destructively detect plant responses to salinity is necessary to improve crop yield, quality, and management practices. The present study demonstrated that full range hyperspectral data (i.e., 400–2400 nm) can be used as a high-throughput phenotyping tool to discriminate with high accuracy (around 80% of success) the salt stress conditions of pomegranate leaves, even in the absence of visible injury. Furthermore, it confirmed the capability of this approach to accurately distinguish (around 90% of success) pomegranate cultivars (almost visually identical during the whole vegetative phase), and times of analysis, although some misclassifications occurred between consecutive times [43]. Interestingly, different salt treatments were discriminable already at 14 days FBT (i.e., very significant time × salinity interaction); although modest classification accuracy was reported, due to misclassifications among controls measured at different times, as well as among controls and salt-treated plants measured at the first times of analysis (i.e., early salinity challenge). Conversely, the other interactive effects on spectral profiles were not detected, except for the marginally significant tri-factorial cultivar × time × salinity interaction. This limitation in prediction accuracy of interactive effects by spectroscopic data has been already reported [5,43], but the lack of a significant interaction including the cultivar effect might be due to a similar salt tolerance between cultivars. Actually, Calzone et al. [38] reported a similar salinity tolerance between cultivars, although the occurrence of differential biochemical regulations, with P mostly activating osmolyte, antioxidant, and macronutrient regulations compared to W.
Overall, these results highlight the potential of analyzing full-range hyperspectral signatures as a phenotypic expression of leaves under specific environmental constraints [59] to early detect and monitor stress conditions induced by salinity, as previously reported for various abiotic and biotic stressors (e.g., [5,13,60,61]). We thus encourage the use and development of this spectroscopy approach, since spectral signatures of plants could potentially provide crucial information for plant selection and management, more than focusing on individual traits that are often not sufficient to monitor and manage plant productivity and quality. However, high-throughput measurements of specific leaf parameters are also necessary, since the prediction of these outcomes, in combination with analyses of spectral signatures, has the potential to provide multiple layers of stress-specific information to growers, including the identification of the underlying leaf responses, that can further increase the efficiency of management practices [5].

4.2. Spectroscopic Estimation of Photosynthetic Performance and Water Status Parameters

Effectively, another major and novel achievement of the present study was the concomitant prediction from spectra of various widely used leaf parameters related to salinity stress (although an external validation of these PLSR-models would be suggested to further test their estimation accuracy). First, we demonstrated the potential to concomitantly predict from the spectra of light-adapted leaves of pomegranate various ChlF parameters that are commonly collected from measurements on both dark- and light-adapted leaves to investigate the photosynthetic performance of plants under abiotic and biotic stressors [62]. Standard collections of these parameters are often logistically challenging, usually requiring several minutes (e.g., >30 min) per leaf, as the leaf has first to reach the dark-adapted state and then come back to the light-adapted state [63]. Spectral approaches have been shown as a valid alternative to standard measurements of photosynthetic activity in plants by using both VSI correlated with photosynthetic processes (e.g., [8,64,65,66]) and developing PLSR models to directly estimate commonly used photosynthetic parameters (e.g., [13,54,67,68,69]). Here, we found a good prediction performance for all the PLSR modeled ChlF parameters (validation R2: 0.61–0.68; %RMSE: 12–14), and this approach was more accurate than previous efforts performed through relations between VSI and a few ChlF parameters (e.g., Jia et al. [64] reported a validation R2 for Fv/Fm ranging from 0.10 to 0.55).
It is not surprising that best predictions of Fv/Fm and ΦPSII were obtained using only a portion of the available spectral profile (i.e., 400–1200 nm), including the VIS, characterized by the strong absorption of leaf pigments, and the NIR, mainly related to the leaf cell structure (this also means that these parameters could be estimable with inexpensive optical instrumentation [6]). The use of narrower ranges, including only specific absorption wavelengths for the trait to be estimated, sometimes leads to better predictions than using wider ranges, since the incorporation of other spectral regions may reduce the prediction ability of trait-specific wavelengths. Moreover, qP was best predicted using only the VIS (i.e., 400–700 nm), while qN was best predicted using the 400–800 nm spectral range. It is interesting that the estimation of qN, a defensive mechanism employed by plants by harmlessly dissipating excess excitation energy as heat [62], was more accurate when including the red-edge at 700–750 nm, which is a characteristic feature of plant reflectance profiles largely reported as dependent on chlorophyll content (e.g., [70,71]) and stress conditions (e.g., [6,72]). Overall, standardized coefficients and VIP values of PLSR models of ChlF parameters highlighted the importance of wavelengths from 400 to 700 nm, according to several studies showing the relevance of this pigment-related spectral region in the assessment of photosynthetic processes (e.g., [8,54,67,73]).
Second, we developed PLSR-models to predict from leaf spectral data two parameters related to water status that are widely used in plant/salinity studies (as well as in many other research fields involving osmotic stress, such as drought studies): RWC and Ψπ. The assessment of these traits by standard procedures (i.e., using a precision balance and an osmometer, respectively) may be precise, but has several limitations, since these methods are destructive, time consuming, user-dependent and point-based, all aspects that make these investigations logistically challenging for monitoring a large number of individual plants. Interestingly, we found excellent prediction performance for both RWC and Ψπ (validation R2: 0.71 and 0.79; %RMSE: 13 and 9, respectively), which are measures of the amount of leaf water content and the leaf energy status, respectively [74]. The high sensitivity of vegetation reflectance to the amount of water as well as to the composition and concentration of osmolytes that affect variation in Ψπ (and ultimately in Ψw) have been already reported (e.g., [11]).
Both RWC and Ψπ were best predicted using the 1400–2400 nm spectral region which is dominated by water content and outside of wavelengths commonly associated with pigments. This wavelength region was primarily the SWIR region and excluded the minor water absorption features centered at 970 and 1200 nm. Actually, we expected that the RWC predictions would have performed better when including also the wavelengths from 950 to 1400 nm (including minor water absorption bands, [75]), but this outcome might be due to the fact that, here, RWC variation was induced by salinity, and osmoregulation may have played a major role in pomegranate stress response. By eliminating the NIR portion of the spectrum, we potentially amplified the contribution of osmolytes to the prediction of RWC and Ψπ. Multiple studies [11,76,77,78,79] have reported that these wavelength regions are important for predicting non-structural carbohydrates and other foliar osmolytes (e.g., amino acids). Moreover, our theory is supported by an overlapping of wavelengths strongly related with standardized coefficients and VIP values (i.e., 1800–2000 nm) and these spectral features of common foliar osmolytes [11].

4.3. Variations of Spectra-Estimated Parameters and Vegetation Spectral Indices

Finally, the present study concretely shows the potential of using the abovementioned and complementary spectroscopic approaches for monitoring the responses of plants to salinity. Variations of the investigated leaf parameters derived from spectra and VSI confirmed the salinity tolerance of both cultivars [38]. Indeed, although the marked drop of Ψw occurred from 21 days FBT, the leaf functionality seemed not to be severely compromised, as confirmed by the almost absent photoinhibition damage (Fv/Fm was reduced only by 2%) and weakness and senescence clues (NDVI and sPSRI did not change), as well as by the reduction of Ψπ reported only at the end of treatment. However, a lesser salt tolerance was reported for W, since it was the only cultivar where a reduction of PSII performance occurred, as confirmed by the reduction of ΦPSII from 21 days FBT, and of sPRI at the end of treatment. A decrease of ΦPSII in W under salt stress was previously reported by Olmo et al. [80]. P likely protected the ΦPSII performance by reducing the light energy used in photochemistry (qP decreased) and activating the dissipation of the excess energy as heat (qN increased; [36,63]). The lower salt tolerance of W was further confirmed by other salt-induced variations occurring only in this cultivar: the reduction of NDWI (it is interesting to note that this difference between cultivars was not detected by analyzing RWC, likely because of the error in the accuracy of its PLSR model developed using values collected by standard measurements that may already had an error rate in the RWC determination), the strong increase of lipid peroxidation (MDA increased) occurred at the end of the treatment, suggesting an elevated oxidative pressure and a concomitant drop of chlorophyll content (CI decreased) [81,82]. This difference between cultivars was likely due to an ability of P to activate an antioxidant response at 21 and 28 days FBT [38], which resulted effective because it was triggered at the proper magnitude and at the crucial time of the plant/salt interaction, in contrast to the one ineffectively triggered by W at 21 (likely too mild) and 35 (likely too late) days FBT. This antioxidant response adopted by P likely involved a regulation of carotenoids (CRI decreased only in P [83]), whereas Phen and Ant did not change (even if this outcome does not mean that secondary metabolism was not involved in the salt response). Overall, the pomegranate responses reported in the present study using parameters estimated from spectra are in accordance with a previous study reporting parameters collected by standard procedures [38].

5. Conclusions

In conclusion, the present study confirms that hyperspectral data can accurately discriminate cultivars of the same species, as well as salt stress conditions in plants. Furthermore, it shows that vegetation spectroscopy can be a rapid, non-destructive, and relatively inexpensive tool to concomitantly and accurately estimate an array of leaf parameters commonly investigated to monitor plant/salinity interaction, using a single spectral measurement (further experiment replications and outcome validations are encouraged). It is important to note that the analyses of spectral signatures enabled the early detection of salt stress (i.e., from 14 days FBT), even in the absence of visible injuries, but they did not allow the identification of the different salinity tolerance between cultivars; this cultivar-specific tolerance to salinity was instead reported by analyzing variations of leaf parameters estimated from spectra, which in turn allowed the detection of salt stress only at later times of analysis. Overall, these outcomes confirm the importance of combining the different available approaches to exploit spectral data and, therefore, maximize the benefits of using vegetation spectroscopy not only for further plant science research, but also for growers to enhance management efficiency, as well as crop quality and yield, with lower environmental impact. Being applicable in the field on a large number of plants over multiple time periods, the results presented in the current study could be used in a number of frameworks such as precision agriculture, high-throughput plant phenotyping, and smart nursery management.

Supplementary Materials

The following are available online at https://www.mdpi.com/article/10.3390/agronomy11061038/s1, Table S1: Tested wavelength ranges of (i) preliminary permutational multivariate analysis of variance (PERMANOVA) for the effects of cultivar, time, salinity, and their interactions on reflectance profiles of pomegranate leaves, and (ii) preliminary PLSR-models used for the prediction of maximum quantum efficiency of photosystem II (PSII) photochemistry (Fv/Fm), PSII operating efficiency in light conditions (ΦPSII), photochemical quenching (qP), non-photochemical quenching (qN), relative water content (RWC) and leaf osmotic potential (Ψπ) from spectra of pomegranate leaves, Figure S1: Mean (solid), fifth, and 95th percentile (dotted) of standardized coefficients (black) and VIP values (blue) by wavelengths for PLSR-models predicting (a) (Fv/Fm), (b) PSII operating efficiency in light conditions (ΦPSII), (c) photo-chemical quenching (qP), (d) non photochemical quenching (qN), (e) relative water content (RWC) and (f) leaf osmotic potential (Ψπ).

Author Contributions

Conceptualization, A.C., L.C., G.L., C.N., E.P.; methodology, A.C., L.C., E.P.; formal analysis, A.C., L.C.; data curation, A.C., L.C.; writing—original draft preparation, A.C., L.C., E.P.; writing—review and editing, G.L., C.N.; supervision, C.N., E.P.; funding acquisition, L.C., G.L., C.N., E.P. All authors have read and agreed to the published version of the manuscript.

Funding

This research was funded by the FONDAZIONE CASSA DI RISPARMIO DI PISTOIA E PESCIA, Bando n. 7/2020 Giovani@Ricerca_Scientifica—Rapid and effective hyperspectral assessment of plant health, wellbeing and quality in the nursery.

Institutional Review Board Statement

Not applicable.

Informed Consent Statement

Not applicable.

Data Availability Statement

Data sharing not applicable.

Acknowledgments

Authors gratefully acknowledge Francesco Pitta for helping with data organization and Andrea Parrini for supervising experimental facilities.

Conflicts of Interest

The authors declare no conflict of interest. The funders had no role in the design of the study; in the collection, analyses, or interpretation of data; in the writing of the manuscript, or in the decision to publish the results.

References

  1. Isayenkov, S.V.; Maathuis, F.J.M. Plant salinity stress: Many unanswered questions remain. Front. Plant Sci. 2019, 10, 80. [Google Scholar] [CrossRef] [Green Version]
  2. Olesen, J.E.; Trnka, M.; Kersebaum, K.C.; Skjelvåg, A.O.; Seguin, B.; Peltonen-Sainio, P.; Rossi, F.; Kozyra, J.; Micale, F. Impacts and adaptation of European crop production systems to climate change. Eur. J. Agron. 2011, 34, 96–112. [Google Scholar] [CrossRef]
  3. Olsson, L.; Barbosa, S.; Bhadwal, S.; Cowie, A.; Delusca, D.; Flores-Renteira, D.; Hermans, K.; Jobbagy, E.; Kurz, W.; Li, D.; et al. Land Degradation. In Climate Change and Land: An IPCC Special Report on Climate Change, Desertification, Land degradation, Sustainable Land Management, Food Security, and Greenhouse Gas Fluxes in Terrestrial Ecosystems; Shukla, P.R., Skea, J., Calvo Buendia, E., Masson-Delmotte, V., Pörtner, H.-H., Roberts, D.C., Zhai, P., Slade, R., Connors, S., van Diemen, R., et al., Eds.; IPCC: Geneva, Switzerland, 2019; pp. 345–436. [Google Scholar]
  4. Shrivastava, P.; Kumar, R. Soil salinity: A serious environmental issue and plant growth promoting bacteria as one of the tools for its alleviation. Saudi. J. Biol. Sci. 2015, 22, 123–131. [Google Scholar] [CrossRef] [Green Version]
  5. Cotrozzi, L.; Couture, J.J. Hyperspectral assessment of plant responses to multi-stress environments: Prospects for managing protected agrosystems. Plants People Planet 2020, 2, 244–258. [Google Scholar] [CrossRef]
  6. Cotrozzi, L.; Townsend, P.A.; Pellegrini, E.; Nali, C.; Couture, J.J. Reflectance spectroscopy: A novel approach to better understand and monitor the impact of air pollution on Mediterranean plants. Environ. Sci. Pollut. Res. 2018, 25, 8249–8267. [Google Scholar] [CrossRef] [PubMed]
  7. Gamon, J.A.; Field, C.B.; Goulden, M.L.; Griffin, K.L.; Hartley, A.E.; Joel, G.; Peñuelas, J.; Valentini, R. Relationships between NDVI, canopy structure, and photosynthesis in three Californian vegetation types. Ecol. Appl. 1995, 5, 28–41. [Google Scholar] [CrossRef] [Green Version]
  8. Gamon, J.; Serrano, L.; Surfus, J. The photochemical reflectance index: An optical indicator of photosynthetic radiation use efficiency across species, functional types, and nutrient levels. Oecologia 1997, 112, 492–501. [Google Scholar] [CrossRef]
  9. Serbin, S.P.; Singh, A.; Desai, A.R.; Dubois, S.G.; Jablosnki, A.D.; Kingdon, C.C.; Kruger, E.L.; Townsend, P.A. Remotely estimating photosynthetic capacity, and its response to temperature, in vegetation canopies using imaging spectroscopy. Remote Sens. Environ. 2015, 167, 78–87. [Google Scholar] [CrossRef]
  10. Couture, J.J.; Singh, A.; Rubert-Nason, K.F.; Serbin, S.P.; Lindroth, R.L.; Townsend, P.A. Spectroscopic determination of ecologically relevant plant secondary metabolites. Methods Ecol. Evol. 2016, 7, 1402–1412. [Google Scholar] [CrossRef] [Green Version]
  11. Cotrozzi, L.; Couture, J.J.; Cavender-Bares, J.; Kingdon, C.C.; Fallon, B.; Pilz, G.; Pellegrini, E.; Nali, C.; Townsend, P.A. Using foliar spectral properties to assess the effects of drought on plant water potential. Tree Physiol. 2017, 37, 1582–1591. [Google Scholar] [CrossRef]
  12. Ely, K.S.; Burnett, A.C.; Lieberman-Cribbin, W.; Serbin, S.P.; Rogers, A. Spectroscopy can predict key leaf traits associated with source-sink balance and carbon-nitrogen status. J. Exp. Bot. 2019, 70, 1789–1799. [Google Scholar] [CrossRef] [PubMed] [Green Version]
  13. Marchica, A.; Loré, S.; Cotrozzi, L.; Lorenzini, G.; Nali, C.; Pellegrini, E.; Remorini, D. Early detection of sage (Salvia officinalis L.) responses to ozone using reflectance spectroscopy. Plants 2019, 8, 346. [Google Scholar] [CrossRef] [PubMed] [Green Version]
  14. Wold, S.; Sjӧstrӧm, M.; Eriksson, L. PLS-regression: A basic tool of chemometrics. Chemom. Intell. Lab. Syst. 2001, 58, 109–130. [Google Scholar] [CrossRef]
  15. Mahlein, A.-K.; Kuska, M.T.; Behmann, J.; Polder, G.; Walter, A. Hyperspectral sensors and imaging technologies in phytopathology: State of the art. Annu. Rev. Phytopathol. 2018, 56, 535–558. [Google Scholar] [CrossRef]
  16. Weber, V.S.; Araus, J.L.; Cairns, J.E.; Sanchez, C.; Melchinger, A.E.; Orsini, E. Prediction of grain yield using reflectance spectra of canopy and leaves in maize plants grown under different water regimes. Field Crops Res. 2012, 128, 82–90. [Google Scholar] [CrossRef]
  17. Araus, J.L.; Cairns, J.E. Field high-throughput phenotyping: The new crop breeding frontier. Trends Plant Sci. 2014, 19, 52–61. [Google Scholar] [CrossRef] [PubMed]
  18. Couture, J.J.; Singh, A.; Charkowski, A.O.; Groves, R.L.; Gray, S.M.; Bethke, P.C.; Townsend, P.A. Integrating spectroscopy with potato disease management. Plant Dis. 2018, 102, 2233–2240. [Google Scholar] [CrossRef] [Green Version]
  19. Moghimi, A.; Yang, C.; Miller, M.E.; Kianian, S.F.; Marchetto, P.M. A novel approach to assess salt stress tolerance in wheat using hyperspectral imaging. Front. Plant Sci. 2018, 9, 1182. [Google Scholar] [CrossRef] [PubMed]
  20. El-Hendawy, S.; Al-Suhaibani, N.; Alotaibi, M. Estimating growth and photosynthetic properties of wheat grown in simulated saline field conditions using hyperspectral reflectance sensing and multivariate analysis. Sci. Rep. 2019, 9, 16473. [Google Scholar] [CrossRef]
  21. Zhu, K.; Sun, Z.; Zhao, F.; Yang, T.; Tian, Z.; Lai, J.; Zhu, W.; Long, B. Relating hyperspectral vegetation indices with soil salinity at different depths for the diagnosis of winter wheat salt stress. Remote Sens. 2021, 13, 250. [Google Scholar] [CrossRef]
  22. Das, B.; Manohara, K.K.; Mahajan, G.R.; Sahoo, R.N. Spectroscopy based novel spectral indices, PCA- and PLSR-coupled machine learning models for salinity stress phenotyping of rice. Spectrochim. Acta A Mol. Biomol. Spectrosc. 2020, 229, 117983. [Google Scholar] [CrossRef]
  23. Elsayed, S.; Darwish, W.K. Hyperspectral remote sensing to assess the water status, biomass, and yield of maize cultivars under salinity and water stress. Bragantia 2017, 76, 62–72. [Google Scholar] [CrossRef] [Green Version]
  24. Tirado, S.B.; St Dennis, S.; Enders, T.A.; Springer, N.M. Utilizing top-down hyperspectral imaging for monitoring genotype and growth conditions in maize. BioRxiv 2020. [Google Scholar] [CrossRef]
  25. Krezhova, D.; Kirova, E. Hyperspectral remote sensing of the impact of environmental stress on nitrogen fixing soybean plants (Glycine max L.). In Proceedings of the 5th International Conference on Recent Advances in Space Technologies, Istanbul, Turkey, 9–11 June 2011; pp. 172–177. [Google Scholar]
  26. Peñuelas, J.; Isla, R.; Filella, I.; Araus, J.L. Visible and near-infrared reflectance assessment of salinity effects on barley. Crop Sci. 1997, 37, 198–202. [Google Scholar] [CrossRef]
  27. Brugger, A.; Behmann, J.; Paulus, S.; Luigs, H.G.; Kuska, M.T.; Schramowski, P.; Kersting, K.; Steiner, U.; Mahlein, A.K. Extending hyperspectral imaging for plant phenotyping to the UV-range. Remote Sens. 2019, 11, 1401. [Google Scholar] [CrossRef] [Green Version]
  28. Hamzeh, S.; Naseri, A.; Alavi Panah, S.; Mojaradi, B.; Bartholomeus, H.M.; Clevers, J.G.; Behzad, M. Estimating salinity stress in sugarcane fields with spaceborne hyperspectral vegetation indices. Int. J. Appl. Earth Obs. Geoinf. 2013, 21, 282–290. [Google Scholar] [CrossRef]
  29. Lara, M.Á.; Diezma, B.; Lleó, L.; Roger, J.M.; Garrido, Y.; Gil, M.I.; Ruiz-Altisent, M. Hyperspectral imaging to evaluate the effect of irrigation water salinity in lettuce. Appl. Sci. 2016, 6, 412. [Google Scholar] [CrossRef]
  30. Hernandez, E.I.; Melendez-Pastor, I.; Navarro-Pedreno, J.; Gomez, I. Spectral indices for the detection of salinity effects in melon plants. Sci. agric. 2014, 71, 324–330. [Google Scholar] [CrossRef] [Green Version]
  31. Feng, X.; Zhan, Y.; Wang, Q.; Yang, X.; Yu, C.; Wang, H.; Tang, Z.; Jiang, D.; Peng, C.; He, Y. Hyperspectral imaging combined with machine learning as a tool to obtain high-throughput plant salt-stress phenotyping. Plant J. 2020, 101, 1448–1461. [Google Scholar] [CrossRef]
  32. Li, G.; Wanb, S.; Zhoua, J.; Yanga, Z.; Qina, P. Leaf chlorophyll fluorescence, hyperspectral reflectance, pigments content, malondialdehyde and proline accumulation responses of castor bean (Ricinus communis L.) seedlings to salt stress levels. Ind. Crops Prod. 2010, 31, 13–19. [Google Scholar] [CrossRef]
  33. Singh, B.; Singh, J.P.; Kaur, A.; Singh, N. Phenolic compounds as beneficial phytochemicals in pomegranate (Punica granatum L.) peel: A review. Food Chem. 2018, 261, 75–86. [Google Scholar] [CrossRef]
  34. Naeini, M.R.; Khoshgoftarmanesh, A.H.; Fallahi, E. Partitioning of chlorine, sodium, and potassium and shoot growth of three pomegranate cultivars under different levels of salinity. J. Plant Nut. 2006, 29, 1835–1843. [Google Scholar] [CrossRef]
  35. Grieve, C.M.; Grattan, S.R.; Maas, E.V. Plant salt tolerance. In ASCE Manual and Reports on Engineering Practice No. 71 Agricultural Salinity Assessment and Management, 2nd ed.; Wallender, W.W., Tanji, K.K., Eds.; ASCE: Reston, VA, USA, 2012; Volume 13, pp. 405–459. [Google Scholar]
  36. Calzone, A.; Podda, A.; Lorenzini, G.; Maserti, B.E.; Carrari, E.; Deleanu, E.; Hoshika, Y.; Haworth, M.; Nali, C.; Badea, O.; et al. Cross-talk between physiological and biochemical adjustments by Punica granatum cv. Dente di cavallo mitigates the effects of salinity and ozone stress. Sci. Tot. Environ. 2019, 656, 589–597. [Google Scholar] [CrossRef] [PubMed]
  37. Karimi, H.R.; Hasanpour, Z. Effects of salinity and water stress on growth and macro nutrients concentration of pomegranate (Punica granatum L.). J. Plant Nutr. 2014, 37, 1937–1951. [Google Scholar] [CrossRef]
  38. Calzone, A.; Cotrozzi, L.; Pellegrini, E.; Guidi, L.; Lorenzini, G.; Nali, C. Differential response strategies of pomegranate cultivars lead to similar tolerance to increasing salt concentrations. Sci. Hortic. 2020, 271, 109441. [Google Scholar] [CrossRef]
  39. Khodabakhshian, R.; Emadi, B.; Khojastehpour, M.; Golzarian, M.R. Determining quality and maturity of pomegranates using multispectral imaging. J. Saudi Soc. Agric. Sci. 2017, 16, 322–331. [Google Scholar] [CrossRef] [Green Version]
  40. Khodabakhshian, R.; Emadi, B.; Khojastehpour, M.; Golzarian, M.R.; Sazgarnia, A. Non-destructive evaluation of maturity and quality parameters of pomegranate fruit by visible/near infrared spectroscopy. Int. J. Food Prop. 2017, 20, 41–52. [Google Scholar] [CrossRef] [Green Version]
  41. Khodabakhshian, R.; Emadi, B.; Khojastehpour, M.; Golzarian, M.R. A comparative study of reflectance and transmittance modes of Vis/NIR spectroscopy used in determining internal quality attributes in pomegranate fruits. J. Food Meas. Charact. 2019, 13, 3130–3139. [Google Scholar] [CrossRef]
  42. Arendse, E.; Fawole, O.A.; Magwaza, L.S.; Nieuwoudt, H.; Opara, U.L. Comparing the analytical performance of near and mid infrared spectrometers for evaluating pomegranate juice quality. LWT 2018, 91, 180–190. [Google Scholar] [CrossRef]
  43. Calzone, A.; Cotrozzi, L.; Remorini, D.; Lorenzini, G.; Nali, C.; Pellegrini, E. Oxidative stress assessment by a spectroscopic approach in pomegranate plants under a gradient of ozone concentrations. Environ. Exp. Bot. 2021, 182, 10439. [Google Scholar] [CrossRef]
  44. Munns, R. Comparative physiology of salt and water stress. Plant Cell Environ. 2002, 28, 239–250. [Google Scholar] [CrossRef]
  45. Mujeeb-Kazi, A.; Munns, R.; Rasheed, A.; Ogbonnaya, F.; Ali, N.; Hollington, P. Breeding strategies for structuring salinity tolerance in wheat. Adv. Agron. 2019, 155, 121–187. [Google Scholar] [CrossRef]
  46. Cotrozzi, L.; Remorini, D.; Pellegrini, E.; Guidi, L.; Nali, C.; Lorenzini, G.; Massai, R.; Landi, M. Living in a Mediterranean city in 2050: Broadleaf or evergreen ‘citizens’? Environ. Sci. Pollut. Res. 2018, 25, 8161–8173. [Google Scholar] [CrossRef] [PubMed]
  47. Stanton, K.M.; Micklebart, M.V. Maintenance of water uptake and reduced water loss contribute to water stress tolerance of Spiraea alba Du Roi and Spiraea tomentosa L. Hortic. Res. 2014, 1, 14033. [Google Scholar] [CrossRef] [PubMed] [Green Version]
  48. Anderson, M.J. A new method for non-parametric multivariate analysis of variance. Austral Ecol. 2001, 26, 32–46. [Google Scholar] [CrossRef]
  49. Dixon, P. VEGAN, a package of R functions for community ecology. J. Veg. Sci. 2003, 14, 927–930. [Google Scholar] [CrossRef]
  50. Chevallier, S.; Bertand, D.; Kohler, A.; Courcoux, P. Application of PLS-DA in multivariate image analysis. J. Chemom. 2006, 20, 221–229. [Google Scholar] [CrossRef]
  51. Kuhn, M. Building predictive models in R using the caret package. J. Stat. Softw. 2008, 28, 5. [Google Scholar] [CrossRef] [Green Version]
  52. Chen, S.; Hong, X.; Harris, C.J.; Sharkey, P.M. Sparse modeling using orthogonal forest regression with PRESS statistic and regularization. IEEE Trans. Syst. Man Cybern. B 2004, 34, 898–911. [Google Scholar] [CrossRef]
  53. Chong, I.G.; Jun, C.H. Performance of some variable selection methods when multicollinearity is present. Chemom. Intell. Lab. Syst. 2005, 28, 103–112. [Google Scholar] [CrossRef]
  54. Yendrek, C.R.; Tomaz, T.; Montes, C.M.; Cao, Y.; Morse, A.M.; Brown, P.J.; McIntyre, L.M.; Leakey, A.D.B.; Ainsworth, E.A. High-throughput phenotyping maize leaf physiological and biochemical traits using hyperspectral reflectance. Plant Physiol. 2017, 173, 614–626. [Google Scholar] [CrossRef]
  55. Gao, B.C. NDWI-a normalized difference water index for remote sensing of vegetation liquid from space. Remote Sens. Environ. 1996, 58, 257–266. [Google Scholar] [CrossRef]
  56. Merzlyak, M.N.; Gitelson, A.A.; Chivkunova, O.B.; Rakitin, V.Y. Non-destructive optical detection of pigment changes during leaf senescence and fruit ripening. Physiol. Plant. 1999, 106, 135–141. [Google Scholar] [CrossRef] [Green Version]
  57. Gitelson, A.A.; Merzlyak, M.N. Quantitative estimation of chlorophyll a using reflectance spectra—Experiments with autumn chestnut and maple leaves. J. Photochem. Photobiol. 1994, 22, 247–252. [Google Scholar] [CrossRef]
  58. Gitelson, A.A.; Zur, Y.; Chivkunova, O.B.; Merzlyak, M.N. Assessing carotenoid content in plant leaves with reflectance spectroscopy. Photochem. Photobiol. 2002, 75, 272–281. [Google Scholar] [CrossRef]
  59. Cavender-Bares, J.; Ackerly, D.D.; Hobbie, S.E.; Townsend, P.A. Evolutionary legacy effects on ecosystems: Biogeographic origins, plant traits, and implications for management in the era of global change. Annu. Rev. Ecol. Evol. Syst. 2016, 47, 433–462. [Google Scholar] [CrossRef] [Green Version]
  60. Campos-Medina, V.A.; Cotrozzi, L.; Stuart, J.J.; Couture, J.J. Spectral characterization of wheat functional trait responses to Hessian fly: Mechanisms for trait-based resistance. PLoS ONE 2019, 14, e0219431. [Google Scholar] [CrossRef] [Green Version]
  61. Begum, H.; Alam, M.S.; Feng, Y.; Koua, P.; Ashrafuzzman, M.; Shrestha, A. Genetic dissecation of bread wheat diversity and identification of adaptive loci in response to elevated tropospheric ozone. Plant Cell Environ. 2020, 43, 2650–2665. [Google Scholar] [CrossRef]
  62. Maxwell, K.; Johnson, G.N. Chlorophyll fluorescence—A guide. J. Exp. Bot. 2000, 51, 659–668. [Google Scholar] [CrossRef] [PubMed]
  63. Murchie, E.H.; Lawson, T. Chlorophyll fluorescence analysis: A guide to good practice and understanding some new applications. J. Exp. Bot. 2013, 64, 3983–3998. [Google Scholar] [CrossRef] [PubMed] [Green Version]
  64. Peñuelas, J.; Garbulsky, M.F.; Filella, I. Photochemical reflectance index (PRI) and remote sensing of plant CO2 uptake. New Phytol. 2011, 191, 596–599. [Google Scholar] [CrossRef] [PubMed]
  65. Zarco-Tejada, P.J.; Miller, J.R.; Mohammed, G.H.; Noland, T.L.; Sampson, P.H. Estimation of chlorophyll fluorescence under natural illumination from hyperspectral data. Int. J. Appl. Earth Obs. 2001, 3, 321–327. [Google Scholar] [CrossRef] [Green Version]
  66. Jia, M.; Li, D.; Colombo, R.; Whang, Y.; Whang, X.; Cheng, T.; Zhu, Y.; Yao, X.; Xu, C.; Ouer, G.; et al. Quantifying chlorophyll fluorescence parameters from hyperspectral reflectance at the leaf scale under various nitrogen treatment regimes in winter wheat. Remote Sens. 2019, 11, 2838. [Google Scholar] [CrossRef] [Green Version]
  67. Serbin, S.P.; Dillaway, D.N.; Kruger, E.L.; Townsend, P.A. Leaf optical properties reflect variation in photosynthetic metabolism and its sensitivity to temperature. J. Exp. Bot. 2012, 63, 489–502. [Google Scholar] [CrossRef] [Green Version]
  68. Heckmann, D.; Schlüter, U.; Weber, A.P.M. Machine learning techniques for predicting crop photosynthetic capacity from leaf reflectance spectra. Mol. Plant. 2017, 10, 878–890. [Google Scholar] [CrossRef] [Green Version]
  69. Fu, P.; Meacham-Hensold, K.; Guan, K.; Wu, J.; Bernacchi, C. Estimating photosynthetic traits from reflectance spectra: A synthesis of spectral indices, numerical inversion, and partial least square regression. Plant Cell Environ. 2020, 43, 1241–1258. [Google Scholar] [CrossRef] [PubMed]
  70. Smith, K.L.; Steven, M.D.; Colls, J.J. Use of hyperspectral derivative tools in red-edge region to identify plant stress response to gas leaks. Remote Sens. Environ. 2004, 92, 207–212. [Google Scholar] [CrossRef]
  71. Zarco-Tejada, P.J.; Miller, J.R.; Morales, A.; Berjón, A.; Agüera, J. Hyperspectral indices and model simulation for chlorophyll estimation in open-canopy tree crops. Remote Sens. Environ. 2004, 9, 463–476. [Google Scholar] [CrossRef]
  72. Mutanga, O.; Skidmore, A.K. Red edge shift and biochemical content in grass canopies. ISPRS J. Photogram. Remote Sens. 2007, 62, 34–42. [Google Scholar] [CrossRef]
  73. Merzlyak, M.N.; Gitelson, A.A.; Chivkunova, O.B.; Solovchenko, A.E.; Pogosyan, S.I. Application of reflectance spectroscopy for analysis of higher plant pigments. Russ. J. Plant Physiol. 2003, 50, 704–710. [Google Scholar] [CrossRef]
  74. Jones, H.G. Monitoring plant and soil water status: Established and novel methods revisited and their relevance to studies of drought tolerance. J. Exp. Bot. 2007, 58, 119–130. [Google Scholar] [CrossRef] [Green Version]
  75. Curran, P.J. Remote sensing of foliar chemistry. Remote Sens. Environ. 1989, 30, 271–278. [Google Scholar] [CrossRef]
  76. Shetty, N.; Gislum, R. Quantification of fructan concentration in grasses using NIR spectroscopy and PLSR. Field Crops Res. 2011, 120, 31–37. [Google Scholar] [CrossRef]
  77. Rubert-Nason, K.F.; Holeski, L.M.; Couture, J.J.; Gusse, A.; Undersander, D.J.; Lindroth, R.L. Rapid phytochemical analysis of birch (Betula) and poplar (Populus) foliage by near-infrared reflectance spectroscopy. Anal. Bioanal. Chem. 2013, 405, 1333–1344. [Google Scholar] [CrossRef] [PubMed]
  78. Asner, G.P.; Martin, R.E. Spectroscopic remote sensing of non-structural carbohydrates in forest canopies. Remote Sens. 2015, 7, 3526–3547. [Google Scholar] [CrossRef] [Green Version]
  79. Ramirez, J.A.; Posada, J.M.; Handa, I.T.; Hoch, G.; Vohland, M.; Messier, C.; Reu, B. Near-infrared spectroscopy (NIRS) predicts non-structural carbohydrate concentrations in different tissue types of a broad range of tree species. Methods Ecol. Evol. 2015, 6, 1018–1025. [Google Scholar] [CrossRef]
  80. Olmo, A.; García-Sánchez, F.; Simon, I.; Lidon, V.; Alfosea-Simon, M.; Cámara-Zapata, J.M.; Nicolás, J.J.; Simón-Grao, S. Characterization of the ecophysiological responses of three pomegranate cultivars to salinity. Photosynthetica 2019, 4, 1015–1024. [Google Scholar] [CrossRef] [Green Version]
  81. Borzouei, A.; Kafi, M.; Akbari-Ghogdi, E.; Mousavi-Shalmani, M. Long term salinity stress in relation to lipid peroxidation, super oxide dismutase activity and proline content of salt-sensitive and salt-tolerant wheat cultivars. Chil. J. Agric. Res. 2012, 72, 476–482. [Google Scholar] [CrossRef]
  82. Liu, C.; Zhao, X.; Yan, J.; Yuan, Z.; Gu, M. Effects of salt stress on growth, photosynthesis, and mineral nutrients of 18 pomegranate (Punica granatum) cultivars. Agronomy 2020, 10, 27. [Google Scholar] [CrossRef] [Green Version]
  83. Ben-Abdallah, S.; Aung, B.; Amyot, L. Salt stress (NaCl) affects plant growth and branch pathways of carotenoid and flavonoid biosyntheses in Solanum nigrum. Acta Physiol. Plant. 2016, 38, 72. [Google Scholar] [CrossRef]
Figure 1. Scores (mean ± standard error) for the first and second principal components from principal coordinates analysis (PCoA) of reflectance data (400–2400 nm) collected from leaves of pomegranate, highlighting the ability of spectroscopy to detects the effects of (a) cultivar (circle: Parfianka; square: Wonderful), (b) time (circle: 0 days from beginning of treatment, FBT; square: 14 days FBT; up-pointing triangle: 21 days FBT; down-pointing triangle: 28 days FBT; diamond: 35 days FBT), (c) salinity (white: 0 mM NaCl; black: 100 mM NaCl), and (d) time × salinity (see panels (b,c) for symbols).
Agronomy 11 01038 g001
Figure 2. Observed versus predicted cross-validated values of (a) maximum quantum efficiency of photosystem II (PSII) photochemistry (Fv/Fm), (b) PSII operating efficiency in light conditions (ΦPSII), (c) photochemical quenching (qP), (d) non photochemical quenching (qN), (e) relative water content (RWC), and (f) leaf osmotic potential (Ψπ). Error bars for predicted values represent the standard deviation generated from the 500 simulated models. Dashed line is 1:1 relationship.
Agronomy 11 01038 g002
Figure 3. Variation in (a) PSII operating efficiency in light conditions (ΦPSII), (b) photochemical quenching (qP), (c) non-photochemical quenching (qN), and (d) photochemical reflectance index (sPRI, scaled) in pomegranate cultivars Parfianka (circle, left) and Wonderful (square, right) subjected to two salinity treatments for 35 days by applying 200 mL of 0 (white) or 100 mM NaCl solutions (black). Measurements were carried out at 0, 14, 21, 28, and 35 days from the beginning of treatment. Data are shown as mean ± standard deviation. Since three-way repeated measures ANOVA reveals a significant cultivar × time × salinity interaction on ΦPSII, qP, qN, and sPRI (see Table 4), according to Tukey’s post hoc test, different letters indicate significant differences among means (p ≤ 0.05).
Agronomy 11 01038 g003
Figure 4. Variation in (a) leaf water potential (Ψw), (b) leaf osmotic potential (Ψπ), and (c) normalized difference water index (NDWI) in pomegranate cultivars Parfianka (circle, left) and Wonderful (square, right) subjected to two salinity treatments for 35 days by applying 200 mL of 0 (white) or 100 mM NaCl solutions (black). Measurements were carried out at 0, 14, 21, 28, and 35 days from the beginning of treatment. Data are shown as mean ± standard deviation. Since three-way repeated measures ANOVA reveals a significant cultivar × time × salinity interaction on Ψw and Ψπ (see Table 4), according to Tukey’s post hoc test, different letters indicate significant differences among means (p ≤ 0.05).
Agronomy 11 01038 g004
Figure 5. Variation in (a) malondialdehyde (MDA), (b) oxygen radical absorption capacity (ORAC), (c) chlorophyll index (CI), and (d) carotenoid reflectance index (CRI) in pomegranate cultivars Parfianka (circle, left) and Wonderful (square, right) subjected to two salinity treatments for 35 days by applying 200 mL of 0 (white) or 100 mM NaCl solutions (black). Measurements were carried out at 0, 14, 21, 28, and 35 days from the beginning of treatment. Data are shown as mean ± standard deviation. Since three-way repeated measures ANOVA reveals a significant cultivar × time × salinity interaction on MDA, ORAC, and CI (see Table 4), according to Tukey’s post hoc test, different letters indicate significant differences among means (p ≤ 0.05). Abbreviations: DW, dry weight; TE, Trolox equivalents.
Agronomy 11 01038 g005
Table 1. F values and p levels (***: p ≤ 0.001, ns: p > 0.05) of three-way permutational analysis of variance (PERMANOVA) for the effects of cultivar, time, salinity and their interactions on full range (400–2400 nm) reflectance profiles of pomegranate leaves. df represents the degrees of freedom. p level of the cultivar × time × salinity interaction is ns (italicized) because equal to 0.07 (marginally significant).
EffectdfFp
Cultivar115.24***
Time411.22***
Salinity123.74***
Cultivar × time40.26ns
Cultivar × salinity10.83ns
Time × salinity46.36***
Cultivar × time × salinity41.88ns
Table 2. Number of components (Comp), accuracy and Kappa for calibration (Cal) and validation (Val) data generated via partial least squares discriminant analysis (PLS-DA), using 500 random permutations of the data with 80% used for Cal and 20% used for Val for the classification of the cultivar, time, salinity, and time × salinity conditions from spectra of pomegranate leaves (400–2400 nm). Data are shown as mean ± standard deviation.
EffectCompCalVal
AccuracyKappaAccuracyKappa
Cultivar391.00 ± 0.001.00 ± 0.000.89 ± 0.050.79 ± 0.11
Time260.86 ± 0.020.83 ± 0.020.66 ± 0.070.58 ± 0.09
Salinity440.90 ± 0.020.81 ± 0.040.79 ± 0.070.58 ± 0.15
Time × salinity600.83 ± 0.020.81 ± 0.030.53 ± 0.080.48 ± 0.08
Table 3. Range of wavelengths, number of components (Comp), model goodness-of-fit (R2), root mean square error (RMSE), and percent RMSE of the data range (%RMSE) for calibration (Cal) and validation (Val) data generated using 500 random permutations of the data with 80% used for Cal and 20% used for Val for the PLSR models predicting maximum quantum efficiency of photosystem II (PSII) photochemistry (Fv/Fm), PSII operating efficiency in light conditions (ΦPSII), photochemical quenching (qP), non-photochemical quenching (qN), relative water content (RWC), and leaf osmotic potential (Ψπ) from spectra of pomegranate leaves. Bias outputs for Cal are not shown, as they were always lower than 0.01. Data are shown as mean ± standard deviation.
ParameterRange
(nm)
CompCalVal
R2RMSE%RMSER2BiasRMSE%RMSE
Fv/Fm400–1200120.94 ± 0.010.01 ± 0.0050.64 ± 0.180.00 ± 0.010.03 ± 0.0113
ΦPSII400–1200110.92 ± 0.010.02 ± 0.0060.61 ± 0.180.00 ± 0.010.04 ± 0.0113
qP400–700130.94 ± 0.010.02 ± 0.0050.68 ± 0.160.00 ± 0.010.04 ± 0.0112
qN400–800120.93 ± 0.010.02 ± 0.0060.68 ± 0.150.00 ± 0.020.05 ± 0.0114
RWC1400–2400130.94 ± 0.012.26 ± 0.1960.71 ± 0.150.05 ± 1.765.00 ± 1.0513
Ψπ1400–2400120.98 ± 0.010.06 ± 0.0130.79 ± 0.130.00 ± 0.060.17 ± 0.049
Table 4. F values and p levels (***: p ≤ 0.001, **: p ≤ 0.01, *: p ≤ 0.05, ns: p > 0.05) of three-way repeated measures analysis of variance (ANOVA) for the effects of cultivar, time, salinity, and their interactions on leaf traits derived from pomegranate spectra by PLSR-models, vegetation spectral indices, and leaf water potential measured using standard procedures. df represents the degrees of freedom. Trait abbreviations: Fv/Fm, maximum quantum efficiency of photosystem II (PSII) photochemistry; ΦPSII, PSII operating efficiency in light conditions; qP, photochemical quenching; qN, non-photochemical quenching; sPRI, photochemical reflectance index (scaled); NDVI, normalized difference vegetation index; sPSRI, plant senescence reflectance index (scaled); Ψw, leaf water potential; Ψπ, leaf osmotic potential; RWC, relative water content; NDWI, normalized difference water index; MDA, malondialdehyde; ORAC, oxygen radical absorption capacity; Phen, total phenols; Ant, total anthocyanins; CI, chlorophyll index; CRI, carotenoid reflectance index.
EffectdfFv/FmΦPSIIqPqNsPRINDVIsPSRIΨwΨπRWCNDWIMDAORACPhenAntCICRI
Cultivar128.04121.1943.9216.942.730.9631.910.0130.453.8457.0428.471.768.19027.0438.48
************ns******ns***ns******ns**ns******
Time411.719.6613.8911.0622.637.520.4749.276.7110.051.5513.644.6415.534.2229.4528.81
******************ns*********ns*****************
Salinity115.778.58136.6113.05574.112.29221.464.5211.05293.1123.020.061.255.792.12
****************ns************ns***nsns*ns
Cultivar × time42.390.694.464.5710.635.982.041.13.970.935.1311.985.820.893.2917.873.36
nsns**********nsns**ns*********ns*****
Cultivar × salinity12.869.9811.95.810.284.270.040.263.133.7246.8913.601.960.758.516
ns******ns*nsnsnsns******nsnsns******
Time × salinity41.327.124.3811.039.960.650.1525.7521.751.161.2712.1819.972.861.955.612.19
ns***********nsns******nsns*******ns***ns
Cultivar × time × salinity41.863.133.313.553.923.712.31.334.632.842.039.726.482.283.433.661.49
ns********nsns***ns******ns***ns
Publisher’s Note: MDPI stays neutral with regard to jurisdictional claims in published maps and institutional affiliations.

