Article

Phosphorus Supply Increases Internode Length and Leaf Characteristics, and Increases Dry Matter Accumulation and Seed Yield in Soybean under Water Deficit

1
The Key Laboratory of Plant Resource Conservation and Germplasm Innovation in Mountainous Region (Ministry of Education), College of Agriculture, Guizhou University, Guiyang 550025, China
2
The UWA Institute of Agriculture, The University of Western Australia, M082, 35 Stirling Highway, Crawley, WA 6009, Australia
3
State Key Laboratory of Grassland Agro-Ecosystems, Institute of Arid Agroecology, School of Life Sciences, Lanzhou University, Lanzhou 730000, China
*
Author to whom correspondence should be addressed.
Agronomy 2021, 11(5), 930; https://doi.org/10.3390/agronomy11050930
Submission received: 7 April 2021 / Revised: 30 April 2021 / Accepted: 4 May 2021 / Published: 8 May 2021

Abstract

:
Phosphorus (P) addition ameliorates the adverse effects of water stress on the seed yield of soybean (Glycine max L.). Previous studies focused on the effect of P on root traits, but little information is available on changes to aboveground traits. In this paper, we show how P addition affects shoot traits and reduces the adverse effects of water stress on the yield. Two soybean genotypes, with contrasting aboveground architectures, were grown in pots to compare the canopy architecture, leaf traits, aboveground dry matter accumulation and yield under two water and three P levels. The addition of P to two soybean genotypes, one with a larger number of branches and greater leaf area on the branches than the other, showed that the increased leaf area distribution on the main stem and branches was associated with increased shoot and root dry weights, which were positively correlated with the number of filled pods, seed number and seed yield and negatively correlated with seed size at maturity under well-watered and cyclic water stress treatments. The leaf P concentration at 65 DAS (flowering stage) and leaf photosynthesis measured shortly after re-watering increased with P addition, while the leaf mass area on the main stem at 65 DAS and maturity and on the branches at maturity increased modestly with P supply and water stress. Evidence is presented that P addition can ameliorate the adverse effects of water stress on yield through increased leaf area, leaf function and aboveground shoot production. We conclude that the increased yields of soybean resulting from increased P and water supplies that were previously shown to be associated with increased root growth and function are mediated through increased shoot growth and function, particularly the greater number of sites for pod production.

1. Introduction

Soybean yield is sensitive to water stress, which can lead to a more than 70% yield loss [1,2,3]. Low soil available phosphorus (P) is the leading nutritional factor limiting seed yield in soybean [4,5]. As drought events are predicted to increase and the non-renewable resource of P is predicted to have limited availability, soybean seed yield will be threatened by both water and P deficits in the future. Thus, revealing the mechanisms related to the adaptation to water and P deficits in soybean will help to improve soybean resilience as adverse conditions increase in frequency and intensity.
Identification of the ideal root ideotype for soil P absorption from low-available P soil, termed topsoil foraging [6], showed the importance of root traits in P uptake. Our recent study showed that P supply at flowering and podding increased root growth, improved daily water use and increased the seed yield of soybean subjected to a water deficit [7]. The high number of adventitious roots with a shallow root growth angle, a high number of crown roots and a high lateral root density facilitates P absorption and improves seed yield under low-available P soil [5,8,9,10,11,12]. He et al. [5] found that higher N and P uptake efficiencies depended on greater adventitious and lateral root densities, which benefited yield performance under water stress. To date, most studies on crop adaptation to water and P deficit have focused on root traits and their roles in P uptake; little is known about the effects of P supply on shoot traits, such as leaf mass area (LMA), which is positively associated with yield [7,13].
Previous studies showed that P supply can ameliorate the adverse effects of drought on yield performance in many crops such as wheat [14], barley [15], soybean [5,7,16,17] and cowpea [18]. In these crops, the improvement in seed yield with P supply under different water deficits was associated with an increase in dry matter accumulation [5,7,16], but there is little information about how the increased P supply affects specific shoot traits when subjected to a water deficit. There are many shoot traits associated with dry matter accumulation such as the leaf photosynthetic rate and leaf area [19]. Both the internode number and length contribute to plant height in soybean [20,21], but which one contributes more to plant height and canopy architecture with P supply under water deficit is not known. Our previous study showed that P application increased the leaf area under both well-watered and water deficit conditions in soybean [7], and P supply has also been shown to increase canopy photosynthesis and chlorophyll content [22]. However, how P supply affects the leaf mass area (LMA) and leaf area distribution on the main stem and branches under water deficit is not known, and its role in dry matter accumulation needs to be verified.
In this study, two soybean genotypes with contrasting canopy architectures were used to (1) investigate the response of leaf photosynthesis, LMA, internode length, shoot and root dry weight, seed yield and yield components to P supply under adequately watered and water deficit conditions, and to (2) determine the shoot traits related to improved shoot dry weight and seed yield.

2. Materials and Methods

A pot experiment was conducted during the soybean growing period in 2015 at the Yuzhong Experiment Station (35°51′ N, 104°07′ E, altitude 1620 m) of Lanzhou University in Yuzhong County, Gansu Province, China. The plants were grown in an open rainout shelter that could be closed when rain threatened. The pots were made from polyvinyl chloride (PVC) tubes that were 1.05 m long and 0.16 m in diameter. Each pot was filled with 18.6 kg of soil substrate (3:1 (v:v) sieved loess soil/vermiculite) that contained 2.0 mg kg−1 of available soil P. The loess soil was obtained from the field near the Yuzhong Experiment Station and is similar to an Entisol [3]. The experiment involved 72 pots (2 genotypes × 2 water stress treatments × 3 P levels × 2 harvest dates × 3 replicates). The three levels of P (0 (P0), 60 (P60) and 120 (P120) mg P kg−1 dry soil) were applied as ammonium dihydrogen phosphate (NH4H2PO4) to the top 0.4 m soil layer to simulate soil P supply in the field. The soil water content (SWC) of each pot at 100% pot capacity (PC) was obtained by watering the soil until free draining and then allowing it to drain for 24 h before weighing.
Based on previous studies [2,3], two soybean genotypes with contrasting canopy architectures, Zhuanghuang 30 (ZH) with a low shoot dry weight (DW) and low branch numbers, and Huangsedadou (HD) with a high shoot DW and high branch numbers, were used for this study. Seeds were soaked in water containing carbendazim (5 g L−1) for 10 min to prevent disease. Two seeds were sown in each pot and thinned to one seedling after germination. Fifteen days after sowing (DAS), when both genotypes had one trifoliate leaf on the main stem and no branches, two water treatments were imposed: (i) well-watered (WW; SWC maintained between 85 and 100% PC), and (ii) cyclic water stress (WS; water withheld until the SWC decreased to 30% PC, then re-watered to 100% PC) [23]; 3 to 5 drought/re-watering cycles were imposed before physiological maturity which was defined as when 95% of the pods were brown [24] at 136–147 DAS. Soil water evaporation was minimized by placing black plastic film on top of each pot.

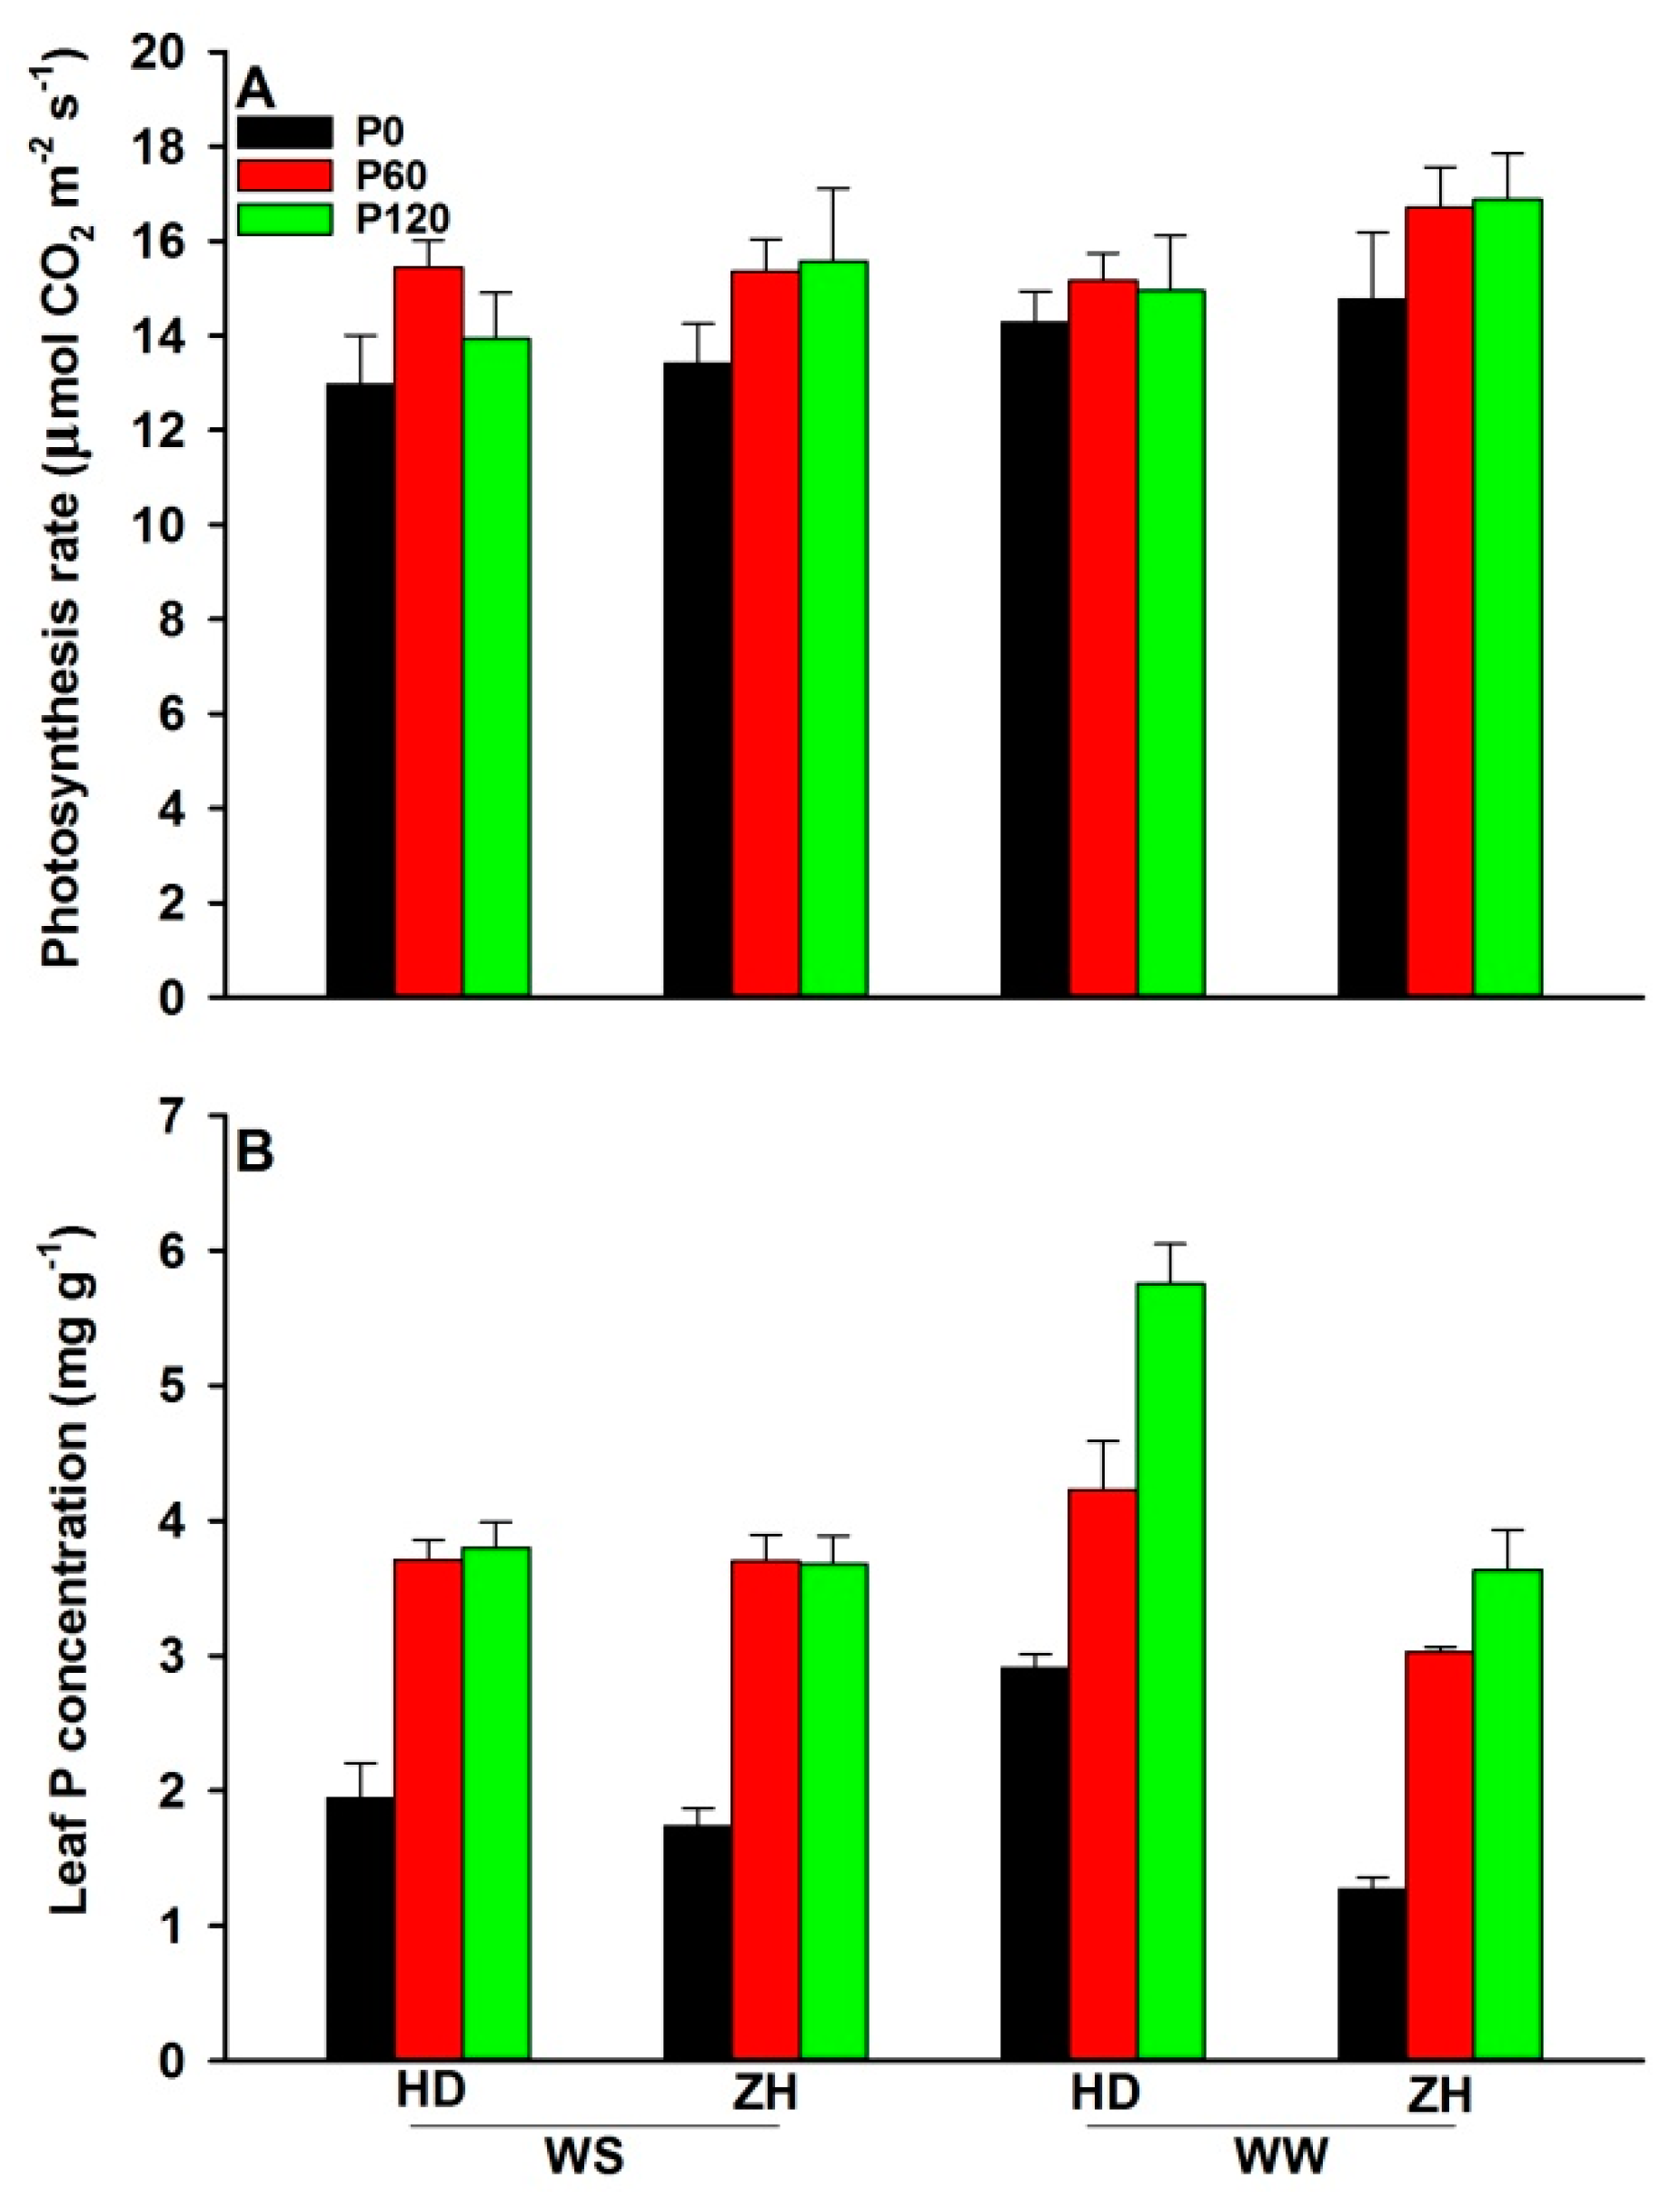
2.1. Leaf Photosynthetic Rate and the Leaf P Concentration Measurements

At 49 days after sowing (DAS), one day before determining the leaf photosynthetic rate (Pn), all pots were watered to 100% PC. A fully expanded leaf on the upper branch of each plant in each pot was used to measure leaf photosynthesis with an LI-6400 portable gas exchange system (LiCor Inc., Lincoln, NE, USA) between 08:00 and 11:30 h BST. The CO2 concentration, temperature, relative humidity (RH) and photosynthetically active radiation in a red-blue LED chamber of the LI-6400 were maintained at 380 μmol mol−1, ~25 °C, ~50% RH and 1200 μmol m−2 s−1, respectively, during measurements.
After measuring Pn, the leaf used to determine Pn was tagged and then collected at 65 DAS (flowering stage), oven dried for 72 h at 80 °C and ground to fine powder by an Ultra Centrifugal Mill (ZM200, Retsch, GmbH, Düsseldorf, Germany) before determining the leaf P concentration. A subsample (about 0.20 g) was digested with hydrogen peroxide and hydrochloric acid. The P concentration was measured using the molybdenum-stibium anti-spectrophotometry method with a UV-1800 Spectrophotometer (Shanghai Meipuda Instrument Co. Ltd., Shanghai, China) that was calibrated regularly against standard P solutions [7].

2.2. Leaf Area and Its Distribution on the Main Stem and Branches

Leaf area was determined at flowering (65 DAS) and maturity (136–147 DAS). At both harvests, shoots were cut at the soil surface; the trifoliate leaves on the main stem were numbered on the basis of their position from the base of the stem and harvested separately, and all leaves, including senescing and dead leaves and those that had fallen from the plant before harvest, were scanned with an Epson 10,000XL (Epson Inc., Long Beach CA, USA) scanner and the area was calculated with the software Image J (http://rsb.info.nih.gov/ij/, accessed on 30 April 2021), before being oven dried for 72 h at 80 °C and weighed. Then, all the leaves on each branch were collected, scanned, dried and weighed as above. The number of branches was recorded from the base to the top. The leaf area of the main stem and the branches was obtained by summing the leaf areas at each leaf position and the leaf area on each branch. The leaf mass area (LMA) or leaf tissue density was calculated by dividing leaf DW by leaf area for leaves separately on branches and the main stem. The stems were oven dried and weighed separately from the leaves.

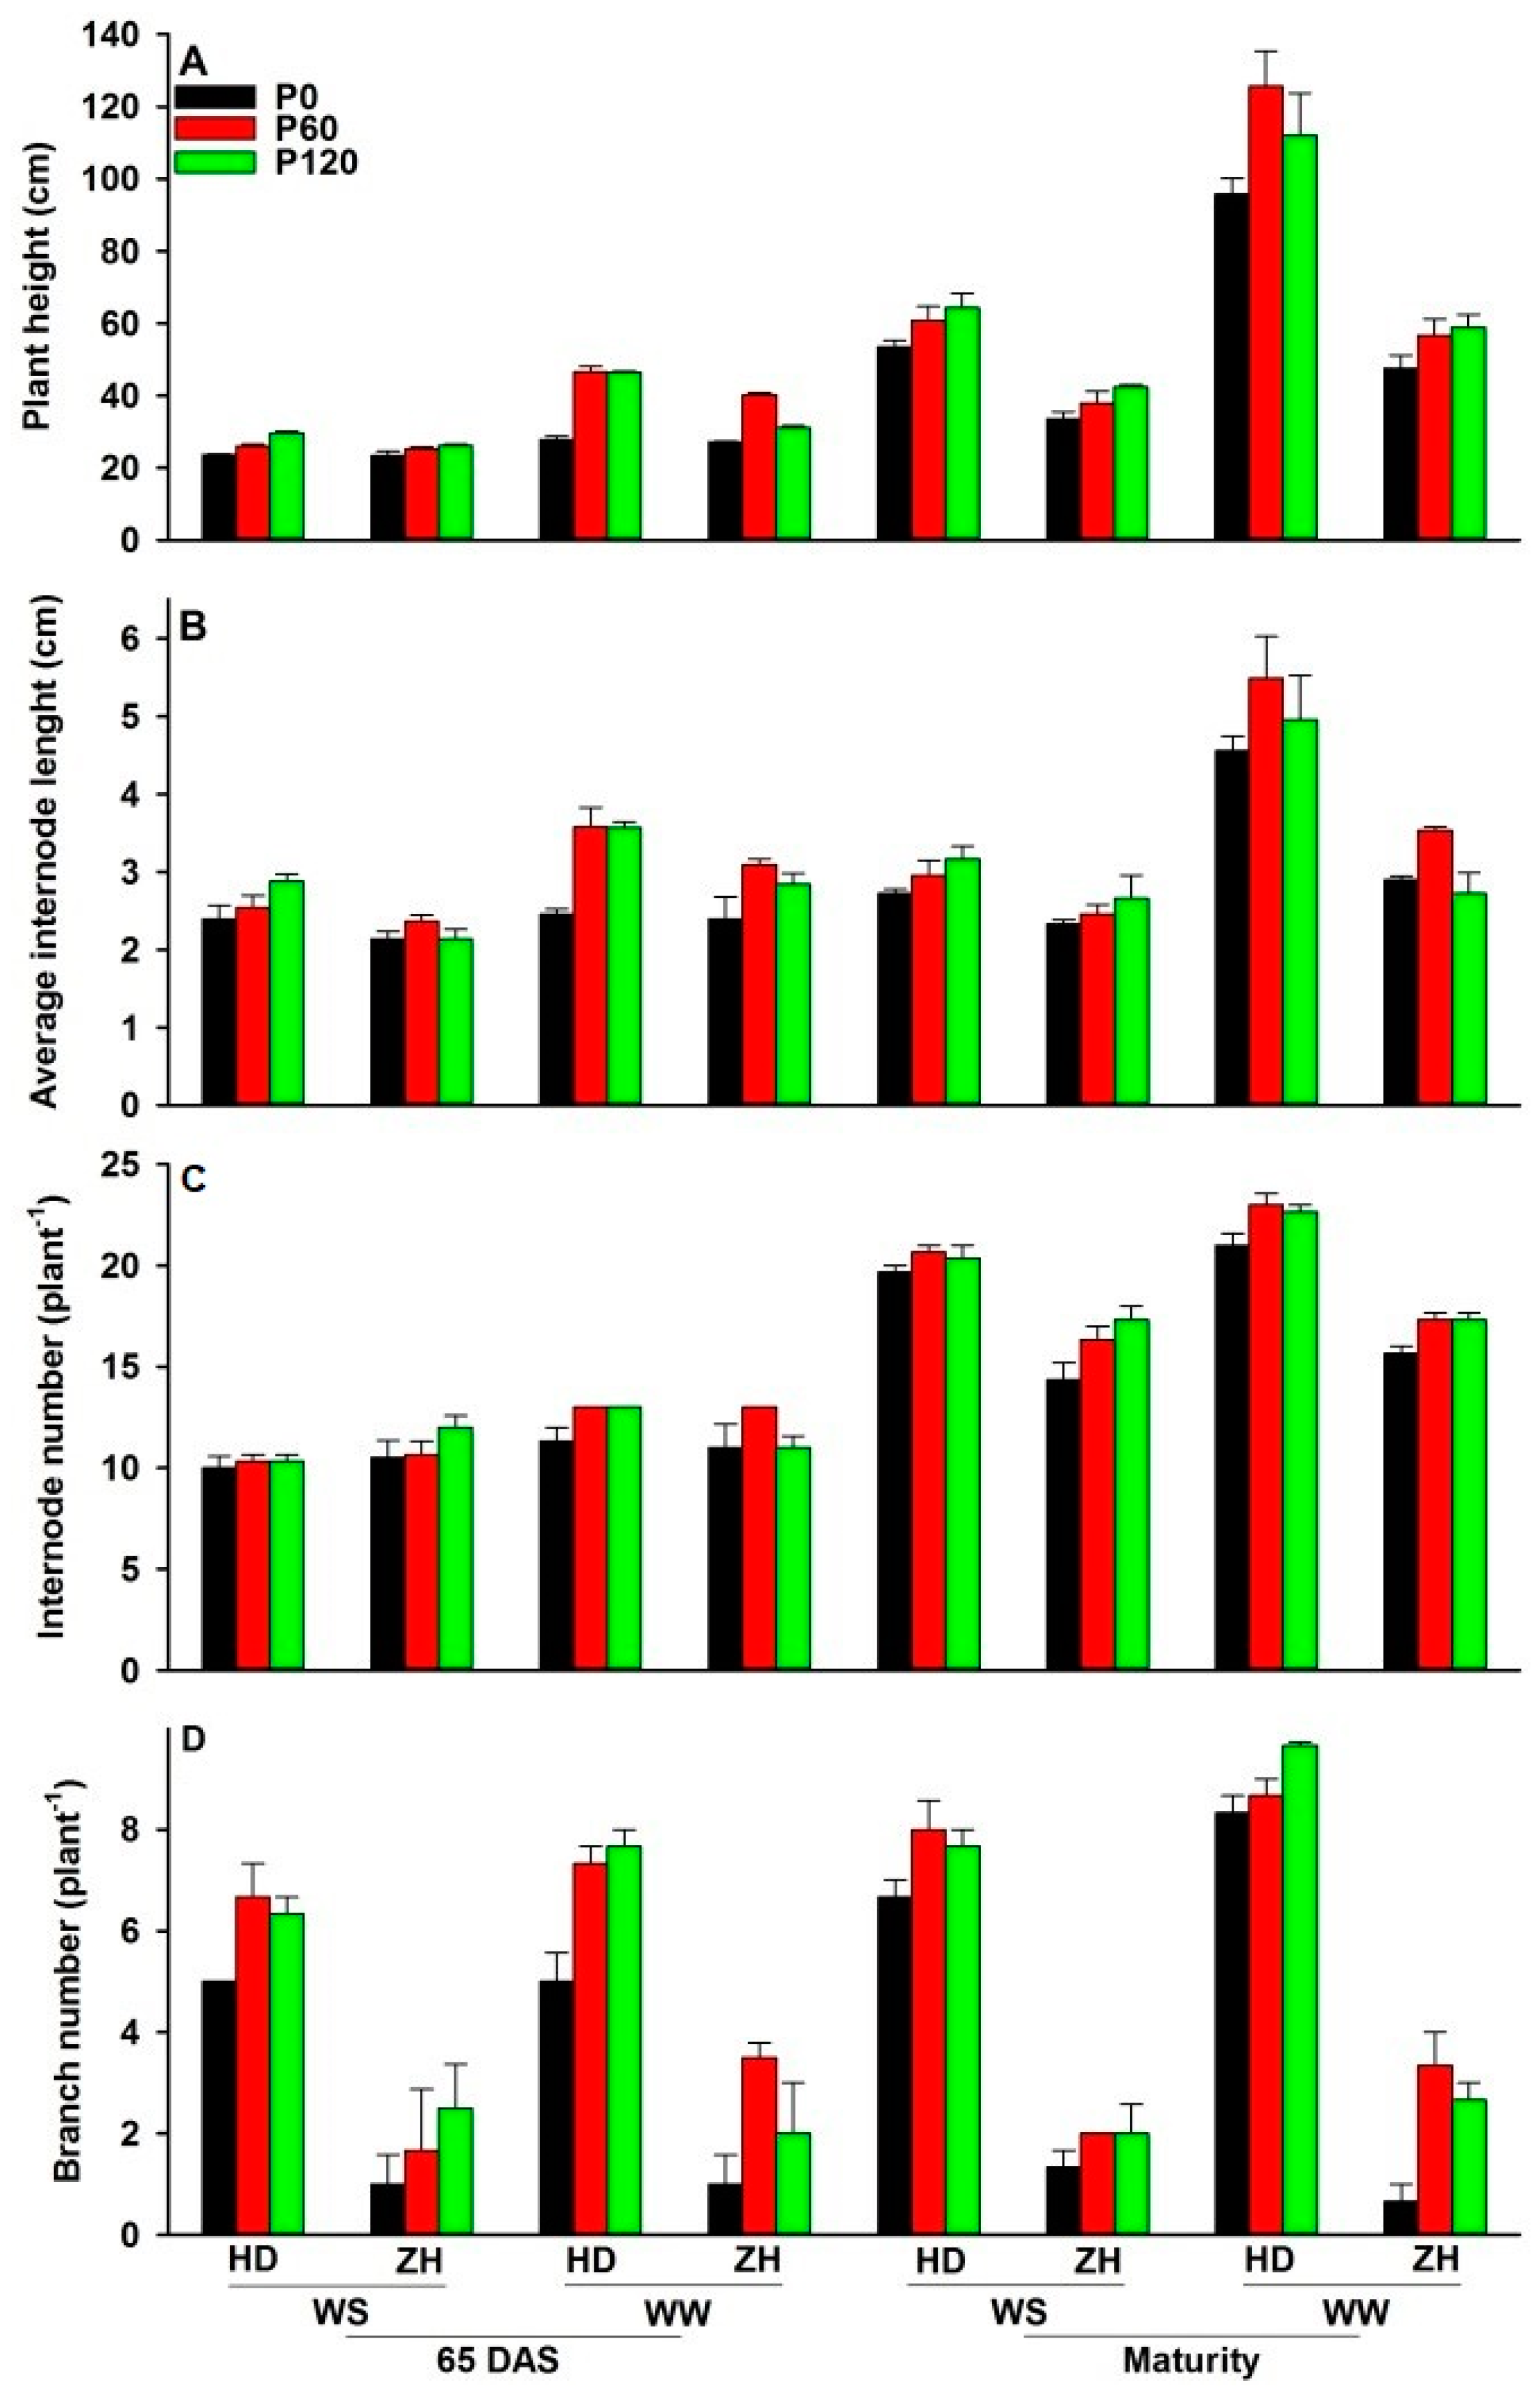
2.3. Plant Height and Internode Number

After removing all the leaves for leaf area determination at 65 DAS and maturity, the internode numbers and lengths were recorded for each main stem, and the numbers of branches were counted. Plant height was obtained by summing the internode lengths on the main stem. The average internode length of the main stem was calculated as plant height/number of main stem internodes.

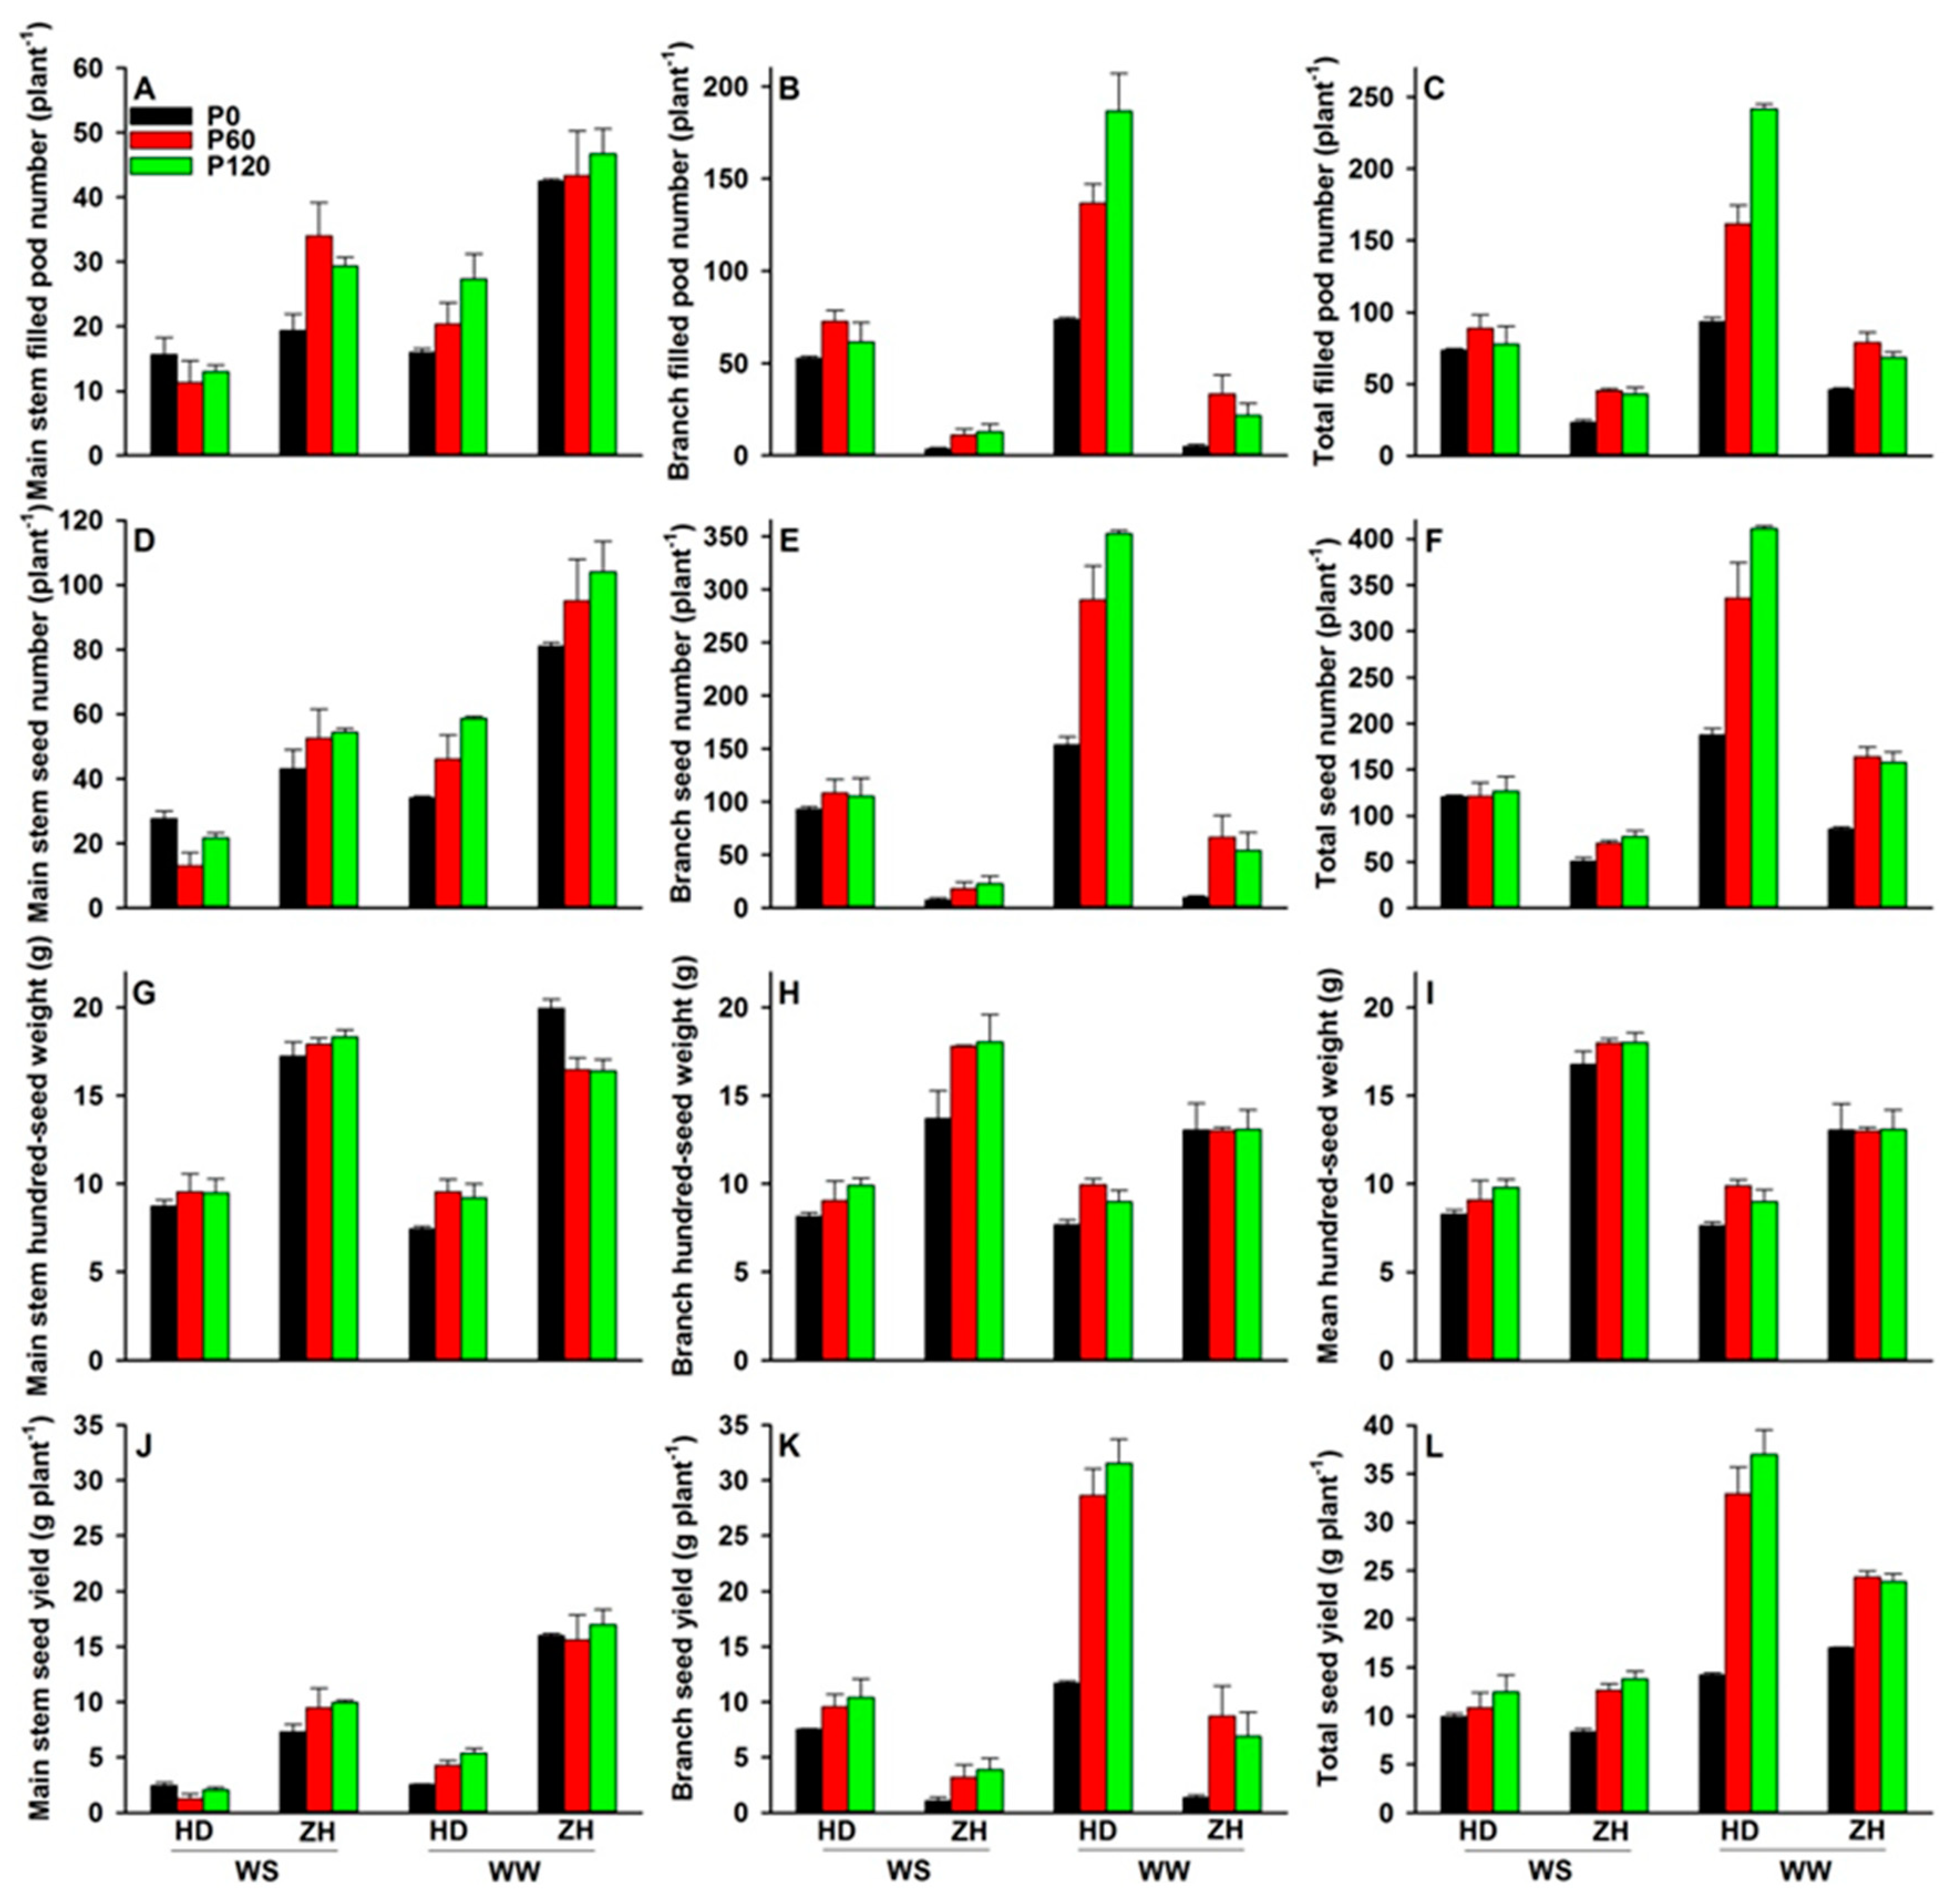
2.4. Shoot and Root Dry Weights, Seed Yield and Yield Components

Shoot DW at 65 DAS was calculated by summing leaf DW and stem DW. Roots were harvested at 65 DAS and maturity by carefully washing away the soil over a 0.2-mm sieve, oven dried for 72 h at 80 °C and weighed.
At physiological maturity, filled pods on the main stem and branches were harvested separately and filled pod numbers were recorded, before being oven dried for 72 h at 80 °C and weighed. After drying, the seeds were removed from the pods by hand, and the number of seeds was counted and weighed to calculate seed yield. The main stem and branch stems from individual plants were combined, oven dried for 72 h at 80 °C and weighed. The 100-seed weight = (seed yield/seed number) × 100. Shoot DW at maturity = pod DW + leaf DW + stem DW.

2.5. Statistics

The data were analyzed by three-way analysis of variance (ANOVA) using the GenStat 19.0 statistical package (VSN International Ltd., Rothamsted, UK). A linear model was used to fit the relationships between shoot DW and root DW with each other at 65 DAS and maturity, and individually with the seed yield, filled pod number, seed number and 100-seed weight of Huangsedadou (HD) and Zhonghuang 30 (ZH) grown at three P levels and two water treatments (well-watered (WW) and cyclic water stress (WS)). All data in the figures are means ± one standard error of the mean (n = 3). The figures were plotted, and the linear regressions were fitted in Sigmaplot 12.0 (Systat Software, Inc., Chicago, IL, USA).

3. Results

3.1. Genotypic Variation

The two genotypes were chosen because previous studies had shown that they varied markedly in height, canopy size, branch number, branch size and yield. The differences were maintained in this study. With adequate water and P, ZH had significantly shorter internodes, a lower leaf area and number of branches, lower shoot and root dry weights (DW) and lower seed yield on the branches by maturity than HD (Figure 1 and Figures 3–5, Table 1). There were significant interactions between the two genotypes and two water treatments for plant height, internode length, leaf area on branches, shoot and root dry weights, seed yield and filled pod number at maturity, while there was significant variation between genotypes in early growth characteristics at 65 DAS and branch characteristics at maturity (Table 1). The different canopy structures (internode number and length, branch structure, leaf area on the main stem and branches) between the two genotypes and their response to P and water treatments showed the role of the canopy architecture in determining yield.

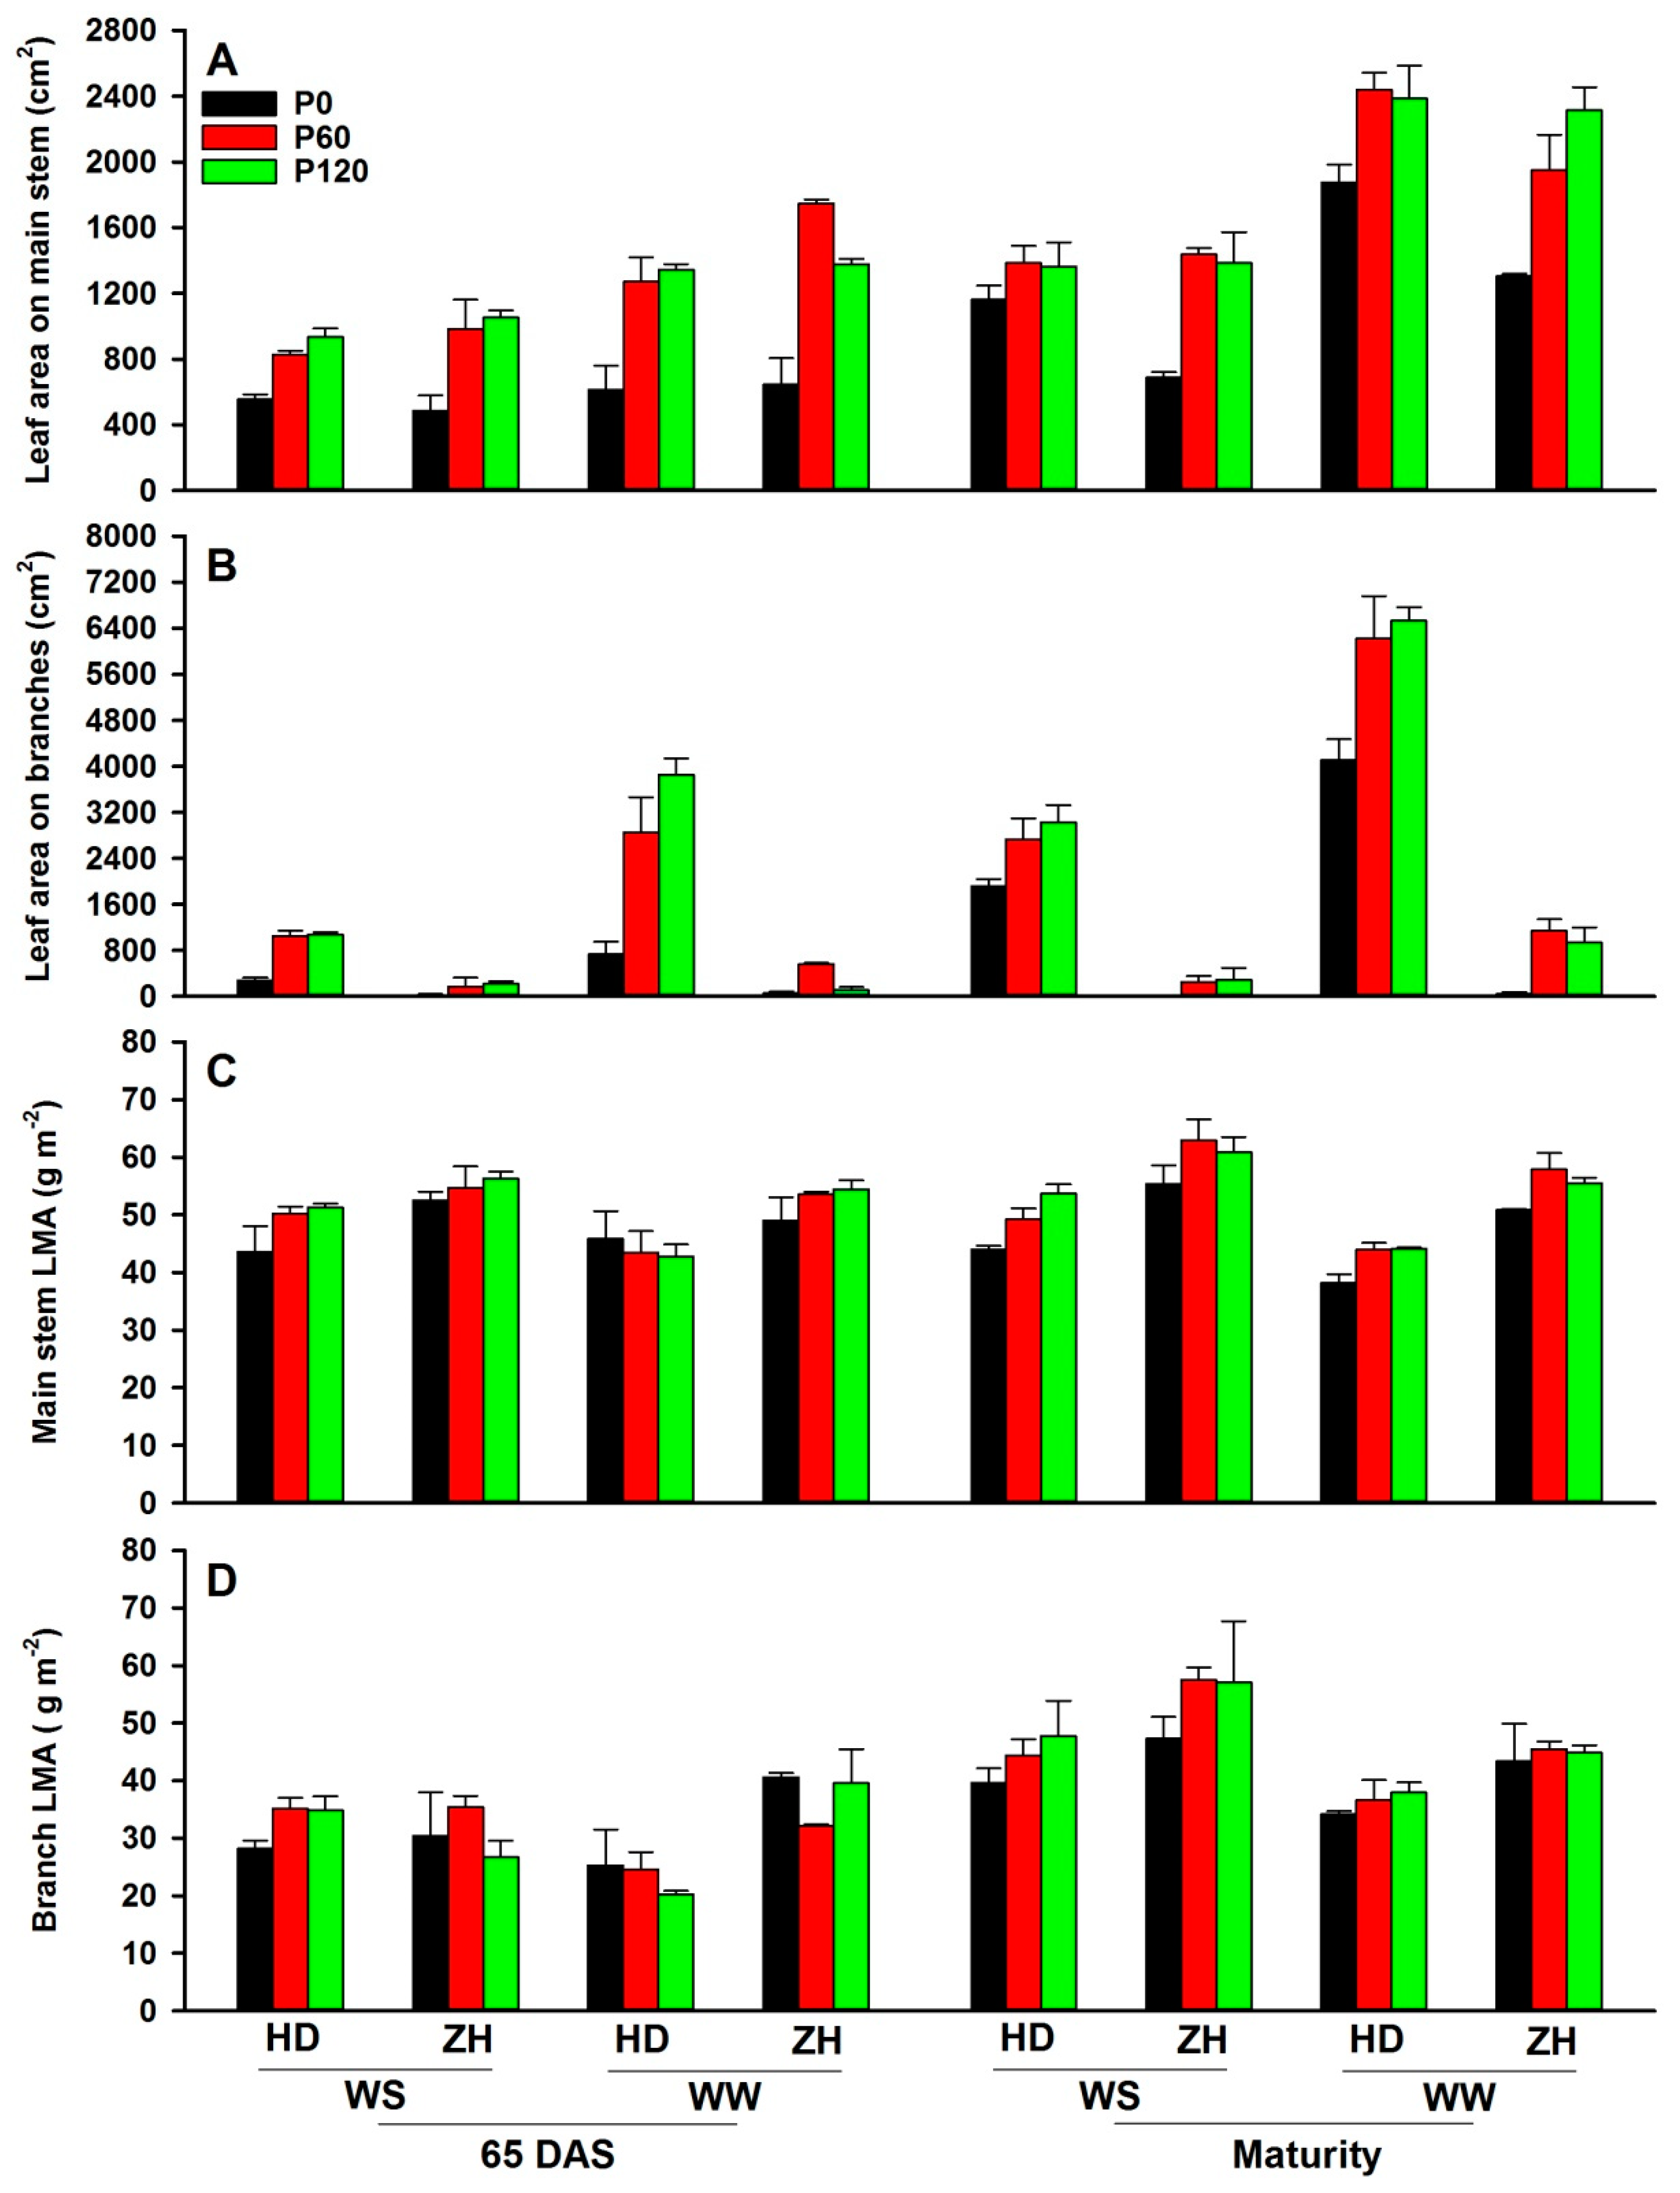
3.2. Response of Leaf Traits to Water and P Supply

The leaf area on the main stem and branches varied between genotypes, water treatments and P levels. Consistent with the number of branches, HD had a significantly greater leaf area on the branches at 65 DAS and maturity than ZH, but differences in LMA were much smaller (Figure 1). Compared to P0, and averaged across genotypes and water treatments, leaf areas on the main stem increased by 109% at P60 and 105% at P120 at 65 DAS, and 43% at P60 and 48% at P120 at maturity; leaf areas on the branches increased by 327% at P60 and 385% at P120 at 65 DAS, and 70% at P60 and 77% at P120 at maturity (Figure 1A,B). The LMA of the main stem and branches across P and water levels was greater (thicker/denser leaves) in ZH than in HD with a significant interaction between genotypes and their response to water and P deficits (Table 1). Combining genotypes and P levels, water stress significantly increased LMA by 24% at 65 DAS and 12% at maturity (Figure 1C,D).
Phosphorus supply increased the leaf area at all leaf positions on the main stem, except for the lowest two leaf positions at 65 DAS (Supplementary Figure S1A–D). At maturity, P deficit (P0) reduced the leaf area on the main stem from leaf positions 5–10 in HD and each leaf position in ZH (Supplementary Figure S1). The leaf area on the branches in both genotypes also decreased significantly under P deficit, as did the branch number at 65 DAS and maturity (Supplementary Figure S2).
The leaf photosynthetic rate (Pn) per unit leaf area was the same in both genotypes the day after re-watering but varied with water treatment and P level with no interactions between these factors (Table 1). Averaged across genotypes and water levels, P supply significantly increased the leaf P concentration and Pn; averaged across genotypes and P levels, Pn after re-watering was reduced by 6.5% in the leaves from the WS treatment (Figure 2). As the LMA increased by 8% in the leaves from the WS treatment compared to the WW treatment, the increase in Pn (per unit leaf area) may be the result of the thicker/denser leaves in the WS treatment.

3.3. Changes in Plant Height, Internode Length and Internode Number with Water and P Supply

Averaged across water and P levels, HD was significantly greater in height and had significantly more and longer internodes, a greater number of branches at 65 DAS and maturity and significantly more internodes by maturity than ZH (Table 1; Figure 3A,B). Both water and P deficits reduced plant height, average internode length and branch number at 65 DAS and maturity (Table 1; Figure 3). Averaged across genotypes and P levels, limited water supply reduced plant height and average internode length, respectively, by 30% and 19% at 65 DAS, and 41% and 33% at maturity. Internode and branch numbers varied with water treatment and P level, but there was no interaction between these treatments (Table 1; Figure 3C,D), indicating that there was no benefit of P supply under water stress. P deficit (P0) had little to no effect on internode length at the base of the main stem (internodes 1–9), but the upper four–five internodes were shorter at 65 DAS and maturity (Supplementary Figure S3).

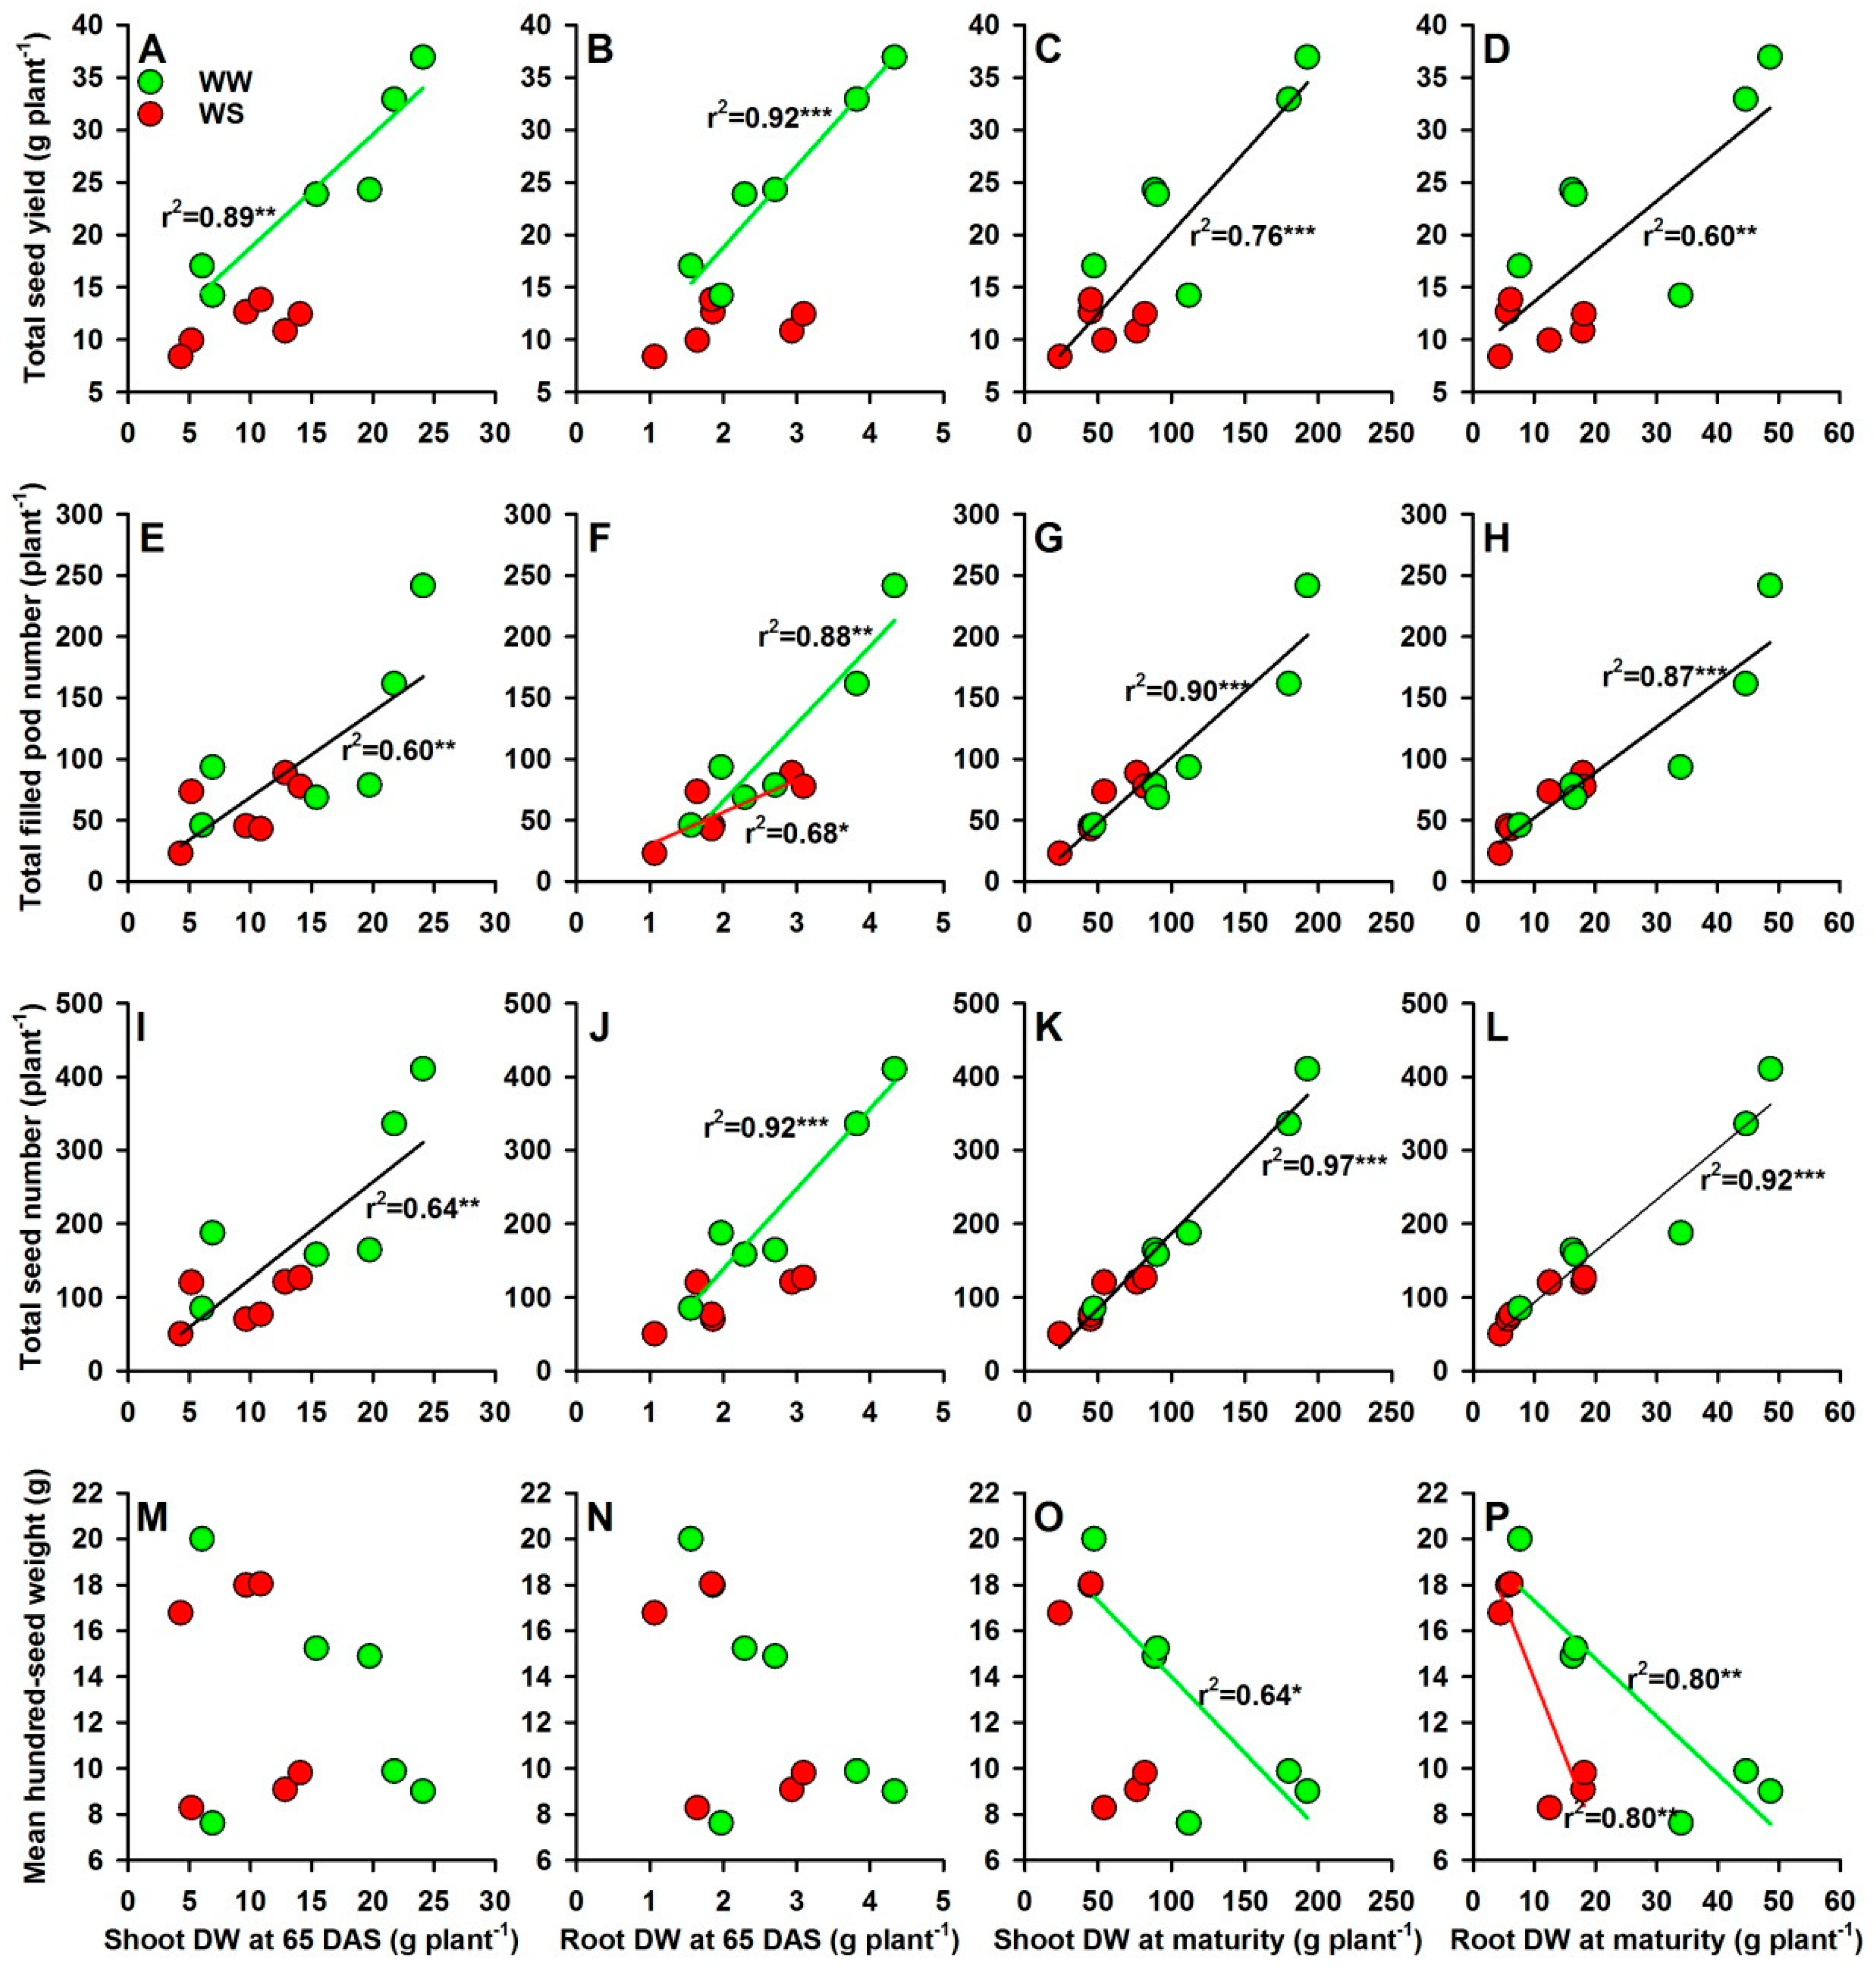
3.4. Dry Matter Accumulation and Yield Performance under Water and P Deficits

Shoot and root DWs varied between genotypes, water treatments and P levels. HD had significantly greater shoot and root DWs than ZH in both WW and WS treatments at 65 DAS and maturity (Figure 4). Averaged across genotypes and water treatments, shoot DW increased with P supply from 6 at P0 to 16 g plant−1 at P60 and P120 at 65 DAS, and from 59 at P0 to 98 at P60 to 102 g plant−1 at P120 at maturity; root DW increased with P supply from 1.6 at P0 to 2.8 at P60 to 2.9 g plant−1 at P120 at 65 DAS, and from 14.6 at P0 to 21.1 at P60 to 22.4 g plant−1 at P120 at maturity (Table 1, Figure 4). The interaction between P level and water treatment on shoot and root DWs was significant at maturity (Table 1). The shoot DW was significantly and positively correlated with root DW at both 65 DAS and maturity (Supplementary Figure S4).
Filled pod numbers, seed number and seed yield varied between genotypes, water treatments and P levels (Table 1, Figure 5). ZH had a significantly lower average seed yield at P60 and P120 under WW than HD (24 vs. 35 g plant−1); ZH had a significantly higher total seed yield at P60 and P120 under WS and at P0 under WW (Figure 5). P application significantly increased the total filled pod number (48 at P0 to 60 at P60 to 67 plant−1 at P120), seed number (85 at P0 to 95 at P60 to 102 plant−1 at P120) and total seed yield (9 at P0 to 12 at P60 to 13 g plant−1 at P120) under water stress (Figure 5), indicating that P can help mitigate the adverse effects of water stress on yield and yield components.
Shoot and root DWs at maturity in both the WW and WS treatments were significantly positively correlated with total seed yield, total filled pod number and total seed number, while they were negatively correlated with mean hundred-seed weight (Figure 6). The root DW at 65 DAS was significantly correlated with total seed yield, total filled pod number and total seed number under WW (Figure 6B,F,J); shoot DW at 65 DAS was significantly positively correlated with total filled pod number and total seed number, while shoot DW was significantly and positively correlated with total seed yield under WW conditions (Figure 6A,E,I).

4. Discussion

Our previous paper showed that P and water supplies affected the root characteristics that were associated with water use and seed yield [5]. Water stress significantly reduced the total root length and root surface area; the converse was true for P addition, and this effect was positively correlated with water use efficiency [7]. As the shoot DW was closely correlated with the root DW, the present study suggests that the root characteristics reported previously are associated with the yield of soybean through their effect on shoot characteristics, particularly leaf area and plant canopy architecture. The genotype HD, compared to the genotype ZH, quickly (by flowering at 65 DAS) developed a high leaf area on the branches under well-watered conditions and high levels of applied P (even under water stress), which persisted to maturity and was associated with the seed yield at maturity. There is clearly a feed-back loop: shoot DW at 65 DAS provided assimilates for root growth; this in turn increased water uptake, resulting in higher leaf area and leaf production.

4.1. Interaction of Water Treatment and P Level on Leaf Traits

Previous studies have shown that plant height was associated the number of nodes and internodes, an increase in one or both of which can increase plant height [25,26]. Other studies have shown that P addition increased the plant height of soybean [27,28], and this increase was associated with an increase in the number of nodes on the main stem [28], but not with an increase in the length of the internodes. In the present study, we showed that plant height was determined by the average internode length on the main stem under water stress at 65 DAS (r2 = 0.40, p < 0.001) and maturity (r2 = 0.63, p < 0.001; data not shown). Moreover, both water treatments, P levels and their interaction had effects on the average internode length, but not on the internode number on the main stem. Thus, the increase in plant height induced by P addition in soybean was associated with the increased length of the internodes, not an increased number of internodes. This is because the node number is more stable than the internode length [20]. However, P supply and water stress did affect the size of the trifoliate leaves and the number of branches, which in turn affected the total number of nodes (Figure 1) and, as leaves are produced at the nodes, also the leaf area (Figure 2) and shoot DW (Figure 4).
Although the leaf area has been shown to increase with P addition in previous studies [27,28,29,30,31], which is also confirmed in this study, the response to P addition of the leaf distribution on the main stem and branches under different water regimes has not been previously reported. Our results show that P supply increased the leaf area not only on the main stem but also on the branches at both 65 DAS and maturity under WW and WS conditions. This increase in the leaf area resulted from an increase in leaf size at each leaf position on the main stem and each branch. Compared to the leaf area at P0, P supply increased the averaged leaf area on the main stem by 107% and 46% and on the branches by 356% and 74% at 65 DAS and maturity, respectively, indicating that the increase in leaf area by the addition of P was mostly on the branches, particularly in HD with its much larger number of branches than ZH. Genetic variation in the leaf area in soybean has been reported previously and in this study [3,5,31] and strongly suggests that the leaf area on branches is the main contributor to the variation in the leaf area in soybean grown under different environment conditions.

4.2. Leaf Traits and Dry Matter Accumulation

We compared the different contributions of the photosynthetic rate (Pn), leaf area and LMA to dry matter accumulation [19] at different levels of water and P supplies. P supply had a highly significant effect on the leaf P concentration and a smaller, but still significant, effect on LMA and leaf photosynthesis. Despite the several cycles of water stress, water supply had no effect on the P concentration in the leaves or the Pn of the leaves (after re-watering), but it did increase LMA (thicker leaf blades and/or denser tissue) [32] that may account for the higher rates of Pn per unit leaf area with P supply. While LMA has been shown to have a negative relationship with the Pn on a leaf mass basis, this relationship was less clear when the Pn was expressed on a leaf area basis [32]. In the present study, we suggest that the high LMA induced by the cyclic water stress and the increased P supply resulted in a small increase in the Pn in leaves, which increased dry matter accumulation. Additionally, high LMA could increase dry matter accumulation by increasing the longevity of the leaves, as reported by Wright et al. [32] and Roucou et al. [19]. Thus, our results suggest that P supply improves dry matter accumulation primarily through increased leaf area on the main stem and branches, and increased leaf Pn to a lesser extent.

4.3. Dry Matter Accumulation and Yield Components

In this study, shoot DW (and root DW) was associated with a larger number of branches and internodes in the WW treatment than in the WS treatment at maturity, which in turn was tightly linked to the filled pod number and seed number, critical components determining the seed yield [5,7]. One possible explanation is that the greater dry matter accumulation and greater number of nodes on the branches when water and P are not limiting provide more sites for flowers and pods [7], which explains why the soybean genotype with more shoot dry matter had a higher yield potential without water or P deficit. P application increased shoot dry matter accumulation under both WW and WS conditions, and shoot DW had a strong positive correlation with total seed yield in both water treatments at maturity (Figure 6C,D), although the correlation at 65 DAS was not significant in the WS treatment at that early developmental stage (Figure 6A,B).

4.4. Shoots and Roots

In this study, we found that the high yield potential genotype HD had a high branch number and a high seed yield on the branches. Moreover, the seed yield was reduced more on the branches than on the main stem when water and P were deficient, indicating that the high yield potential genotype (HD) performed well when water and P were supplied, while the genotype ZH with more seed on the main stem and fewer branches had a low yield potential when water and P were plentiful, but performed better when water and/or P were deficient. These results indicate there is a trade-off between the yield and yield stability which has been observed in other studies [33,34,35]. The low stability in high yield potential genotypes may be associated the low lodging resistance, which in turn is associated with a high branch number and plant height [36]. The differences in seed yield in the two genotypes given the three levels of applied P and two water treatments were associated with the daily water use in the reproductive phase (after flowering), and, in turn, they were significantly and positively associated with the root length and root surface area [7]. In the present study, daily water use and root characteristics were not measured, but root weight at maturity was associated with the shoot weight at maturity (Supplementary Figure S4), which in turn was associated with the seed yield. Therefore, we conclude that the differences in root traits and water use between the two genotypes and among the different treatments contributed to the seed yield through the shoot traits, that is, through canopy structure and size (number of branches and leaf area), shoot weight and the number of sites for pods and seeds. Of particular interest is whether P supply can ameliorate the adverse effects of water stress on yield. The present study confirms that this is the case and is a result of the additional P increasing the leaf area on the branches that contribute to the final seed yield.

5. Conclusions

Two genotypes of soybean were used to show that phosphorus addition can increase the seed yield by increasing the leaf area on the main stem as a result of an increased size, but not number, of leaves and by increasing the leaf area on the branches. The increased leaf area resulted in increased shoot dry weight, more sites for pod production and more assimilates to fill the increased number of pods and seeds. We conclude that root traits and water use characteristics previously shown to benefit yield as a result of P application with and without a water deficit are mediated through these shoot traits, and that applied P can, in part, overcome some of the adverse effects of water shortage in soybean.

Supplementary Materials

The following are available online at https://www.mdpi.com/article/10.3390/agronomy11050930/s1, Figure S1: Leaf area distribution (cm2) on the main stem of (A,C) Huangsedadou (HD) and (B,D) Zhonghuang 30 (ZH) at (A,B) 65 days after sowing and at (C,D) maturity with three levels of applied P [0 (P0), 60 (P60) and 120 (P120) mg P kg−1 dry soil] and two water treatments [well-watered (WW) and cyclic water stressed (WS)]; Figure S2: Leaf area distribution (cm2) per branch on the branches of (A,C) Huangsedadou (HD) and (B,D) Zhonghuang 30 (ZH) at (A,B) 65 days after sowing and at (C,D) maturity with three levels of applied P [0 (P0), 60 (P60) and 120 (P120) mg P kg1 dry soil] and two water treatments [well-watered (WW) and cyclic water stressed (WS)]; Figure S3: Internode length on the main stem at (A,B) 65 days after sowing and at (C,D) maturity of (A,C) Huangsedadou (HD) and (B,D) Zhonghuang 30 (ZH) with three levels of applied P [0 (P0), 60 (P60) and 120 (P120) mg P kg1 dry soil] and two water treatments [well-watered (WW) and cyclic water stressed (WS)]; Figure S4: Relationship between shoot dry weight (DW) and root DW at (A) 65 and (B) maturity in Huangsedadou and Zhonghuang 30 with three levels of applied P [0 (P0), 60 (P60) and 120 (P120) mg P kg1 dry soil] and two water treatments [well-watered (WW, green circles) and cyclic water stressed (WS, red circles].

Author Contributions

Conceptualization, J.H. and F.-M.L.; methodology, Y.-Y.F., N.C.T. and J.H.; formal analysis, J.H.; writing—original draft preparation, Y.-Y.F., J.H., N.C.T. and F.-M.L.; writing—review and editing, J.H., N.C.T., K.H.M.S. and F.-M.L.; supervision, F.-M.L.; funding acquisition, J.H. All authors have read and agreed to the published version of the manuscript.

Funding

This work was funded by the National Natural Science Foundation of China (31860115, 32060427), Guizhou Science and Technology Support Program Project (Qiankehezhicheng (2019) 2399; Qiankehezhicheng (2021) yiban217), the Guizhou Provincial Biology First-Class Subject Construction Project (GNYL (2017) 009) and the University of Western Australia.

Institutional Review Board Statement

Not applicable.

Informed Consent Statement

Not applicable.

Data Availability Statement

The data that support the findings of this study are available in the Supplementary Material of this article.

Conflicts of Interest

The authors declare no conflict of interest.

References

  1. Frederick, J.R.; Camp, C.R.; Bauer, P.J. Drought-stress effects on branch and mainstem seed yield and yield components of determinate soybean. Crop Sci. 2001, 41, 759–763. [Google Scholar] [CrossRef]
  2. He, J.; Du, Y.-L.; Wang, T.; Turner, N.C.; Xi, Y.; Li, F.-M. Old and new cultivars of soya bean (Glycine max L.) subjected to soil drying differ in abscisic acid accumulation, water relations characteristics and yield. J. Agron. Crop Sci. 2015, 202, 372–383. [Google Scholar] [CrossRef]
  3. He, J.; Du, Y.-L.; Wang, T.; Turner, N.C.; Yang, R.-P.; Jin, Y.; Xi, Y.; Zhang, C.; Cui, T.; Fang, X.-W.; et al. Conserved water use improves the yield performance of soybean (Glycine max (L.) Merr.) under drought. Agric. Water Manag. 2017, 179, 236–245. [Google Scholar] [CrossRef]
  4. Wang, X.; Yan, X.; Liao, H. Genetic improvement for phosphorus efficiency in soybean: A radical approach. Ann. Bot. 2010, 106, 215–222. [Google Scholar] [CrossRef]
  5. He, J.; Jin, Y.; Du, Y.-L.; Wang, T.; Turner, N.C.; Yang, R.-P.; Siddique, K.H.M.; Li, F.-M. Genotypic variation in yield, yield components, root orphology and architecture, in soybean in relation to water and phosphorus supply. Front. Plant Sci. 2017, 8, 1499. [Google Scholar] [CrossRef] [Green Version]
  6. Lynch, J.P.; Brown, K.M. Topsoil foraging—An architectural adaptation of plants to low phosphorus availability. Plant Soil 2001, 237, 225–237. [Google Scholar] [CrossRef]
  7. He, J.; Jin, Y.; Turner, N.C.; Chen, Z.; Liu, H.-Y.; Wang, X.-L.; Siddique, K.H.; Li, F.-M. Phosphorus application increases root growth, improves daily water use during the reproductive stage, and increases grain yield in soybean subjected to water shortage. Environ. Exp. Bot. 2019, 166, 103816. [Google Scholar] [CrossRef]
  8. Miller, C.R.; Ochoa, I.; Nielsen, K.L.; Beck, D.; Lynch, J.P. Genetic variation for adventitious rooting in response to low phosphorus availability: Potential utility for phosphorus acquisition from stratified soils. Funct. Plant Biol. 2003, 30, 973–985. [Google Scholar] [CrossRef] [PubMed] [Green Version]
  9. Postma, J.A.; Dathe, A.; Lynch, J.P. The optimal Lateral root branching density for maize depends on nitrogen and phosphorus availability. Plant Physiol. 2014, 166, 590–602. [Google Scholar] [CrossRef] [Green Version]
  10. Jia, X.; Liu, P.; Lynch, J.P. Greater lateral root branching density in maize (Zea mays L.) improves phosphorus acquisition from low phosphorus soil. J. Exp. Bot. 2018, 69, 4961–4970. [Google Scholar] [CrossRef] [Green Version]
  11. Rangarajan, H.; Postma, J.; Lynch, J.P. Co-optimization of axial root phenotypes for nitrogen and phosphorus acquisition in common bean. Ann. Bot. 2018, 122, 485–499. [Google Scholar] [CrossRef]
  12. Sun, B.; Gao, Y.; Lynch, J.P. Large crown root number improves topsoil foraging and phosphorus acquisition. Plant Physiol. 2018, 177, 90–104. [Google Scholar] [CrossRef] [PubMed] [Green Version]
  13. Mori, A.; Fukuda, T.; Vejchasarn, P.; Nestler, J.; Pariasca-Tanaka, J.; Wissuwa, M. The role of root size versus root efficiency in phosphorus acquisition in rice. J. Exp. Bot. 2016, 67, 1179–1189. [Google Scholar] [CrossRef]
  14. Rodríguez, D.; Goudriaan, J.; Oyarzábal, M.; Pomar, M.C. Phosphorus nutrition and water stress tolerance in wheat plants. J. Plant Nutr. 1996, 19, 29–39. [Google Scholar] [CrossRef]
  15. Jones, C.; Jacobsen, J.; Wraith, J. The effects of P fertilization on drought tolerance of malt barley. In Proceedings of the Western Nutrient Management Conference, Salt Lake City, UT, USA, 6–7 March 2003; Volume 5, pp. 88–93. [Google Scholar]
  16. Jin, J.; Wang, G.; Liu, X.; Pan, X.; Herbert, S.J.; Tang, C. Interaction between phosphorus nutrition and drought on grain yield, and assimilation of phosphorus and nitrogen in two soybean cultivars differing in protein concentration in grains. J. Plant Nutr. 2006, 29, 1433–1449. [Google Scholar] [CrossRef]
  17. Namugwanya, M.; Tenywa, J.S.; Otabbong, E.; Mubiru, D.N.; Masamba, T.A. Development of common bean (Phaseolus vulgaris L.) production under low soil phosphorus and drought in Sub-Saharan Africa: A Review. J. Sustain. Dev. 2014, 7, 128. [Google Scholar] [CrossRef]
  18. Jemo, M.; Sulieman, S.; Bekkaoui, F.; Olomide, O.A.K.; Hashem, A.; Allah, E.F.A.; Alqarawi, A.A.; Tran, L.-S.P. Comparative analysis of the combined effects of different water and phosphate levels on growth and biological nitrogen fixation of nine cowpea varieties. Front. Plant Sci. 2017, 8, 2111. [Google Scholar] [CrossRef] [Green Version]
  19. Roucou, A.; Violle, C.; Fort, F.; Roumet, P.; Ecarnot, M.; Vile, D. Shifts in plant functional strategies over the course of wheat domestication. J. Appl. Ecol. 2017, 55, 25–37. [Google Scholar] [CrossRef] [Green Version]
  20. Yan, H.; Wang, B.; Liu, B.Q. Heredity of soybean nodes of main stem and internode length also its correlation with plant height. Soybean Sci. 2010, 29, 942–947. [Google Scholar]
  21. Allen, L.H.; Zhang, L.; Boote, K.J.; Hauser, B.A. Elevated temperature intensity, timing, and duration of exposure affect soybean internode elongation, mainstem node number, and pod number per plant. Crops J. 2018, 6, 148–161. [Google Scholar] [CrossRef]
  22. Wang, X.M.; Zhang, Z.; Shi, G.R. Interaction of phosphorus concentration and soil moisture on photosynthetic traits in soybean plants. Agric. Res. Arid Areas 2010, 28, 143–148. [Google Scholar]
  23. Turner, N.C. Imposing and maintaining soil water deficits in drought studies in pots. Plant Soil 2018, 439, 45–55. [Google Scholar] [CrossRef]
  24. Fehr, W.R.; Caviness, C.E.; Burmood, D.T.; Pennington, J.S. Stage of development descriptions for soybeans, Glycine max (L.) Merrill. Crops Sci. 1971, 11, 929–931. [Google Scholar] [CrossRef]
  25. Chen, L.; Nan, H.; Kong, L.; Yue, L.; Yang, H.; Zhao, Q.; Fang, C.; Li, H.; Cheng, Q.; Lu, S.; et al. Soybean AP1 homologs control flowering time and plant height. J. Integr. Plant Biol. 2020, 62, 1868–1879. [Google Scholar] [CrossRef]
  26. Yang, Q.; Lin, G.; Lv, H.; Wang, C.; Yang, Y.; Liao, H. Environmental and genetic regulation of plant height in soybean. BMC Plant Biol. 2021, 21, 1–15. [Google Scholar] [CrossRef]
  27. Mahamood, J.; Abayomi, Y.A.; Aduloju, M.O. Comparative growth and grain yield responses of soybean genotypes to phosphorus fertilizer application. Afr. J. Biotechnol. 2009, 8, 1030–1036. [Google Scholar]
  28. Singh, S.K.; Reddy, V.R.; Fleisher, D.H.; Timlin, D.J. Phosphorus nutrition affects temperature response of soybean growth and canopy photosynthesis. Front. Plant Sci. 2018, 9, 9. [Google Scholar] [CrossRef]
  29. Gutierrez-Boem, F.H.; Thomas, G.W. Phosphorus nutrition and water deficits in field-grown soybeans. Plant Soil 1998, 207, 87–96. [Google Scholar] [CrossRef]
  30. Jaidee, R.; Polthanee, A.; Saenjan, P. Growth and yield of soybean cultivars as affected by ground water levels and phosphorus rates grown under greenhouse and field conditions. Aust. J. Crop Sci. 2012, 6, 81–92. [Google Scholar]
  31. Zhong, P.; Wu, J.J.; Liu, L.J.; Lin, W.G.; Dong, D.J.; Wang, J.L. Effects of phosphorus deficiency and drought stress on photosynthetic characters in different genotypic soybeans. Soybean Sci. 2009, 28, 806–881. [Google Scholar]
  32. Wright, I.J.; Reich, P.B.; Westoby, M.; Ackerly, D.; Baruch, Z.; Bongers, F.; Cavender-Bares, J.; Chapin, T.; Cornelissen, J.H.C.; Diemer, M.; et al. The worldwide leaf economics spectrum. Nature 2004, 428, 821–827. [Google Scholar] [CrossRef]
  33. Sinebo, W. Trade off between yield increase and yield stability in three decades of barley breeding in a tropical highland environment. Field Crops Res. 2005, 92, 35–52. [Google Scholar] [CrossRef]
  34. Pennacchi, J.P.; Carmo-Silva, E.; Andralojc, P.J.; Lawson, T.; Allen, A.M.; Raines, C.A.; Parry, M.A.J. Stability of wheat grain yields over three field seasons in the UK. Food Energy Secur. 2019, 8, e00147. [Google Scholar] [CrossRef] [Green Version]
  35. Del Moral, L.F.G.; Del Moral, M.B.G.; Molina-Cano, J.L.; Slafer, G.A. Yield stability and development in two- and six-rowed winter barleys under Mediterranean conditions. Field Crops Res. 2003, 81, 109–119. [Google Scholar] [CrossRef]
  36. Zhang, X.C.; Chen, H.; Huang, S.L.; Yin, X.W.; Du, C.Z.; Zhang, J.J. Optimal combination of nitrogen fertilizer and spring soybean varieties in Chongqing. Soybean Sci. 2012, 31, 255–258. [Google Scholar]
Figure 1. (A) Main stem and (B) branch leaf areas, and (C) main stem and (D) branch leaf mass areas (LMAs) at 65 days after sowing (DAS) and at maturity of soybean genotypes Huangsedadou (HD) and Zhonghuang 30 (ZH) with three applied P levels (0 (P0), 60 (P60) and 120 (P120) mg P kg−1 dry soil) and two water treatments (well-watered (WW) and cyclic water stress (WS)). Values are means + one standard error of the mean (n = 3).
Agronomy 11 00930 g001
Figure 2. (A) Leaf photosynthetic rate at 50 days after sowing (DAS) and (B) leaf P concentration at 65 DAS of soybean genotypes Huangsedadou (HD) and Zhonghuang 30 (ZH) with three levels of applied P (0 (P0), 60 (P60) and 120 (P120) mg P kg−1 dry soil) and two water treatments (well-watered (WW) and cyclic water stress (WS)). Note the leaf photosynthetic rate was measured one day after re-watering. Values are means + one standard error of the mean (n = 3).
Agronomy 11 00930 g002
Figure 3. (A) Plant height, (B) average main stem internode length, (C) main stem internode number per plant and (D) branch number per plant at 65 days after sowing (DAS) and at maturity of soybean genotypes Huangsedadou (HD) and Zhonghuang 30 (ZH) with three levels of applied P (0 (P0), 60 (P60) and 120 (P120) mg P kg−1 dry soil) and two water treatments (well-watered (WW) and cyclic water stress (WS)). Values are means + one standard error of the mean (n = 3).
Agronomy 11 00930 g003
Figure 4. Shoot and root dry matter accumulated at (A,C) 65 days after sowing (DAS) and at (B,D) maturity of soybean genotypes Huangsedadou (HD) and Zhonghuang 30 (ZH) with three levels of applied P (0 (P0), 60 (P60) and 120 (P120) mg P kg−1 dry soil) and two water treatments (well-watered (WW) and cyclic water stress (WS)). Values are means + one standard error of the mean (n = 3).
Agronomy 11 00930 g004
Figure 5. Filled pod number per plant, seed number per plant, hundred-seed weight and seed yield per plant at maturity on the main stem (A,D,G,J), branches (B,E,H,K) and both the main stem and branches (C,F,I,L) of soybean genotypes Huangsedadou (HD) and Zhonghuang 30 (ZH) with three levels of applied P (0 (P0), 60 (P60) and 120 (P120) mg P kg−1 dry soil) and two water treatments (well-watered (WW) and cyclic water stress (WS)). Values are means + one standard error of the mean (n = 3).
Agronomy 11 00930 g005
Figure 6. Relationships between total (main stem and branches) seed yield (AD), total filled pod number (EH), total seed number (IL) and mean hundred-seed weight (MP) and shoot dry weight (DW) at 65 days after sowing (DAS) (A,E,I,M), root dry weight at 65 DAS (B,F,J,N), shoot dry weight at maturity (C,G,K,O) and root dry weight at maturity (D,H,L,P) in soybean genotypes Huangsedadou and Zhonghuang 30 with three levels of applied P (0 (P0), 60 (P60) and 120 (P120) mg P kg−1 dry soil) and two water treatments (well-watered (WW, green circles) and cyclic water stress (WS, red circles)). The lines (green, WW; red, WS; black, combined WW and WS when the individual regressions did not differ significantly) give the fitted linear regressions; the correlation coefficients (r2) are given; * p < 0.05, ** p < 0.01, *** p < 0.001.
Agronomy 11 00930 g006
Table 1. Significance of sources of variability for genotypes (G), water treatments (W) and phosphorus levels (P), and their interactions for Huangsedadou (HD) and Zhonghuang 30 (ZH) under two water regimes (well-watered (WW) and cyclic water stress (WS)) and three P levels (0 (P0), 60 (P60) and 120 (P120) mg P kg−1 dry soil). n.s. not significant, * p < 0.05, ** p < 0.01, *** p < 0.001. LSD values at p = 0.05 are in parenthesis.
Source of VariabilityGWPG*WG*PW*PG*W*P
Plant height at 65 DAS (cm)*** (1.8)*** (1.8)*** (2.2)** (2.5)** (3.1)*** (3.1)* (4.3)
Plant height at maturity (cm)*** (6.2)*** (6.2)** (7.6)*** (8.7)n.sn.sn.s
Average internode length at 65 DAS (cm)*** (0.2)*** (0.2)*** (0.2)n.s* (0.3)** (0.3)n.s
Average internode length at maturity (cm)*** (0.3)*** (0.3)* (0.3)*** (0.4)n.s* (0.5)n.s
Internode number at 65 DAS (plant−1)n.s*** (0.3)* (0.4)n.sn.sn.sn.s
Internode number at maturity (plant−1)*** (0.6)*** (0.6)*** (0.8)n.sn.sn.sn.s
Branch numbers at 65 DAS (plant−1)*** (0.8)n.s*** (0.9)n.sn.sn.sn.s
Branch numbers at maturity (plant−1)*** (0.5)*** (0.5)*** (0.6)n.sn.sn.sn.s
Leaf area on main stem at 65 DAS (cm2)* (115)*** (115)*** (141)n.sn.s** (199)n.s
Leaf area on main stem at maturity (cm2)** (159)*** (159)*** (195)n.s* (276)n.sn.s
Leaf area on branches at 65 DAS (cm2)*** (255)*** (255)*** (312)*** (360)*** (441)** (441)** (624)
Leaf area on branches at maturity (cm2)*** (365)*** (365)*** (447)*** (517)* (633)* (633)n.s
LMA on main stem at 65 DAS (g cm−2)*** (3.1)* (3.1)n.sn.sn.sn.sn.s
LMA on main stem at maturity (g cm−2)*** (1.8)*** (1.8)*** (2.2)** (2.5)** (3.1)* (3.1)n.s
LMA on branches at 65 DAS (g cm−2)* (8.0)n.sn.sn.sn.sn.sn.s
LMA on branches at maturity (g cm−2)** (3.2)*** (3.2)* (3.9)n.sn.sn.sn.s
Pn at 50 DAS (μmol CO2 m−2 s−1)n.s* (1.0)** (1.2)n.sn.sn.sn.s
Leaf P concentration at 65 DAS (mg g−1)** (0.5)n.s*** (0.6)** (0.7)n.sn.sn.s
Shoot dry weight at 65 DAS (g plant−1)*** (1.7)*** (1.7)*** (2.1)n.sn.s** (3.0)n.s
Shoot dry weight at maturity (g plant−1)*** (5.1)*** (5.1)*** (6.3)*** (7.8)** (8.8)*** (8.8)* (12.5)
Root dry weight at 65 DAS (g plant−1)*** (0.4)*** (0.4)*** (0.4)n.s* (0.6)n.sn.s
Root dry weight at maturity (g plant−1)*** (2.7)*** (2.7)*** (3.3)*** (3.8)n.s* (4.7)n.s
Filled pod number on main stem (plant−1)*** (4.1)*** (4.1)n.sn.sn.sn.s* (10.2)
Seed number on main stem (plant−1)*** (7.4)*** (7.4)* (9.0)* (10.4)n.sn.sn.s
Hundred-seed weight on main stem (g)*** (0.8)n.sn.sn.s** (1.3)n.s** (1.9)
Seed yield on main stem (g plant−1)*** (0.9)*** (0.9)* (1.1)*** (1.3)n.sn.s* (2.2)
Filled pod number on branches (plant−1)*** (11)*** (11)*** (14)*** (16)** (19)*** (19)** (27)
Seed number on branches (plant−1)*** (16)*** (16)*** (19)*** (22)** (28)*** (28)*** (39)
Hundred-seed weight on branches (g)*** (1.2)* (1.2)n.sn.sn.s* (2.0)* (2.9)
Seed yield on branches (g plant−1)*** (1.7)*** (1.7)*** (2.1)*** (2.4)** (3.0)*** (3.0)** (4.2)
Total filled pod number (plant−1)*** (10)*** (10)*** (12)*** (14)*** (18)*** (18)*** (25)
Total seed number (plant−1)*** (11)*** (11)*** (13)*** (15)*** (19)*** (19)*** (27)
Mean hundred-seed weight (g)*** (0.3)*** (0.3)n.s.* (0.4)*** (0.5)*** (0.5)*** (0.7)
Total seed yield (g plant−1)*** (1.4)*** (1.4)*** (1.7)*** (2.0)** (2.4)*** (2.4)*** (3.4)
Publisher’s Note: MDPI stays neutral with regard to jurisdictional claims in published maps and institutional affiliations.

