Article

Dissection of the Contributing Factors to the Variable Response of Crop Yield to Surface Applied Lime in Australia

1
Commonwealth Scientific Industrial Research Organisation (CSIRO), Underwood Avenue, Floreat, WA 6014, Australia
2
Department of Primary Industries and Regional Development (DPIRD), East Perth, WA 6004, Australia
3
Désiree Futures, York, WA 6302, Australia
*
Author to whom correspondence should be addressed.
Agronomy 2021, 11(5), 829; https://doi.org/10.3390/agronomy11050829
Submission received: 31 March 2021 / Revised: 18 April 2021 / Accepted: 20 April 2021 / Published: 23 April 2021

Abstract

:
Modern agricultural farming systems acidify the soil profile due to application of fertilisers with acidifying properties. In most parts of Australia, lime has been used to improve agricultural soil conditions and restore its productive potential. The observed response of crop yield to applied lime often varies with soil type, acidity profile and seasonal conditions, so it is difficult to specify the expected yield response in a given situation. We conducted a meta-analysis of 86 agricultural field trials from Western Australia (WA), New South Wales (NSW) and Victoria (VIC) where various rates of lime had been applied to the soil surface and crop yield (wheat, barley, canola, lupin or field pea) measured for a number of years after the initial application. Information from the meta-analysis was then paired with output from a crop simulation model, where the water-limited yield potential was estimated for both a neutral and acidified soil profile. The average increase in yield to applied lime across all locations and crops was 12%, but the response ranged from 0 to 185%. A trend was observed, where sites with topsoil pH (CaCl2) < 5 and subsoil pH < 4.5 had the greater benefit to liming. Soil type had little effect on the percentage yield increase. Overall, responses to applied lime were most likely when the yield of the trial site was at 50% of water-limited yield potential (or less), the quantity of lime applied was greater than 2.5 t ha−1 and the time since lime had been applied was greater than three years (with the maximum response occurring from four and sometimes up to eight years after liming). Therefore, soil pH measurements, combined with an assessment of actual yield relative to potential yield, provide the best guide to the response to surface applied lime and this response is likely to take more than four years to be realised.

1. Introduction

The soil in the wheat belt of Western Australia (WA), New South Wales (NSW) and Victoria (VIC) has many attributes that limit crop production. Most soil is derived from ancient granitic rocks and sediments. Weathering and leaching of these rocks have resulted in predominately sandy textured soil with acidic pH, low nutrient levels and low buffering capacity. The agricultural system has magnified these problems. Processes such as the removal of grain, use of legume crops and pastures, application of fertiliser with acidifying properties, and leaching processes have increased the rate of soil acidification, particularly under more intensive crop production [1,2].
Soil acidification in the agricultural and cropping areas affects an estimated 14.25 million hectares (~80%) in WA [3,4], 16–20 million hectares (~50%) in NSW [5] and 3 million hectares (23%) in VIC [6]. The combined impact of surface and subsurface acidity has been estimated to be responsible for an annual loss of income to the grains and agricultural industry of $500–1600 million in WA [7], $378 million in NSW [8] and $470 million in VIC [8].
The basic processes of soil acidification are well understood (e.g., [1,9,10]). Factors which affect acidification rates (product removal, nitrate leaching, acidifying fertilisers) and the response of soil pH to the application of lime (time, rate, lime source and incorporation) have been identified and quantified [11]. Other chemical effects of low pH such as nutrient availability and aluminium toxicity as well as biological effects in the soil have also been studied (e.g., [12]). The agricultural industry has utilised this information on soil acidity to develop management strategies for acidic soil using lime; for example, farmers and consultants in WA aim to keep the soil pH (CaCl2) above 5.5 in topsoil and 4.8 in subsoil [13,14,15].
However, farmers are unsure about the economic value of lime application due to uncertainty of the yield response. In trials, the yield response to surface applied lime has been variable and ranged from a negative response to up to 400% of control yield [11]. This may explain why farmers applied lime at 1-1.5 t ha−1 depending on available income [16], despite much higher rates being recommended by consultants. Farmers need additional, detailed and specific information about the lime requirements for a particular field, the likely yield and pH response to applied lime and insights into the economics of applying lime [17].
Predicting a yield response to applied lime is complex and requires a detailed understanding of plant–soil interactions with regard to soil pH. In Australian trials, research has focused on the relationships between yield and root growth to changes in soil properties such as pH, Al, exchangeable Al, Na/Al and Mn [18,19,20,21,22,23,24,25,26,27]. Unfortunately, many of the relationships between soil properties and crop yield are site specific, so that relationships between applied lime, soil properties and yield developed at one location or region often deteriorated when information from other locations was included in the analysis. Consequently, Edmeades and Ridely [11] suggested that more work was required to predict plant responses to applied lime so as to develop simple diagnostic criteria for farmers.
The aims of this study were to analyse responses in crop yield to surface applied lime from field trials carried out in three agricultural areas of southern Australia with a winter-dominant growing season and, by relating these data to simulations, to quantify the impact of season, rate of lime and time since lime application on the response, and to determine factors which may enable better prediction of yield response to surface applied liming.

2. Materials and Methods

2.1. Overall Approach

We analysed a database of medium- and long-term lime trials from the Department of Agriculture Western Australia (now known as Department of Primary Industries and Regional Development) as well as results from published papers in combination with crop growth simulation to dissect the factors associated with yield responses to lime. The crop model was used as a “bioassay” to quantify the severity of the soil acidity constraint by varying root growth parameters. This enabled the identification of interactions with season and soil type (as characterised by plant-available water capacity). Responses to lime were expressed as the percent increase over the unlimed control and also relative to the water-limited yield potential for that site and season. Responses were then related to the distribution and severity of low pH down the soil profile, the plant-available water capacity (PAWC), the seasonal conditions, time since liming and crop type.

2.2. Historical Trials

The WA lime trial database contained 69 trials, conducted from 1991 to 2012, which have soil information and yield (Table 1). The trials included treatments for lime rates (25) and re-liming (13), types of liming products (15), lime rates and ripping (7), lime and non-wetting agents (3), and lime rates and nutrient rates (6). The trials involved repeated assessments of crop yield following the initial application of lime. Most of these trials (61 of the 69) were used previously in a preliminary yield analysis [28] and some have been reported on an individual trial basis [29]. Additional information for each trial (soil pH profile, rates and climate) were collated for use in this analysis.
Yield responses from the WA trial database were compared with those recorded elsewhere in Australia (Table 1). We sourced data from NSW and Victoria, from trials conducted between 1980 and 2000 which had both yield and soil pH data and had been published in journal papers or at the Australian Agronomy Conference. There were few data from South Australia published in journals or conferences, possibly due to the majority of the soil in that state (57%) being alkaline and calcareous soil types [30]. Our search found limited data in NSW as many results are published in agency and other reports and did not have sufficient information for this analysis.
There were 232 ‘cases’ in the WA trial database from 69 trials, 13 cases from three trials in NSW and 76 cases from 20 trials in Victoria. A ‘case’ was identified where yield of a specific crop in the unlimed and lime treatments were recorded at a trial site in a particular year. The data from the year the lime was applied was not included in the analysis so that there were 176 cases in Western Australia and 10 case in NSW and 71 cases in Victoria (Table 1). A case was defined by trial identification, year of crop, crop type, year lime applied, time since lime had been applied, and soil type. For each case the data extracted may have included (1) yield in the unlimed treatment, (2) yield at other rates of lime (often 0.5, 1, 1.5, 2, 2.5, 3, 4, 5 t ha−1 lime), (3) pH and Al at zero lime treatment, (4) pH and Al in the rates of lime treatment(s) and (5) time since lime was applied. Soil was generally sampled at 0–0.1 m, 0.1–0.2 m, 0.2–0.3 m, and 0.3–0.4 m and these samples were used to measure pH in CaCl2 [31] and CaCl2-extractable total aluminium [32]. A trial may have included a range of treatments such as rates of lime applied, lime type applied, ripping, other products applied (such as gypsum and nutrients) and different crops in the same year. A case may have multiple rates of lime applied over previous years.
The WA trials were generally established on sandy soil with Australian soil classification [38] and WA classification called Mysoil classes (https://www.agric.wa.gov.au/mysoil (accessed on 1 November 2019)) of: Tenosol—Pale sand, coloured sand and sandy earth, Kandosols—gravel and some sandy earth and sandy duplex soil. The NSW soil was Kandosol and Sodsol [40]. The Victorian soil was all classed as duplex soil in the Northcote classification [41], with likely Australian soil classification of Chromosol and Kurosol, and local classification of sandy clay loam.
Soil sampling practices varied between the trials. Soil pH was not measured in every plot in every year and was measured in both the limed and unlimed treatments in 119 of the 176 cases for WA and 41 out of the 81 cases in NSW and VIC. It was measured in neither unlimed nor limed treatments in 20 cases in WA. There were a number of cases from WA where the pH was measured in the limed plot but not in the unlimed plots in the same year (21), so we estimated the pH in the unlimed plot using a neighbouring plot or from the previous year. There were a number of years where the pH was not measured on the limed plot (16 in WA and 48 VIC) as pH was often measured every 2 years and cannot be extrapolated from other plots nor years.
A soil layer was classified as acidic if pH (CaCl2) was less than 5 (for the 0–0.1 m layer) or pH (CaCl2) less than 4.5, in subsurface layers. Using these criteria, soil was allocated to classes, such as topsoil acidic, topsoil and subsoil acidic, subsoil acidic, and non-acidic, based on the unlimed pH and limed pH in the different layers. Limed soil was defined as “ameliorated” if the pH in the topsoil had increased from less than 5 to above 5, and/or the subsoil pH had increased from less than 4.5 to 4.5 or higher. This created profile classifications after liming that were defined by amelioration: topsoil fixed, topsoil and subsoil fixed, subsoil fixed or no change.

2.3. Estimation of Trial Site Yield Potential

The yield potential was estimated at each site in order to express the observed yield (from both unlimed and limed treatments) relative to a water-limited potential. The water-limited yield potential (YP) was estimated using APSIM (v7.6) [42], except where the yield generated by APSIM was significantly lower than the trial yield (which usually occurred in drought years, such as 2000). In these latter types of years, a modified version of French and Schultz [43]) with PAWC set at 150 mm [44] was used to estimate YP. The rainfall from the closest station to the trial sites over the years of the trials was obtained from the patched point dataset of the SILO historical climate database [45] for use in these predictions of YP.
For the WA sites, three soil types were chosen from the APSOIL database [46], https://www.apsim.info/apsim-model/apsoil/ (accessed on 16 May 2016)) with sandy topsoil, contrasting PAWC and distribution of soil moisture down the profile (Table 2). Generic APSOIL profiles were chosen for the NSW sites [47] for loamy sand (Kandosol and Sodsol) and the VIC sites (Birchip Cropping Group) with sandy clay loam and loam soil.
Crop management had not been recorded at most of the trial sites, so the APSIM runs applied a standardised management for the sowing rule, seeding rate and nitrogen fertiliser applications for the different types of crops. For cereals, we used a medium-maturing wheat cultivar (Wyalkatchem), which was sown at 100 plant m−2, and the barley cultivar Bass sown at 100 plants m−2. Sowing of cereals occurred between 1st May and 30th June each year, either once 15 mm of rain had fallen over 10 days, or on the 30th June if this rainfall threshold had not been reached. For the lupin, the cultivar Belara was sown at 100 plants m−2 and for canola, the cultivar Pinnacle was sown at 30 plants m−2. For lupin and canola crops, sowing each year occurred between 25th April and 30th May, either when 15 mm rain had fallen over 10 days, or on 30th May if insufficient rainfall had been received.
The wheat and canola crops were fertilised with 90 kg ha−1 nitrate-N (nitrogen) at sowing, and 90 kg ha−1 urea-N at 40 days after sowing with all other nutrients non-limiting (the latter being an assumption of the APSIM model). These levels of N applications were used to ensure that the water-limited yield would not be affected by the supply of N. While this rate of N is higher than those used commercially, we checked that this did not result in unrealistic reductions in grain yield that can occur with a large crop biomass in dry seasons (due to early crop senescence). Simulations were reset on 1st January each year to remove the effect of carry-over of soil water, N, organic matter and surface residues conditions from the previous years. The previous crop stubble was reset to 2 t ha−1 of wheat stubble with a C:N ratio of 70, soil water was reset to the crop lower limit for wheat, and the mineral nitrogen in the soil profile was reset to 56 kg ha−1 NO3-N and 8 kg ha−1 NH4+-N.

2.4. Analysis of Yield Response

Cases with one or more years since the lime had been applied were used in the analysis of the relationship between yield and time since lime, whereas the yield–lime rate responses curves only used data where there were more than three rates of lime (nil and at least two rates; 102 cases in WA and 51 NSW, VIC, respectively. A range of crops had been used in the trials, sometimes as part of crop rotation, but sometimes grown in the same year. The majority of the data were from wheat, then lupin with less data for canola, barley and field pea (Table 1).
The percentage yield increase from liming (%YILR) was defined by the comparison of the yield obtained from plots with a lime rate greater than zero (YieldLR) to the yield obtained from objects without liming (YieldL0) (Equation (1))
%YILR = (YieldLR − YieldL0)/YieldL0 × 100
The water-limited potential yield (Yw) was used to define the relative yield of the trial data at each lime rate (RYLR, Equation (2)) and the relative yield increase (%RYILR, Equation (3)).
RYLR = YieldLR/Yw
%RYILR = (RYLR − RYL0) × 100
In each case, the greatest increase in yield from liming (%YImax and %RYmax) and the lime rate at which this greatest yield increase occurred (LRmax) were determined. This may not have been the highest rate of lime applied in the trial as the yield increase had plateaued. A site was considered responsive to lime when the % RYI was greater than 5%.
Most of the acidity literature uses only %YI to express yield response to lime, but both %YI and %RYI were used in this paper. Using %RYI to normalise the yield increase for the YP was expected to help to overcome biases in analyses that occur from soil type and seasons, such as when a high %YI occurs with low yield.
A relative yield greater than 0.75 was classed as high yielding, as 0.75 was considered to be near the attainable yield potential [48]. A medium yield was defined as being between 0.51 and 0.75 relative yield and low yield as relative yield less than 0.5.

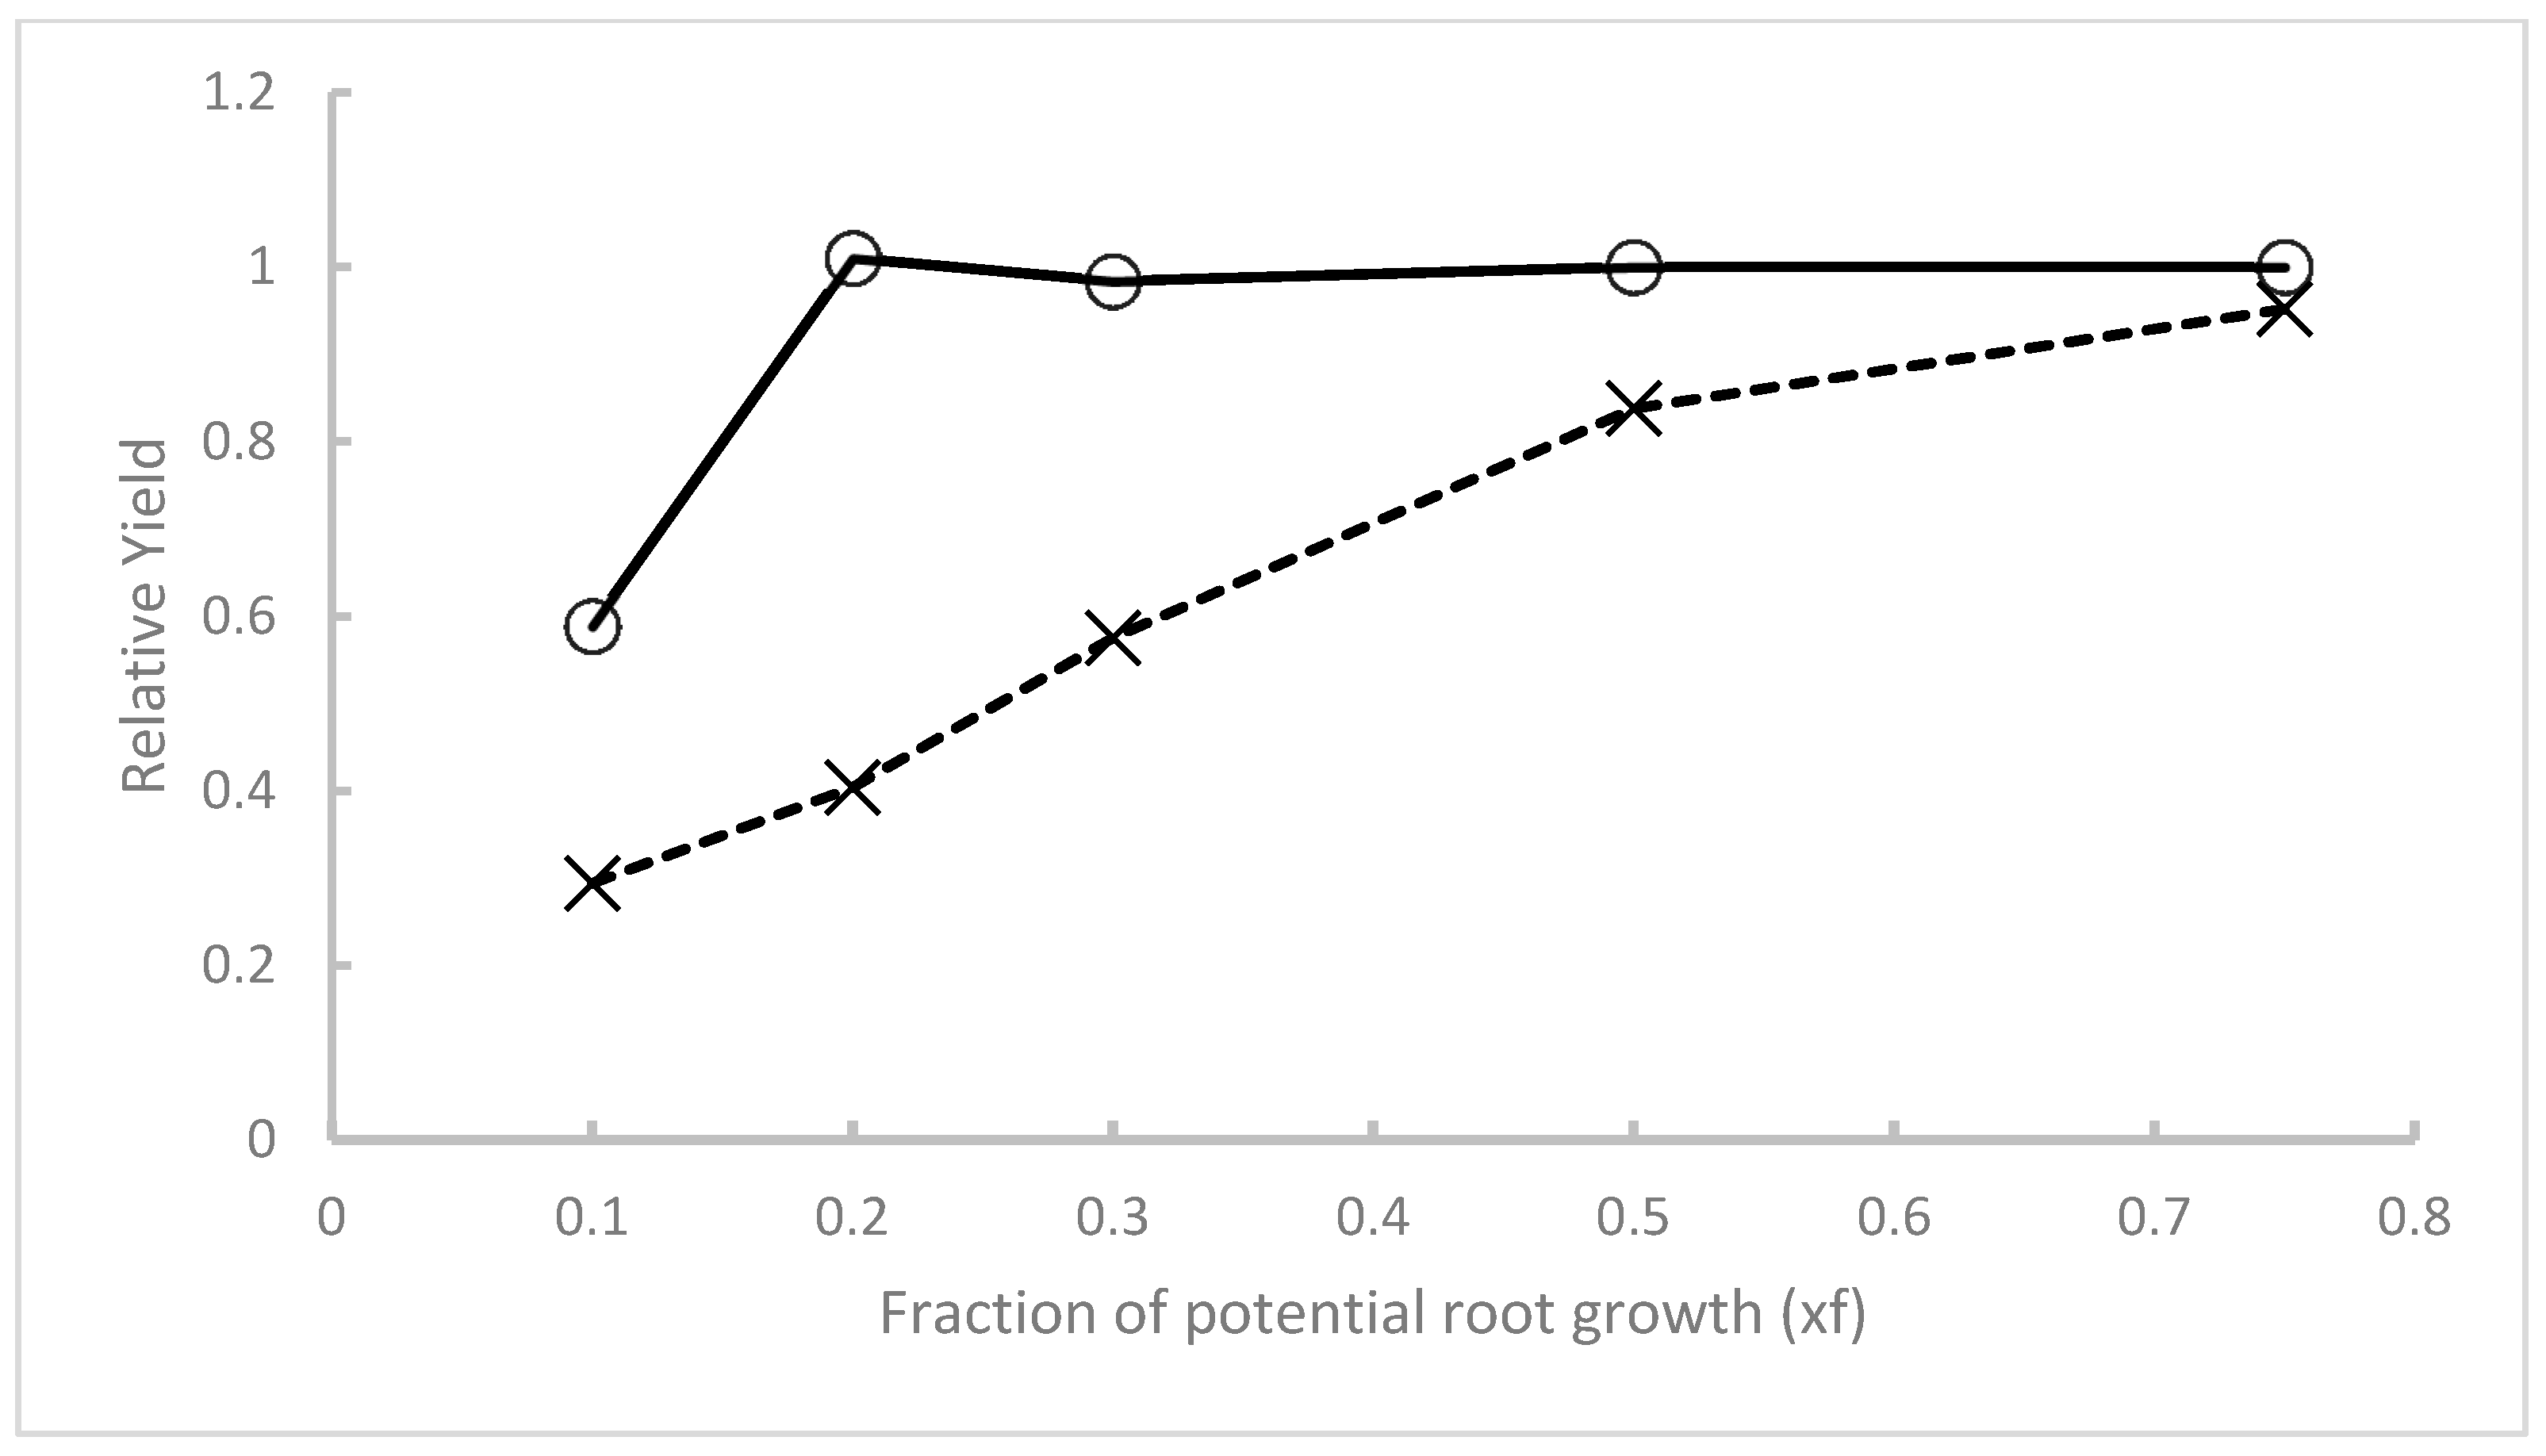
2.5. Estimating the Effect of Soil Acidity and Amelioration with APSIM

While many biophysical factors have been invoked as the underlying cause of the negative effect of soil acidity on yield (see Section 1), we made the assumption that the primary effect is on poor root growth and associated constraints to extracting soil water. The crop model APSIM was used as a “bioassay” for the impact of acidity on crop yield by modifying the parameters controlling root growth rate (since APSIM does not model the pH nor does it include a pH-root reduction function).
APSIM simulates the potential daily root growth in a soil layer at 30 mm/day and discounts this for the effects of temperature and the water content of the soil layer that the deepest roots are currently passing through. For example, root growth through a layer will be slowed if the soil water content is less than 25% of the holding capacity between the lower limit and drained upper limit.
The rate of growth of the roots in different soil layers in APSIM can be reduced to simulate a soil constraint by imposing a root growth rate reduction factor (xf) on the potential root growth rate. The “xf” is set between 0 and 1, where 0 is no growth in that layer and 1 is unconstrained. An xf of 0.1, for example, means that the roots grow at 10% of the potential root growth rate in that soil layer. This approach has been used to model acidity [49] and compacted layers of soil [50].
In the individual site and long-term scenarios, acidity in different layers was simulated by varying xf in the 0–0.2 m or 0–0.3 m layer. The xf of the 0–0.1 m layer was not varied as APSIM is not sensitive to xf reduction in that layer (due to the simulated root front being at 0.1 m not long after emergence and, since there is no need for roots to extract water and N before that time, plant growth is not affected by that layer).
Each case from the trial database (WA, NSW and VIC) was assigned an xf value for the acid layers based on the difference in the measured and water-limited potential yield, with the depth(s) at which xf was adjusted being based on the pH of the soil profile. The %RYI was then estimated using APSIM for (1) complete amelioration of the profile (2) partial amelioration the acidity—the roots growth rate increases but not to potential or (3) ameliorating part of the profile (e.g., 0–0.3 m acidic profile now only acidic at 0.2–0.3m).

2.6. Estimating the Effect of Season on Yield Increase from Amelioration Using APSIM

The shape of the relationship between relative yield and the fraction of potential root growth (xf) for each season (year/rainfall) within each case (soil, pH profile) was used to define the year in terms of the likelihood of an increase in yield from amelioration. Seasons were defined as unlikely to have a yield response to amelioration if the RY was near YP (RY > 0.9) regardless of root growth rate (xf values). Seasons that had an increase in RY as the root growth rate is increased (increasing xf) (Figure 1) were defined as likely to have a yield response to amelioration.
The following example will help to illustrate this approach. A sandy soil with acidity in the 0.1–0.3 m layers at Bodallin, WA demonstrates two different seasons (1991 and 2000) (Figure 1). The year 1991 at this location was an example of a season unlikely to exhibit a yield increase in response to amelioration, i.e., with little yield increase from an increase in the root growth rate below 0.1 m, unless the site was severely acidic (xf ≤ 0.1). This could be explained by the rainfall distribution as there was little early season rainfall (22 mm Jan–April), therefore minimal stored soil water at depth, but there was above average rainfall in June and July (60 mm each month). This meant that the crop was able to grow using water near the soil surface. In contrast, the year 2000 was an example of a season likely to exhibit a yield increase in response to amelioration, i.e., with an increase in RY as the root growth rate increased (increasing xf) (Figure 1). There was a large amount of rain in January and March (120 mm and 90 mm, respectively) which increased the stored soil water at depth. This was followed by low rainfall in May and June (only 25 mm) which meant that the crop may have needed to access water stored deeper in the profile, thus being responsive to a restriction in root growth (xf).

3. Results

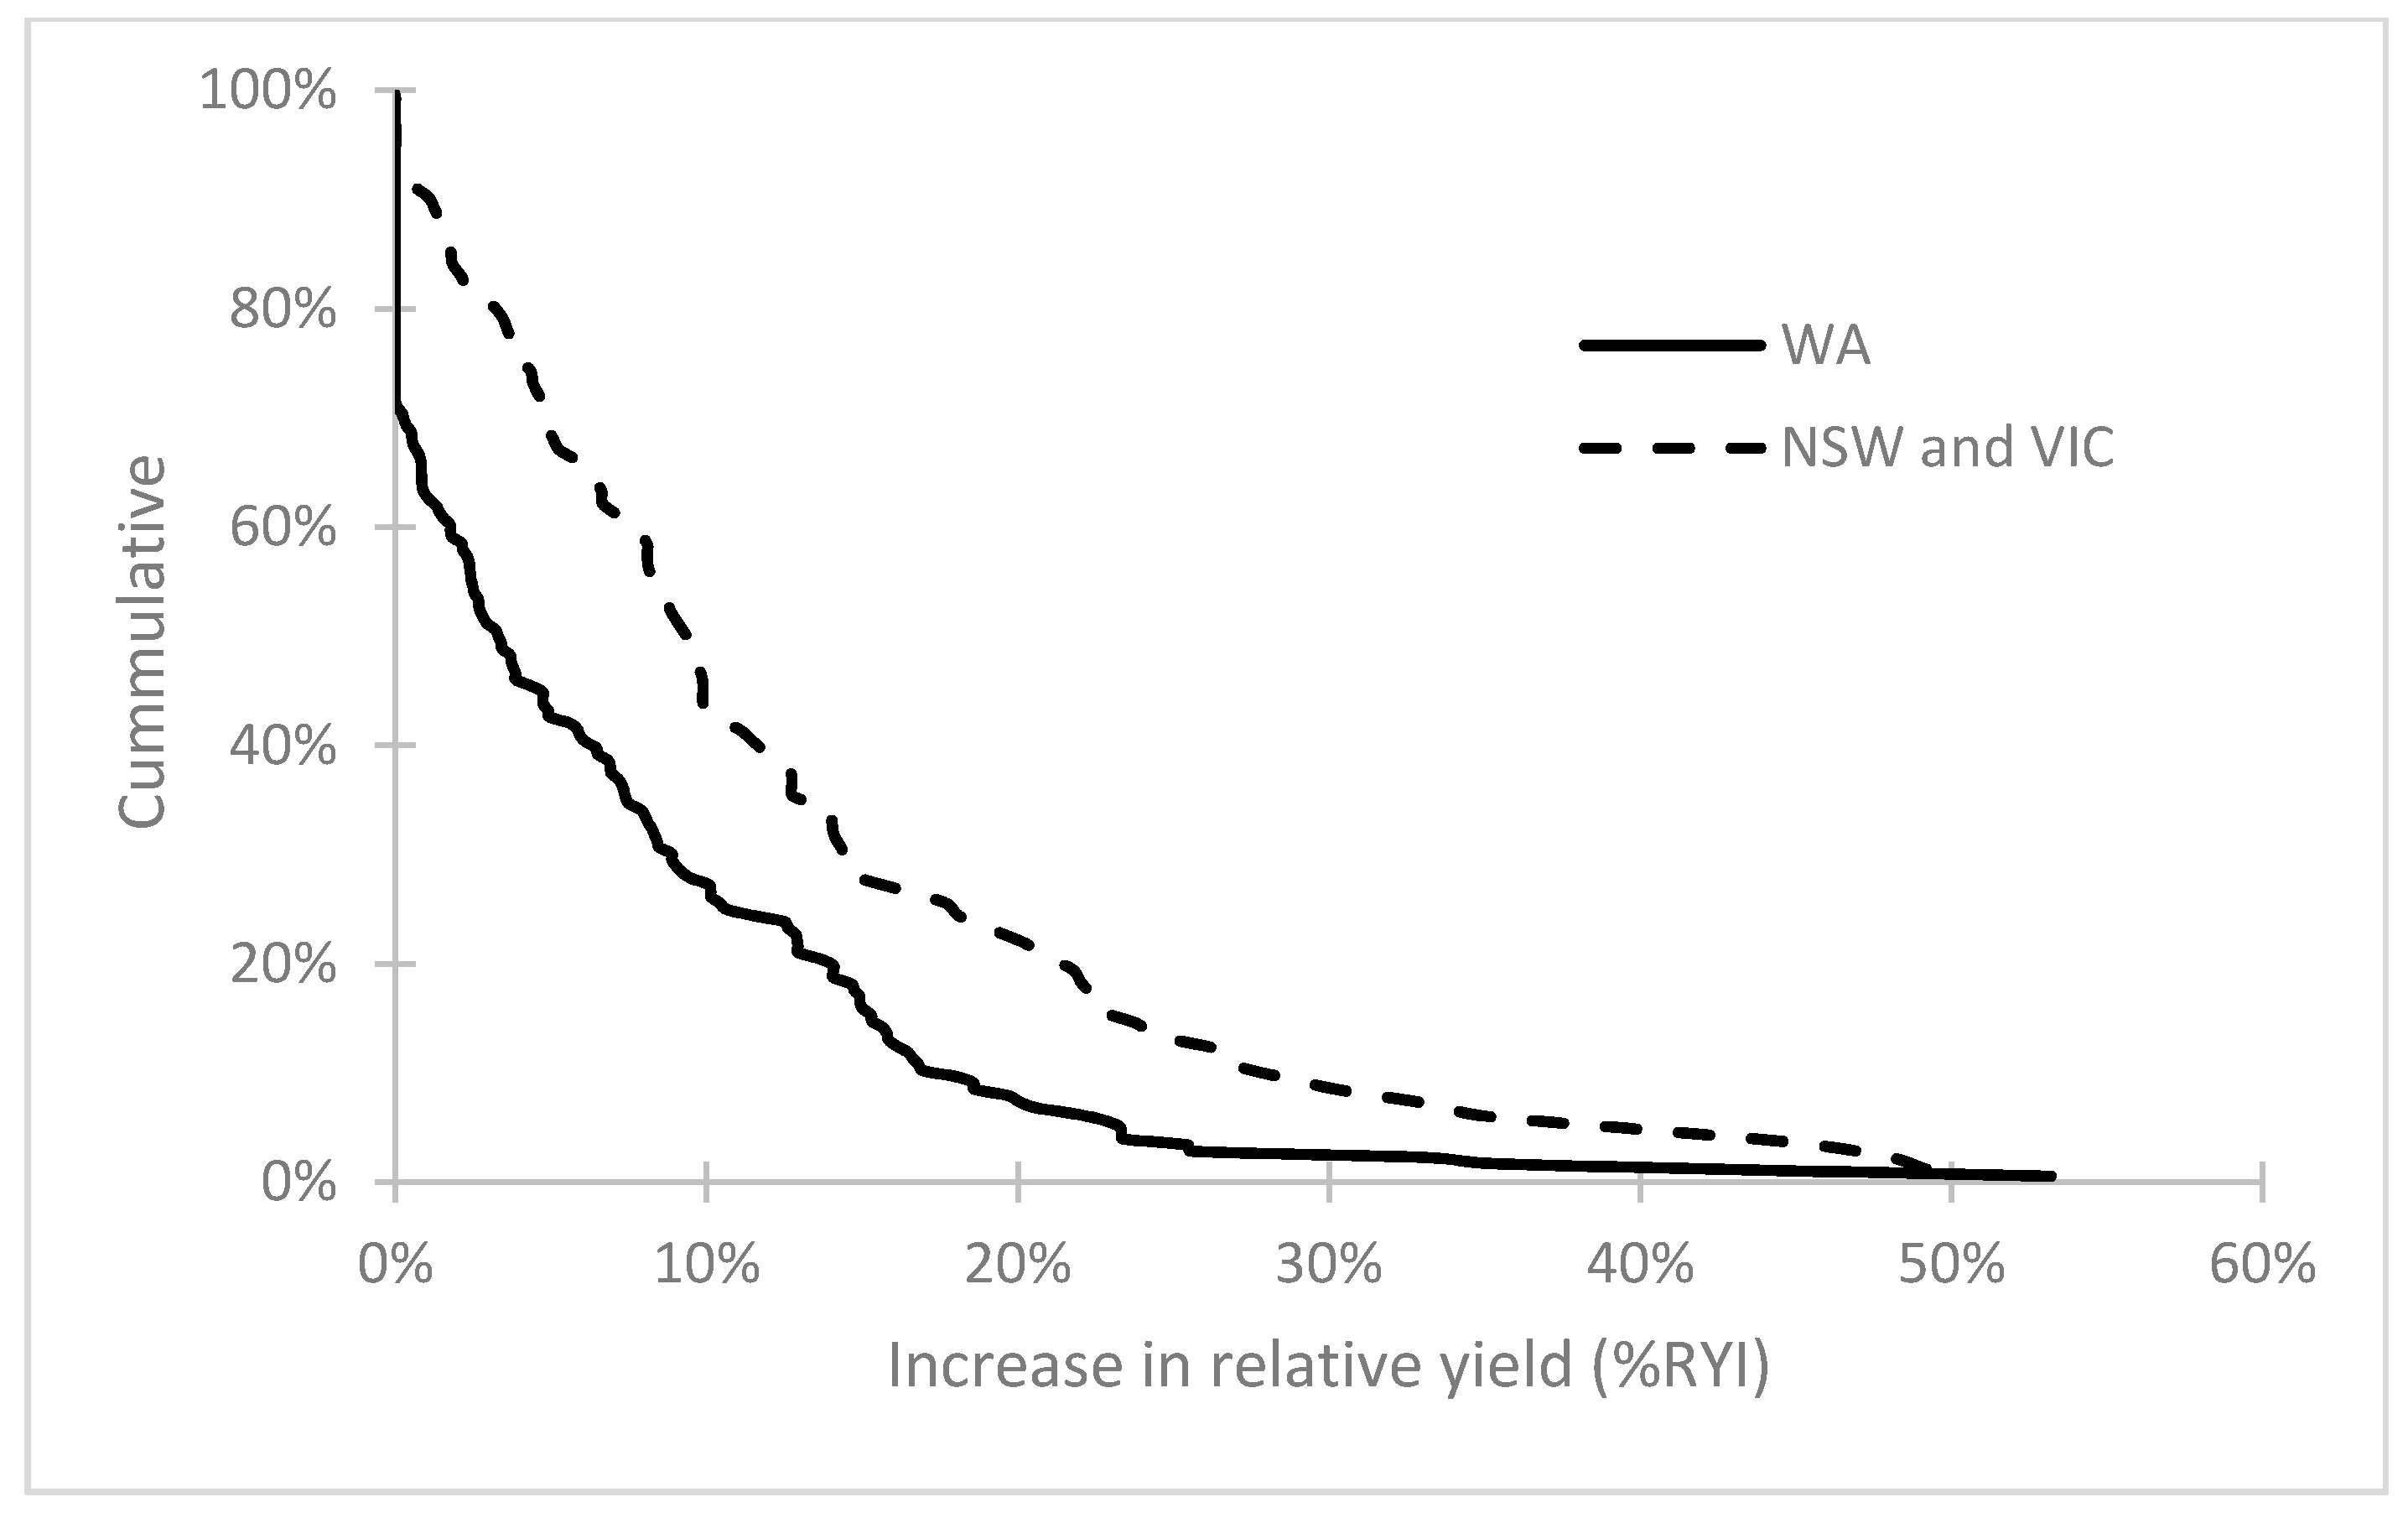
3.1. Yield and Yield Increase from Surface Applied Lime

The average increase in yield to surface applied lime for all crops across WA, NSW and VIC was 12%, but the range in response was large (0 to 185%, Table 3). When the yield increase was expressed relative to the potential yield, the range of increase in relative yield was 4 to 25% RYI. The highest increase in yield was for barley with the lowest for lupin (data not shown). This is expected due to the susceptibility of barley to aluminium toxicity induced by soil acidity and the relative tolerance of lupin [35].
In WA, the average yield increase when lime had been applied for one year or more was 0.22 t ha−1 (n = 176) which is a 14% yield increase or 7% RYI (Table 3). The results were similar for other trials around Australia, although the NSW and VIC sites had higher absolute increases in yield than WA. Greater responses in yield occurred in trials from NSW and VIC that included the effect of lime and ripping/tillage [20,31,32,33,34,35,36,37]. Small yield increases (YI < 10% or RYI < 5%) were common in the trial data from WA and occurred in 58% of cases. Large yield increases greater than 25% YI or 15% RYI occurred in 20% of the cases from WA (Figure 2). Yield increases were more common in the NSW and VIC trials with 70% of cases having a greater than 10% YI or 5% RYI.

3.2. Using Relative Yield and Responsiveness Matrix

There were 37% of WA, NSW and VIC cases where the unlimed treatments were at 0.75 of yield potential or greater, which may indicate that acidity was not a major constraint for those cases in those years (Table 3). In 23% of cases in WA, NSW and VIC the unlimed treatments were severely constrained as the yield was less than 0.5 of potential (Table 3).
In WA 58% of the cases and 29% of the cases from NSW and VIC were unresponsive to lime (%RYI < 5%, Table 3). It was common for lupin to be unresponsive in WA (39 out of 53 lupin cases) but we could not compare to the NSW and VIC as there was only one trial in the dataset in which lupin was grown. Responsive cases (42% of those in WA and 71% of those in NSW and VIC) had an increase in percentage of relative yield of 13 to 21%.
In WA, the responsive sites had yield increases of 49, 24 and 16% in the low, medium and high yield classes, which suggests that the highest gains were from lower-yielding cases. The yield gains in the most responsive cases were 13–16% when compared on a relative yield basis (%RYI, Table 3). Cases classed as unresponsive had yield increases of 4–6%, which converted to 1% on a relative yield basis. Low, medium and high yield potential related mainly to the severity of the acidity constraint, while responsive or unresponsive cases related to the lime rate, years since lime was applied and season (Table 3).
APSIM was able to model the yield for the severest constrained cases (RY < 0.5) by reducing the root growth rate to 10% of potential (xf of 0.1). When topsoil was ameliorated and root growth increased to maximum (xf 1) in the 0–0.2 m layer, but still constrained below, the estimated %RYI from simulation was 21%, which was close to the 16% found in the trials. When amelioration was to 0.3 m then the %RYI was 35% for an increase in root growth rate (xf from 0.1 to 0.2) and up to 61% for full amelioration (maximum root growth rate; xf = 1). The medium-yielding range, RY of between 0.5 and 0.75, was best simulated using xf 0.1 and 0.2. In the medium-yielding responsive cases, the acid constraint had mostly been removed but the observed yield responses (13–17%, Table 3) were lower than those estimated by simulation for the range of profile amelioration (17–34%). This suggests that higher rates of lime were still required to reach yield potential. The higher-yielding cases, RY greater than 0.75, were best simulated with an xf of 0.2 to 0.3. The estimated response in %RY from simulation with the topsoil ameliorated was similar to the observed %RYI of 16–21%.

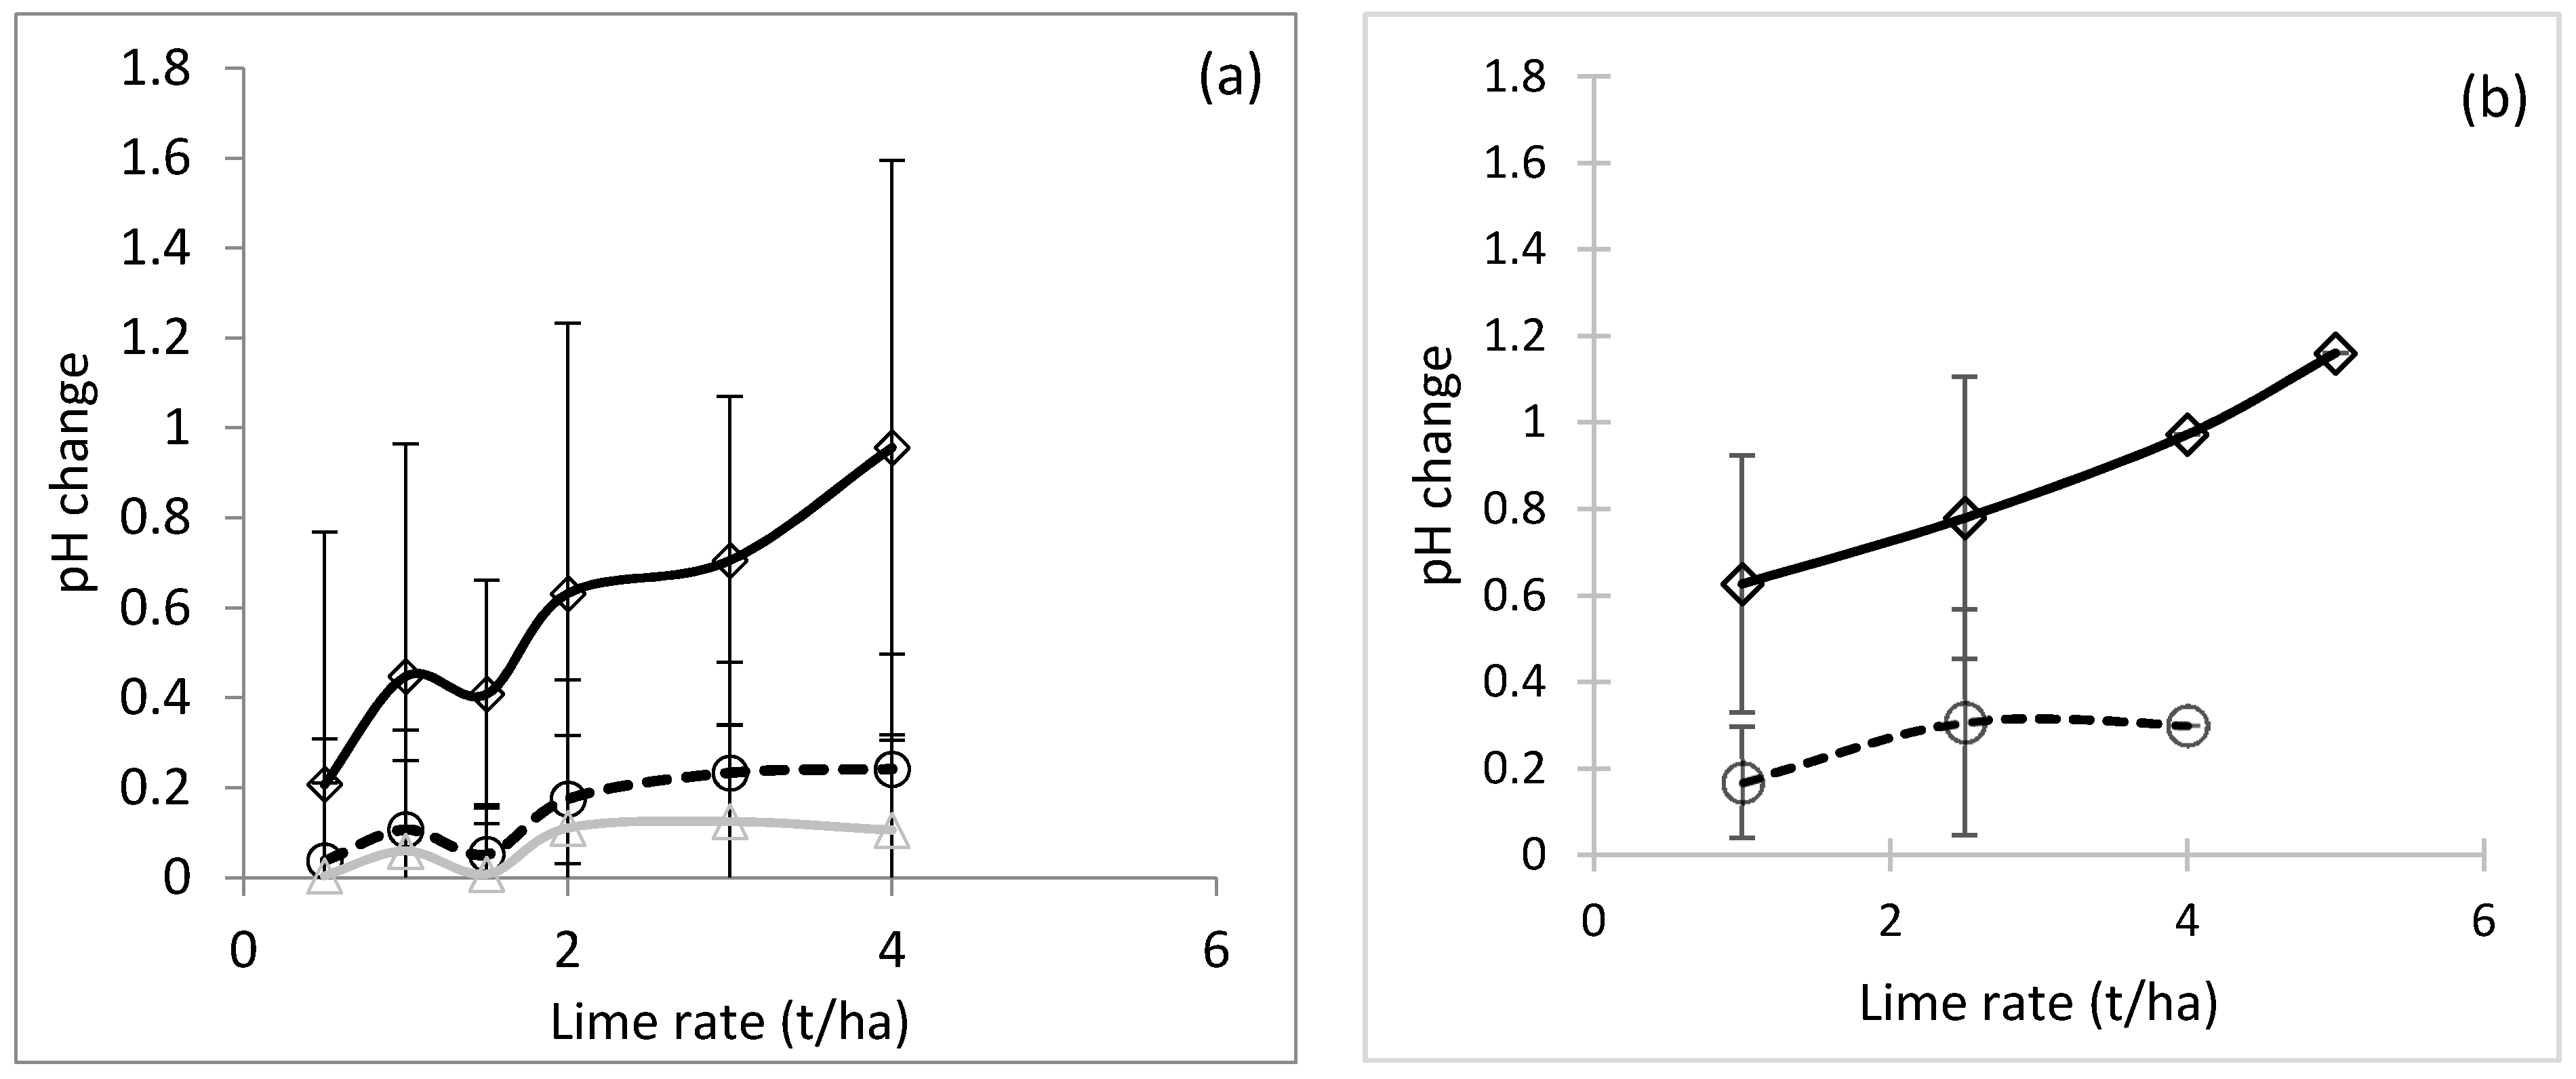
3.3. Effect of Lime Rate

The impact of rate of lime varied with the severity of the pH constraint. Cases where the soil pH was close to the target level in the top 0.1 m of soil tended to demonstrate a low yield response and were classed as unresponsive (Table 3). Cases in which the soil pH was well below the target level had a low yield response but were classed as responsive as some lime had been applied, average 2 t ha−1, which was sufficient to ameliorate the topsoil, but the subsoil was still acidic.
Lower application rates of lime (average of 0.4 t ha−1 less) in cases with a medium yield response (RY between 0.5 and 0.75) were classed as unresponsive to lime as the application rate was too low to address the acidity constraint, or soil acidity was not the main constraint to yield (Table 3).
For cases that were near yield potential (RY > 0.75), the unresponsive ones had the lowest rate of lime (0.8 t ha−1), or lime that had been recently applied and were sampled in unresponsive seasons compared to the responsive cases (Table 3). This also occurred in cases that were not constrained by acidity, or where more tolerant crops were grown.
In WA, where lime was applied more than one year previously, the pH in the topsoil (0–0.1 m) increased, on average, by 0.25 pH unit for a 0.5 t ha−1 lime rate, and by 1 pH unit for at 4 t ha−1 lime rate (Figure 3a). The NSW and VIC data showed an average 0.5 pH unit at a 1 t ha−1 rate, with greater than 1 pH unit change for 4–5 t ha−1 lime (Figure 3b).

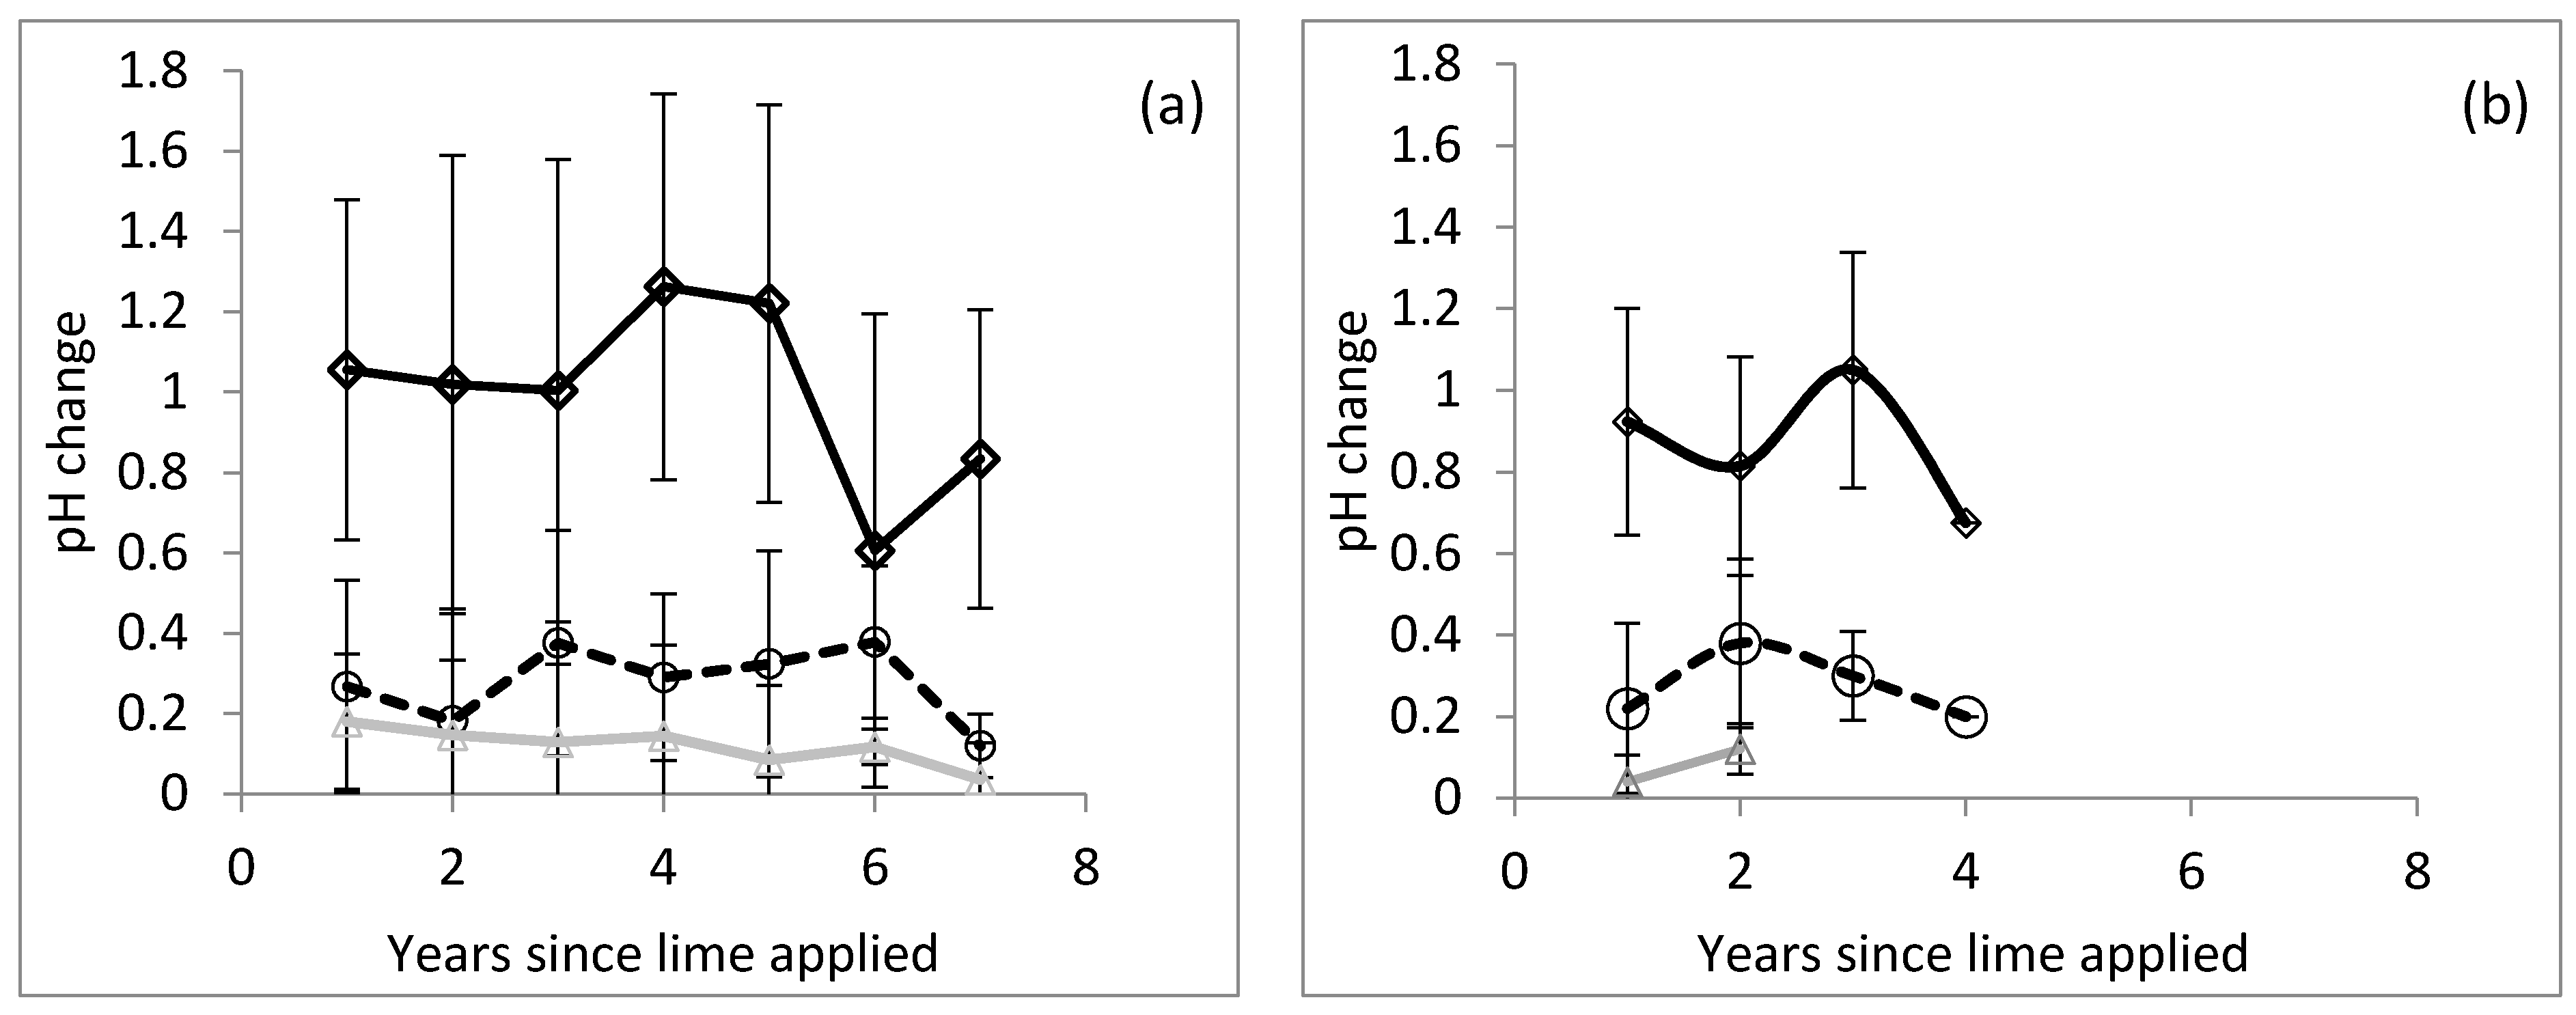
3.4. Effect of Time Since Lime Application

The responsive, high-yielding cases had the longest time since lime had been applied—eight years compared to three to four in the other cases. In the WA cases that had the greatest yield response to lime, the pH increased in the topsoil after the first year of lime application, and the maximum increase in pH (of 1.2 pH unit on average) occurred after four years (Figure 4a). The pH of the subsoil had a small average increase in pH of 0.25 unit in the 0.1–0.2 m layer and 0.1 unit in the 0.2–0.3 m layer (Figure 4a), with the maximum pH change occurring by the second year after lime had been applied (Figure 4a). The pH changes for the NSW and VIC cases were similar to WA with an average increase in pH of the topsoil (0–0.1 m) of 1.16 pH unit and 0.3 pH unit in the 0.1–0.2 m layer with a 5 t ha−1 lime rate (Figure 4b).

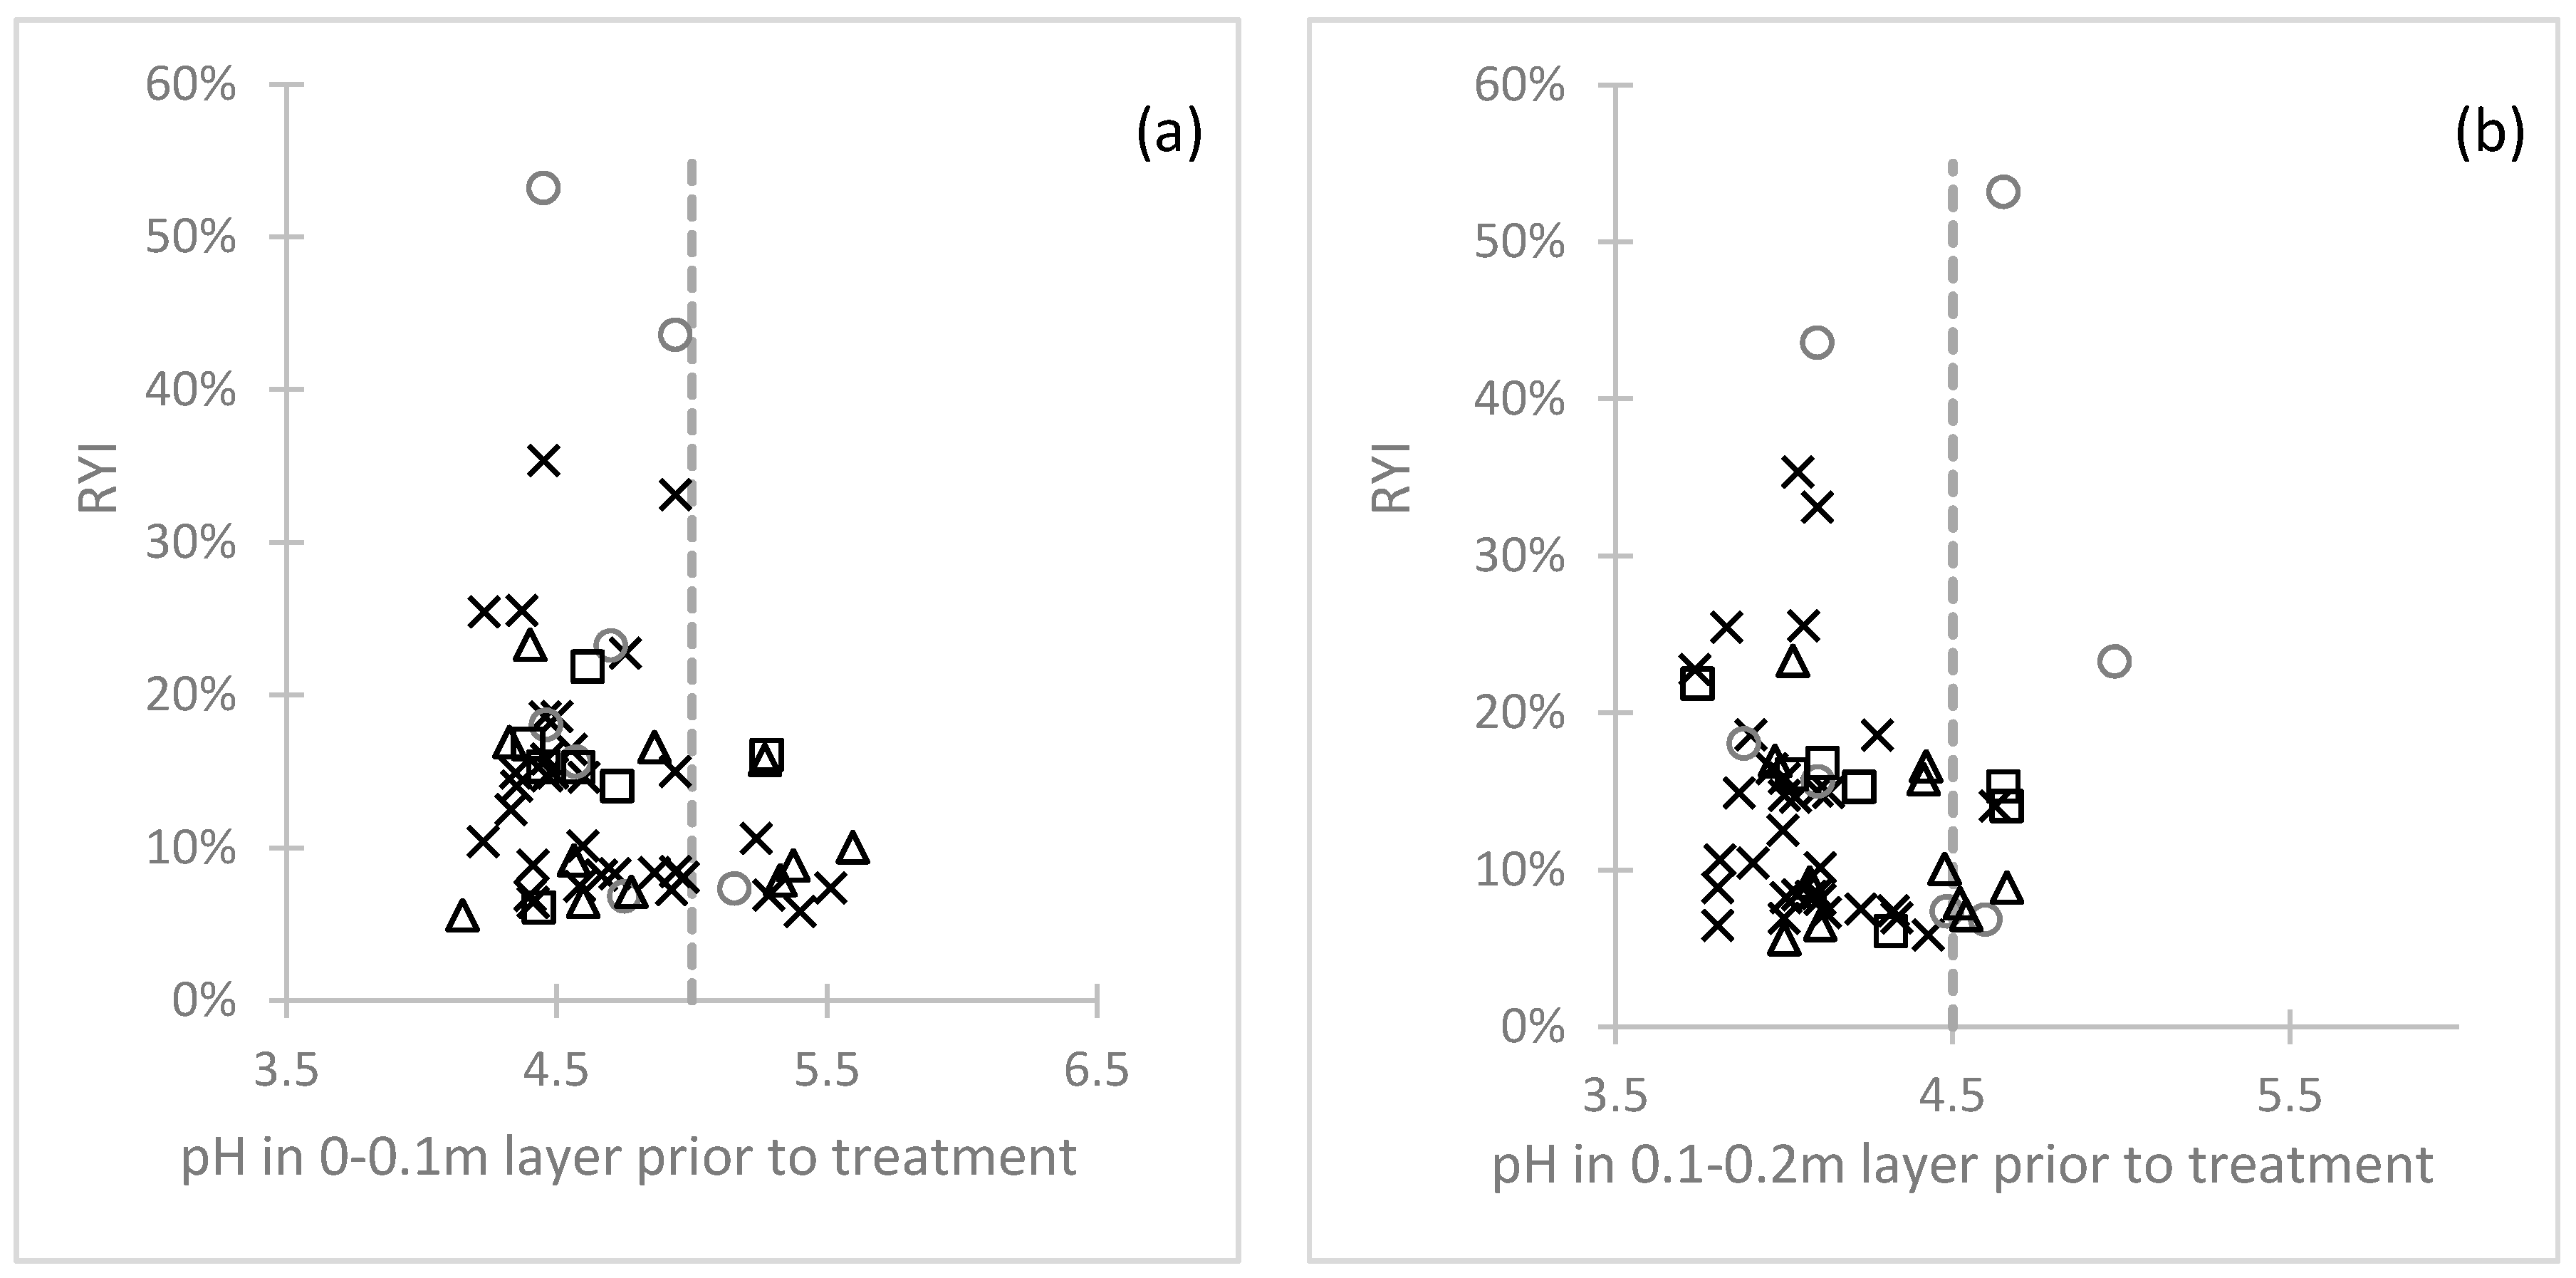
3.5. Effect of Soil Type and Soil pH

The soil type was not the cause of low yield and low yield increases due to lime. Using %RY instead of %YI, with the exception of pale sand, the WA soil had similar %RYI (6–8%) (Table 4). The highest relative yield and lowest yield benefits (%YI = 3% or %RYI = 2%) were for pale sand, possibly due to the high rainfall at these trial sites (Table 4). In NSW trials the Sodsol had the lowest %RY and %RYI compare to the sandier Kandosol. However, the NSW cases with Sodsol soil had much higher rainfall and may have constraints other than acidity. In VIC, the sandier soil, sandy clay loam, had higher %RYI than the heavier clay and clay loam soil. From this analysis, it appears that in WA, the soil type per se has little effect on the relative yield increase due to lime application. However, in NSW and VIC, sandier soil had the greater yield increase from lime application. This may be related to greater variation in soil texture and greater loam and clay content at the sites from NSW and VIC sites compared with those in WA.
In the WA trials, the topsoil was acidic in the majority of cases (118 or 67% of cases), while the topsoil was classed as non-acidic with acidic subsoil in 27 (15% of cases). In 11 cases (6%) the whole profile was non-acidic and 20 cases (11%) pH was not measured (Table 5). Acidity was commonly found to a depth 0.3 or 0.4 m (93 or 54% of cases), and was less common in the 0–0.2 m layer (29 or 17% of cases) or just the topsoil 0–0.1 m (21 or 12% of cases).
In NSW and VIC, the soil was mostly acidic in the top 0–0.1 m (79 out of 89 cases), with 55 of these also acidic to 0.2 m (Table 5). There were only 10 cases where the topsoil was classed as non-acidic. However, in these cases, the subsoil pH was unknown, as it was not measured.
The soil pH values in the untreated soil were not able to predict the yield at a site. There was no correlation between yield or relative yield in the limed and unlimed treatments and soil pH in the 0–0.1 m, 0.1–0.2 m and 0.2–0.3 m layers for WA, NSW and VIC (data not shown). Only 45 out of 176 sites have extractable aluminium (mg kg−1) measured, so it was not used for correlations but used as a explanatory factor for individual cases.
Soil pH may be a guide to the likelihood of a yield response to lime application, where the lower the soil pH, the greater the chance of a yield increase. The %RYI was negatively correlated to soil pH in unlimed plots in the 0–0.1 m and 0.1–0.2 m layers (Figure 5a,b). There was a trend for sites with topsoil pH < 5 and subsoil pH < 4.5 to have a greater likelihood of an increase in relative yield due to liming (Figure 5a,b). The pH of the topsoil was below 5 and subsoil pH below 4.5 in most of the cases that were classed as responsive (Figure 5a,b).

3.6. Seasonal Response to Lime Application

There was no relationship between yield increase, %YI, or %RYI and GSR or water supply (GSR + 30% of summer rainfall) for canola, wheat, lupin and barley (data not shown). It is likely that the distribution of rainfall is more important than the total rainfall where access to subsoil water is increased by liming and required in periods of drought in the growing season.
The cases defined as unresponsive (Table 3) occurred in a season classified as unlikely to exhibit a yield increase in response to amelioration in 31 cases out of the 102 in WA and five out of the 26 case in NSW and VIC. Therefore, the lack of response in the majority of cases in WA and NSW was likely due to an insufficient amount and/or time since lime application or limited amelioration at depth rather than season.
There were a number of cases which we defined as occurring in seasons unlikely to have a yield increase from amelioration that were actually responsive. This occurred in 14 cases out of the 74 responsive cases in WA and 12 out of 63 responsive cases in NSW/VIC. For eight of these WA cases and nine of the NSW/VIC cases the relative yield was low or medium, had 2–4 t ha−1 of lime applied and were modelled with an xf of less than 0.1. This is similar to the 1991 example (Figure 1), which shows that yield increases only occurred at an xf of less than 0.1. This indicates that if the acidity is severe, there will be a benefit to amelioration in all seasons as long as the lime rate is high. For the other responsive cases in seasons unlikely to have a yield increase from amelioration (six in WA and three in NSW/VIC), the relative yield was high and had the topsoil and/or subsoil to 20–30 cm had been ameliorated, so is likely that the increase in yield included a nutrient response [51].

3.7. Amelioration

The ability of lime to ameliorate part of the soil profile, defined by raising soil pH(CaCl2) above 5 in the 0–0.1 m layer and 4.5 in the subsoil, occurred in 124 WA cases (70%) and 36 NSW and VIC cases (40%, Table 5). In seven of the WA cases (4%) liming did not ameliorate any acidic layer of the soil, while in another 11 WA cases (6%) there was no change in pH as it was already above the cut-off values. There were 36 cases (20%) in WA which did not have pH measured in either the limed or unlimed treatments and 49 cases from NSW and VIC in which the data for pH on the limed plots was not reported.
The topsoil (0–0.1 m) was most commonly ameliorated (104 or 60% of WA cases and 29 cases in NSW and VIC) with an average increase across all cases of 1.2 pH unit. Amelioration from the topsoil to depth was less common, with the applied lime increasing the pH at 0–0.2 m in 21 cases in WA and seven in NSW and VIC and 0–0.3 m in nine cases in WA (none for NSW and VIC). If the topsoil was classed as non-acidic but the subsoil was acidic, the soil was ameliorated to 0.2 m in three cases and to 0.3 or 0.4 m in 15 cases (Table 5).
Using the matrix, we noticed that the low-yielding sites had only the topsoil ameliorated and were often still acidic below 0.1 m (data not shown). The medium-yielding sites were more commonly ameliorated in the topsoil and some to 0.3 m, but still had acidic subsoil. The high-yielding sites often had the acidity ameliorated and, for the responsive cases, it was the major constraint, while in the unresponsive cases, we speculate that there were other constraints to production.
The change in pH in any soil layer between the untreated and limed treatments was not a good indicator of the expected yield increase. There was no relationship between change in pH in a layer (0–0.1 m, 0.1–0.2 m and 0.2–0.3 m) and yield increase from liming (data not shown). This was expected, as the change in pH does not account for the pH profile type and the starting pH.
There was also no relationship between the pH of the soil profile nor the change in pH of the soil profile after liming and increase in relative yield. This may be due to the confounding relationship between pH and aluminium. For example, there were three cases in WA which had acidic subsoil and no class change in the pH profile but showed a 7–16% yield increase. This was likely due to the aluminium concentration reducing from 9 to 2 mg kg−1 in the 0.2–0.3 m layer and from 9 to 4 mg kg−1 in the 0.3–0.4 m layer. Similarly, in NSW and VIC, the highest RYI (34%) was in a situation where the soil was acidic to 0.2 m, there was no change in pH class following liming, but there was a decrease in the exchangeable aluminium due to the lime application [20].

4. Conclusions

The biggest drivers of the yield response to lime application on acidic soil are the lime rate and the time since lime was applied. The season may play a part in low yield responses at moderately constrained sites, but seasonal differences were not found to be the basis behind the lack of response at highly constrained sites.
This meta-analysis of 71 trials, which collectively cover some twenty years, indicates that rates of lime greater than 2.5 t ha−1 and four years or more are required to achieve maximum changes in both soil pH and yield to surface lime application. The largest increase in yield from liming occurred when at least 3 t ha−1 of lime was applied in trials conducted in WA and greater than 2.5 t ha−1 in trials conducted in NSW and VIC. Difficulties occur in attributing a yield response to applied lime because of the time required for lime to take effect (commonly 3–4, but up to 8 years) and the limited time after application that trials are monitored. Often the amount of lime applied to a constrained soil was too small to ameliorate the soil acidity, especially in cases with subsoil acidity when it may require larger rates of lime to reach maximum yield benefit.
The majority of the lime in these experiments was applied to the surface, even though half of the sites had subsoil acidity. This may explain why lower rates of applied lime failed to generate a yield response. Higher rates of lime and/or deeper incorporation may generate greater pH changes and therefore greater yield responses to applied lime [52].
We have found that soil pH test values are a poor predictor of yield response to lime. We suggest a combined approach which uses pH classes (pH < 4.5 or 5), acid profile type (acid in 0.1–0.3 m layers) and the degree of yield constraint as quantified by the yield relative to a water-limited potential. Such an approach could improve confidence for decision makers trying to identify when soil pH is constricting yield and when they are likely to obtain a response to surface applied lime or if more aggressive intervention is required to incorporate lime directly into the deeper acidic layers.

Author Contributions

Conceptualization, Y.M.O., C.G., J.F., and M.R.; methodology, Y.M.O. and M.R.; validation, Y.M.O., C.G., and J.F.; formal analysis, Y.M.O.; investigation, Y.M.O.; data curation, Y.M.O.; writing—original draft preparation, Y.M.O.; writing—review and editing, Y.M.O., C.G., J.F., and M.R.; visualization, Y.M.O.; project administration, Y.M.O. and M.R.; funding acquisition, Y.M.O. and M.R. All authors have read and agreed to the published version of the manuscript.

Funding

This research was funded by Grains Research and Development Corporation (GRDC), Commonwealth Scientific and Industrial Research Organization (CSIRO) and Department of Primary Industries and Regional Development.

Institutional Review Board Statement

Not applicable.

Informed Consent Statement

Not applicable.

Data Availability Statement

Data is contained within the article.

Acknowledgments

The authors would like to thank the Wheatbelt NRM for the providing the regional pH profile data, and Department of Primary Industries and Regional Development (formally the Department of Agriculture and Food) for the work involved in the collection and collation of the WA acidity data.

Conflicts of Interest

The authors declare no conflict of interest.

References

  1. Helyar, K.; Porter, W. Soil acidification, its measurement and the processes involved. In Soil Acidity and Plant Growth; Robson, A., Ed.; Academic Press Australia: Marrickville, NSW, Australia, 1989; pp. 61–101. [Google Scholar] [CrossRef]
  2. Van Breemen, N.; Mulder, J.; Driscoll, C. Acidification and alkalinization of soils. Plant. Soil 1983, 75, 283–308. [Google Scholar] [CrossRef]
  3. Gazey, C.; Davies, S. Soil acidity—A guide for farmers and consultant. In Department of Food and Agriculture Bulletin 4784; Department of Agriculture and Food: Perth, Australia, 2009. Available online: https://researchlibrary.agric.wa.gov.au/cgi/viewcontent.cgi?article=1031&context=bulletins (accessed on 4 April 2018).
  4. Gazey, C.; Andrew, J.; Griffin, E. ‘Soil Acidity’. In Report Card on Sustainable Natural Resource Use in Agriculture; Department of Agriculture and Food: Perth, Australia, 2013. Available online: https://www.agric.wa.gov.au/report-card-conditions-and-trends/report-card-sustainable-natural-resource-use-agriculture-western (accessed on 1 April 2018).
  5. NLWRA. Australian Agriculture Assessment 2001; National Land and Water Resources Audit: Canberra, Australia, 2001; Volume 1, pp. 125–129.
  6. Slattery, W.J.; Coventry, D.R. Response of wheat, triticale, barley and canola to lime of four soils types in north-eastern Victoria. Aust. J. Exp. Agric. 1993, 33, 609–618. [Google Scholar] [CrossRef]
  7. Petersen, E.; Gazey, C.; Lemon, J. The Benefits of Managing Soil Acidity; Misc report to GRDC; GRDC: Perth, Australia, 2018; p. 21. [Google Scholar]
  8. NLWRA. Australians and Natural Resource Management 2002; National Land and Water Resources Audit: Canberra, Australia, 2002.
  9. Robinson, J.B.; Helyar, K.R.; Hochman, Z. A Model for Understanding the Importance of Various Chemical, Physical and Biological Processes in the Development of Soil Profile Acidity. In Plant-Soil Interactions at Low pH: Principles and Management. Developments in Plant and Soil Sciences; Date, R.A., Grundon, N.J., Rayment, G.E., Probert, M.E., Eds.; Springer: Dordrecht, The Netherlands, 1995; Volume 64. [Google Scholar] [CrossRef]
  10. Kennedy, I. Acid Soil and Acid Rain. In Research Studies in Botany and Related Applied Fields, 2nd ed.; Nutman, P., Ed.; Research Studies Press Ltd.: Somerset, UK, 1992; Volume 10. [Google Scholar]
  11. Edmeades, D.C.; Ridley, A.M. Using Lime to Ameliorate Topsoil and Subsoil Acidity. In Handbook of Soil Acidity; Rengel, Z., Ed.; Marcel Dekker: New York, NY, USA, 2003; pp. 297–336. [Google Scholar] [CrossRef]
  12. Bolan, N.S.; Adriano, D.C.; Curtin, D. Soil acidification and liming interactions with nutrient and heavy metal transformation and bioavailability. Adv. Agron. 2003, 78, 215–272. [Google Scholar] [CrossRef]
  13. Gazey, C.; Gartner, D.; Anderson, G. Demonstration Sites Results for 2000 and 2001 In Western Australia Soil Acidity Research and Development Updates 2002; Department of Agriculture and Food: Perth, Australia, 2002.
  14. Davies, S.; Gazey, C.; Bowden, B.; van Gool, D.; Gartner, D.; Liaghati, T.; Gilkes, B. Acidification of Western Australian soils and their management. In Proceedings of the 13th Australian Agronomy Conference, Perth, Australia, 10–14 September 2006; Turner, N., Acuna, T., Eds.; Available online: http://www.regional.org.au/au/asa/2006/concurrent/soil/4555_daviess.htm#TopOfPage (accessed on 4 April 2018).
  15. Andrew, J.; Gazey, C. A Preliminary Examination of the Spatial Distribution of Acidic Soil and Required Rates of Ameliorant in the Avon River Basin, Western Australia. In Proceedings of the 19th World Congress of Soil Science: Soil Solutions for a Changing World, Brisbane, Australia, 1–6 August 2010; Gilkes, R., Ed.; Australian Soil Science Society: Brisbane, QLD, Australia, 2010. [Google Scholar]
  16. Fisher, J.; Gazey, C.; Andrew, J.; Carr, S. Knowledge is power in soil acidity management. In Proceedings of the 16th Australian Agronomy Conference 2012, Armidale, NSW, Australia, 14–18 October 2012; Yunusa, I., Ed.; Available online: http://www.regional.org.au/au/asa/2012/nutrition/8154_fisherjs.htm#TopOfPage (accessed on 4 April 2018).
  17. Fisher, J.; Gazey, C.; Andrew, J.; Carr, S. Two levels of information are required to assist extension of liming in Western Australia. In Proceedings of the 15th Australian Agronomy Conference, Lincoln, New Zealand, 15–18 November 2010; Dove, H., Culvenor, R., Eds.; Available online: http://www.regional.org.au/au/asa/2010/farming-systems/participatory-research-extension/7121_fisherjs.htm#TopOfPage (accessed on 4 April 2018).
  18. Carr, S.J.; Ritchie, G.S.P.; Porter, W.M. A soil test for Aluminium toxicity in acidic subsoils of yellow earth in Western Australia. Aust. J. Agric. Res. 1991, 42, 875–892. [Google Scholar] [CrossRef]
  19. Conyers, M.K.; Poile, G.J.; Cullis, B.R. Lime responses by Barley as related to available aluminium and manganese. Aust. J. Agric. Res. 1991, 42, 379–390. [Google Scholar] [CrossRef]
  20. Conyers, M.K.; Mullen, C.L.; Scott, B.J.; Poile, G.J.; Braysher, B.D. Long-term benefits of limestone applications to soil properties and to cereal crop yields in southern and central New South Wales. Aust. J. Exp. Agric. 2003, 43, 71–78. [Google Scholar] [CrossRef]
  21. Dolling, P.J.; Porter, W.M.; Robson, A.D. Effect of soil acidity on the barley production in the south-west of Western Australia 2. Cereal genotypes and their response to lime. Aust. J. Exp. Agric. 1991, 31, 811–818. [Google Scholar] [CrossRef]
  22. Edmeades, D.C.; Blamey, F.P.C.; Farina, M.P.W. Techniques for assessing plant response on acid soils. In Plant-Soil Interactions at Low pH: Principles and Management; Date, R.A., Grundon, N.J., Rayment, G.E., Probert, M.E., Eds.; Kluwer Academic Publications: Dordrecht, The Netherlands, 1995; pp. 221–233. [Google Scholar] [CrossRef]
  23. Farhoodi, A.; Coventry, D.R. Field crop responses to lime in the mid-north region of South Australia. Field Crops Res. 2008, 108, 45–53. [Google Scholar] [CrossRef]
  24. Scott, B.J.; Fisher, J.A.; Cullis, B.R. Aluminium tolerance and lime increase wheat yield on the acidic soils of central and southern New South Wales. Aust. J. Exp. Agric. 2001, 41, 523–532. [Google Scholar] [CrossRef]
  25. Slattery, B.; Hollier, C. The Impact of Acid Soils in Victoria, Prepared for Department of Natural Resources and Environment, Goulburn Broken Catchment Management Authority and North East Catchment Management Authority. 2002. Available online: http://vro.agriculture.vic.gov.au/dpi/vro/vrosite.nsf/0d08cd6930912d1e4a2567d2002579cb/2b4e9f0f68863059ca2574c8002b3e83/$FILE/Acid%20soil%20exec%20sum%20June.pdf (accessed on 4 April 2018).
  26. Coventry, D.R. Acidification problems of duplex soils used for crop pasture rotations. Aust. J. Exp. Agric. 1992, 32, 901–914. [Google Scholar] [CrossRef]
  27. Moody, P.W.; Aitken, R.L.; Dickson, T. Field amelioration of acidic soils in south-east Queensland. III. Relationships of maize yield response to lime and unamended soil properties. Aust. J. Agric. Res. 1998, 49, 649–656. [Google Scholar] [CrossRef]
  28. Fisher, J.; Gazey, C.; Davies, S. Towards an understanding of variability in yield response to liming. In Proceedings of the 13th Australian Agronomy Conference. Perth, Australia, 10–14 September 2006; Turner, N., Acuna, T., Eds.; Available online: http://www.regional.org.au/au/asa/2006/concurrent/soil/4558_fisherj.htm#TopOfPage (accessed on 4 April 2018).
  29. Penny, S.; Gazey, C. Western Australia Soil Acidity—Demonstration Site Results 1996–2001. Misc Pub 24/2002; Department of Agriculture, State of Western Australia: South Perth, Western Australia, 2002.
  30. Government of South Australia. Soil Groups and Subgroup—Soils and Land Information Sheet. Government of South Australia, Department of Environment, Water and Natural Resources. 2012. Available online: http://www.environment.sa.gov.au/files/sharedassets/public/science/soil_and_land/kb-fact-soilgroups-subgroups.pdf (accessed on 16 May 2016).
  31. Rayment, G.; Lyons, D. Soil Chemical Methods: Australasia; CSIRO Publishing: Melbourne, Australia, 2011. [Google Scholar]
  32. Bromfield, S. Simple tests for the assessment of aluminium and manganese levels in acid soils. Aust. J. Exp. Agric. 1987, 27, 399–404. [Google Scholar] [CrossRef]
  33. Evans, C.N.; Scott, B.J.; Fisher, R.P.; Poile, G.J.; Conyers, M.K. Soil acidification and liming in the low rainfall Wheatbelt of south-western NSW. In Proceedings of the 10th Australian Agronomy Conference, Tasmania, Australia, 29 January–1 February 2001. [Google Scholar]
  34. Mead, A.; Dowling, P.; Chan, K.Y.; Hocking, P.; Scott, B. Lime response of winter crops on a duplex soil at Oolong in SE NSW. Solutions for a better environment. In Proceedings of the 11th Australian Agronomy Conference, Geelong, VIC, Australia, 2–6 February 2003; Available online: http://agronomyaustraliaproceedings.org/images/sampledata/2003/c/17/mead.pdf (accessed on 4 April 2018).
  35. Coventry, D.R.; Walker, B.R.; Morrison, G.R.; Hyland, M.T.; Averey, J.C.; Maden, J.J.L.; Bartram, D.C. Yield responses to lime of wheat and barley on acid soils in north-eastern Victoria. Aust. J. Exp. Agric. 1989, 29, 209–214. [Google Scholar] [CrossRef]
  36. Coventry, D.R.; Reeves, T.G.; Brooke, H.D.; Ellington, A.; Slattery, W.J. Increasing wheat yields in north-eastern Victoria by liming and deep ripping. Aust. J. Exp. Agric. 1987, 27, 679–685. [Google Scholar] [CrossRef]
  37. Coventry, D.R.; Slattery, W.J.; Burnett, V.F.; Ganning, G.W. Longevity of wheat yield response to lime in south-eastern Australia. Aust. J. Exp. Agric. 1997, 37, 571–575. [Google Scholar] [CrossRef]
  38. Coventry, D.R.; Hirth, J.R.; Reeves, T.G. Interactions of tillage and lime in wheat subterranean clover rotation on an acid sandy clay loam in south-eastern Australia. Soil Tillage Res. 1992, 25, 53–65. [Google Scholar] [CrossRef]
  39. Brooke, H.D.; Coventry, D.R.; Reeves, T.G.; Jarvis, D.K. Liming and deep ripping responses for a range of field crops. Plant. Soil 1989, 115, 1–6. [Google Scholar] [CrossRef]
  40. Isbell, R.F. The Australian Soil Classification; CSIRO Publishing: Collingwood, VIC, Australia, 1996. [Google Scholar] [CrossRef]
  41. Northcote, K.H. Factual Key for the Recognition of Australian Soils, 3rd ed.; Rellim Technical Publications: Glenside, Australia, 1971; Available online: http://hdl.handle.net/102.100.100/316622?index=1 (accessed on 4 April 2018).
  42. Holzworth, D.P.; Huth, N.I.; Devoil, P.G.; Zurcher, E.J.; Herrmann, N.I.; McLean, G.; Chenu, K.; van Oosterom, E.J.; Snow, V.; Murphy, C.; et al. APSIM—Evolution towards a new generation of agricultural systems simulation. Environ. Model. Softw. 2014, 62, 327–350. [Google Scholar] [CrossRef]
  43. French, R.J.; Schultz, J.E. Water use efficiency of wheat in a Mediterranean type environment. I. The relation between yield, water use and climate. Aust. J. Agric. Res. 1984, 35, 743–764. [Google Scholar] [CrossRef]
  44. Oliver, Y.M.; Robertson, M.J.; Stone, P.J.; Whitbread, A. Improving estimates of water-limited yield of wheat by accounting for soil type and within-season rainfall. Crop. Past. Sci. 2009, 60, 1137–1146. [Google Scholar] [CrossRef]
  45. Jeffrey, S.J.; Carter, J.O.; Moodie, K.B.; Beswick, A.R. Using spatial interpolation to construct a comprehensive archive of Australian climate data. Environ. Modell. Softw. 2001, 16, 309–330. [Google Scholar] [CrossRef]
  46. Dalgliesh, N.; Cocks, B.; Horan, H. APSoil—providing soils information for consultants and farmers. In Proceedings of the 16th Australian Agronomy Conference 2012, Armidale, NSW, Australia, 14–18 October 2012; Yunusa, I., Ed.; Australian Society of Agronomy: Armidale, NSW, Australia, 2012. [Google Scholar]
  47. Hochman, Z.; Gobbett, D.; Horan, H.; Navarro Garcia, J. Data rich yield gap analysis of wheat in Australia. Field Crops Res. 2016, 197, 97–106. [Google Scholar] [CrossRef]
  48. Van Ittersum, M.K.; Cassman, K.G.; Grassini, P.; Wolf, J.; Tittonell, P.; Hochman, Z. Yield gap analysis with local to global relevance—A review. Field Crops Res. 2013, 143, 4–17. [Google Scholar] [CrossRef] [Green Version]
  49. Farre, I.; Davies, S.; van Gool, D. Removal of a subsoil constraint—When does it pay? Presented at Food Security from Sustainable Agriculture. In Proceedings of the 15th Agronomy Conference, Lincoln, New Zealand, 15–18 November 2010; Available online: http://agronomyaustraliaproceedings.org/images/sampledata/2010/crop-production/subsoil/7097_farrei.pdf (accessed on 4 April 2018).
  50. Wong, M.T.F.; Asseng, S. Yield and environmental benefits of ameliorating subsoil constraints under variable rainfall in a Mediterranean environment. Plant. Soil 2007, 297, 29–42. [Google Scholar] [CrossRef]
  51. Scanlan, C.A.; Brennan, R.F.; D’Antuono, M.F.; Sarre, G. The interaction between soil pH and phosphorus for wheat yield and the impact of lime-induced changes to soil aluminium and potassium. Soil Res. 2017, 55, 341–353. [Google Scholar] [CrossRef]
  52. Azam, G.; Gazey, C. Slow movement of alkali from surface-applied limed warrants the introduction of strategic tillage for rapid amelioration of subsurface acidity in South-West Australia. Soil Res. 2021, 59, 97–106. [Google Scholar] [CrossRef]
Figure 1. Examples of the relative yield (RY) with decreasing xf (or reducing severity of root reduction) showing a flat response in 1991 (O) and a sharp response in 2000 (X). Data for a sandy soil at Bodallin (WA) with acidity at 0–0.3 m depth.
Agronomy 11 00829 g001
Figure 2. Frequency of relative yield increase after one or more year of lime applied for WA, NSW and VIC.
Agronomy 11 00829 g002
Figure 3. Change in soil pH (CaCl2) after liming in the 0–0.1 m (◊). 0.1–2 m (o) and 0.2–0.3 m (∆) layers with lime rate in WA cases (a) and NSW and Victoria cases (b). Error bars indicate +/− 1 standard deviation.
Agronomy 11 00829 g003
Figure 4. Change in soil pH (CaCl2) after liming in the 0–0.1 m (◊), 0.1–2 m (o) and 0.2–0.3 m (∆) layers with years since lime applied for the WA cases (a) and NSW and VIC cases (b). Error bars indicate +/− 1 standard deviation.
Agronomy 11 00829 g004
Figure 5. Relationship between relative yield increase and pH in 0–0.1 m (a) and 0.1–0.2 m (b) for trials in WA, NSW and VIC with wheat (X), barley (○) canola (□), lupin (∆), and when cases were responsive to lime (RYI > 0.05). Dotted lined indicates the pH cut-off values of pH 5 in the 0–0.1 m layers and pH 4.5 in the 0.1–0.2 m layers.
Agronomy 11 00829 g005
Table 1. Australian lime trial data from WA, NSW and Victoria arranged by crop type showing the number of cases (N), average yield, average pH in the unlimed treatment, average yield increase, maximum yield increase and increase in relative yield (one year after lime was applied). The references for the data from NSW and VIC are noted in the last column.
StateCropNumber of CasesAverage YieldAverage pH Unlimed (0–0.1 m)Average Yield Increase (%)Maximum Yield Increase (%)Increase in Relative Yield (%)Reference
WAWheat852.334.8612%56%8%
Barley161.864.7237%185%13%
Canola191.514.8119%126%7%
Lupin561.514.9111%51%4%
NSWWheat52.754.2936%144%13%[20,33,34]
Barley34.224.3243%82%25%[20]
Canola22.174.2912%88%6%[33,34]
VICWheat622.894.831%180%13%[26,35,36,37,38,39]
Barley73.164.5327%80%14%[35]
Field pea10.954.459%59%10%[39]
Lupin11.774.412% 5%[39]
Table 2. Soil used in the APSIM simulations for each state with their Australian classification, PAWC and APSOIL number.
StateMYSoil NameAustralia ClassificationPAWC to Depth APSOIL No
WAsand Bleached Orthic Tenosol79 mm to 1.8 m422
loamy sand Kandosol109 mm to 1.8 m400
deep sandy duplexChromosolSand = 28 mm to 0.4 m
zLoam = 46 mm 0.4 m to 1.8 m
508
NSWloamy sandKandosol129 mm to 1.8 m1035
loamy sandSodsol113 m to 1.5 m1037
VICsandy Clay Loam 171 mm to 1.6 m525
loam 121 mm to 1.6 m499
Table 3. Number of cases and increase in yield (%YI, %RY and L Max) with lime application from field trials from WA or NSW/VIC defined by relative yield of unlimed treatments as low (<0.5), medium (0.5–0.74) or high (>0.75)) yield potential and whether they were responsive to lime treatments.
Yield Response RegionNumber of Cases YI (%)RYI (%)L Max (t/ha)YearsSeasonSoil AmeliorationInterpretation
Low RY < 0.5
UnresponsiveWA22511.234.96Most ameliorated 0–0.1 m layerSevere constraint—not enough lime or multiple constraints.
NSW/VIC6211.922.20
ResponsiveWA1949162.084.84Majority had topsoil ameliorated but was still acidic at depthSevere constraint some amelioration by lime.
NSW/VIC1452132.682.44
Medium RY 0.51–0.74
UnresponsiveWA41610.623.411Many had topsoil or subsoil ameliorated Not enough lime, or acidity was not the major constraints.
NSW/VIC11431.641.43
ResponsiveWA3124132.63.84Majority had the topsoil ameliorated but still had an acid subsoil Acid constraint mostly removed—higher rates of lime at these sites.
NSW/VIC2543172.443.05
High RY > 0.75
UnresponsiveWA39410.792.914Many had topsoil or deeper amelioratedAcidity not constraining yield, or tolerant crops.
NSW/VIC9221.111.42
ResponsiveWA2416162.468.15Many had ameliorated both topsoil and subsoilMild acid constraint—mostly removed, with longest average time since lime
NSW/VIC2436212.273.83
Table 4. Effect of soil type on response to lime. Each case was classified for local soil type, average growing season rainfall (GSR), yield and relative yield on the unlimed treatments, and the yield increase and increase in relative yield on the limed treatments.
Local Soil TypeNumber of CasesNumber ResponsiveAverage of GSRYield UnlimedRY%YI%RYI
WA
Sandy earth58242551.870.72137
Coloured sand47312591.830.71178
Sandy duplex32102751.990.7696
Gravel26103291.790.64228
Pale sand614542.590.7732
Heavy soil (clay)742851.400.62126
NSW
Red kandosol842843.030.643817
Sodsol534452.000.39214
VIC
Sandy clay loam49423542.930.544017
Sandy clay loam, with a dense hardpan743333.010.562612
Clay loam423381.860.41155
Loam1683172.970.7295
Table 5. The effect of soil pH profile type and change in pH following liming on the unlimed yield and yield increase from liming (as %yield and %increase in relative yield) in trials from WA and NSW and VIC.
Unlimed pH ProfileProfile Change after LimingNumberYield Unlimed%YI%RYI
WA
Topsoil acidicTopsoil ameliorated211.6526%8%
Topsoil + subsoil acidicTopsoil ameliorated531.8717%9%
Top and subsoil ameliorated301.9715%9%
Subsoil acidicSubsoil ameliorated201.699%2%
No change52.6410%8%
Non-acidNo change111.773%2%
Not measured-361.9511%5%
Vic and NSW
Topsoil acidNot measured242.9513%8%
topsoil + subsoil acidTopsoil ameliorated292.3140%14%
ameliorated to 0.2 m72.2360%25%
no change42.1376%34%
Not measured152.5725%11%
Non-acid top, rest unknownNot measured102.5220%10%
Publisher’s Note: MDPI stays neutral with regard to jurisdictional claims in published maps and institutional affiliations.

