
Use of a Portable Rapid Analysis System to Measure Nitrate Concentration of Nutrient and Soil Solution, and Plant Sap in Greenhouse Vegetable Production


 ,
, 
Abstract
1. Introduction
2. Materials and Methods
2.1. Cropping Sites
2.1.1. Greenhouse 1
2.1.2. Greenhouse 2
2.2. Crops and Treatments
2.3. Collection and Handling of Samples
2.3.1. Nutrient Solution
2.3.2. Soil Solution
2.3.3. Petiole Sap
2.4. Analysis of Nitrate Concentration in Samples
2.4.1. Rapid Analysis System
2.4.2. Laboratory Analysis System
2.5. Statistical Analyses
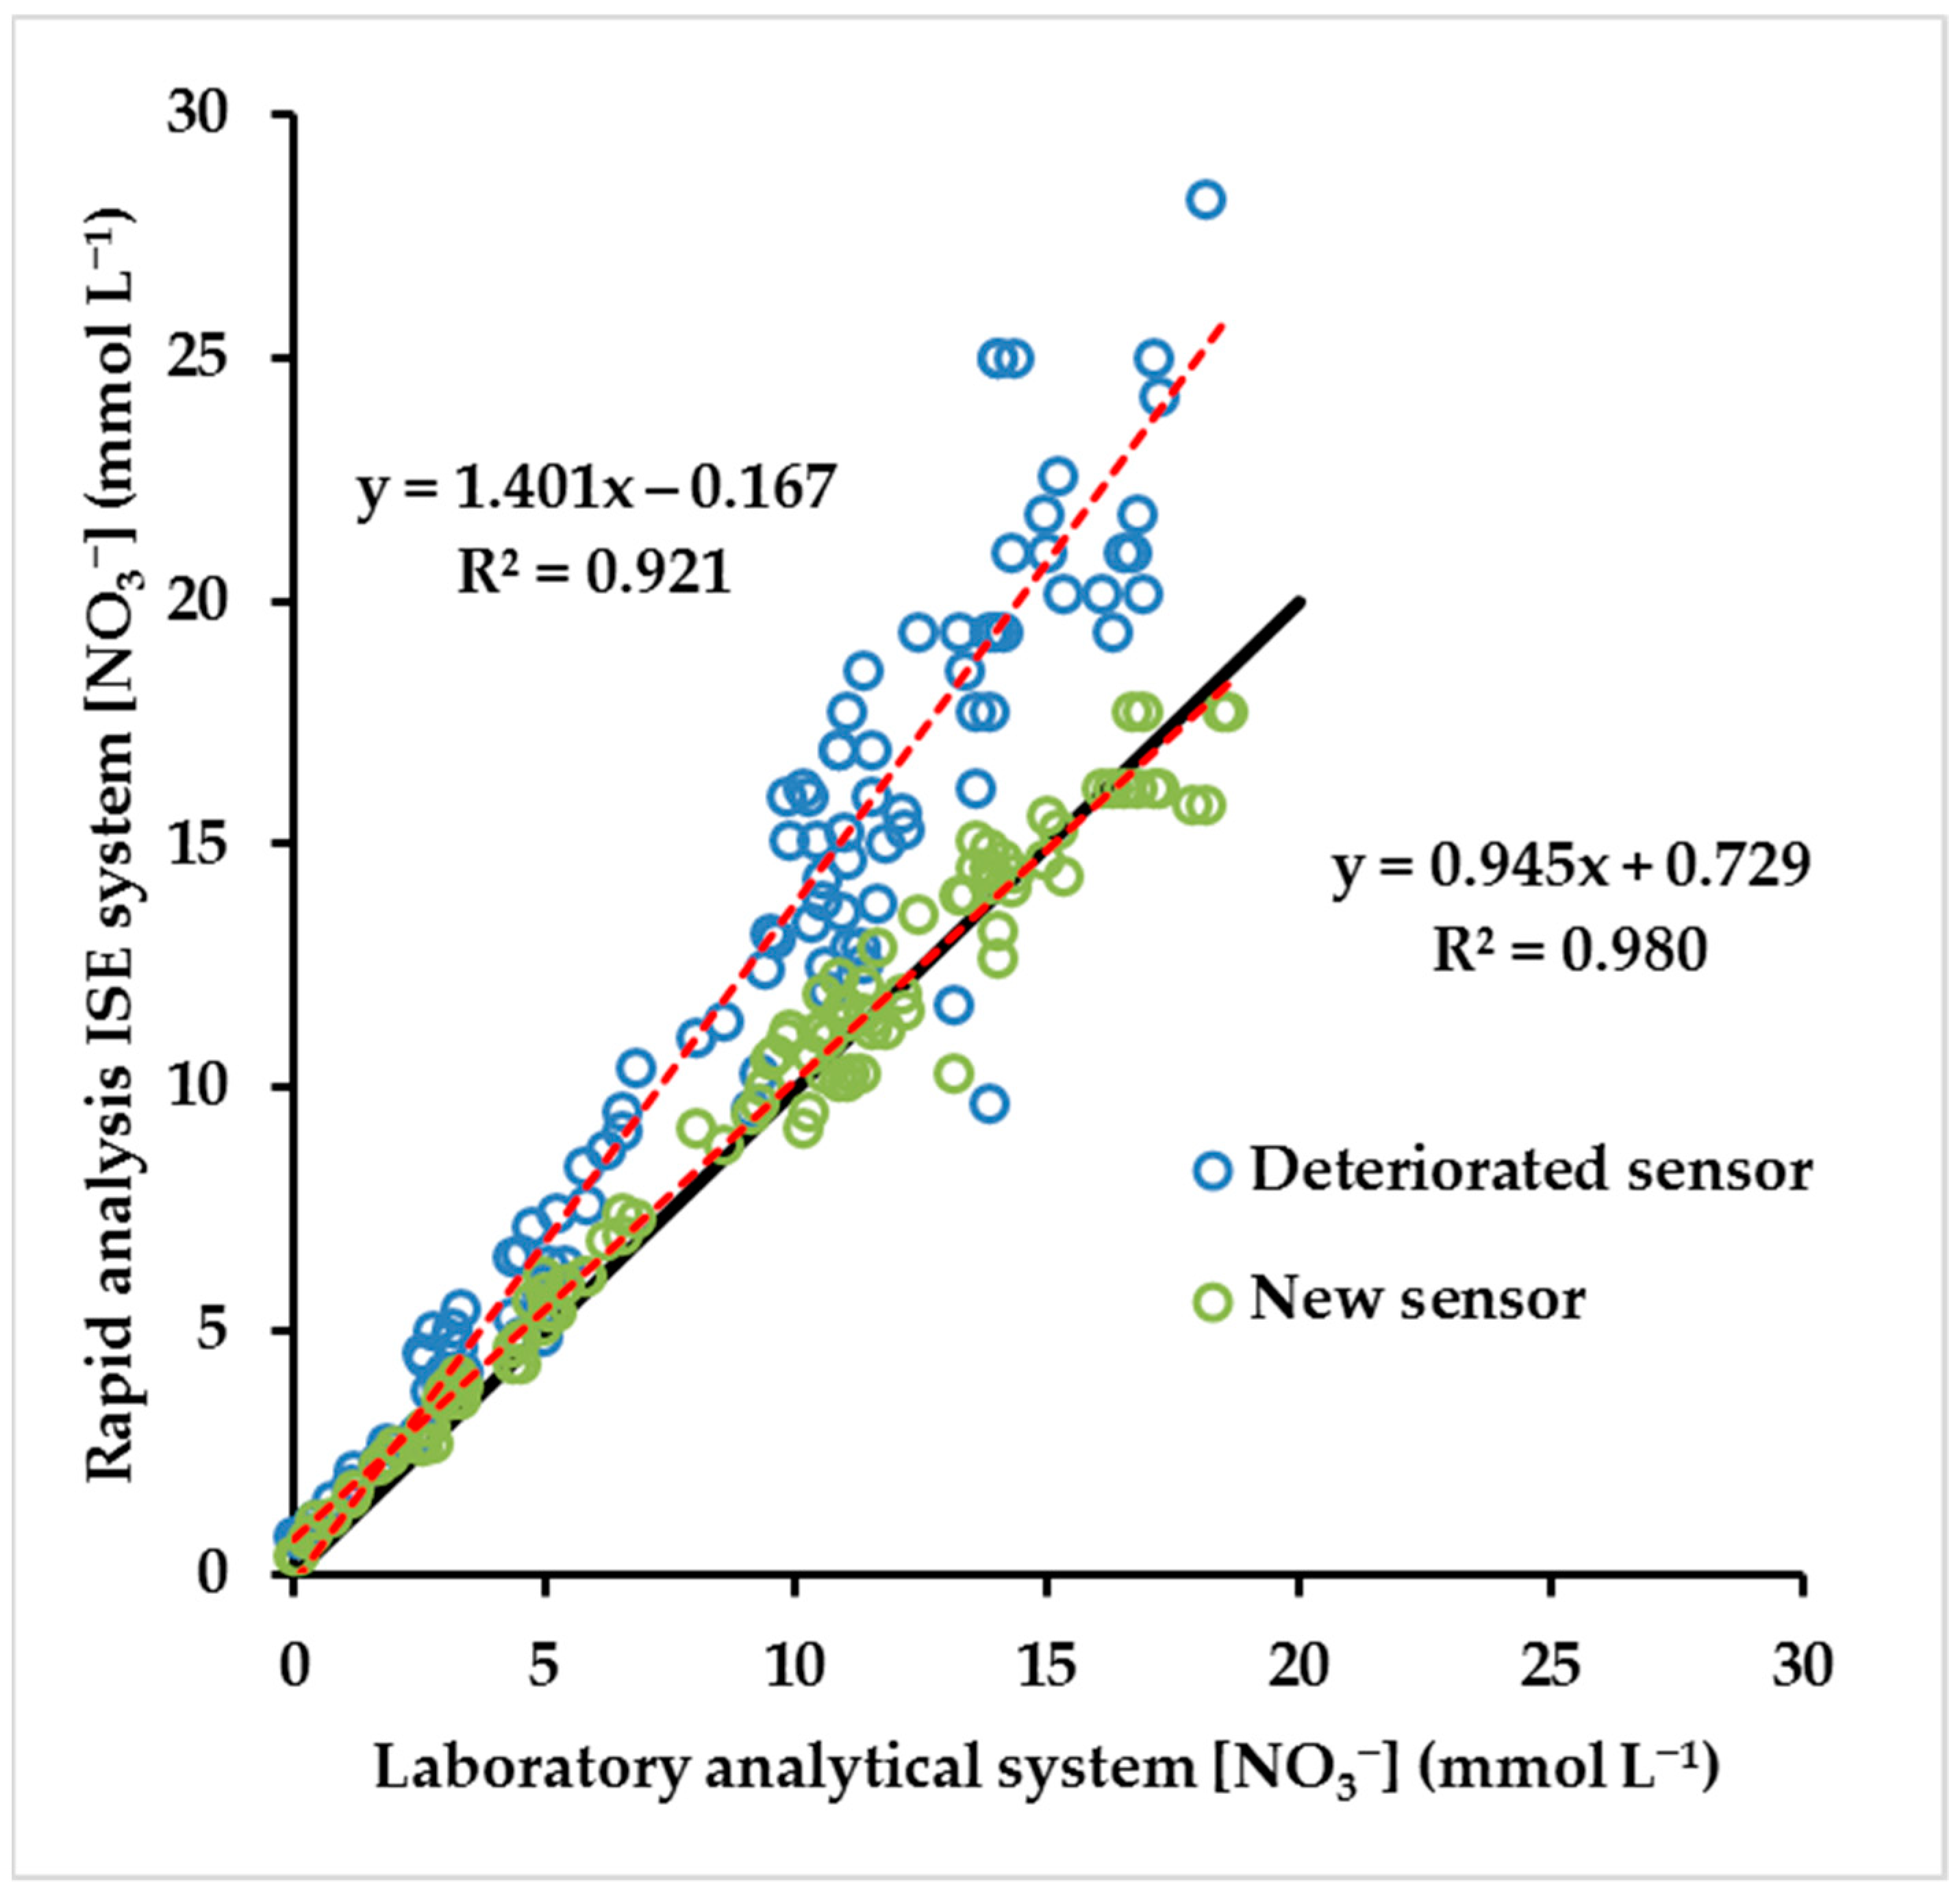
2.6. Examination of Effect of Sensor Deterioration
3. Results
3.1. Nutrient Solution
3.2. Soil Solution
3.3. Petiole Sap
3.3.1. Undiluted Sap
3.3.2. Diluted Sap
3.3.3. Direct Comparison of Results of Undiluted and Diluted Petiole Sap Both Measured with the Rapid Analysis System
3.4. Comparison of Results with LAQUAtwin Models B343 and NO3-11
3.5. Effect of Sensor Deterioration
4. Discussion
5. Conclusions
Author Contributions
Funding
Institutional Review Board Statement
Informed Consent Statement
Acknowledgments
Conflicts of Interest
References
- Papasolomontos, A.; Baudoin, W.; Lutaladio, N. Regional Working Group on Greenhouse Crop Production in the Mediterranean Region: History and development. In Good Agricultural Practices for Greenhouse Vegetable Crops, Principles for Mediterranean Climate Areas; Baudoin, W., Nono-Womdim, R., Lutaladio, N., Hodder, A., Eds.; FAO: Rome, Italy, 2013; pp. 1–20. Available online: http://www.fao.org/3/i3284e/i3284e.pdf (accessed on 21 April 2021).
- Thompson, R.B.; Gallardo, M.; Voogt, W. Optimizing nitrogen and water inputs for greenhouse vegetable production. Acta Hortic. 2015, 1107, 15–29. [Google Scholar] [CrossRef]
- Incrocci, L.; Thompson, R.B.; Fernandez-Fernandez, M.D.; De Pascale, S.; Pardossi, A.; Stanghellini, C.; Rouphael, Y.; Gallardo, M. Irrigation management of European greenhouse vegetable crops. Agric. Water Manag. 2020, 242, 106393. [Google Scholar] [CrossRef]
- Karaca, C. Current situation, problems and solution of protected cultivation in Antalya. In Current Researches in Agriculture, Forestry and Aquaculture Sciences; Atılgan, A., Saltuk, B., Eds.; Duvar: Izmir, Turkey, 2020; pp. 7–34. [Google Scholar]
- Bazza, T. Morocco’s Greenhouse Cultivation Grows Faster than Spain’s. Morocco World News. Available online: www.moroccoworldnews.com/2018/12/260332/moroccos-greenhouse-cultivation-spain/ (accessed on 13 December 2018).
- Qasim, W.; Xia, L.; Lin, S.; Wan, L.; Zhao, Y.; Butterbach-Bahl, K. Global greenhouse vegetable production systems are hotspots of soil N2O emissions and nitrogen leaching: A meta-analysis. Environ. Pollut. 2021, 272, 116372. [Google Scholar] [CrossRef]
- Min, J.; Zhang, H.; Shi, W. Optimizing nitrogen input to reduce nitrate leaching loss in greenhouse vegetable production. Agric. Water Manag. 2012, 111, 53–59. [Google Scholar] [CrossRef]
- Peña-Fleitas, M.T.; Thompson, R.; Gallardo, M.; Fernández-Fernández, M.D. Regional model of nitrate leaching for an intensive vegetable production system. In Proceedings of the Nitrogen, Environment and Vegetables, Proceedings of the NEV 2013, Turín, Italy, 15–17 April 2013; pp. 73–74. [Google Scholar]
- Wang, X.; Zou, C.; Gao, X.; Guan, X.; Zhang, Y.; Shi, X.; Chen, X. Nitrate leaching from open-field and greenhouse vegetable systems in China: A meta-analysis. Environ. Sci. Pollut. Res. 2018, 25, 31007–31016. [Google Scholar] [CrossRef]
- Thompson, R.B.; Gallardo, M.; Fernández-Fernández, M.D. Measurement of Nitrate Leaching in Commercial Vegetable Production in SE Spain. In Proceedings of the Nitrogen, Environment and Vegetables, Proceedings of the NEV 2013, Turín, Italy, 15–17 April 2013; pp. 67–69. [Google Scholar]
- Wang, X.; Zou, C.; Gao, X.; Guan, X.; Zhang, W.; Zhang, Y.; Shi, X.; Chen, X. Nitrous oxide emissions in Chinese vegetable systems: A meta-analysis. Environ. Pollut. 2018, 239, 375–383. [Google Scholar] [CrossRef]
- Ju, X.T.; Kou, C.L.; Zhang, F.S.; Christie, P. Nitrogen balance and groundwater nitrate contamination: Comparison among three intensive cropping systems on the North China Plain. Environ. Pollut. 2006, 143, 117–125. [Google Scholar] [CrossRef]
- Thompson, R.B.; Incrocci, L.; van Ruijven, J.; Massa, D. Reducing contamination of water bodies from European vegetable production systems. Agric. Water Manag. 2020, 240, 106258. [Google Scholar] [CrossRef]
- Anonymous. Council directive 91/676/EEC concerning the protection of waters against pollution caused by nitrates from agricultural sources. Off. J. Eur. Communities 1991, L135, 1–8. [Google Scholar]
- Bai, X.; Zhang, Z.; Cui, J.; Liu, Z.; Chen, Z.; Zhou, J. Strategies to mitigate nitrate leaching in vegetable production in China: A meta-analysis. Environ. Sci. Pollut. Res. 2020, 27, 18382–18391. [Google Scholar] [CrossRef]
- Wang, X.; Dou, Z.; Shi, X.; Zou, C.; Liu, D.; Wang, Z.; Guan, X.; Sun, Y.; Wu, G.; Zhang, B.; et al. Innovative management programme reduces environmental impacts in Chinese vegetable production. Nat. Food 2021, 2, 47–53. [Google Scholar] [CrossRef]
- Incrocci, L.; Massa, D.; Pardossi, A. New trends in the fertigation management of irrigated vegetable crops. Horticulturae 2017, 3, 37. [Google Scholar] [CrossRef]
- Thompson, R.B.; Incrocci, L.; Voogt, W.; Pardossi, A.; Magán, J.J. Sustainable irrigation and nitrogen management of fertigated vegetable crops. Acta Hortic. 2017, 1150, 363–378. [Google Scholar] [CrossRef]
- Lv, H.; Lin, S.; Wang, Y.; Lian, X.; Zhao, Y.; Li, Y.; Du, J.; Wang, Z.; Wang, J.; Butterbach-Bahl, K. Drip fertigation significantly reduces nitrogen leaching in solar greenhouse vegetable production system. Environ. Pollut. 2019, 245, 694–701. [Google Scholar] [CrossRef] [PubMed]
- Thompson, R.B.; Tremblay, N.; Fink, M.; Gallardo, M.; Padilla, F.M. Tools and Strategies for Sustainable Nitrogen Fertilisation of Vegetable Crops. In Advances in Research on Fertilization Management of Vegetable Crops; Tei, F., Nicola, S., Benincasa, P., Eds.; Springer: Cham, Switzerland, 2017; pp. 11–63. [Google Scholar]
- Padilla, F.M.; Farneselli, M.; Gianquinto, G.; Tei, F.; Thompson, R.B. Monitoring nitrogen status of vegetable crops and soils for optimal nitrogen management. Agric. Water Manag. 2020, 241, 106356. [Google Scholar] [CrossRef]
- Granados, M.R.; Thompson, R.B.; Fernández, M.D.; Martínez-Gaitán, C.; Gallardo, M. Prescriptive-corrective nitrogen and irrigation management of fertigated and drip-irrigated vegetable crops using modeling and monitoring approaches. Agric. Water Manag. 2013, 119, 121–134. [Google Scholar] [CrossRef]
- Peña-Fleitas, M.T.; Gallardo, M.; Thompson, R.B.; Farneselli, M.; Padilla, F.M. Assessing crop N status of fertigated vegetable crops using plant and soil monitoring techniques. Ann. Appl. Biol. 2015, 167, 387–405. [Google Scholar] [CrossRef] [PubMed]
- Rodríguez, A.; Peña-fleitas, M.T.; Padilla, F.M.; Gallardo, M.; Thompson, R.B. Soil Monitoring Methods to Assess Immediately Available Soil N for Fertigated Sweet Pepper. Agronomy 2020, 10, 2000. [Google Scholar] [CrossRef]
- Hochmuth, G. Plant Petiole Sap-Testing for Vegetable Crops. Available online: https://edis.ifas.ufl.edu/pdffiles/CV/CV00400.pdf (accessed on 21 April 2021).
- Farneselli, M.; Tei, F.; Simonne, E. Reliability of Petiole Sap Test for N Nutritional Status Assessing in Processing Tomato. J. Plant Nutr. 2014, 37, 270–278. [Google Scholar] [CrossRef]
- Rodríguez, A.; Peña-Fleitas, M.T.; Padilla, F.M.; Gallardo, M.; Thompson, R.B. Petiole sap nitrate concentration to assess crop nitrogen status of greenhouse sweet pepper. Sci. Hortic. 2021, 285, 110157. [Google Scholar] [CrossRef]
- Parks, S.E.; Irving, D.E.; Milham, P.J. A critical evaluation of on-farm rapid tests for measuring nitrate in leafy vegetables. Sci. Hortic. 2012, 134, 1–6. [Google Scholar] [CrossRef]
- Horiba Scientific LAQUAtwin Instruction Manual (Operation), Compact Water Quality Meter LAQUAtwin-NO3-11, LAQUAtwin-NO3-11C, LAQUAtwin-NO3-11S, HORIBA Advanced Techno Co. 2017. Available online: https://www.horiba.com/us/en/application/material-property-characterization/water-analysis/water-quality-electrochemistry-instrumentation/compact/details/laquatwin-no3-11c-no3-11s-no3-11-32579/ (accessed on 7 December 2020).
- Di Gioia, F.; Simonne, E.H.; Gonnella, M.; Santamaria, P.; Gazula, A.; Sheppard, Z. Assessment of ionic interferences to nitrate and potassium analyses with ion-selective electrodes. Commun. Soil Sci. Plant Anal. 2010, 41, 1750–1768. [Google Scholar] [CrossRef]
- Hartz, T.K.; Smith, R.F.; LeStrange, M.; Schulbach, K.F. On-farm monitoring of soil and crop nitrogen status by nitrate-selective electrode. Commun. Soil Sci. Plant Anal. 1993, 24, 2607–2615. [Google Scholar] [CrossRef]
- Tully, K.L.; Weil, R. Ion-selective electrode offers accurate, inexpensive method for analyzing soil solution nitrate in remote regions. Commun. Soil Sci. Plant Anal. 2014, 45, 1974–1980. [Google Scholar] [CrossRef]
- Cabrera, F.J.; Bonachela, S.; Fernández, M.D.; Granados, M.R.; López, J.C. Lysimetry methods for monitoring soil solution electrical conductivity and nutrient concentration in greenhouse tomato crops. Agric. Water Manag. 2016, 178, 171–179. [Google Scholar] [CrossRef]
- Rosen, C.J.; Errebhi, M.; Wang, W. Testing petiole sap for nitrate and potassium: A comparison of several analytical procedures. HortScience 1996, 31, 1173–1176. [Google Scholar] [CrossRef]
- Rodrigo, M.C.; Ginestar, M.; Boix, M.; Ramos, C. Evaluation of rapid methods for nitrate plant sap analysis of globe artichoke grown in sand culture. Acta Hortic. 2005, 697, 393–397. [Google Scholar] [CrossRef]
- Valera, L.D.; Belmonte, L.J.; Molina, F.D.; López, A. Greenhouse Agriculture in Almeria, A Comprehensive Techno-Economic Analysis; Cajamar Caja Rural: Almeria, Spain, 2016. [Google Scholar]
- Thompson, R.B.; Martínez-Gaitán, C.; Gallardo, M.; Giménez, C.; Fernández, M.D. Identification of irrigation and N management practices that contribute to nitrate leaching loss from an intensive vegetable production system by use of a comprehensive survey. Agric. Water Manag. 2007, 89, 261–274. [Google Scholar] [CrossRef]
- Soto, F.; Gallardo, M.; Giménez, C.; Peña-Fleitas, T.; Thompson, R.B. Simulation of tomato growth, water and N dynamics using the EU-Rotate_N model in Mediterranean greenhouses with drip irrigation and fertigation. Agric. Water Manag. 2014, 132, 46–59. [Google Scholar] [CrossRef]
- Rodríguez, A.; Peña-Fleitas, M.T.; Gallardo, M.; de Souza, R.; Padilla, F.M.; Thompson, R.B. Sweet pepper and nitrogen supply in greenhouse production: Critical nitrogen curve, agronomic responses and risk of nitrogen loss. Eur. J. Agron. 2020, 117, 126046. [Google Scholar] [CrossRef]
- Gallardo, M.; Padilla, F.M.; Peña-Fleitas, M.T.; de Souza, R.; Rodríguez, A.; Thompson, R.B. Crop response of greenhouse soil-grown cucumber to total available N in a Nitrate Vulnerable Zone. Eur. J. Agron. 2020, 114, 125993. [Google Scholar] [CrossRef]
- Mulvaney, R. Nitrogen—inorganic forms. In Methods of Soil Analysis, Part 3, Chemical Methods; Sparks, D.L., Page, A.L., Helmke, P.A., Loeppert, R.H., Soltanpour, P.N., Tabatabai, M.A., Johnston, C.T., Sumner, M.E., Eds.; Soil Society of America: Madison, WI, USA, 1996; pp. 1123–1184. [Google Scholar]
- Ott-Borrelli, K.A.; Koenig, R.T.; Miles, C.A. A comparison of rapid potentiometric and colorimetric methods for measuring tissue nitrate concentrations in leafy green vegetables. Horttechnology 2009, 19, 439–444. [Google Scholar] [CrossRef]
- Thompson, R.B.; Gallardo, M.; Joya, M.; Segovia, C.; Martínez-Gaitán, C.; Granados, M.R. Evaluation of rapid analysis systems for on-farm nitrate analysis in vegetable cropping. Span. J. Agric. Res. 2009, 7, 200–211. [Google Scholar] [CrossRef]
- Maggini, R.; Carmassi, G.; Incrocci, L.; Pardossi, A. Evaluation of quick test kits for the determination of nitrate, ammonium and phosphate in soil and in hydroponic nutrient solutions. Agrochimica 2010, 54, 331–341. [Google Scholar]


| Crop Identifier (Species, Year of Planting as YY) | Crop Type | Cultivar/s | Greenhouse (GH) | Crop Start Date | Crop End Date | N Treatments (mmol L−1) | Start N Treatment (DAT) | Reference Describing Crop and N Treatments |
|---|---|---|---|---|---|---|---|---|
| Tomato 10 | Cluster | Razimo | GH1 | 5 August 2010 | 25 January 2011 | 0.8, 4.2, 12.4, 18.4 | 26 | [38] |
| Pepper 14 | Sweet, Bell | Melchor | GH1 | 12 August 2014 | 29 January 2015 | 2.4, 6.2, 12.6, 16.1, 20.0 | 1 | [39] |
| Pepper 16 | Sweet, Bell | Melchor | GH1 | 19 July 2016 | 24 March 2017 | 2.0, 5.3, 9.7, 13.5, 17.7 | 9 | [39] |
| Cucumber 17 | Dutch | Strategos, Pradera, Mitre | GH2 | 30 March 2017 | 22 June 2017 | 4.8, 9.7, 19.0 | 9 | M.T. Peña-Fleitas, unpublished data |
| Pepper 17 | Sweet, Bell | Melchor | GH1 | 21 July 2017 | 20 February 2018 | 2.0, 5.7, 9.7, 13.1, 16.7 | 10 | [39] |
| Cucumber 18 | Dutch | Strategos, Pradera, Mitre | GH1 | 24 April 2018 | 3 July 2018 | 2.4, 8.5, 14.8 | 9 | [40] |
| Melon 20 | Cantaloupe | Tezac, Magiar, Jacobo | GH1 | 27 February 2020 | 11 June 2020 | 2.7, 8.3, 14.0 | 1 | M.T. Peña-Fleitas, unpublished data |
| Crop Identifier (as in Table 1) | Nutrient Solution—No. of Samples | Nutrient Solution—Sampling Frequency | Soil Solution—No. of Samples | Soil Solution—Sampling Frequency | Undiluted Petiole Sap—No. of Samples | Diluted Petiole Sap—No. of Samples | Diluted Petiole Sap—Dilution Factor | Petiole Sap—Sampling Frequency |
|---|---|---|---|---|---|---|---|---|
| Tomato 10 | n.a. | n.a. | n.a. | n.a. | n.a. | 56 1 | 1:5 | Two weekly 1 |
| Pepper 14 | 661 | 3 times/week | 144 | Weekly | 319 | n.a. | n.a. | Weekly |
| Pepper 16 | 360 2 | 3–4 times/week 2 | 262 | Weekly 2 | 160 2 | 160 2 | 1:10 | Two weekly 2 |
| Cucumber 17 | 46 3 | 2 times/week | 27 3 | Two weekly | 214 | 214 | 1:5 | Two weekly |
| Pepper 17 | 773 | 3 times/week | 194 | Two weekly | 180 | 200 | 1:10 | Two weekly |
| Cucumber 18 | 170 | 2 times per week | 170 | Weekly | 252 | 252 | 1:5 | Weekly |
| Melon 20 | n.a. | n.a. | n.a. | n.a. | 300 | 300 | 1:10 | Weekly |
| Total numbers of samples | 2010 | n.a. | 797 | n.a. | 1425 | 1182 | n.a. | n.a. |
| Crop | Number of Samples | Equation | R2 Value | 1 Relative Error All Values (%) | Relative Error, Values > 5 mmol L−1 (%) |
|---|---|---|---|---|---|
| Pepper 14 | 661 | y = 0.977x + 0.826 | 0.949 | 16 | 11 |
| Pepper 16 | 360 | y = 0.956x + 0.889 | 0.967 | 12 | 9 |
| Cucumber 17 | 46 | y = 0.946x + 0.947 | 0.995 | 10 | 7 |
| Pepper 17 | 773 | y = 0.998x + 0.695 | 0.968 | 13 | 10 |
| Cucumber 18 | 170 | y = 1.004x + 0.352 | 0.979 | 8 | 8 |
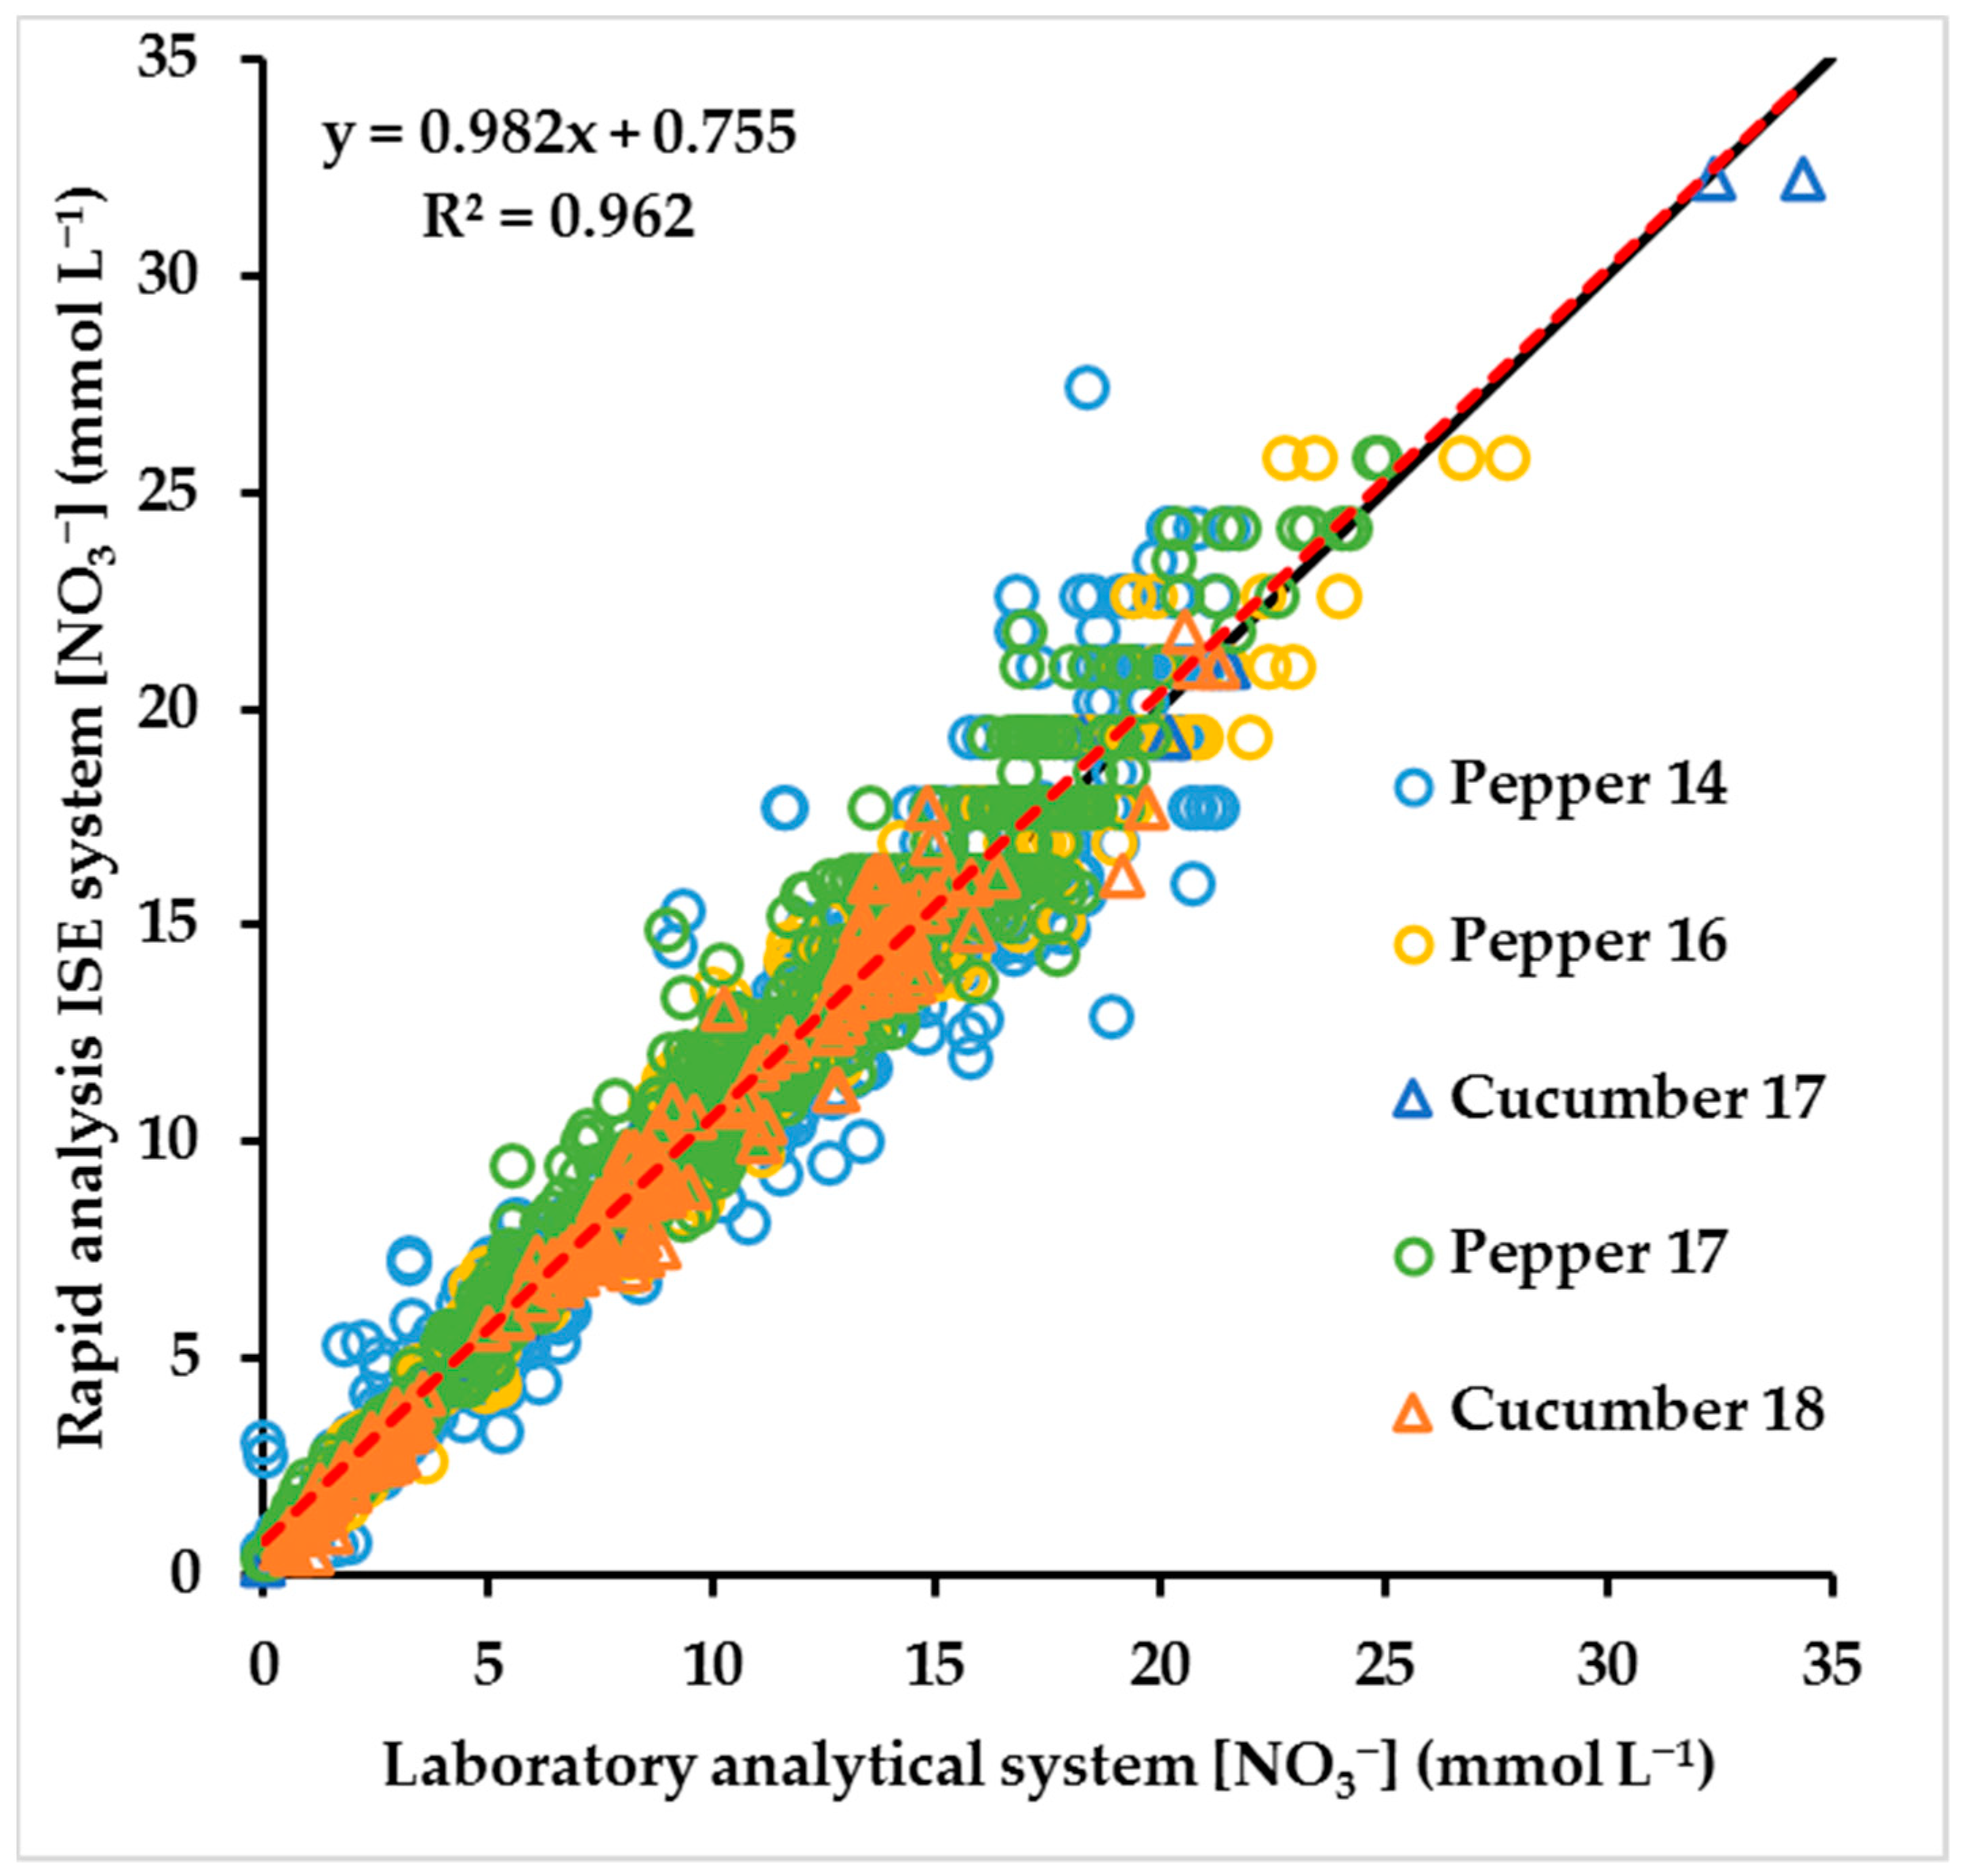
| All samples | 2010 | y = 0.982x + 0.755 | 0.962 | 14 | 10 |
| Crop | Number of Samples | Equation | R2 Value | 1 Relative Error (%) | 1 Relative Error, Values >2 mmol L−1 (%) | 1 Relative Error, Values >5 mmol L−1 (%) |
|---|---|---|---|---|---|---|
| Pepper 14 | 144 | y = 0.935x + 1.761 | 0.964 | 11 | 11 | 11 |
| Pepper 16 | 160 | y = 0.973x + 1.463 | 0.960 | 28 | 19 | 14 |
| Cucumber 17 | 27 | y = 1.010x + 1.217 | 0.810 | 14 | 10 | 9 |
| Pepper 17 | 194 | y = 0.992x + 0.970 | 0.967 | 37 | 16 | 14 |
| Cucumber 18 | 170 | y = 1.004x + 0.352 | 0.979 | 12 | 9 | 8 |
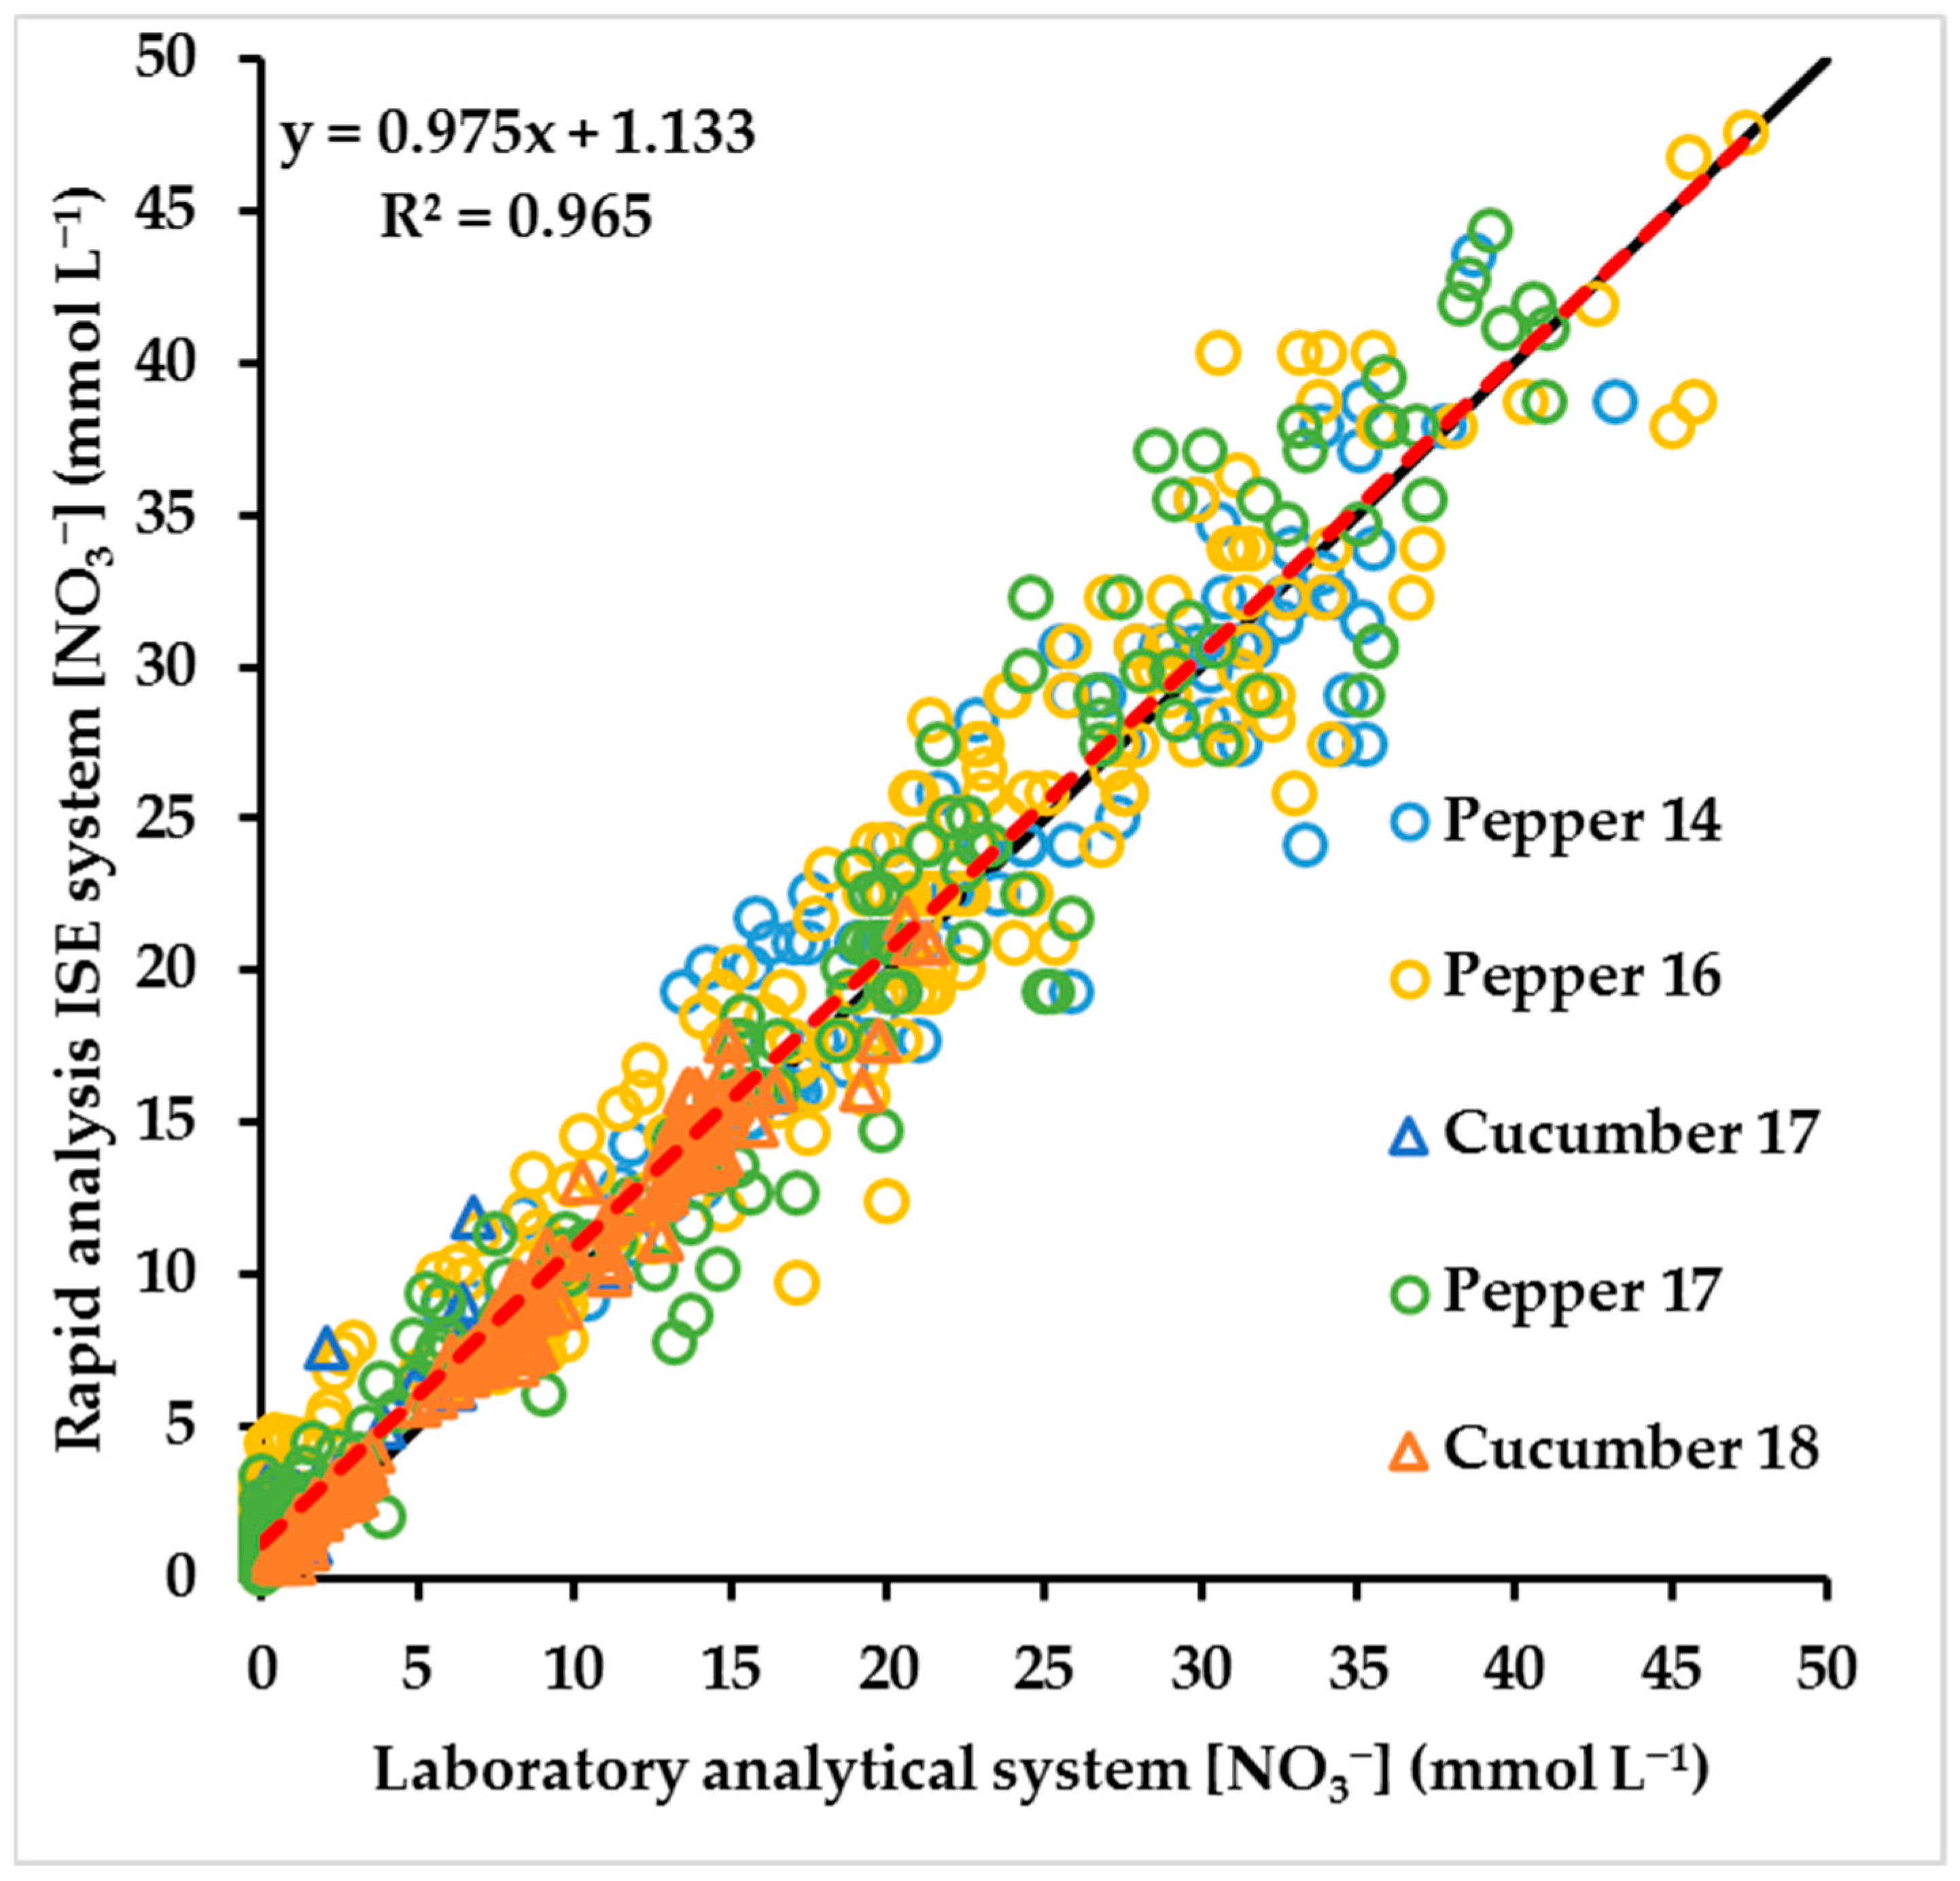
| All samples | 797 | y = 0.975x + 1.133 | 0.965 | 22 | 14 | 12 |
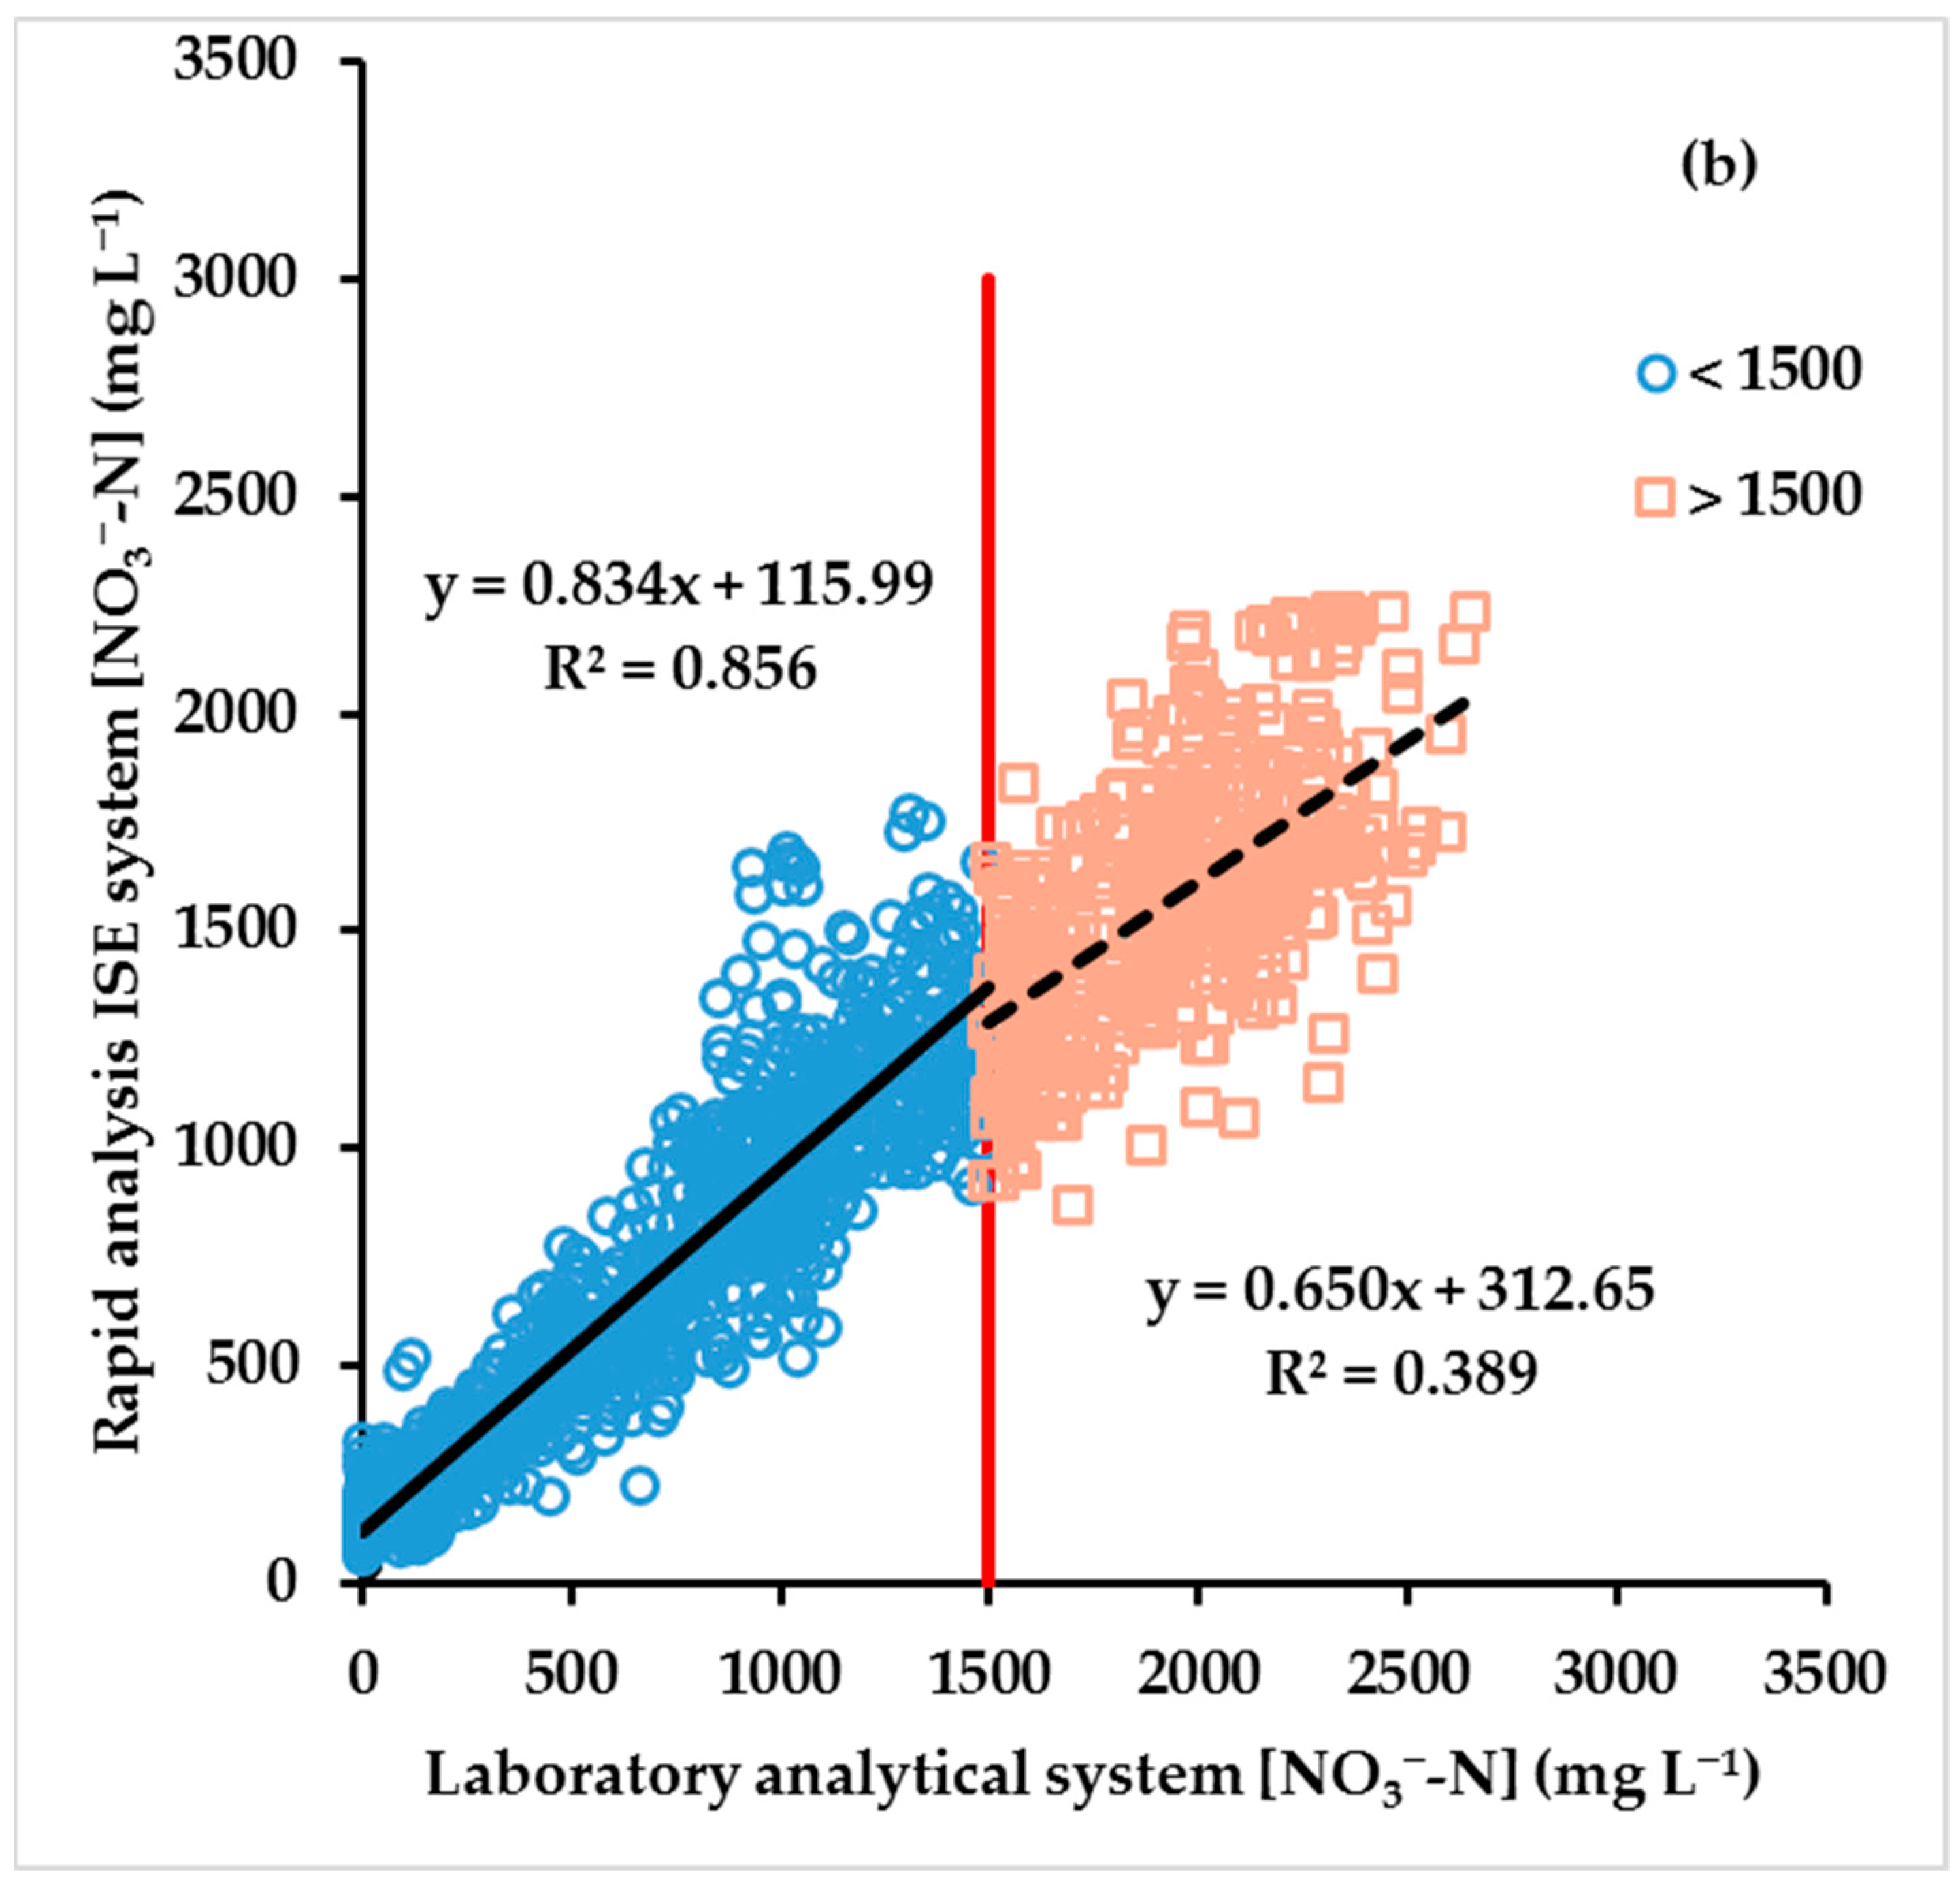
| Crop | Number of Samples | Percentage of Samples with >1500 mg NO3−–N L−1 (%) | Equation | R2 Value | 1 Relative Error (%) | 1 Relative Error, Values >200 mg NO3−–N L−1 (%) |
|---|---|---|---|---|---|---|
| Pepper 14 | 319 | 55 | y = 0.707x + 117.78 | 0.925 | 29 | 21 |
| Pepper 16 | 160 | 53 | y = 0.725x + 228.90 | 0.865 | 24 | 18 |
| Cucumber 17 | 214 | 15 | y = 0.866x + 128.80 | 0.885 | 12 | 11 |
| Pepper 17 | 180 | 57 | y = 0.756x + 184.21 | 0.923 | 27 | 17 |
| Cucumber 18 | 252 | 18 | y = 0.946x + 146.61 | 0.879 | 36 | 27 |
| Melon 20 | 300 | 10 | y = 0.777x + 65.74 | 0.886 | 18 | 17 |
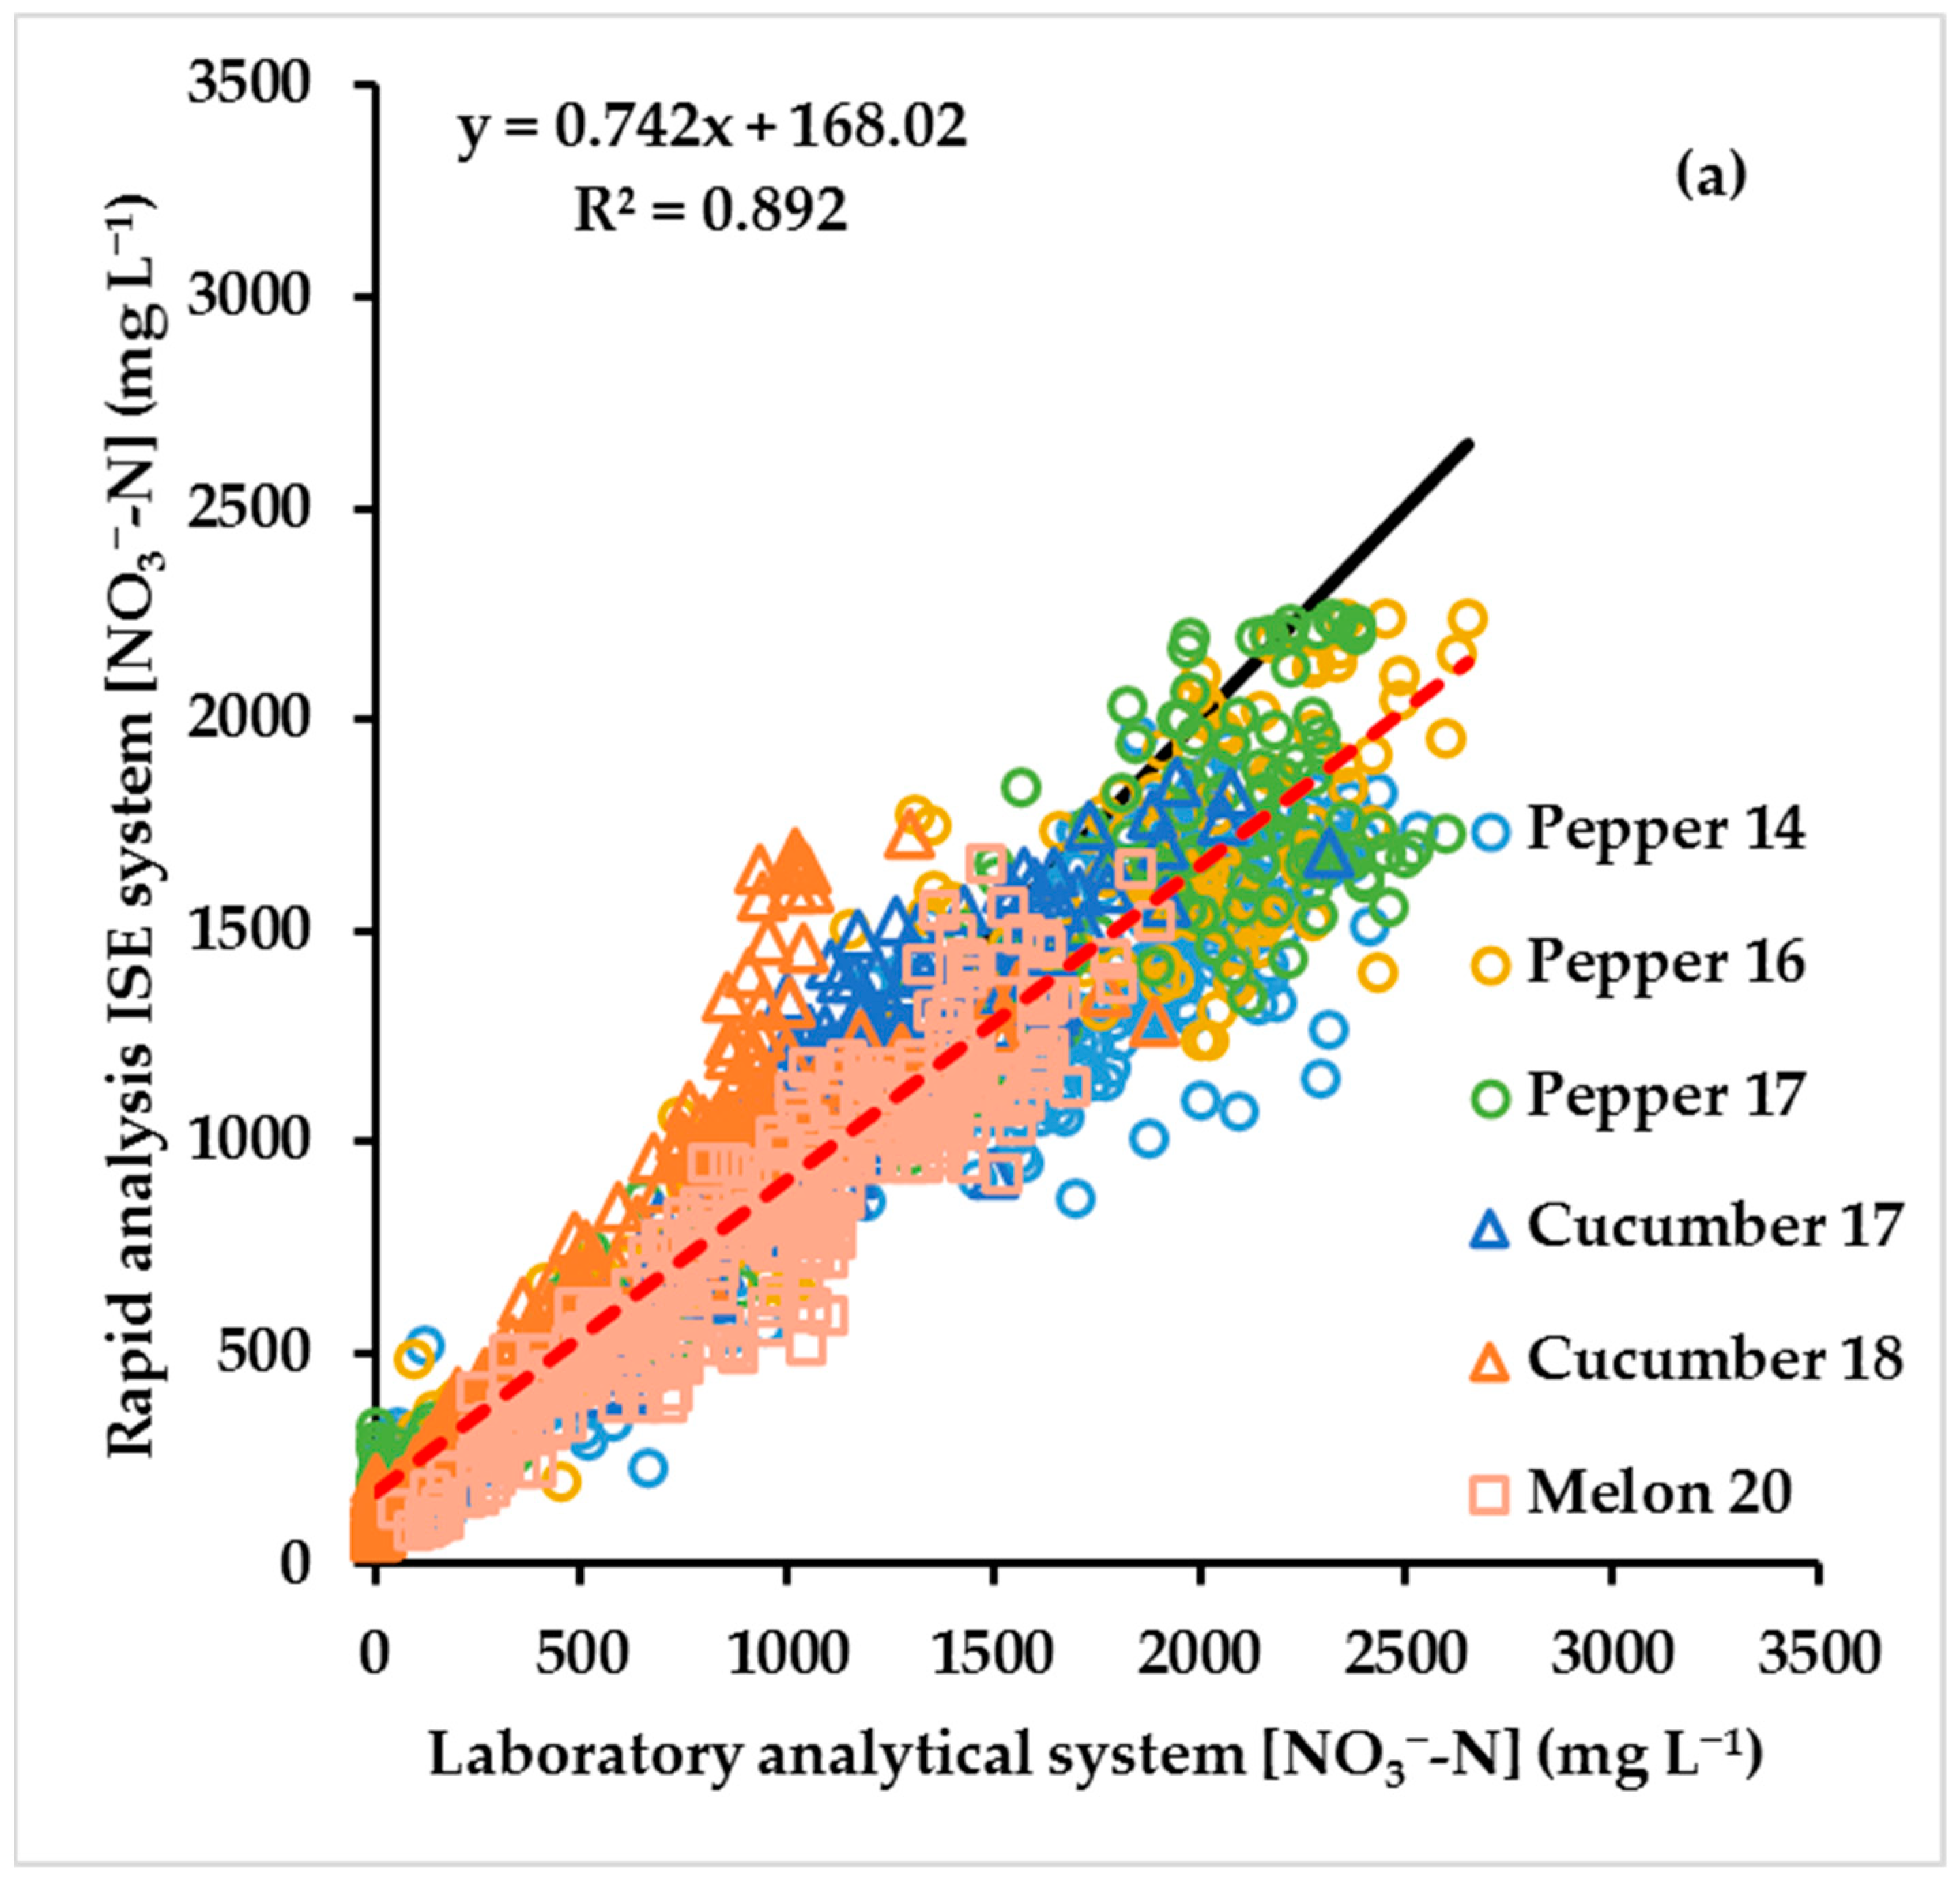
| All samples | 1425 | 33 | y = 0.742x + 168.02 | 0.892 | 24 | 18 |
| Crop | Number of Samples | Equation | R2 Value | 1 Relative Error (%) | 1 Relative Error, Values > 200 mg NO3−–N L−1 (%) |
|---|---|---|---|---|---|
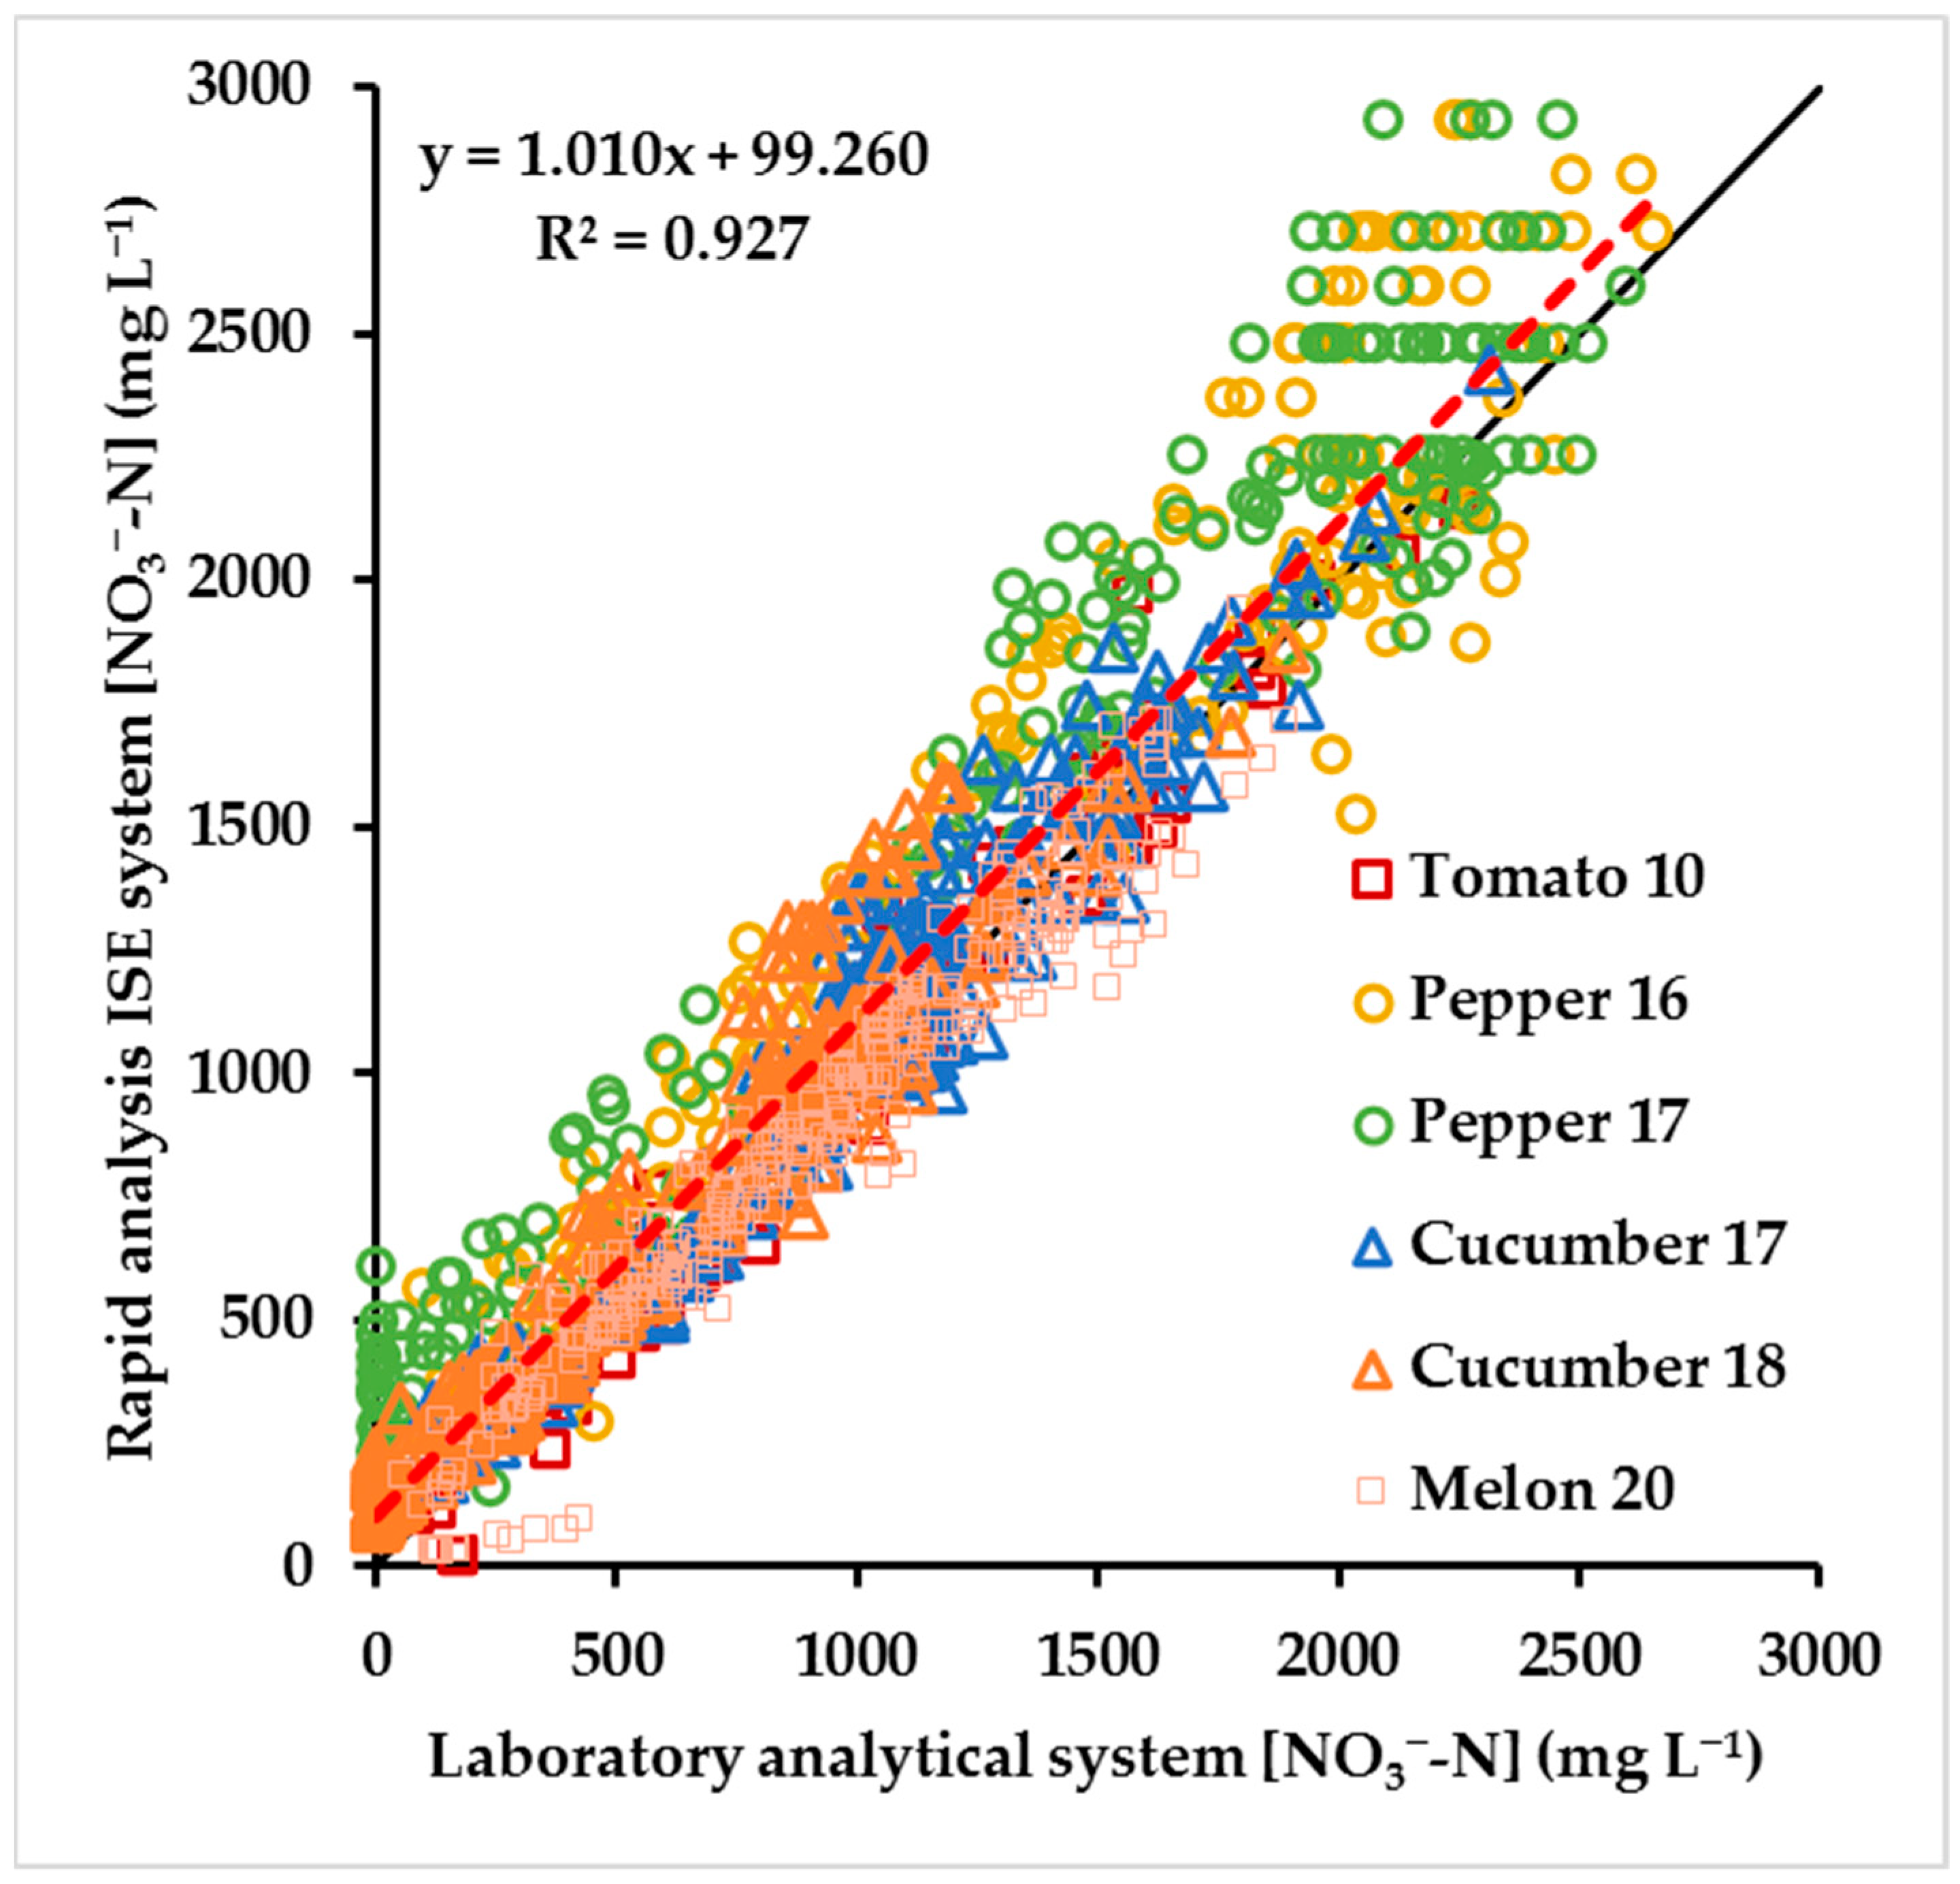
| Tomato 10 | 56 | y = 1.041x − 33.53 | 0.959 | 13 | 10 |
| Pepper 16 | 160 | y = 0.981x + 265.79 | 0.898 | 32 | 25 |
| Cucumber 17 | 214 | y = 1.007x + 60.44 | 0.940 | 13 | 11 |
| Pepper 17 | 200 | y = 0.965x + 308.16 | 0.946 | 51 | 28 |
| Cucumber 18 | 252 | y = 0.978x + 128.86 | 0.944 | 31 | 20 |
| Melon 20 | 300 | y = 0.912x + 75.11 | 0.937 | 14 | 12 |
| All samples | 1182 | y = 1.010x + 99.26 | 0.927 | 25 | 17 |
| Material | Model ISE | No. Samples | Equation | R2 Value | 1 Relative Error (%) | Relative Error, Values > 5 mmol L−1 (%) |
|---|---|---|---|---|---|---|
| Nutrient solution | B-343 | 1067 | y = 0.968x + 0.85 | 0.957 | 14 | 10 |
| Nutrient solution | NO3-11 | 943 | y = 1.002x + 0.61 | 0.970 | 13 | 9 |
| Soil solution | B-343 | 433 | y = 0.960x +1.54 | 0.962 | 21 | 13 |
| Soil solution | NO3-11 | 364 | y = 0.998x + 0.66 | 0.969 | 23 | 11 |
| Material | Model ISE | Number of Samples | Equation | R2 Value | 1 Relative Error (%) | Relative Error, Values > 200 mg NO3−–N L−1 (%) |
|---|---|---|---|---|---|---|
| Undiluted sap | B-343 | 693 | y = 0.720x + 187.13 | 0.880 | 18 | 17 |
| Undiluted sap | NO3-11 | 732 | y = 0.770x + 150.60 | 0.892 | 25 | 20 |
| Diluted sap | B-343 | 430 | y = 1.045 + 70.46 | 0.916 | 20 | 16 |
| Diluted sap | NO3-11 | 752 | y = 0.989 + 110.44 | 0.927 | 29 | 18 |
Publisher’s Note: MDPI stays neutral with regard to jurisdictional claims in published maps and institutional affiliations. |
© 2021 by the authors. Licensee MDPI, Basel, Switzerland. This article is an open access article distributed under the terms and conditions of the Creative Commons Attribution (CC BY) license (https://creativecommons.org/licenses/by/4.0/).
Share and Cite
Peña-Fleitas, M.T.; Gallardo, M.; Padilla, F.M.; Rodríguez, A.; Thompson, R.B. Use of a Portable Rapid Analysis System to Measure Nitrate Concentration of Nutrient and Soil Solution, and Plant Sap in Greenhouse Vegetable Production. Agronomy 2021, 11, 819. https://doi.org/10.3390/agronomy11050819
Peña-Fleitas MT, Gallardo M, Padilla FM, Rodríguez A, Thompson RB. Use of a Portable Rapid Analysis System to Measure Nitrate Concentration of Nutrient and Soil Solution, and Plant Sap in Greenhouse Vegetable Production. Agronomy. 2021; 11(5):819. https://doi.org/10.3390/agronomy11050819
Chicago/Turabian StylePeña-Fleitas, M. Teresa, Marisa Gallardo, Francisco M. Padilla, Alejandra Rodríguez, and Rodney B. Thompson. 2021. "Use of a Portable Rapid Analysis System to Measure Nitrate Concentration of Nutrient and Soil Solution, and Plant Sap in Greenhouse Vegetable Production" Agronomy 11, no. 5: 819. https://doi.org/10.3390/agronomy11050819
APA StylePeña-Fleitas, M. T., Gallardo, M., Padilla, F. M., Rodríguez, A., & Thompson, R. B. (2021). Use of a Portable Rapid Analysis System to Measure Nitrate Concentration of Nutrient and Soil Solution, and Plant Sap in Greenhouse Vegetable Production. Agronomy, 11(5), 819. https://doi.org/10.3390/agronomy11050819