Abstract
Irrigation helps grow agricultural crops in dry areas and during periods of inadequate rainfall. Proper irrigation could improve both crop productivity and produce quality. For high density apple orchards, water relations are even more important. Most irrigation in tree fruit orchards is applied based on grower’s experience or simple observations, which may lead to over- or under-irrigation. To investigate an effective irrigation strategy in high-density apple orchard, three irrigation methods were tested including soil moisture-based, evapotranspiration (ET)-based and conventional methods. In soil moisture-based irrigation, soil water content and soil water potential sensors were measured side by side. In ET-based irrigation, daily ET (ETc) and accumulated water deficit were calculated. Conventional method was based on the experience of the operator. The experiment was conducted from early June through middle of October (one growing season). Lastly, water consumption, fruit yield and fruit quality were analyzed for these irrigation strategies. Results indicated that the soil moisture-based irrigation used least water, with 10.8% and 4.8% less than ET-based and conventional methods, respectively. The yield from the rows with the soil moisture-based irrigation was slightly higher than the other two, while the fruit quality was similar. The outcome from this study proved the effectiveness of using soil moisture sensors for irrigation scheduling and could be an important step for future automatic irrigation system.
1. Introduction
Pennsylvania is the fourth largest apple producing state in the country and also a commercial producer of many other tree fruit crops including peaches, nectarines, pears and cherries [1]. In Pennsylvania, the precipitation averages 940 mm each year, with 330 mm of this precipitation running off directly into streams, while 610 mm infiltrates the soil where it may be used by crops [2]. Uneven precipitation may cause plant stress during critical growth periods affecting both crop productivity and quality. Most tree fruit orchards require supplemental irrigation to minimize plant stress and increase yield and/or quality. For example, when poor tree growth in a newly planted orchard results from inadequate water availability, maximum cropping may be delayed for years, peak investment is increased by 20% and total profits could be reduced by 66% over the 20-year life of the orchard [3].
The irrigation is even more important for high density fruit orchards [4]. In the Mid-Atlantic region, drip irrigation has been widely used for tree fruit orchards. Drip irrigation is the most efficient way to apply water and is suitable to all soil types because of its extremely slow application rate and high degree of control over timing and dosage. It achieves normally about 90% of irrigation efficiency compared to about 70% for sprinkler and often 50% for surface irrigation [5]. Drip irrigation has been practiced for many years for its effectiveness in increasing the crop yield and quality [6,7,8,9]. Currently, most of orchard irrigation practices are conducted manually with the experience from farm operators. This may cause over-irrigation or under-irrigation, resulting in low water use efficiency and possibly leading to low crop production.
Precision irrigation as defined is a modern irrigation management that controls plant water stress at critical growth stages by applying only the necessary amount of water directly to the crop, varying rate and duration as needed [10,11]. Adoption of precision irrigation for modern fruit production systems requires the development of integrated sensing, control and decision-making technologies to adequately control timing, rate and distribution of water [12]. Different sensor systems and technologies have been investigated and tested for precision irrigation, including weather-based [13], soil-based [14] and plant-based sensor systems [15]. Meanwhile, the advanced control and communication systems are necessary to connect multiple components of an irrigation system (pumps, solenoids, etc.). Every irrigation and sensing technology have strengths that recommend it for certain applications, but also may have limitations to be effective to other situations. Soil moisture measurements are one of the best and simplest ways to support water management decisions, which are typically acquired to be adjacent to the crops being irrigated in the field. Soil water content and soil water potential are two indicators of plant-available water used by soil moisture-based irrigation systems [14].
A wide range of measuring instruments are used for soil moisture level, including neutron probes, time-domain reflectometry/transmissivity (TDR) sensors, capacitance sensors, tensiometers and granular matrix sensors [5]. Devices range from inexpensive gypsum blocks to costly TDR sensors. The selection of sensors can be correlated to variable considerations, such as crops, soil types and initial cost. Although guidelines for irrigation in different crops have been researched and suggested, but the actual requirement of water varies in different agroclimatic and topography and soil conditions [16]. That means the irrigation schedules would need to be adjusted according to the various conditions. Thus, a suitable irrigation strategy is core to improve crop yield and quality as well as reduce water use.
The primary goal of this study was to investigate an effective irrigation strategy for high-density apple orchards in Pennsylvania. To achieve the proposed goal, two objectives were included: (1) develop a soil moisture sensor system for irrigation decision making in a high-density apple orchard; (2) compare the soil moisture-based irrigation with ET-based and conventional irrigation methods through water use and crop yield and quality.
2. Materials and Methods
2.1. Experiment Site and Setup
To achieve the proposed objectives, a series of irrigation tests were conducted in a research orchard at Penn State Fruit Research and Extension Center (Biglerville, PA, USA, 39°56′ N, 77°15′ W). The orchard is a 0.36 hectare Fuji block, located at a relative high elevation. There are nine rows of apple trees with row space of 3.7 m. Figure 1 shows the layout of the experimental design. Three irrigation treatments designed with three rows of trees were used for each treatment. The treatments include soil moisture-based irrigation (Rows 1, 4, 7); ET-based irrigation regarding to the calculation of daily ET (Rows 2, 5, 8) and conventional method which is determined by the experience of the operator (Rows 3, 6, 9). The experiment started in early June and ran until the harvest of the crop on the middle of October of 2019.
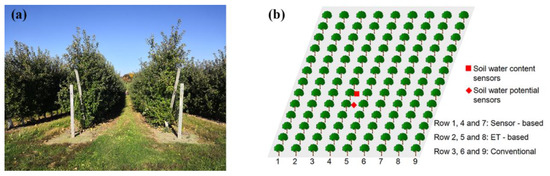
Figure 1.
Experimental setup, (a) the test apple orchard and (b) the setup of three irrigation strategies.
2.2. Drip Irrigation System
A drip irrigation system was installed in the test block. A simplified illustration of the drip irrigation system is shown in Figure 2. Water was supplied from a well. The pressure gauge was regulated at 30 psi pressure for the irrigation system. A few orchard blocks shared the same water supply with separate inlet valves and the test block is one of them. For the test block, a manual on/off valve is set on the dripline at the entrance of each row to turn on or shut off the water going to that row.
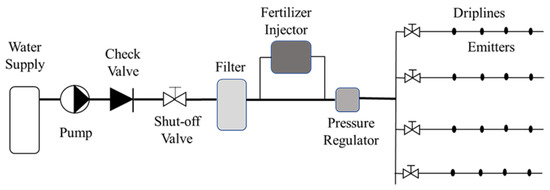
Figure 2.
A simplified drip irrigation system schematic diagram.
There was no flow meter for individual driplines, so the amount of water went to each row at an irrigation event could not be recorded. In the study, the applied water was estimated by calculating the application rate multiplying the irrigation duration. To calculate the application rate of the drip irrigation system, the emitter flow rate, the emitter spacing among the tubing and the distance between drip lines must be known. The calculation equation is as follow (adapted from [5]).
where ApRt is the application rate in mm per hour, EmitterFlow is the emitter flow rate in liter per hour, RowSpc is the spacing between rows in m and EmitterSpc is the spacing between emitters in m.
In the test block, the dripline is 12.5 mm in diameter; the flow rate of the emitter is 2.3 L/h under the setting pressure; and the emitters are spaced at 0.62 m along the dripline. For drip irrigation, water movement capability varies in different soil types. For silt loam soil, the water will move at a radius of 0.46 to 0.76 m laterally away from the drip emitter in the tree row [17]. In this study, the coverage area of 0.62 m from each side of tree row along the tree row was estimated as the watering area in the irrigation, namely, the irrigated water, was assumed to be applied only to the area instead of whole orchard ground. The row space of the test orchard is 3.7 m, which means that the water is only applied to one third of the orchard ground area. Therefore, the estimated application rate is three times to that calculated from Equation (1), which is 25.4 mm in eight hours.
2.3. Sensor System Setup
2.3.1. Soil Moisture Sensors
The goal of a well-managed irrigation program is to maintain soil moisture between field capacity and the point before water stress occurs, or in other words, to make sure that there is always readily available water. Although apple roots can grow to a depth of several yards, nearly all of the roots of a mature tree are typically in the top 75 to 90 cm [18]. Two types of soil moisture sensors, water content sensor (TEROS 12, Meter Group, Pullman, WA, USA) and water potential sensor (TEROS 21, Meter Group, Pullman, WA, USA), were used in the study. Figure 3 shows the installation and the data acquisition for these sensors. In this study, three soil water content sensors were installed at different depths, e.g., 30, 60 and 90 cm under the ground. Two soil water potential sensors were installed at the depth of 45 and 75 cm.
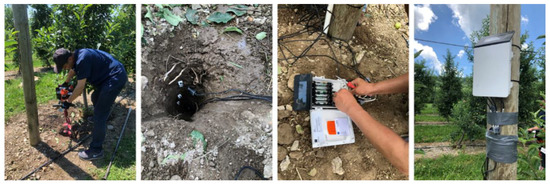
Figure 3.
Soil moisture sensor systems setup in the orchard. From left to right: drill a hole for sensors, install sensors at different depths, connect sensors to a datalogger, place the datalogger to a pole.
A data logger (ZL6, Meter Group, Pullman, WA, USA) was used to record all the sensor data. The sample rate was set to one date at every 10 min. The datalogger has the capability of wireless communication based on cellular network service. Prior to the installation, the signal connection was tested as sufficient at the experiment site. A seasonal pass data service was purchased to enable remote accessing of the sensor data in real-time. Soil water content and soil water potential values were monitored and recorded through a web-based cloud service (ZENTRA Cloud, Meters Group Inc., Pullman, WA, USA). Through the wireless communication, users could access the soil moisture data with phone or computer through internet and download data as needed. Meanwhile, it also allows to read the data by connecting the datalogger to a computer via a USB cable.
2.3.2. Weather Station Data
ET-based irrigation requires a complete set of weather parameters to calculate daily ET rate (in Section 2.4.2). In this study, these weather data were acquired from a nearby weather station in a network system called NEWA (the Network for Environment and Weather Applications), including solar radiation, wind speed and direction, precipitation, relative humidity and air temperature.
2.4. Irrigation Strategies
2.4.1. Soil Moisture-Based Irrigation
The status of water in soil can be described in terms of the amount of water or the energy associated with the forces which hold the water in the soil. The amount of water can be defined as soil water content and the energy state of the water is presented by soil water potential [19]. In this study, the water content sensors and water potential sensors were installed at the same row to compare the two types of information. The field capacity varies for different types of soil, could range from 10.7% to 39.8% [20]. The water content of 30% was estimated for starting the irrigation in our study. With the selected water potential sensor and the estimated soil type, the value of −10 kPa was set to threshold for wet soil and −80 kPa was set to the threshold for water stress occurring. The readings from the water potential sensors were monitored as a reference to compare with soil water contents, respectively.
2.4.2. ET-Based Irrigation
The daily reference ET (ETr) was calculated using the Hargreaves model, which was described in detail in FAO-56 Hargreaves equation [21]. The model must be modified to suit different growing conditions and the disparate plant architectures of tall discontinuous crops like fruit trees. Then, the ETr was adjusted by local crop coefficients Kc in order to obtain the daily ET for the test orchard block (ETc):
The Kc could be slightly different at different crop growing stages. As suggested by [22], the crop coefficients can be in the range of 0.75–0.95 in the mid to late season for apples. We used a constant value of Kc = 0.9, since the irrigation was mainly applied in the moths of July to September (mid-season) for the test orchard.
Water deficit represents water shortage in a particular field by reaching to the soil water holding capacity, it was defined as accumulated water shortage between the input water (rainfall and irrigation) and the ET on daily basis over the time, showing in Equation (3).
where is the water deficit in the ith day, is the effective rainfall in the ith day from the NEWA weather station, is the amount of water by irrigation in the ith day and ETci is the ETc in the ith day. In the study, the water deficit was set to zero before the first day of the experiment, namely, Wd0 = 0. The water deficit was a negative value if the deficit occurred and it is always a value equaling to or below zero. If the calculated value from Equation (3) is larger than zero, then the water deficit was set manually to zero (the excess water could be assumed to be run-off). When the overall water deficit reaches certain value setting to −25.4 mm, then the irrigation will need to be scheduled. It was the goal to apply 25.4 mm water at each irrigation to eliminate the water deficit.
2.4.3. Conventional Irrigation
The conventional irrigation used for the test orchard was based on the experience of our irrigation operator, who has operated the irrigation systems for many years in our research orchards.
2.5. Irrigation Strategies Evaluation
Among the three irrigation strategies, the water amounts used for each method were recorded and compared. Due to the certain difficulties (existing underground pipelines), we did not add flow meters for each treatment to record the water use separately. Instead, we used the application rate (Section 2.2) to calculate the water use. The variability of discharge on the drip line was neglected in the study since the pump system was sufficient to maintain the pressure at 30 psi during the irrigation events. At the harvesting, five trees per row were randomly selected for evaluating fruit yield and quality (apple hardness and soluble solid) under different irrigation strategies. The hardness of apple was measured with a Güss GS-14 penetrometer (QA Supplies LLC, Norfolk, VA, USA). Juice samples were collected and tested for soluble solids concentration with a digital refractometer (model PR-32 α; Atago, Bellevue, WA, USA).
2.6. Statistical Analysis
The data obtained from the three methods, including crop yield, water use amounts, fruit size, fruit hardness and fruit soluble solids, were analyzed with the analysis of variance (ANOVA) using Excel software (Microsoft Corporation, Redmond, WA, USA). The significance of the treatment effect was determined using the F-test and comparisons of means were carried out using the least significant difference (LSD) at the 5% level of significance.
3. Results
3.1. Soil Moisture-Based Irrigation
Figure 4 shows the daily averaged water content, rainfall and irrigation water through the days. In the Figure 4, WC #1 to WC #3 represent three water content sensors from top to bottom in the ground. During most of the season, the daily average values of the three sensors showed similar soil moisture level. The water content levels at different depths changed accordingly during the irrigation events and rainfalls. Among the three values, the bottom sensor had slightly lower readings than the top two, except for days 180 to 190 when there was too much rainfall. The possible reason could be that the soil starts to contain some rocks at the very bottom of the root zone, which may increase the moisture level to a high number when excessive water reaches there; in contrast, it could also retain less water if the water is at moderate or low level. The water content threshold of 0.30 m3/m3 was set for starting the irrigation. As shown in Figure 4, the irrigation events were applied before the average soil water content reached to the threshold. While, due to the manual operation, we did not irrigate the test block exactly when the average water content hit this number. While, over the season, the soil water content was always above this threshold. As the irrigation event or rainfall happened, the soil moisture in the soil increased accordingly. The water content values from the three sensors increased after a few hours of irrigation and the irrigation was stopped before the water level reached the field capacity to avoid over-irrigation. The same as the starting time, it was an estimation for stopping the irrigation. We typically irrigated four hours. A couple of times irrigation lasted longer when it was too dry.
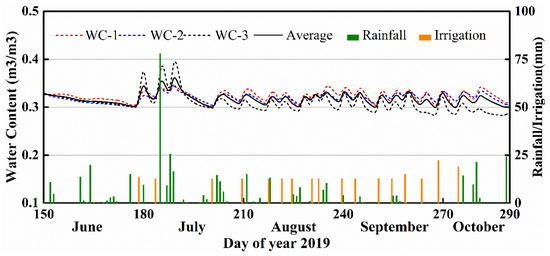
Figure 4.
Illustration of daily irrigation, rainfall events and soil water content at different depth of the ground.
In the study, soil water potential was monitored side by side with soil water content. Figure 5 shows the daily average soil water potential through days from June to October 2019. WP #1 and WP #2 represent two water potential sensors from top to bottom in the soil and WP-Ave is the average of the two. Figure 5 also lists the rainfall and irrigation events during the season. The water potential values were getting to bigger negative numbers when the soil started to lose water. Once the irrigation or rainfall events occurred, the numbers went up to smaller negative values (−10 kPa is the upper limit for the sensor readings, reaching to the water holding capacity). As shown in Figure 5, the reading of the two sensors were at the same trend with some difference on the peak values. Before September, the soil water potential numbers were basically within −80 kPa which were expected for the irrigation threshold for the test orchard. In contrast to the water content sensor, the soil water potential sensor was more sensitive to the dry conditions. In the late season (September to Middle of October), the irrigation event was reduced to avoid crop cracking. As consequence, the readings from the two water potential sensors were dropped dramatically in one or two days before the irrigation was applied. The change of the soil water content was much milder (Figure 4). Due to the good presentation of soil water status, the soil water potential sensors could be suggested for scheduling the irrigation events as well.
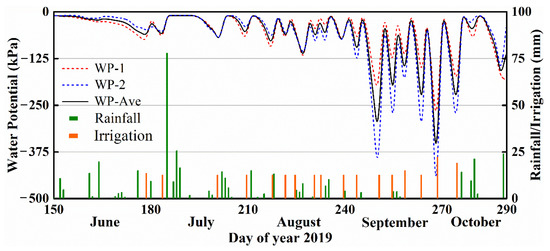
Figure 5.
Illustration of daily based irrigation, rainfall events and soil water potential at different depths.
The detailed changes of soil water content and potential in 24 h were also analyzed. Figure 6 shows an irrigation event in the middle of growing season. The irrigation event started at 11:30 a.m. and ended at 15:30 p.m., with a total of 4 h of irrigation. About 12.7 mm water was applied to the soil for apple trees. The detail change of water content was shown in Figure 6a, the soil water content at the top portion of the root zoom increased first after the irrigation event started and then deeper ones followed. When the irrigation stopped, the water content readings from the three levels continued to increase for a short period of time, then went down. Irrigation duration is another factor for soil moisture-based irrigation. In this irrigation event, a soil water content at consistent saturation level (i.e., the sensor reading keeps at a consistent high level when the irrigation is on) did not occur, which indicated that the irrigation duration did not cause over-irrigation. As in one of our previous irrigation, continuing irrigation could cause wasting of water after the soil reached its water holding capacity [23]. As the water gradually moves from the dripping point to the root zone, in order to cover the full root zone, another important thing to consider is the location of these sensors. In this study, we installed the sensors at the tree row between two emitters. However, if a larger area needs to be monitored, the location of sensors would be different. In the future, more studies will be conducted to identify the sensor locations as well as the irrigation ending time to wet the root zone, which will be important for automatic irrigation. Figure 6b showed the soil water potential change in the same irrigation event. With irrigation, the soil water potential at the two depths were changed from about −90 to −10 kPa, which also indicated that the soil obtained enough water after this irrigation event. The top sensor changed more quickly than the bottom one, due to the water moving from the top to the bottom gradually. The reading from the bottom sensor continued to increase after the irrigation stopped and eventually reached the upper limit of −10 kPa. We reach the same conclusion as the readings from water content sensors, i.e., the duration of the irrigation was efficient to wet the area without wasting water. Of course, like the water content sensors, the location of water potential sensors is also critical to identify the water status for the overall covered area. It would be important to conduct more studies in terms of sensor location and irrigation duration to provide guidance for future automatic irrigation systems.
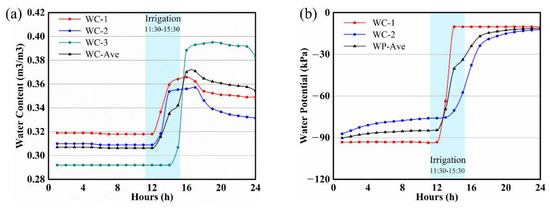
Figure 6.
Changes of soil water content (a) and soil water potential (b) in 24 h.
3.2. ET-Based Irrigaiton
As shown in Figure 7, the ETc, estimated deficit, irrigation and rainfall are presented from early June to the middle of October. The accumulated water deficit was calculated with Equation (3). In the calculation, if the rainfall/irrigation was larger than the current water deficit, the value of water deficit was set to zero at the end of the day. The deficit increased gradually if there was no rainfall or irrigation event. Meanwhile, the deficit decreased rapidly after rainfall or irrigation by adding water to the soil.
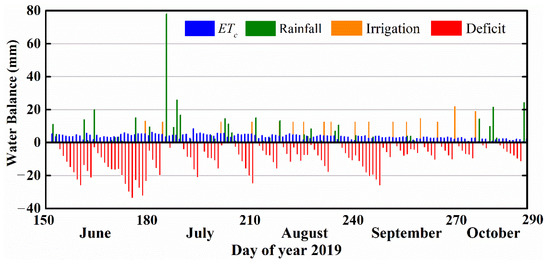
Figure 7.
ET-based irrigation with ETc, irrigation, rainfall and water deficit.
As shown in Figure 7, the accumulated water deficit of the test orchard was basically within the set threshold of 25.4 mm during the entire growing season. The irrigation events were applied with the amount of water to eliminate the water deficit. In addition, the rainfall, the applied water was slightly different when compared to the calculated water deficit. The irrigation event in our study was manually operated, the pump required an operator to turn on/off by going to the site. Therefore, the irrigation duration may not be exactly as expected.
3.3. Water Use and Fruit Yield and Quality
At the end of the season, three different irrigation strategies were compared in Table 1, including water use, crop yield and crop quality. In overall, the water use for three irrigation methods were 235, 264 and 247 mm during the season. The greatest total water consumption occurred in the ET-based irrigation, followed by conventional irrigation and soil moisture-based irrigation. The water consumed under soil moisture-based irrigation was 10.8% and 4.8% less than these of ET-based and conventional methods, respectively.

Table 1.
The evaluation of three irrigation strategies.
The soil moisture-based irrigation achieved slightly higher crop yield per tree than the other two, followed by ET-based irrigation and then the conventional method. The crop yield per tree under soil moisture-based irrigation was 24.4 kg on average, which is 16.7% and 12.0% higher than that under ET-based and conventional irrigation, respectively. For average crop size, e.g., weight of single fruit, the ET-based irrigation obtained the largest individual fruit size of 258.2 g per fruit on average, which is about 8.6% and 2.4% heavier than those of fruits under soil moisture-based irrigation and conventional irrigation, respectively. There were more small fruits in the Row 1 possibly due to the less-effective crop thinning, resulting in smaller fruit size for the soil moisture-based irrigation. The hardness and soluble solids of apples under the three irrigation strategies ranged from 8.2–8.4 kg and 16.0–16.1 oBrix. There was no significant impact on the hardness and soluble solids.
Overall, the soil moisture-based irrigation saved some water and increased the crop yield per tree. It is very hard to estimate whether irrigation water was enough depending on experience without accurate data. The moisture sensors could directly detect the water status in the soil. With the data from the sensors, the irrigation was applied when the water in soil was not sufficient for the crops and then shut off when the water level in soil reached the set threshold.
4. Discussion
Studies have been reported widely on investigating irrigation strategies for apple orchards in the past, aiming to achieve water saving and optimal crop production [14,24,25,26]. Precision irrigation methods calculating daily crop evapotranspiration (ETc) or monitoring soil moisture levels have gained better understanding of effectively using water [27,28]. In general, precision irrigation methods consumed less water compared with conventional irrigation. For example, Irving and Drost [29] found ET-based irrigation saved 30.4% water compared to the conventional irrigation in an Orange Pippin apple orchard. The amount of water applied with conventional irrigation varies among the operators. We applied a slightly more water in ET based irrigation than the conventional strategy, which can be due to the judgement of the operator for the conventional irrigation and/or a relatively large Kc was selected for ET-based irrigation to ensure an adequate yield as described in Yuan et al. [30]. Some other studies have tried to find balance between water use and crop yield/quality with deficit irrigation (below full calculated ETc). Deficit irrigation reduced the water use for ET based irrigation, while it may cause crop load reduction especially the average fruit size with the severity of deficit [31]. Since the water supply is not an issue in Pennsylvania, full irrigation (100% ETc) was applied in our study. It is difficult to compare the water use or fruit production among the irrigation studies side by side, because the geographical locations, apple varieties and other production parameters could affect the water use and production.
Some other limitations were observed in the ET-based irrigation. We used the meteorological data from a nearby NEWA weather station, while it was not always precisely representing the test orchard block. An on-site weather station would be a solution, which will increase the cost. Studies also used remote sensing technologies to estimate the actual ETc using satellite-based imagery and a water balance model [32], with no need of equipment in the orchard. Meanwhile, we assumed that the excessive water running off from the ground, which was based on the sufficient drainage of the ground. The orchard block in our test is at a relatively high elevation spot in an area with good drainage. Therefore, we set the water deficit to zero when the calculated water deficit was positive. For some orchards, the ground or the location may not have good drainage, which will retain water longer after a big rainfall or over-irrigation. Therefore, it may cause some errors to water deficit calculation with the ET-based irrigation strategy.
Soil moisture-based irrigation measuring the real-time soil water status, significant water saving and/or crop production improvement has been found using soil moisture-based irrigation in apple orchards [33,34]. For example, water uses were 39% and 32% less in a young Fuji apple orchard with soil moisture irrigation at −50 and −80 kPa thresholds compared to a conventional method [33]. Our study also indicated that irrigation based on soil moisture levels achieved better fruit yield, but reduced water use (Table 1). Furthermore, an irrigation scheduling algorithm was developed with a water balance model tuned by capacitance-type soil moisture sensors and the results showed that the water use in small canopy trees was 24% less when comparing to ET irrigation [28].
For soil moisture-based irrigation, the sensors we selected were just one type of sensor. There are many other sensors that can be used to achieve the same purpose. The selection of sensors could be based on the effectiveness and the cost. As in our study, the soil water content sensor and soil water potential sensor provided sufficient information for irrigation. The soil water potential sensor showed more sensitivity when the soil starts to dry. The locations for installing sensors would be another issue. It would be good to have multiple sensor nodes in an orchard block, although this will increase the cost of the whole irrigation system. Therefore, to minimize the number of sensors, it is necessary to find locations to install sensors that can represent the whole field. The orchard block we tested is in a relative flat terrain and we installed the sensors roughly at the center of the orchard. Meanwhile, if an orchard is with slope terrain, then the selection of installation locations would be more critical. Another observation from this study is the necessity of an automated irrigation system. With the automated system, the irrigation system can be turned on or off at the time when the setting thresholds are reached. For the automated system, the valve control, wireless sensor network, Internet of Things (IoT) and data service will be involved. These will be investigated in our future studies.
5. Conclusions
To investigate the effect of soil moisture-based irrigation on apples in a high-density orchard, the soil moisture-based irrigation, ET-based irrigation and conventional irrigation were tested in a high-density apple orchard in Pennsylvania. The amount of water use and crop yield and quality were analyzed at the end of season among the three irrigation methods. The following specific conclusions can be drawn from this study:
- (1)
- Both the soil water content sensor and water potential sensor showed effectiveness for soil moisture-based irrigation scheduling. The soil moisture level at different depths in the ground changed accordingly with the irrigation event. Compared to the water content sensor, the soil water potential sensor is more sensitive, especially when the water stress is about to occur.
- (2)
- ET-based irrigation worked effectively in our study. It relies on calculating the daily ET with the weather parameters and then applies water based on the water deficit. Meanwhile, the accuracy of ET-based irrigation could be affected by the precision of weather parameters for the specific site (for example, the distance from the test orchard to the nearby weather station) as well as the ground drainage.
- (3)
- Among three tested irrigation strategies, the soil moisture-based irrigation used less water, accounting for 10.8% and 4.8% less than ET-based irrigation and conventional irrigation, respectively. The crop yield per tree under soil moisture-based irrigation and ET-based irrigation were 16.7% and 12.0% higher than that under conventional irrigation. The hardness and soluble solids of apples under the three irrigation strategies were similar.
In summary, the soil moisture-based irrigation achieved good water use efficiency. The results from this study could suggest the potential of using the soil moisture-based irrigation in a high-density orchard in Pennsylvania. The irrigation was operated manually in this study, which may have introduced some accuracy-loss on the irrigation starting time as well as the duration. In the future, an automated irrigation system will be investigated by starting and stopping the irrigation automatically based on the soil moisture sensor readings.
Author Contributions
All authors were involved in designing and performing the experiments, analyzing the result; X.J. wrote the paper and L.H. reviewed the paper. All authors have read and agreed to the published version of the manuscript.
Funding
This research was supported in part by the United States Department of Agriculture’s (USDA) National Institute of Food and Agriculture Federal Appropriations (Project PEN04653; Accession No. 1016510), the State Horticultural Association of Pennsylvania (SHAP), the USDA Northeast SARE (Grant No. 19-378-33243), the Graduate Innovation Fund of Jilin University.
Institutional Review Board Statement
Not applicable.
Informed Consent Statement
Not applicable.
Acknowledgments
Special thanks to Lihua Zeng and Daniel Weber for their help in the sensor system installation.
Conflicts of Interest
The authors declare no conflict of interest. The funders had no role in the design of the study; in the collection, analyses, or interpretation of data; in the writing of the manuscript, or in the decision to publish the results.
References
- Lancaster, N.A.; Torres, A.P. Investigating the drivers of farm diversification among U.S. fruit and vegetable operations. Sustainability 2019, 10, 3380. [Google Scholar] [CrossRef]
- Harper, J.; Lamont, W. Irrigation for Fruit and Vegetable Production. University Park: Penn State Extension. 2012. Available online: https://extension.psu.edu/irrigation-for-fruit-and-vegetable-production (accessed on 4 April 2020).
- Robinson, T.; Hoying, S.; Sazo, M.; DeMarree, A.; Dominguez, L. A vision for apple orchard systems of the future. N. Y. Fruit Q. 2013, 21, 11–16. [Google Scholar]
- Fernández, J.E.; Perez-Martin, A.; Torres-Ruiz, J.M.; Cuevas, M.V.; Rodriguez-Dominguez, C.M.; Elsayed-Farag, S.; Morales-Sillero, A.; García, J.M.; Hernandez-Santana, V.; Diaz-Espejo, A. A regulated deficit irrigation strategy for hedgerow olive orchards with high plant density. Plant Soil 2013, 372, 279–295. [Google Scholar] [CrossRef]
- Peters, T. Drip Irrigation for Agricultural Producers. WSU Extension. 2015. Available online: http://irrigation.wsu.edu/Secondary_Pages/Irr_Fact_Sheets/DripIrrForAgProducers.pdf (accessed on 4 April 2020).
- Al-Omran, A.M.; Sheta, A.S.; Falatah, A.M.; Al-Harbi, A.R. Effect of drip irrigation on squash (Cucurbita pepo) yield and water-use efficiency in sandy calcareous soils amended with clay deposits. Agric. Water Manag. 2005, 73, 43–55. [Google Scholar] [CrossRef]
- Sampathkumar, T.; Pandian, B.J.; Rangaswamy, M.V.; Manickasundaram, P.; Jeyakumar, P. Influence of deficit irrigation on growth, yield and yield parameters of cotton-maize cropping sequence. Agric. Water Manag. 2013, 130, 90–102. [Google Scholar] [CrossRef]
- Biswas, S.K.; Akanda, A.R.; Rahman, M.S.; Hossain, M.A. Effect of drip irrigation and mulching on yield, water-use efficiency and economics of tomato. Plant Soil Environ. 2015, 61, 97–102. [Google Scholar] [CrossRef]
- Taylor, R.; Zilberman, D. Diffusion of drip irrigation: The case of California. Appl. Econ. Perspect. Policy 2017, 39, 16–40. [Google Scholar] [CrossRef]
- O’Shaughnessy, S.A.; Evett, S.R. Canopy temperature based system effectively schedules and controls center pivot irrigation of cotton. Agric. Water Manag. 2010, 97, 1310–1316. [Google Scholar] [CrossRef]
- Casadesús, J.; Mata, M.; Marsal, J.; Girona, J. A general algorithm for automated scheduling of drip irrigation in tree crops. Comput. Electron. Agric. 2012, 83, 11–20. [Google Scholar] [CrossRef]
- Smith, R.J.; Baillie, J.N. Defining precision irrigation: A new approach to irrigation management. In Proceedings of the Irrigation and Drainage Conference 2009, Swan Hill, VIC, Australia, 18–21 October 2009; pp. 1–6. [Google Scholar]
- Dragoni, D.; Lakso, A.N.; Piccioni, R.M. Transpiration of apple trees in a humid climate using heat pulse sap flow gauges calibrated with whole-canopy gas exchange chambers. Agric. For. Meteorol. 2005, 130, 85–94. [Google Scholar] [CrossRef]
- Osroosh, Y.; Peters, R.T.; Campbell, C.S.; Zhang, Q. Comparison of irrigation automation algorithms for drip-irrigated apple trees. Comput. Electron. Agric. 2016, 128, 87–99. [Google Scholar] [CrossRef]
- Conaty, W.C.; Burke, J.J.; Mahan, J.R.; Neilsen, J.E.; Sutton, B.G. Determining the optimum plant temperature of cotton physiology and yield to improve plant-based irrigation scheduling. Crop Sci. 2012, 52, 1828–1836. [Google Scholar] [CrossRef]
- Kumar, D.; Pandey, V.; Nath, V. Effect of organic mulching and irrigation schedule through drip on growth and yield of mango var. Lal Sundari in eastern region of India. Indian J. Agric. Sci. 2008, 78, 385–388. [Google Scholar]
- Sokalska, D.I.; Haman, D.Z.; Szewczuk, A.; Sobota, J.; Dereń, D. Spatial root distribution of mature apple trees under drip irrigation system. Agric. Water Manag. 2009, 96, 917–924. [Google Scholar] [CrossRef]
- Atkinson, A.B.; Brandolini, A. Unveiling the ethics behind inequality measurement: Dalton’s contribution to economics. Econ. J. 2015, 125, 209–234. [Google Scholar] [CrossRef]
- Or, D.; Wraith, J.M.; Warrick, A.W. Soil water content and water potential relationships. Soil Phys. Companion 2002, 1, 49–84. [Google Scholar]
- Nachabe, M.H. Refining the Definition of Field Capacity in the Literature. J. Irrig. Drain. Eng. 1998, 124, 230–232. [Google Scholar] [CrossRef]
- Allen, R.G.; Jensen, M.E.; Wright, J.L.; Burman, R.D. Operational estimates of reference evapotranspiration. Agron. J. 1989, 81, 650. [Google Scholar] [CrossRef]
- Allen, R.; Pereira, L.; Raes, D.; Smith, M. ETc—Single crop coefficient. In Book Crop Evapotranspiration—Guidelines for Computing Crop Water Requirements; FAO—Food and Agriculture Organization of the United Nations: Rome, Italy, 1998. [Google Scholar]
- He, L.; Zeng, L.; Choi, D. Investigation of Sensor-Based Irrigation Systems for Apple Orchards; 2019 NEBAC Meeting Paper No. 19-013; American Society of Agricultural and Biological Engineers: St. Joseph, MI, USA, 2019. [Google Scholar]
- Mpelasoka, B.; Behboudian, M.; Green, S. Water use, yield and fruit quality of lysimeter-grown apple trees: Responses to deficit irrigation and to crop load. Irrig. Sci. 2001, 20, 107–113. [Google Scholar] [CrossRef]
- Fallahi, E.; Neilsen, D.; Neilsen, G.H.; Fallahi, B.; Shafii, B. Efficient irrigation for optimum fruit quality and yield in apples. HortScience 2010, 45, 1616–1625. [Google Scholar] [CrossRef]
- Chenafi, A.; Monney, P.; Arrigoni, E.; Boudoukha, A.; Carlen, C. Influence of irrigation strategies on productivity, fruit quality and soil-plant water status of subsurface drip-irrigated apple trees. Fruits 2016, 71, 69–78. [Google Scholar] [CrossRef]
- Robinson, T.L.; Lakso, A.N.; Lordan, J.; Francescatto, P.; Dragoni, D.; DeGaetano, A.T.; Eggleston, K. Precision irrigation management of apple with an apple-specific Penman-Monteith model. Acta Hortic. 2017, 1150, 245–250. [Google Scholar] [CrossRef]
- Domínguez-Niño, J.M.; Oliver-Manera, J.; Girona, J.; Casadesús, J. Differential irrigation scheduling by an automated algorithm of water balance tuned by capacitance-type soil moisture sensors. Agric. Water Manag. 2020, 228, 105880. [Google Scholar] [CrossRef]
- Irving, D.E.; Drost, J.H. Effects of water deficit on vegetative growth, fruit growth and fruit quality in Cox’s Orange Pippin apple. J. Hortic. Sci. 1987, 62, 427–432. [Google Scholar] [CrossRef]
- Yuan, B.Z.; Nishiyama, S.; Kang, Y. Effects of different irrigation regimes on the growth and yield of drip-irrigated potato. Agric. Water Manag. 2003, 63, 153–167. [Google Scholar] [CrossRef]
- Neilsen, D.; Neilsen, G.; Guak, S.; Forge, T. Consequences of deficit irrigation and crop load reduction on plant water relations, yield, and quality of ‘Ambrosia’apple. HortScience 2016, 51, 98–106. [Google Scholar] [CrossRef]
- Odi-Lara, M.; Campos, I.; Neale, C.M.; Ortega-Farías, S.; Poblete-Echeverría, C.; Balbontín, C.; Calera, A. Estimating evapotranspiration of an apple orchard using a remote sensing-based soil water balance. Remote Sens. 2016, 8, 253. [Google Scholar] [CrossRef]
- Ro, H.M. Water use of young ‘Fuji’apple trees at three soil moisture regimes in drainage lysimeters. Agric. Water Manag. 2001, 50, 85–196. [Google Scholar] [CrossRef]
- Treder, W.; Klamkowski, K.; Mika, A.; Wójcik, P. Response of young apple trees to different orchard floor management system. J. Fruit Ornam. Plant Res. 2004, 12, 113–123. [Google Scholar]
Publisher’s Note: MDPI stays neutral with regard to jurisdictional claims in published maps and institutional affiliations. |
© 2021 by the authors. Licensee MDPI, Basel, Switzerland. This article is an open access article distributed under the terms and conditions of the Creative Commons Attribution (CC BY) license (https://creativecommons.org/licenses/by/4.0/).