Article

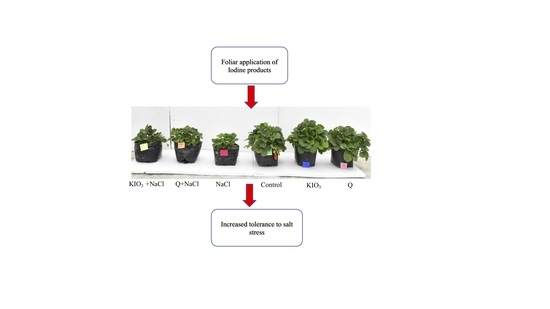
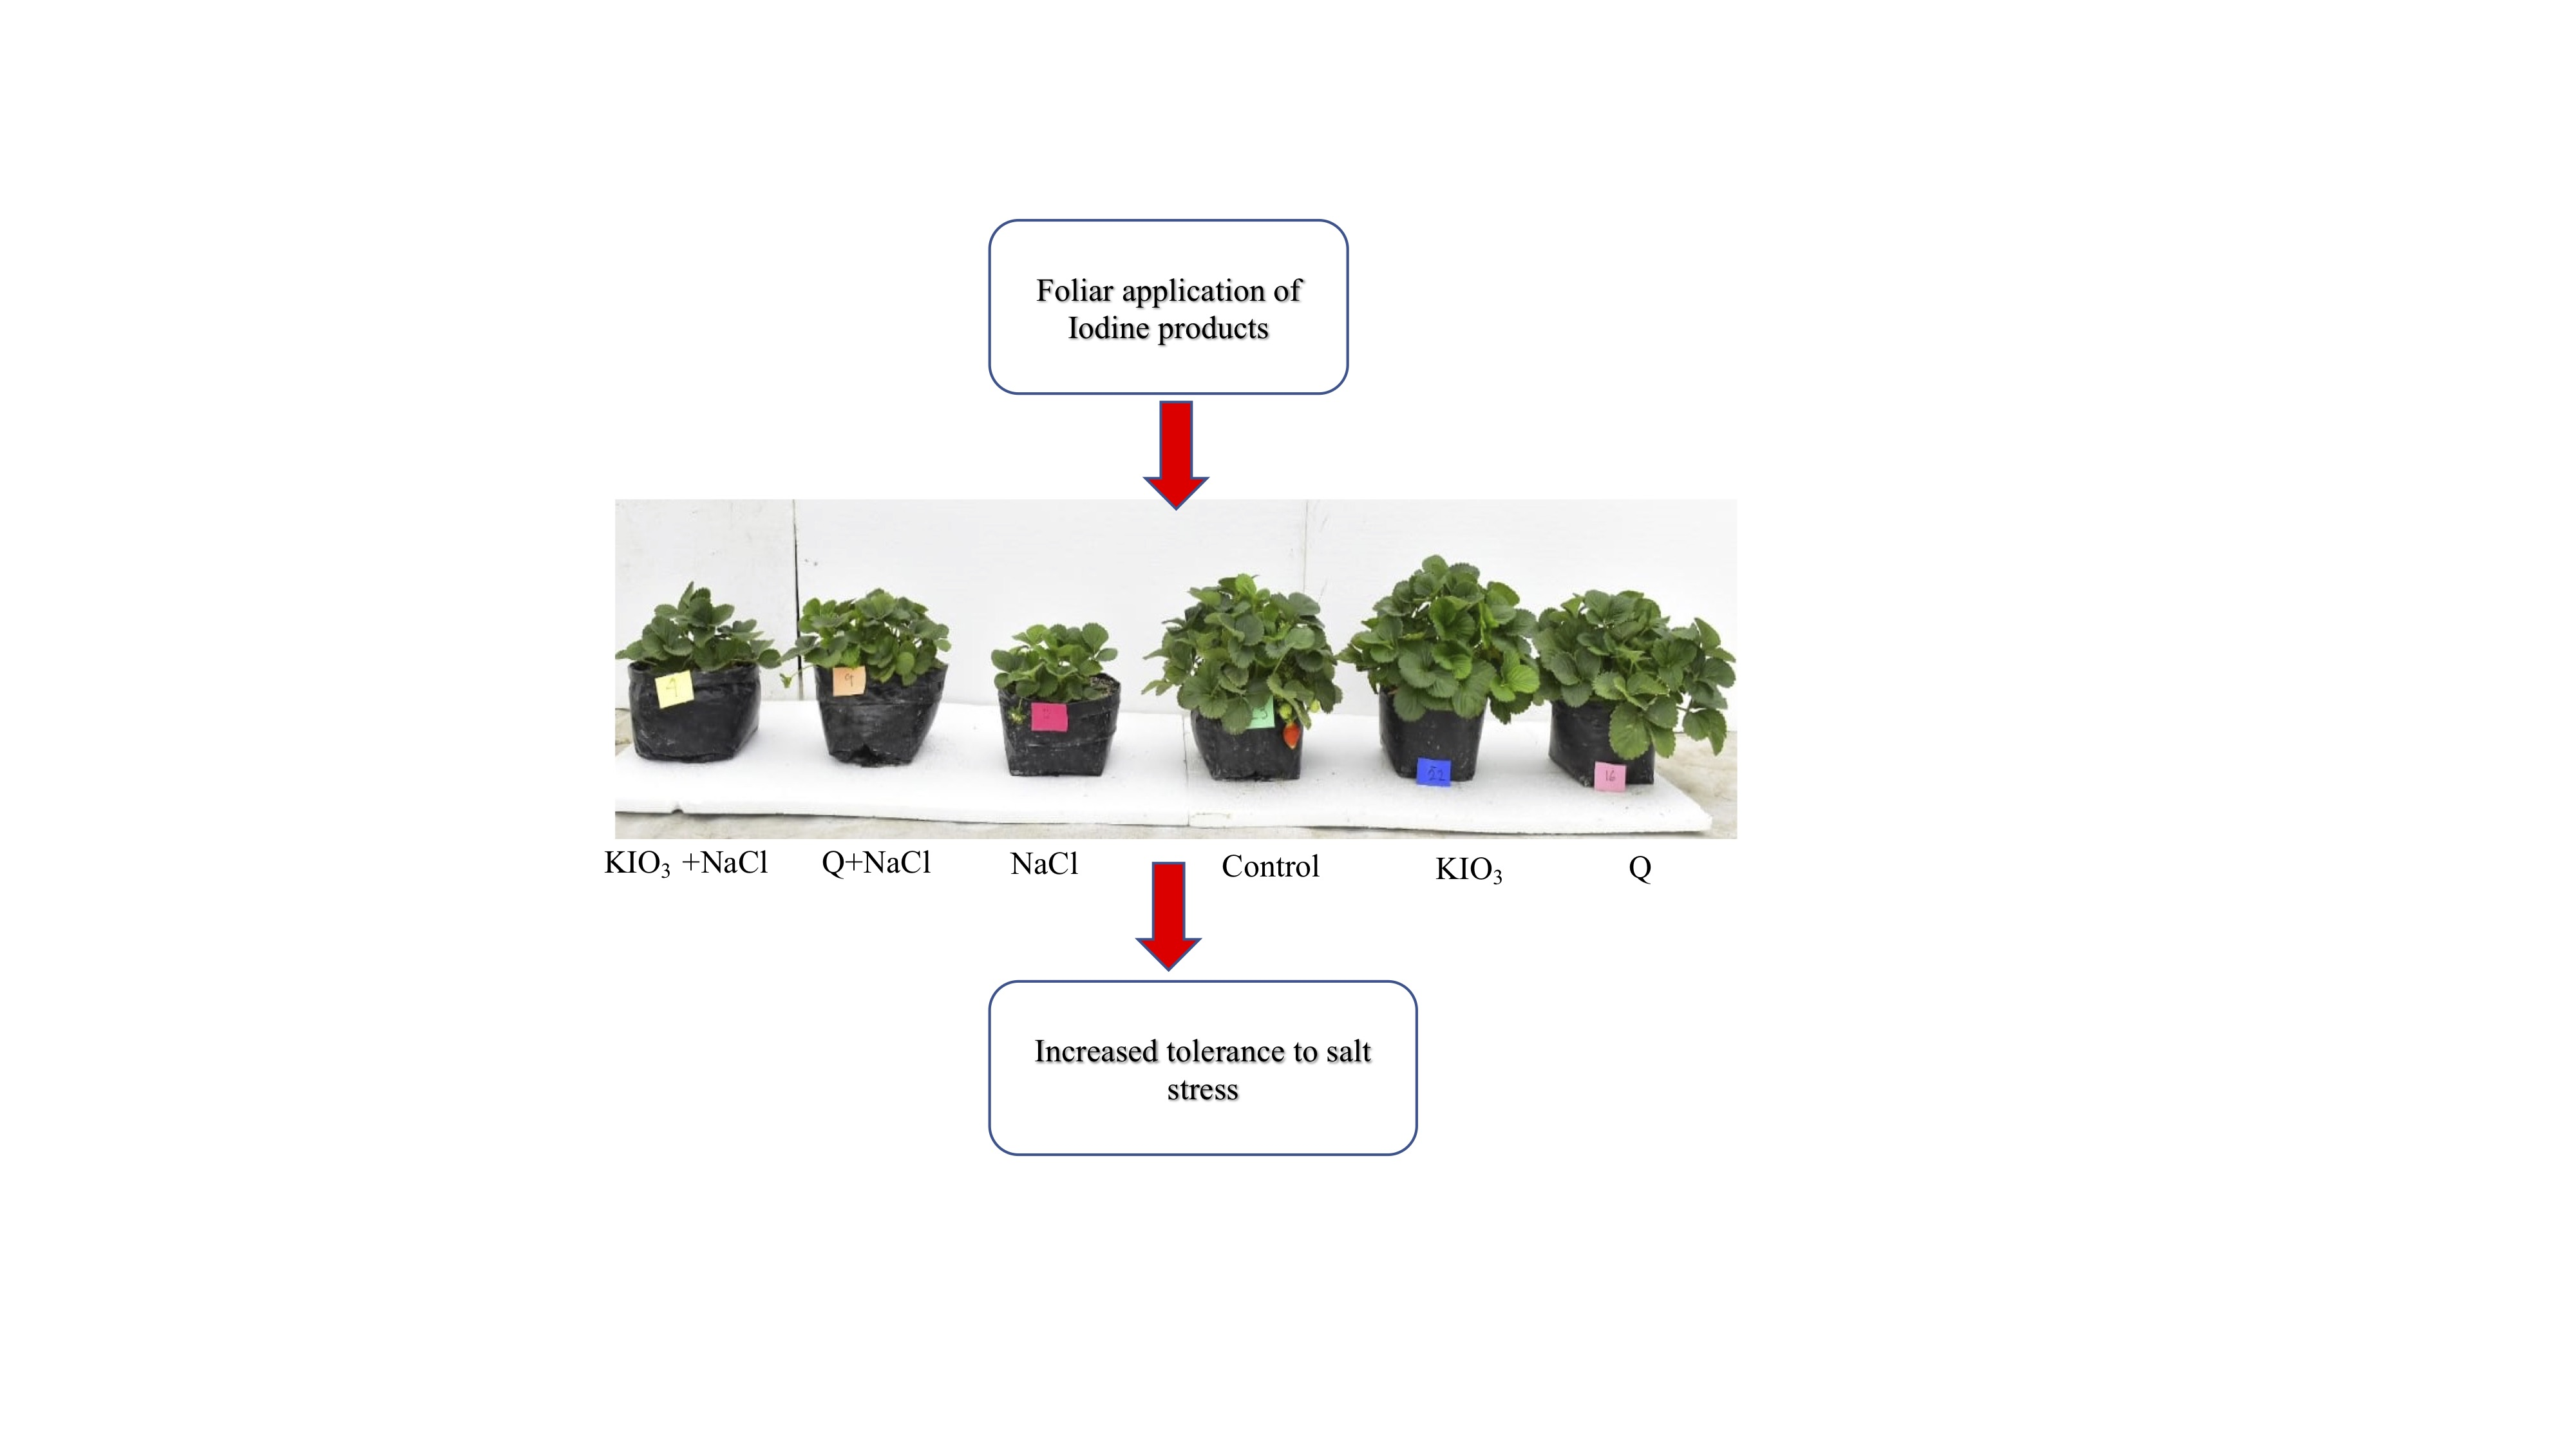
Enhancement to Salt Stress Tolerance in Strawberry Plants by Iodine Products Application

by
Julia Medrano Macías
1,*,
María Guadalupe López Caltzontzit
1,
Erika Nohemi Rivas Martínez
2,
Willian Alfredo Narváez Ortiz
1,
Adalberto Benavides Mendoza
1 and
Paulino Martínez Lagunes
3,*
1
Departament of Horticulture, Autonomous Agrarian University Antonio Narro, Calzada Antonio Narro, 1920, Buenavista, Saltillo 25315, Mexico
2
Departament of Botany, Autonomous Agrarian University Antonio Narro, Calzada Antonio Narro, 1920, Buenavista, Saltillo 25315, Mexico
3
Quimcasa de México, 16 de septiembre, 777, Alce blanco, Naulcapan, Estado de México, Naucalpan de Juárez 53370, Mexico
*
Authors to whom correspondence should be addressed.
Agronomy 2021, 11(3), 602; https://doi.org/10.3390/agronomy11030602
Submission received: 12 February 2021 / Revised: 15 March 2021 / Accepted: 18 March 2021 / Published: 22 March 2021
(This article belongs to the Special Issue From Biofortification to Tailored Crops and Food Products)

Abstract

:
Iodine is a non-essential element for land plants, but is considered as a beneficial element, related to antioxidant capacity, environmental adaptations and improvement of plant growth. Salinity is one of the more recurrent abiotic stresses worldwide, seriously affecting vegetal production. The aim of this work was to evaluate iodine application (Q products® and KIO3, Quimcasa de México, Naucalpan, Mexico) in strawberry plants under normal and salt stress conditions. Growth, antioxidant content, essential minerals, iodine accumulation and fruit quality were evaluated. The results showed that, under stress conditions, the application of Q products increased ascorbate peroxidase (APX) and catalase (CAT) activity as well as glutathione (GSH) content and yield in fruit, without avoiding biomass loss; with the application of KIO3 an increase in GSH and APX activity as well as P and K concentrations were obtained. In leaves an increase in P, Ca, Mn and iodine accumulation was evidenced with the application of Q products, and an increased concentration of ascorbic acid and iodine with KIO3 treatments. Under normal conditions in fruits, the application of Q products increased phenolic compounds synthesis; additionally, an increase in Ca and Mn concentrations was shown. KIO3 application increased the firmness and Mn. In leaves, the application of Q products increased chlorophyll a, b and calcium. In conclusion, the application of iodine improves the quality value of strawberries under normal conditions and provides an enhancement of salt stress tolerance.

Graphical Abstract

1. Introduction

Iodine is an essential trace element in mammals, but not for terrestrial plants. However, exogenous application of iodine in plants has been associated with beneficial effects, such as an increase in growth, increase in the biosynthesis of antioxidants and enhancement of tolerance stress [1]. However, the specific physiological mechanism via which this phenomenon occurs remains unclear, but is possible to attribute it to the broad oxidoreductive capacity of this element [2]. Related to the above, two functional hypotheses exist; the first one suggests a direct reaction between iodine in its reduced form and reactive oxygen species (ROS), acting as an inorganic antioxidant, most clearly evidenced in aquatic species such brown seaweed [3]; the second suggest that this element can act as a pro-oxidant, triggering a greater synthesis of antioxidants; an example of this is the positive correlation found between iodate and iodide application in crops such as tomato [4], lettuce [5], basil [6], pepper [7], grains [8], etc., and the increase in both enzymatic antioxidants such as superoxide dismutase and ascorbate peroxidase, as well as non-enzymatic antioxidants such as phenolic compounds, glutathione, and anthocyanins content, providing an increase in tolerance to adverse factors [9,10].
The strawberry crop has an enormous economic importance around the world, due mainly its high nutritional value and flavor. Mexico has a planted area of 24,600 ha, being in third place worldwide in strawberry production, below only the United States and China [11].
Salinity is a major abiotic stress that restricts plant productivity caused by ionic and osmotic unbalance, affecting the metabolism, homeostasis and growth [12]. It is estimated that at least a third of agricultural land in the world is affected by high salt content [13]. Particularly, strawberry plants exhibit a great sensitivity to salinity [14], their optimum electrical conductivity (EC) being between 1 and 1.5 dS; values above these cause adverse effects on metabolism [15].
For that reason, the principal objective of this research work was to determine the effect of the application of iodine-based products, Q products (Q 2000 plus®, Q irrigation®, Q catalyst® and Q energy®, Quimcasa de México, Naucalpan, Mexico) and KIO3, on growth, antioxidant content, essential minerals, iodine accumulation and fruit quality, in order to establish if they provide enhancement against stress conditions.

2. Materials and Methods

2.1. Plant Material and Growth Conditions

On June 2019, strawberry plants cv San Andreas were planted in 10 L containers filled with loam soil + perlite (1:1 v/v), with content of organic matter 4.9%, C.E. 0.58 dS m−1, pH(water) 7.59 and the following concentration of available forms of nutrients was measured: N 0.5 meq L−1, P 0.5 meq L−1, K 10 meq L−1, Ca 50 meq L−1, S 5 meq L−1, Mg 15 meq L−1, Na 7.54 meq L−1, Fe 4 mg L−1, Zn 1.8 mg L−1, Mn 8.7 mg L−1, Cu 0.5 mg L−1, B 0.76 mg L−1. Nutrition was applied one day after plant establishment by an automated irrigation system, starting with the application of humic acids at 3.8 Kg ha−1, continuing with nutritive solution containing MgSO4 0.5 meq L−1, KNO3 5.65 meq L−1, H3PO4 12.5 mL [16] and ending with citric acid at 15 kg ha−1, rotating once per week. The pots were kept in a greenhouse in Saltillo, Coahuila, Mexico. During the experiment the average temperature was 21 °C and relative humidity 51%.

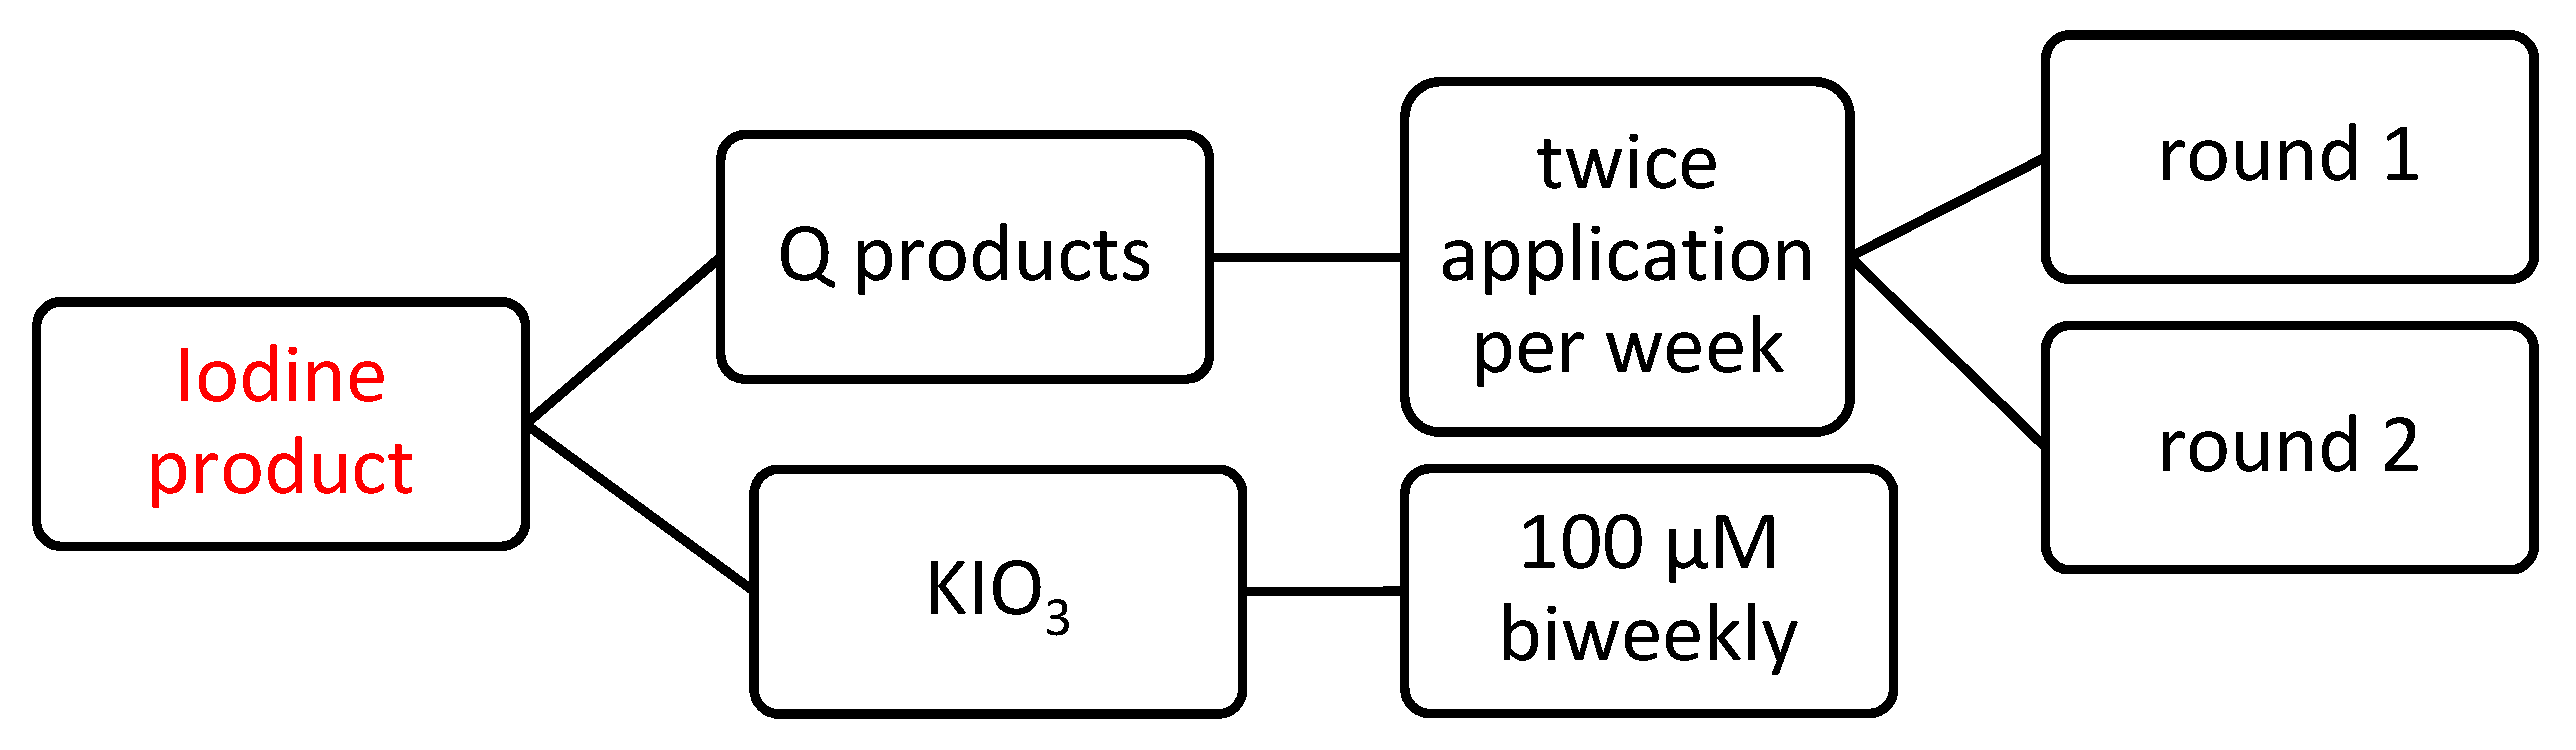
2.2. Iodine Based Products Application and Salt Stress Conditions

Application of iodine based products, via foliar, started one week after plantation (June 2019), until the end of the crops cycle (January 2020). These consisted of two sources of iodine: KIO3 (reagent grade) applied biweekly at 100 µM, and Q products® applied twice weekly in two different rounds, as indicated in Figure 1 and Table 1, under normal conditions (EC. 1.5 dS m−1). Salt stress started seven weeks after plantation applying NaCl 10 mM, reaching an electrical conductivity (EC) of 2.5 dS m−1.
The experimental design was completely randomized and treatments were applied in plants with and without stress conditions, as shown in Table 2, every treatment with 25 repetitions giving a total of 150 strawberry plants.

2.3. Plant Sampling

Three samplings were carried out to determine growth. The first was carried out at 12 weeks after plantation (wap), in seedling stage; the second was carried out at 19 wap, in the flowering stage and the third was carried out at 30 wap, during full fruit production. Sampling was done in a completely randomized way; five plants were taken from each treatment and the number of leaves, crowns, foliar area, and fresh and dry weight of leaves, stems and roots, as well as fruit weight, were measured non-destructively.
In the third sampling, additionally to growth, antioxidants, essential minerals (N, P, K, Ca, Mg, Fe, Mn, Cu and Zn), quality of fruit and iodine content in leaves and fruits were evaluated.

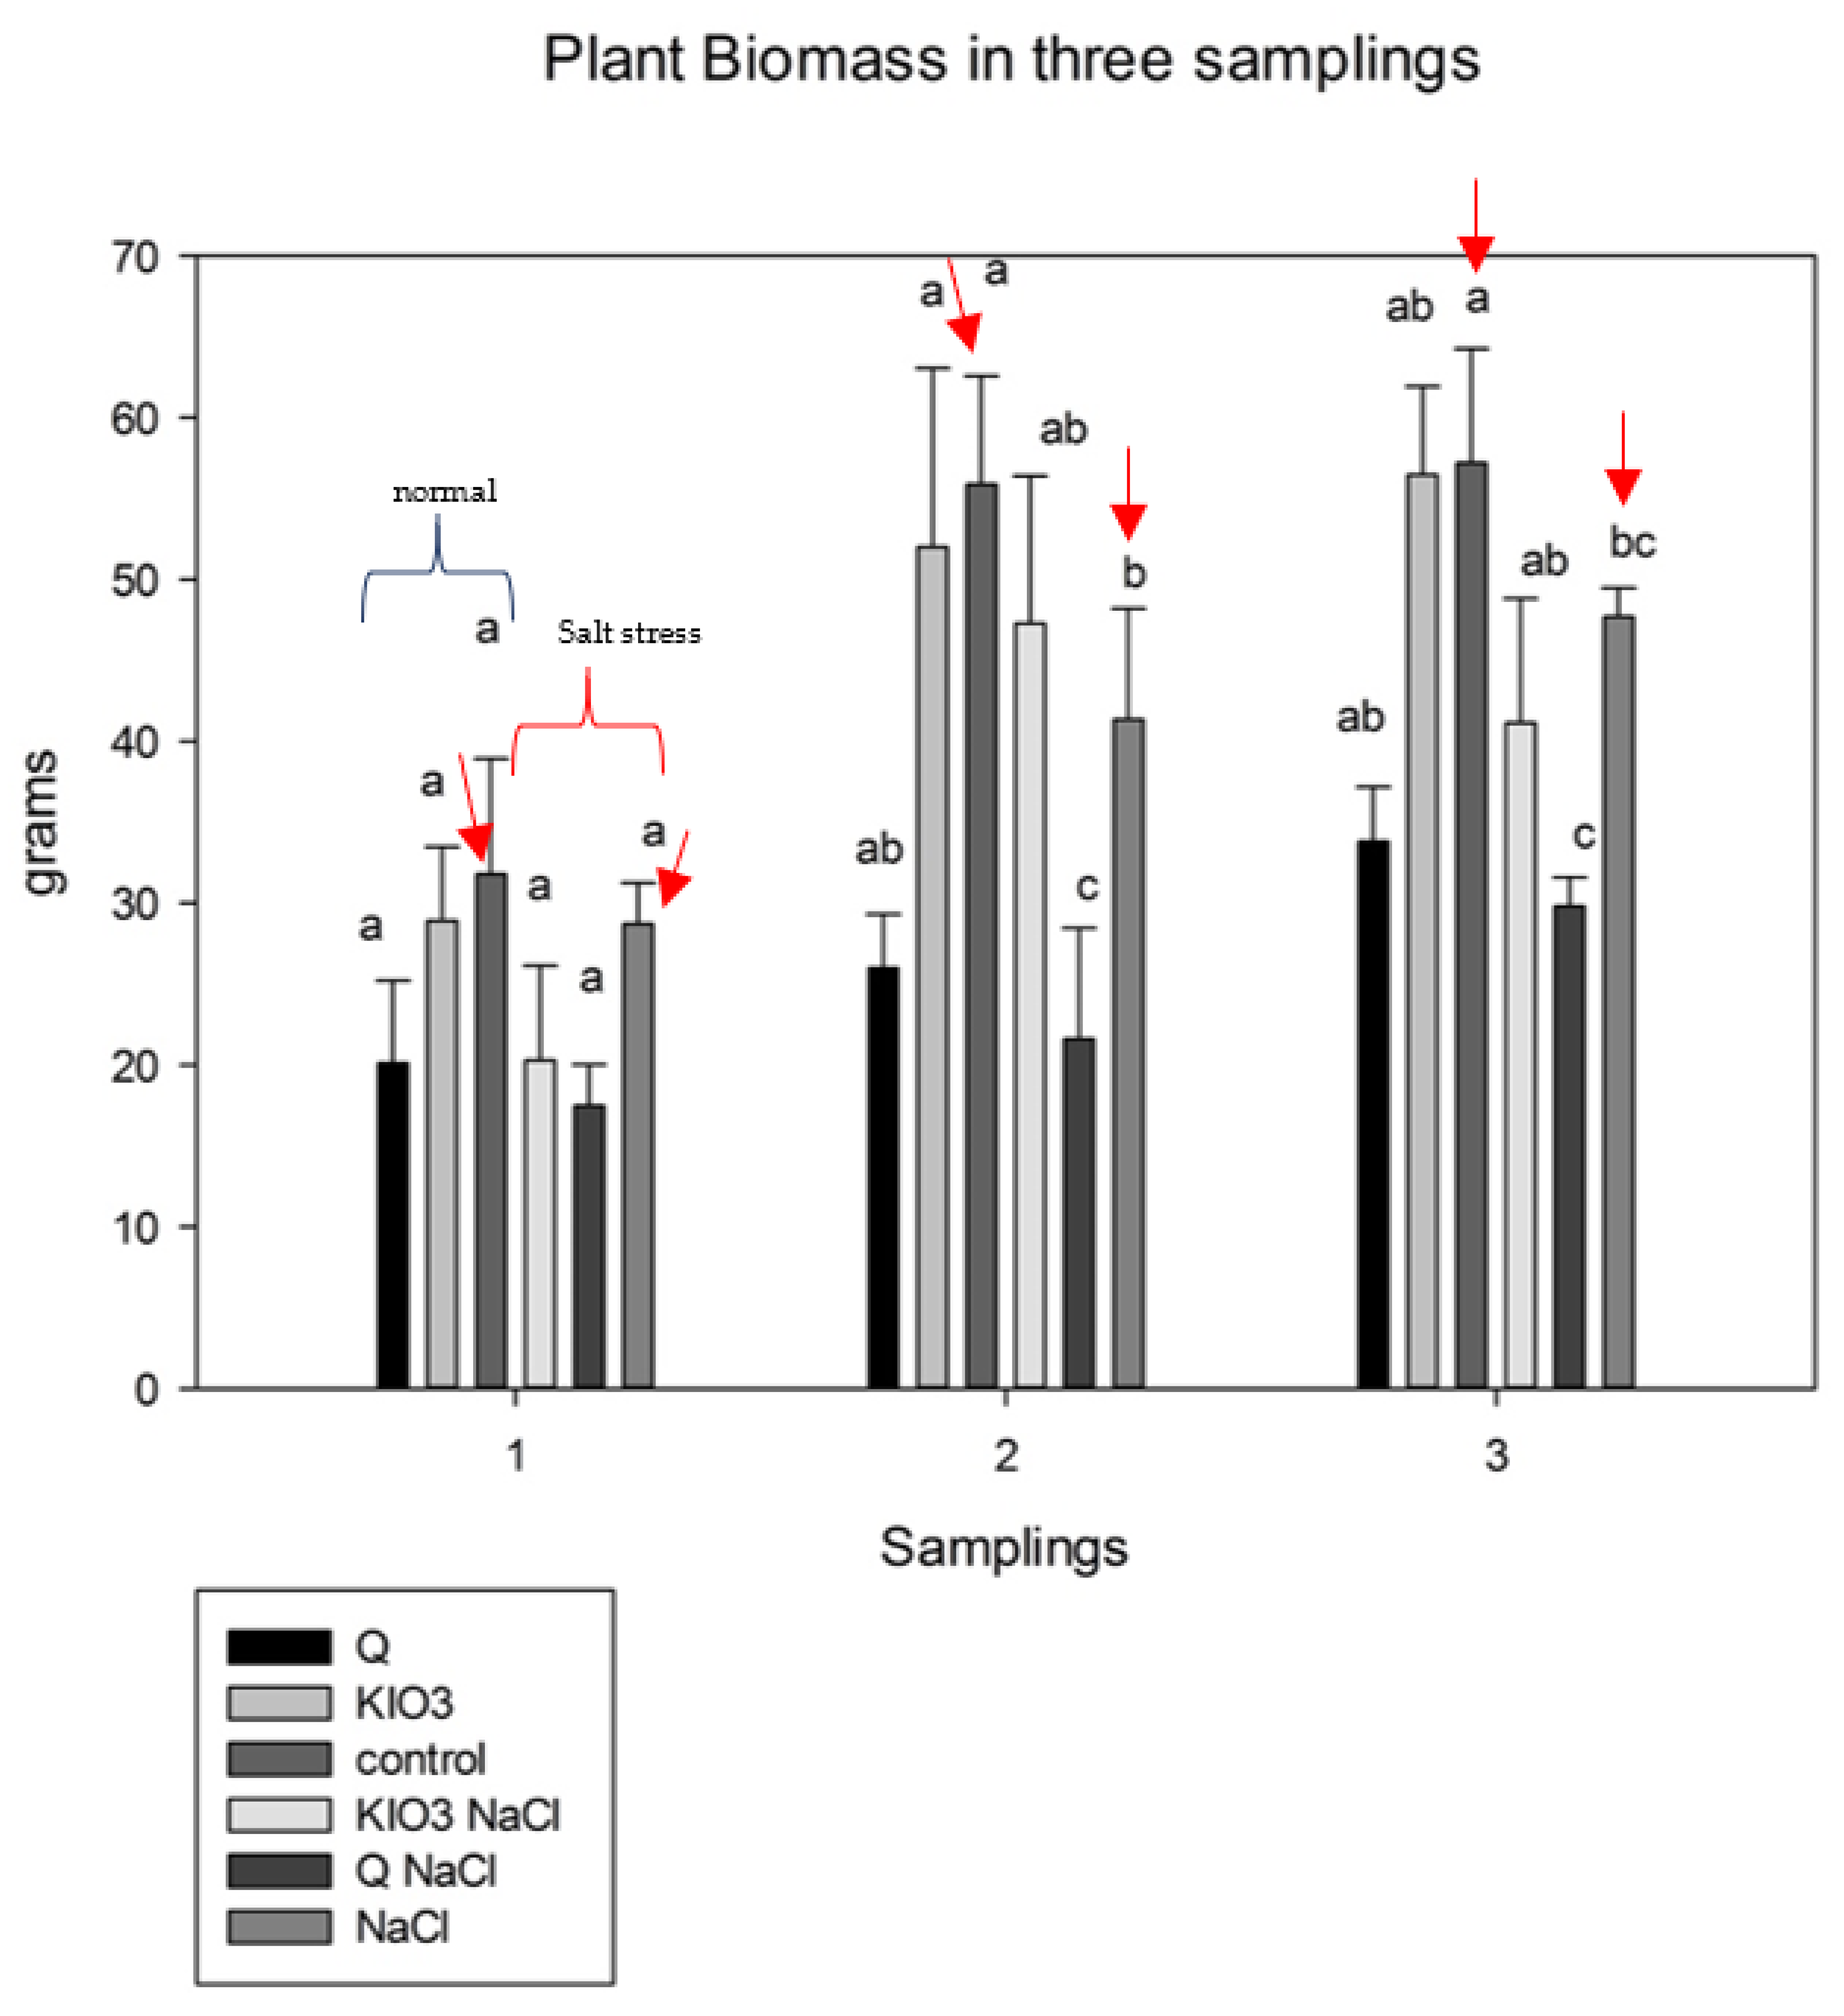
2.4. Quantification of Plant Growth

Leaf area
 
The leaf area was measured with a Li-Cor model 3000 A leaf area integrator with 0.1 mm2 resolution along the leaf blade, expressed in units of cm2.
Fresh weight
 
The plants were divided into stems, roots and leaves, then washed and drained and weighed using an OHAUS (Ohaus Inc., Parsippany, NJ, USA) digital scales, recording the fresh weight. Subsequently, they were placed in a drying oven for 48 h at a temperature of 70 °C and then weighed again, the dry weight recorded and expressed in grams.
Dry weight
 
The stems, roots and leaves were weighed after 48 h of drying, using a digital scale, recording the weight in grams.

2.5. Determination of Antioxidants

Phosphate buffer extraction
 
The sampled plant tissue was lyophilized and macerated with a mortar, then 100 mg of pulverized tissue were weighed and placed in tubes, then 10 mg of polyvinyl pyrrolidone, 2 mL of 0.1 M phosphate buffer pH 7.2 were added and sonicated for 10 min; subsequently it was subjected to microcentrifugation at 12,000 rpm for 10 min at 4 °C, then the supernatant was collected and filtered with a nylon membrane [17]. Finally, it was diluted 1:15 with phosphate buffer.
Water-acetone extraction
 
Powder tissue was weighed (100 mg) and placed in tubes, then 2 mL of the water: acetone solution was added in a 1:1 ratio. This was vortexed for 30 s, then sonicated for 5 min and finally subjected to microcentrifugation at 4 °C at 12,500 rpm for 10 min. The supernatant was filtered and placed in an amber tube.
Ascorbic acid (Asa)
 
Ascorbic acid was quantified by liquid chromatography (HPLC), using the water: acetone extract, under the following chromatographic conditions: mobile phase NaH2PO4 50 mM pH 2.8: acetonitrile (80/20), flow 1 mL min−1, wavelength at 230 nm, Aquasil C-18 column, in a run time of 16 min [18].
Total phenols (Phe)
 
Total phenolic compounds were quantified from the water:acetone extract, according to [19], using a Folin-Ciocalteu reagent. The results were expressed in grams of gallic acid/kg dry tissue.
Superoxide dismutase (SOD)
 
The quantification of SOD was carried out from the phosphate buffer extract, using a Cayman® 7060002 commercial kit (Cayman chemical company, Ann Arbor, MI, USA.). In principle, the oxidation of the WST (Water soluble tetrazolium salt) dye is formed by the superoxide ions by the whole xanthine (XO)/xanthine (X) oxidase. The inhibition in WST oxidation is attributed to the neutralization of superoxide radicals by SOD.
Total proteins
 
Total proteins were quantified according to the method established by Bradford [20], the units expressed in g proteins kg−1 dry tissue.
Ascorbate peroxidase (APX)
 
The activity of the APX enzyme was determined at room temperature (25 °C) and proceeded as follows: 0.1 mL of the biomolecules extract, 0.5 mL ascorbate at 10 mg L−1 and 1 mL 100 mM H2O2 were added to a centrifuge tube. After 5 min the reaction was stopped with 0.4 mL of 5% trichloroacetic acid. The ascorbate consumption rate was quantified at 266 nm by spectrophotometer uv-vis. The units of activity (IU) were expressed in (ppm ascorbate) min−1/total proteins [21].
Catalase (CAT)
 
Catalase activity was quantified by spectrophotometry, carried out by measuring two reaction times, time 0 min (T0) and time 1 min (T1). The reaction mixture for the blank was prepared by adding 0.1 mL of the biomolecules extract, 1 mL of phosphate buffer pH 7.2 and 0.4 mL of 5% trichloroacetic acid, and the reaction mixture for T0 was prepared by adding 0.1 mL of extract of biomolecules, 1 mL of 100 mM H2O2 and, immediately afterwards 0.5 mL of the 5% acid. The same process was applied for T1, except that the 0.5 mL of 5% acid was applied after 1 min of reaction between the extract and peroxide. The reaction was carried out at room temperature, under constant stirring. Finally, the consumption of H2O2 was read at 270 nm in a uv-vis spectrophotometer. The units of activity (IU) were expressed in mM H2O2 min−1/total proteins [22].
Glutathione peroxidase (GPX)
 
GPX activity was measured using the modified method of [23]; 0.2 mL of the extract was placed in tube, plus 0.5 mL of 1 mM reduced glutathione and 0.2 mL of 0.067 M Na2HPO4, then 0.2 mL of 1.3 mM H2O2. This was allowed to react for 10 min and was stopped by adding 1 mL of 1% trichloroacetic acid. This mixture was then centrifuged at 3000 rpm for 10 min, and subsequently 0.48 mL of the supernatant were placed in another tube plus 2.2 mL of 0.32 M Na2HPO4 and 0.32 mL of 1 mM of the 5.5 dithio-bis-2 nitro benzoic acid (DTNB). This was read in a spectrophotometer at 412 nm [24].
Glutathione (GSH)
 
GSH quantification was carried out by placing 0.48 mL of buffer extract plus 2.2 mL Na2HPO4 at 0.32 M and 0.32 mL 1 mM DTNB. This was allowed to react for 15 min at room temperature. Finally, this mixture was read in a uv-vis spectrophotometer at 412 nm. The results were expressed in mM. [25].
Total anthocyanins
 
For the extraction of anthocyanins, 100 mg of lyophilized fruit were weighed and 2 mL of the extraction solution (ethanol/water/concentrated HCl) were added in a 70:29:1 ratio. It was subjected to homogenization using the vortex and subsequently separated by centrifugation at 12,000 rpm for 10 min. The supernatant was read at 540 nm in a uv-vis spectrophotometer. The concentration was calculated with the following formula and the results expressed in equivalents of malvidin-3-glucoside [26].
TA = (A540nm) (Pm of malvidin glucoside) (1000)/(dilution factor)/(molar extinction coefficient) (path).
Chlorophylls (Chlo)
 
The chlorophyll content was quantified by the method proposed by [27]. 1 g of fresh plant material was weighed, homogenized in mortar, then 5 mL of 90% acetone were added. Additionally, 10 mg of magnesium carbonate was added (to protect and stabilize the chlorophylls). Then 2 mL of the extract were taken and placed in a centrifuge tube and centrifuged for 5 min at 10,000 rpm at 2 °C and the supernatant was extracted. Chlorophylls a and b were quantified by reading absorbances at 663 and 645 nm, respectively, and 90% acetone was used as a blank. The total chlorophyll content was expressed as µg g−1, and was determined using the following formulas.
Chlorophyll a (µg·g−1) = 25.38 × A663 + 3.64 × A645
Chlorophyll b (µg·g−1) = 30.38 × A645 − 6.58 × A663
Chlorophyll total (µg·g−1) = 18.8 × A663 + 34.02 × A645

2.6. Determination of Essential Minerals

Acid digestion of plant tissue
 
Dehydrated samples were weighted (1 g) and placed in beakers, then 30 mL of nitric acid were added for a period of 4 h on a heating plate until the clarification of the mixture. Finally, it was graded with distilled water to 100 mL and filtered with Whatman # 41 paper [28].

2.7. Quantification of Minerals

The K, Ca, Mg, Mn, Fe, Zn and Cu were quantified using a Varian spectra-240 fs (Agilent technologies, Inc., Santa Clara, CA, USA) atomic absorption spectrophotometer (AA) with flame. Phosphorus (P) was analyzed by uv-vis spectrophotometer, following the amino-naphthol-sulfonic acid (ANSA) technique according to [29]. Results of macro-elements were reported in % (g element/100 g plant tissue) and microelements in ppm (mg element/kg plant tissue).

2.8. Quantification of Iodine Concentration

Iodine was extracted from leaves and fruits using the alkaline ash technique modified by [30]; 1 g of dry plant tissue was weighed and placed in crucibles at constant weight. Later 2 mL 2 M KOH and 1 mL of 2 M KNO3 were added and the mixture placed in an oven at 100 °C for 2 h. Subsequently, the crucibles were put in a muffle at 580 °C for 3 h. Finally, the iodine was extracted with 2 mL of KOH at 2 mM. Quantification was performed using inductively coupled plasma-optical emission spectrometry (ICP-OES), Agilent 725. The results were expressed in mg I per kg of dry tissue.

2.9. Fruit Quality

Firmness
 
The firmness of the strawberry fruits was measured with a GY-03 penetrometer. At an opposite point, the fruit was firmly grasped and the single-impulse penetrometer was introduced up to the mark, the reading was taken and the results obtained in kg/cm2.
Brix grades
 
This measurement was made with the use of a manual refractometer, placing a drop of strawberry fruit juice and closing the lid gently so that the sample covered the surface of the prism; observing through the sight glass, the reading was taken directly and reported in o brix.
% Loss of Firmness
 
For this analysis firmness was measured as previously described and this was repeated after 7 days. To calculate the % loss of firmness the following formula was used:
% loss of firmness = (firmness day 1 − firmness day 7)/((firmness day 1) × 100)

2.10. Fruit Production

The harvest was collected according to the maturity of the fruit, determined by the color according to the Source: NMX-FF-062-SCFI-2002; all the fruits were harvested at the maturity stage chosen in each of the cuts that were made during the whole productive cycle; labeled according to the treatment and the plant number, they were weighed in a semi-analytical scale, and results reported in grams per plant.

2.11. Statistical Analysis

The statistical analysis was carried out in two forms, univariate and multivariate. Univariate was performed using an analysis of variance one way (ANOVA) with 5 repetitions per treatment. Each plant was considered as an experimental unit, followed by a test of means of least significant difference (LSD, p < 0.05). For multivariate, a multiple linear regression was performed with Pearson correlation and principal components analysis (PCA) obtained from the correlation matrix, thus reducing the dimensionality of the database, both analyses using the Infostat software package (2018 version).

3. Results

3.1. Growth Parameters—Anova One Way

As can be seen in Figure 2, the harmful effect of salinity stress was evidenced in the second and third sampling through the reduction of biomass, by 26% and 16.7%, respectively; the red arrows indicate the control plants and NaCl control.
The results indicated that under normal conditions the application of iodine-based products did not affect the plant biomass in any of the three samplings, compared with control. On the other hand, under salt conditions in the first and third sampling there were were no differences between the biomass of the treated and the control plants; however, in the second sampling the applications with Q products® (Quimcasa de México, Naucalpan, Mexico) showed a reduction in biomass, compared with control.
Table 3 shows results for growth parameters, number of leaves, crowns, leaf area (LA), fresh weight of leaves (FWL), stem (FWS) and root (FWR), as well as the total fresh weight (TFW) of the treated and control plants. It was found that the number of leaves, the number of crowns, the foliar area, and the fresh weight of the stem and leaves were not modified by any treatment or by saline stress. However, the reduction in fresh weight of the root, as well as of total fresh by the application of both sources of iodine under normal conditions and under conditions of salinity stress did not show statistically significant differences compared to the NaCl control plants.

3.2. Antioxidants

3.2.1. Fruits

Table 4 show the results obtained for antioxidant content in strawberry fruits under normal and stress conditions. Regarding the concentration of ascorbic acid, modifications were not found by any treatment, with or without salinity stress. Total protein content decreased with the application of Q products in both conditions, as well as plants under stress and treated with KIO3. Regarding the antioxidant activity of the main enzymes, it was evidenced that SOD did not show statistically significant differences between treatments, with and without conditions. However, the ascorbate peroxidase and catalase activity increased after the application of Q products under stress conditions.
An increase in GPX activity was presented in plants under saline stress without treatments, a phenomenon that did not occur in plants under the same stress conditions treated with any of the iodine products. Consistent with the above, a reduction in the glutathione concentration was found in the NaCl control plants, as well as an increase in GSH after the application of both sources of iodine under salt stress.
No differences were observed between control and treated plants under normal conditions.
The content of total anthocyanins decreased with KIO3 treatment in comparison with the absolute control and NaCl control plants.
The antioxidant capacity did not show changes between treatments or stress conditions.

3.2.2. Leaves

Table 5 shows the results obtained from antioxidants and metabolites in leaves under normal and salt stress conditions, and it was found that after Q products application the content of chlorophyll a, b and total increased under normal conditions compared with the control. However, the same trend was found in the NaCl control plants. After application of KIO3 a reduction in total phenolic compounds was also evidenced. Under salt stress conditions it was found that, for the plants treated with KIO3, the content of ascorbic acid increased, while plants treated with Q products showed a reduction in GSH content.

3.3. Essential Minerals

3.3.1. Fruits

Table 6 shows the results of essential macro elements, expressed in % (g mineral/100 g dry tissue) and microelements expressed in ppm (mg kg−1) in the fruits of strawberry plants under normal and stress conditions. Salinity stress led to a reduction in the concentration of potassium and magnesium, but K deficiencies were reduced after the application of both sources of iodine (KIO3 and Q products) and for magnesium only with the application of Q products. A higher phosphorus concentration was also found after the application of KIO3 under salinity conditions compared to both controls. Additionally, the calcium concentration was increased with the application of Q products with and without salt stress. Finally, both iodine treatments promoted an increase in manganese content under normal conditions, no differences found in iodine concentration.

3.3.2. Leaves

In Table 7 are shown the results obtained from the essential macro-elements in the leaves of plants under both conditions. In plants that were subjected to salinity stress, an increase in the concentration of Na was evidenced as well as a reduction in calcium, a fact that was mitigated with the application of Q product. An increase in P and Mn content was also found with the same treatment. Regarding iodine accumulation, the highest concentrations were found with the application of both sources of iodine under salinity stress compared to both controls.

3.4. Production and Fruit Quality

In Table 8 are shown the results of yield and fruit quality in plants under both conditions, and an enhancement in yield was evidenced with Q products application under salt stress. Additionally, an increase in firmness and a reduction in the loss of firmness were found with the application KIO3 without salt stress.

3.5. Multivariate Analysis

Multiple Lineal Regression: Pearson Correlation

A multiple linear regression was performed, using the Pearson correlation to observe the relationships between variables (see Table 9), and among the highlights a significant correlation was found between antioxidant potential and ascorbic acid concentration (0.6), superoxide dismutase activity (0.9), glutathione peroxidase (0.8), and reduced glutathione (0.7).
Additionally, a correlation was found between iodine and total phenolic compounds (0.9), superoxide dismutase (0.9), glutathione peroxidase (0.9), and reduced glutathione (0.9), total anthocyanins (0.9) and antioxidant potential (0.9). The variables correlating with both dry and fresh weight and yield were total proteins, phenolic compounds and enzymes with antioxidant activity.

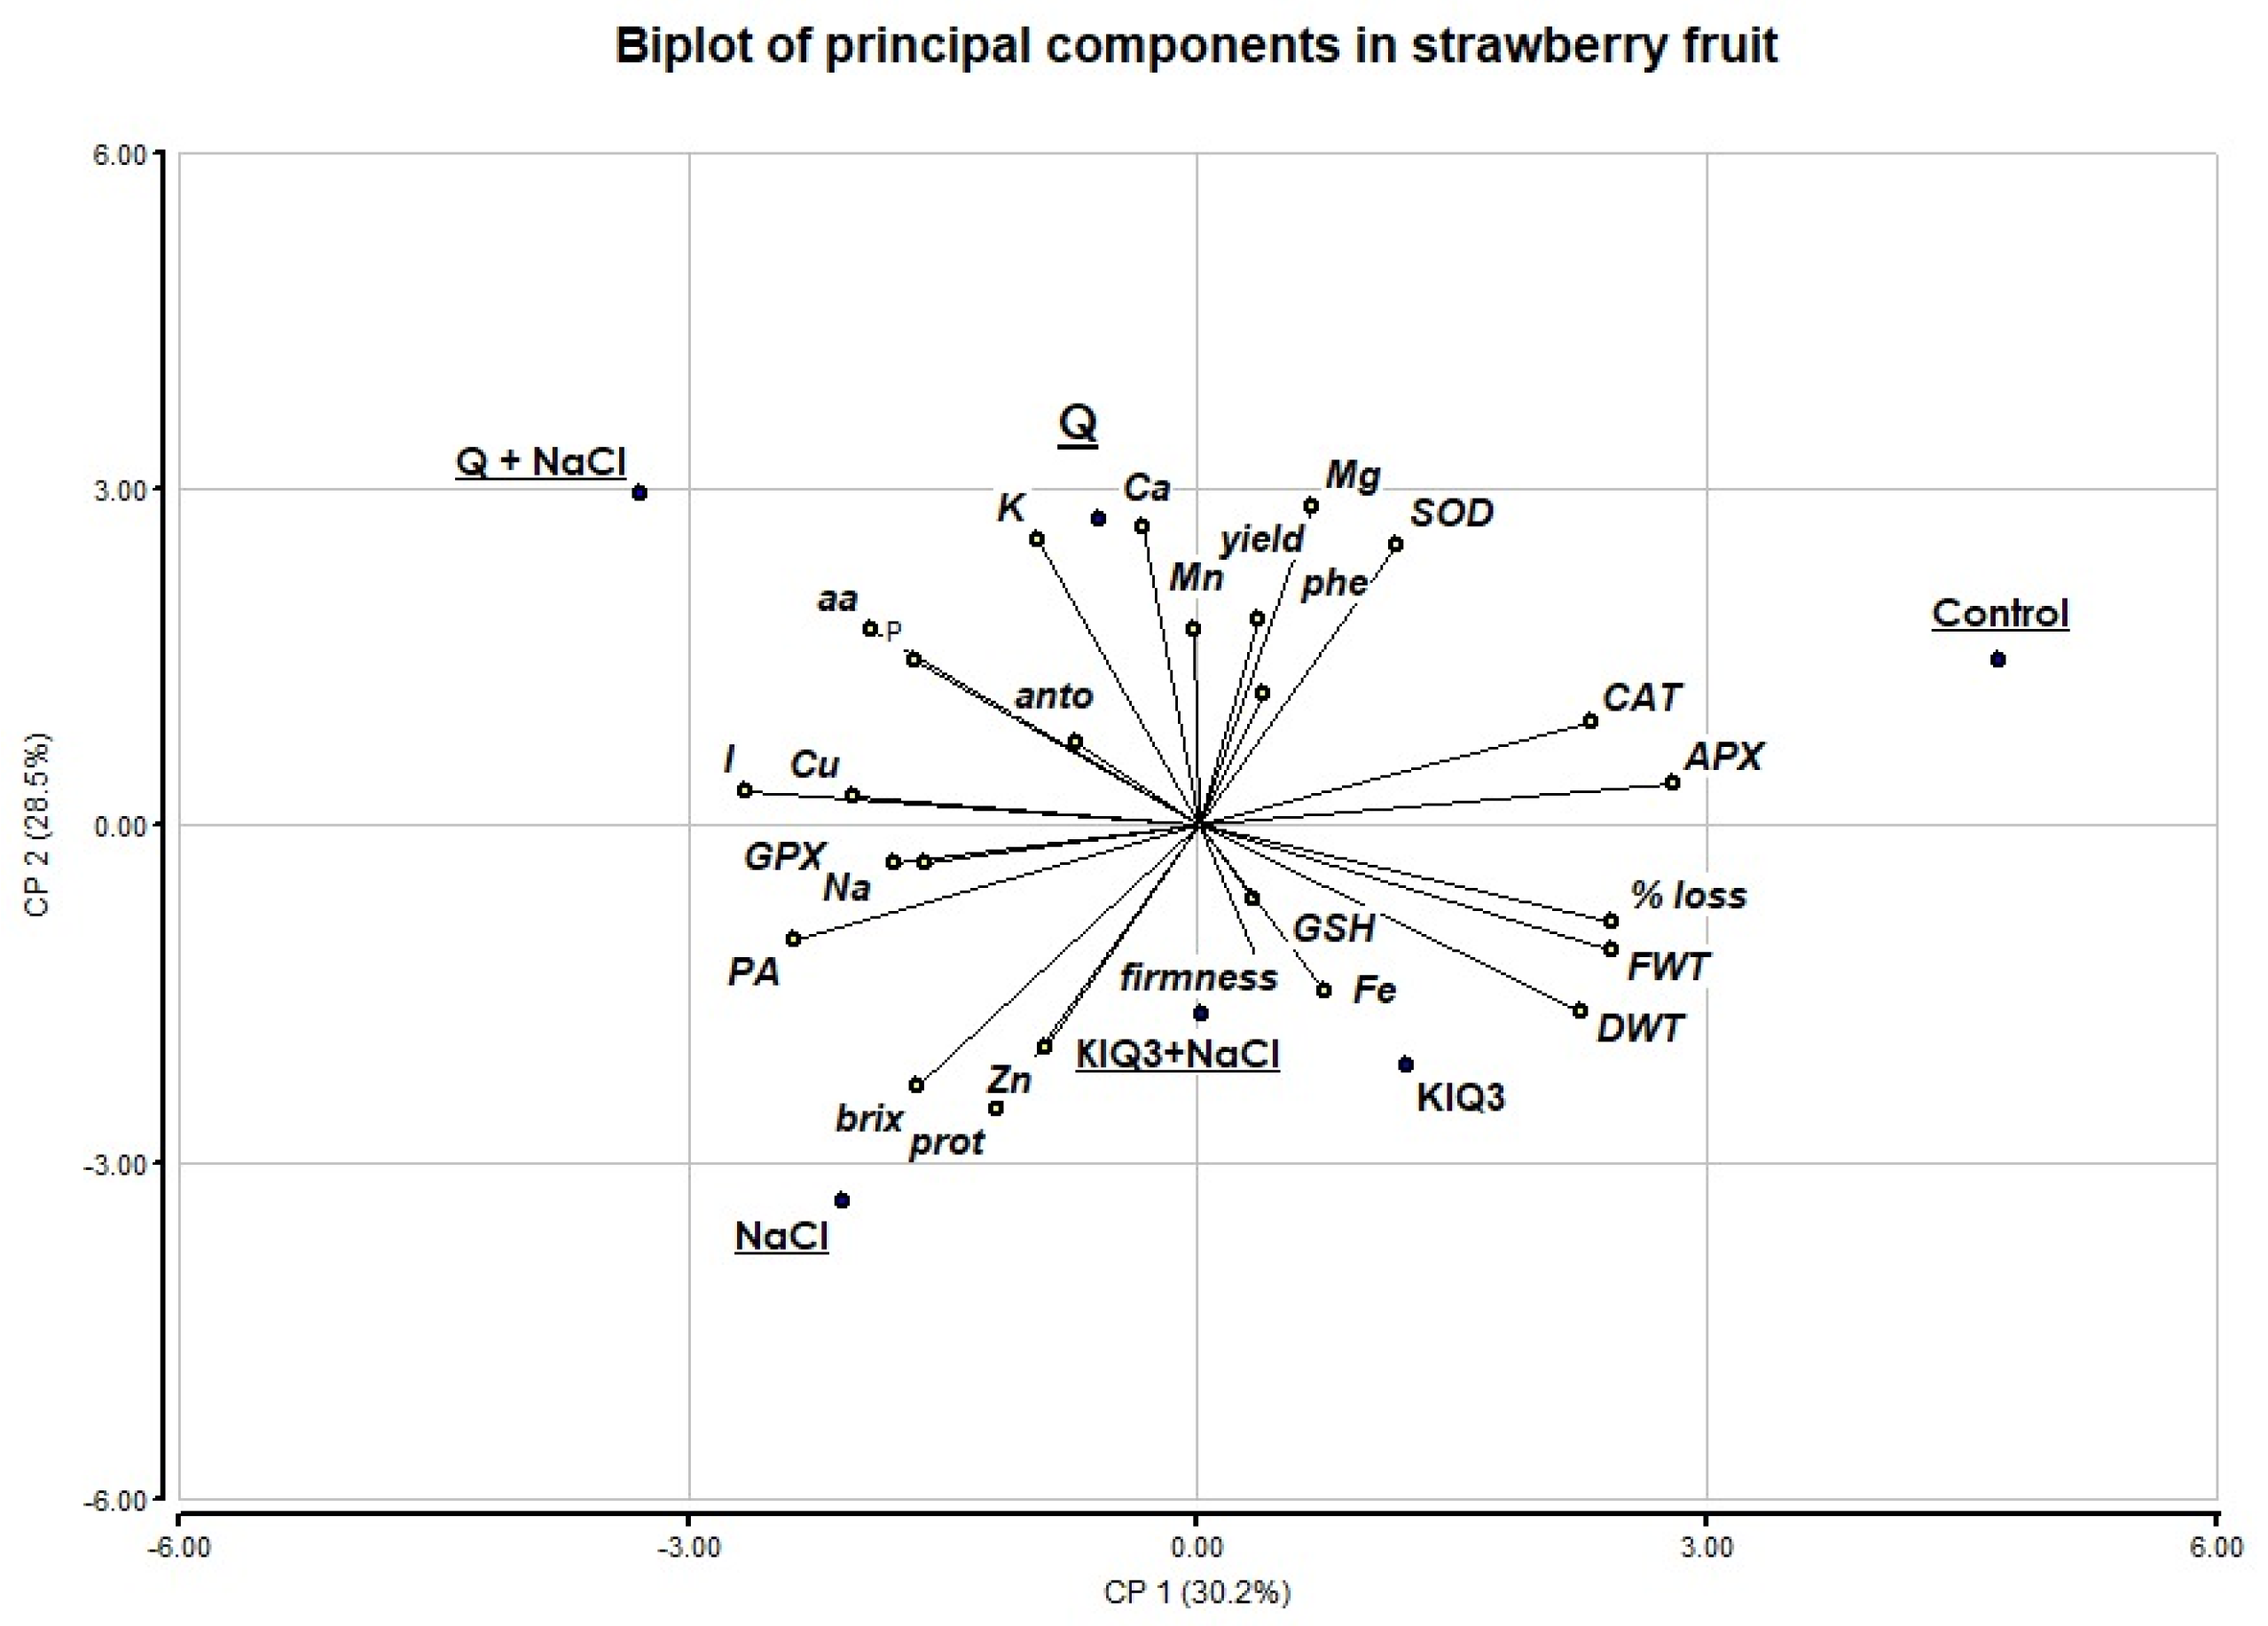
3.6. Principal Components Analysis (PCA)

The multivariate analysis of principal components evidenced that 58.7% of variance was explained by two principal components, and as can be observed in Figure 3 there is a positive correlation between the content of phenolic compounds, the activity of SOD, potassium, magnesium, calcium, manganese and yield with Q treatment under stress conditions, compared to tendency of control plants (NaCl).
In addition, a positive correlation was found between the enzymatic activity of ascorbate peroxidase, catalase, reduced glutathione, fresh and dry weight, and % loss of firmness with the application of the KIO3 treatment, under stress conditions, compared to control plants (NaCl).
Through this multivariate analysis, no difference in tendency was found between treatments and control under normal conditions.

4. Discussion

One strong piece of evidence to define stress condition is plant biomass and yield [31]. In the present research, it was found that the application of iodine-based products does not modify the growth of plants under normal conditions, but neither does it prevent the reduction of biomass under salt stress conditions. However, the yield, quality and nutraceutical value of strawberry fruits were improved.
Regarding the quality and nutraceutical value of the fruits, under normal conditions an increase in the concentration of non-enzymatic antioxidants such as phenolic compounds was found after the application of Q products, where free iodine is the active principle. Similar results were found in the content of total phenolic compounds with the foliar application of KIO3 at <80 µM in basil [32] and lettuce [33] plants, arguing for a possible enhancement in the synthesis of the main enzymes of the shikimate pathway and phenylpropanoids, shikimate dehydrogenase (SKDH) and phenylalanine ammonium lyase (PAL). Additionally, the increase in these compounds was correlated with photoprotection in photosynthetic pigments due to their antioxidant activity, a case similar to the present research, where an increase in chlorophyll a and b was evidenced.
However, with this same treatment, a reduction in total protein content as well as in GPX activity was also found. Despite that many examples exist in the literature of iodine application in plants associated with an improvement or maintenance in nutritional quality parameters, negative effects have also been reported in the concentration of bioactive compounds. An example of this was an experiment carried out with lettuce grown in hydroponics, where the application of KI at 80 µM led to a reduction in the activity of SOD [34], mainly due to the chemical species that is applied and, therefore, the oxidoreductive effect on the different metabolites [35]. The only constant in the application of the different chemical forms of iodine and its impact on the metabolic machinery this change. Gradually, adequate concentrations have been elucidated, depending on the culture and doses.
In leaves treated with Q products, an increase in chlorophyll a, b and total was evidenced, as well as a reduction in total phenolic compounds in the plants that were treated with KIO3. The yield and vigor of plants are highly dependent on photosynthesis, so the chlorophyll content is an indicator of the photosynthetic capacity of plants. Several studies have evaluated the impact of the application of iodine on this indicator. An example of this was reported in pepper, where after the application of low doses of I, an increase in Chlo a was found, and, at high iodine concentrations, a decrease occurred coupled with a reduction in biomass [36], Wang et al. (2008) [37] in an experiment with cabbage concluded that, after absorption and transport via phloem of iodine, this is selectively stored in the chloroplasts of the leaves. The same author [38] in another experiment carried out with different horticultural species argues that this is due to a balance between cations, mainly K, which is required for electrical balance in the production of ATP in chloroplasts and anions, which, if iodine is present, will compete with other anions to join the redox reaction.
Several studies have concluded that, as a consequence of salt stress, an overproduction of reactive oxygen species (ROS), such as superoxide (O2), peroxide (H2O2) and hydroxyl (OH), occurs, which lead to an imbalance in redox metabolism [39]. Among the defense mechanisms that plants use to face this oxidative stress is the synthesis of enzymatic antioxidants, which enter the primary defense line, such as superoxide dismutase, catalase, ascorbate and glutathione peroxidase, peroxide being the substrate of the last three. There is also a wide arsenal of non-enzymatic antioxidants such as glutathione, ascorbate, and phenolic compounds, among other molecules with reducing power [40]. In the present research, it was found that under stress conditions with Q products applications, the activity of ascorbate peroxidase and catalase increased, as well as the concentration of reduced glutathione in the fruits, and a reduction in GPX activity was also found with the application of KIO3. Similar results were found by [41], where the authors argue that the application of iodine produces a possible modification in the Halliwell-Asada cycle.
In the leaves under stress conditions, a reduction in the content of GSH was evidenced with the application of Q products, as well as of total phenolic compounds in the plants treated with KIO3. As previously described, the hypothesis of the mechanism by which bioactive compounds are affected is directly related to the chemical species applied; however, with respect to GSH, it is worth mentioning that it is a tripeptide which is constantly changing its oxidized form; glutathione disulfide (GSSH) both maintains the redox status in the cell, and reduces to GSH through the catalysis of the enzyme glutathione reductase (GR) in the presence of NADPH [42]. On the one hand, the iodine accumulated can act as a bio-stimulant in the synthesis of antioxidants or act as electron donor directly. This can also be observed in the multiple linear regression analysis where iodine has a positive correlation with antioxidant potential, GSH, GPX activity and total phenolic compounds. Therefore, to gain a bigger picture, the quantification of the main antioxidant molecules such as those mentioned above must be extended over different periods of time, which in turn increases the cost and complexity of the metabolomic analysis.
Additionally, in leaves after the application of KIO3 an increase in ascorbic acid was found, a result similar to that reported in an experiment carried out in strawberry plants, where applying concentrations >4 µM of KIO3 ascorbic acid showed the same tendency. However, at higher concentrations the result was the opposite [43].
It has been widely reported that the exogenous application of iodine not only impacts the metabolomic part, but also the ionomic system, causing beneficial effects such as cooperation in the absorption and accumulation of other elements, as well as adverse effects such as antagonism to essential minerals.
In the present research, a strong impact on the concentration of essential minerals was found, for example, in fruits under normal conditions, an increase in the concentration of calcium and manganese, while in the leaves an increase was found only in calcium with the application of Q products. Similar results were obtained in an experiment carried out on lettuce with two iodine application forms (soil and foliar), different chemical species (KI and KIO3) and different doses; an increase in the concentration of K, Mg, Ca and Mn was found, regardless of the application method, dose or chemical species [44], indirectly supporting the hypothesis that iodine application at low concentrations has a positive influence on plants. The same author, in a similar experiment carried out in carrots, showed different elemental relationships arguing for differences related to plant species [45].
Under stress conditions, an increase in calcium, magnesium and potassium was found in fruits with the application of Q products, evidenced by both statistical analysis (Anova one way), as well as multivariate analysis of principal components, while in the leaves an increase in manganese, calcium and phosphorus was found, with no evidence of the reduction of any essential element.
This phenomenon has been previously reported, but is not a fully understood mechanism. An example is [46], where an increase in macro-elements after the application of KIO3 in nopal was found. On the other hand, antagonistic effects have also been found on the concentration of essential elements in species such as lettuce [47]. This has been partly explained by the effect on the redox potential (Eh) and on the hydrogen potential (pH) during the absorption, mobilization and chemical speciation of iodine in the surrounding environment [48,49]. Ashworth et al. (2006) and Medrano Macías et al. (2016) [50,51] indicated that a change in the redox state from I- to I2 produces a potential of −535 V, and probably KIO3 can provide a similar effect, thus modifying the bioavailability of other elements.
It has also been shown in aquatic organisms that the absorption of iodine is carried out by Cu-dependent enzymes, so by increasing the concentration of these elements, the activity of that enzyme increases, which will lead to an increase in the uptake of Cu, and possibly the same occurs with other Mn or Fe-dependent enzymes [52].
The complexity of the ionomic interaction is very high, so further studies on the use and application of iodine will be decisive, with the aim of not affecting essential nutritional requirements, especially when the plants are grown in soil, or of establishing a way to achieve improvement in the absorption of essential minerals.

5. Conclusions

  • The application of iodine-based products did not modify the growth of strawberry plants under normal conditions. However, stress yield and fruit quality were improved with iodine-based products.
  • Some enzymatic and non-enzymatic antioxidants were increased with the application of iodine-based products in both leaves and fruits.
  • Both under normal conditions and under salinity stress, synergy with essential elements was found in leaves and fruits treated with iodine-based products.
  • The accumulation of iodine in leaves was increased with both iodine treatments under salt stress conditions.

Author Contributions

Conceptualization, J.M.M. and P.M.L.; Methodology, J.M.M., M.G.L.C. and P.M.L.; Software, W.A.N.O.; Validation, J.M.M., E.N.R.M. and A.B.M.; Formal Analysis, J.M.M.; Investigation, M.G.L.C.; Resources, P.M.L.; Data Curation, W.A.N.O.; Writing—Original Draft Preparation, J.M.M.; Writing—Review & Editing, A.B.M., W.A.N.O. and E.N.R.M.; Visualization, A.B.M.; Supervision, J.M.M.; Project Administration, J.M.M.; Funding Acquisition, P.M.L. All authors have read and agreed to the published version of the manuscript.

Funding

This research received no external funding.

Institutional Review Board Statement

Not applicable.

Informed Consent Statement

Not applicable.

Data Availability Statement

The data presented in this study are available on request from the corresponding author.

Acknowledgments

The authors wish to thank the Quimcasa for technical support, also Hortensia Ortega Ortiz for her collaboration in the quantification of essential minerals in the Centro de Investigación en Química Aplicada and finally we wish to thank QFB. Estibaliz Torres Villarreal for her collaboration in translation of present paper.

Conflicts of Interest

The authors declare no conflict of interest. Any role of the funding sponsors in the choice of research project; design of the study; in the collection, analyses or interpretation of data; in the writing of the manuscript.

References

  1. Gonzali, S.; Kiferle, C.; Perata, P. Iodine biofortification of crops: Agronomic biofortification, metabolic engineering and iodine bioavailability. Curr. Opin. Biotechnol. 2017, 44, 16–26. [Google Scholar] [CrossRef] [Green Version]
  2. Venturi, S. Evolutionary Significance of Iodine. Curr. Chem. Biol. 2011, 5, 155–162. [Google Scholar] [CrossRef]
  3. Küpper, F.C.; Carrano, C.J. Key aspects of the iodine metabolism in brown algae: A brief critical review. Metallomic 2019, 11, 756–764. [Google Scholar] [CrossRef] [PubMed]
  4. Medrano-Macías, J.; Leija-Martínez, P.; Juárez-Maldonado, A.; Rocha-Estrada, A.; Benavides-Mendoza, A. Efecto de la aplicación de yodo sobre antioxidantes en plántulas de jitomate. Rev. Chapingo Ser. Hortic. 2016, 22, 133–143. [Google Scholar] [CrossRef]
  5. Smoleń, S.; Kowalska, I.; Sady, W. Assessment of biofortification with iodine and selenium of lettuce cultivated in the NFT hydroponic system. Sci. Hortic. 2014, 166, 9–16. [Google Scholar] [CrossRef]
  6. Kiferle, C.; Ascrizzi, R.; Martinelli, M.; Gonzali, S.; Mariotti, L.; Pistelli, L.; Flamini, G.; Perata, P. Correction: Effect of Iodine treatments on Ocimum basilicum L.: Biofortification, phenolics production and essential oil composition. PLoS ONE 2020, 15, e0229016. [Google Scholar] [CrossRef] [PubMed]
  7. Li, R.; Li, D.-W.; Liu, H.-P.; Hong, C.-L.; Song, M.-Y.; Dai, Z.-X.; Liu, J.-W.; Zhou, J.; Weng, H.-X. Enhancing iodine content and fruit quality of pepper (Capsicum annuum L.) through biofortification. Sci. Hortic. 2017, 214, 165–173. [Google Scholar] [CrossRef]
  8. Cakmak, I.; Prom-U.-Thai, C.; Guilherme, L.R.G.; Rashid, A.; Hora, K.H.; Yazici, A.; Savasli, E.; Kalayci, M.; Tutus, Y.; Phuphong, P.; et al. Iodine biofortification of wheat, rice and maize through fertilizer strategy. Plant. Soil 2017, 418, 319–335. [Google Scholar] [CrossRef]
  9. Halka, M.; Smoleń, S.; Ledwożyw-Smoleń, I.; Sady, W. Iodosalicylates and iodobenzoates supplied to tomato plants affect the antioxidative and sugar metabolism differently than potassium iodide. Folia Hortic. 2019, 31, 385–400. [Google Scholar] [CrossRef] [Green Version]
  10. Gupta, N.; Bajpai, M.; Majumdar, R.; Mishra, P. Response of iodine on antioxidant levels of Glycine max L. Grown under Cd2+ stress. Adv. Biol. Res. 2015, 9, 40–48. [Google Scholar] [CrossRef]
  11. Wu, F.; Guan, Z.; Coronado, J.J.A.; Garcia-Nazariega, M. An Overview of Strawberry Production in Mexico. EDIS 2018, 2018, 5. [Google Scholar] [CrossRef]
  12. Acosta-Motos, J.R.; Ortuño, M.F.; Bernal-Vicente, A.; Diaz-Vivancos, P.; Sanchez-Blanco, M.J.; Hernandez, J.A. Plant Responses to Salt Stress: Adaptive Mechanisms. Agronomy 2017, 7, 18. [Google Scholar] [CrossRef] [Green Version]
  13. Parihar, P.; Singh, S.; Singh, R.; Singh, V.P.; Prasad, S.M. Effect of salinity stress on plants and its tolerance strategies: A review. Environ. Sci. Pollut. Res. 2015, 22, 4056–4075. [Google Scholar] [CrossRef]
  14. Crizel, R.; Perin, E.; Siebeneichler, T.; Borowski, J.; Messias, R.; Rombaldi, C.; Galli, V. Abscisic acid and stress induced by salt: Effect on the phenylpropanoid, L-ascorbic acid and abscisic acid metabolism of strawberry fruits. Plant. Physiol. Biochem. 2020, 152, 211–220. [Google Scholar] [CrossRef]
  15. D’Anna, F.; Incalcaterra, G.; Moncada, A.; Miceli, A. Effects of different electrical conductivity levels on strawberry grown in soilless culture. ACTA Hortic. 2003, 609, 355–360. [Google Scholar] [CrossRef]
  16. Steiner, A.A. A universal method for preparing nutrient solutions of a certain desired composition. Plant. Soil 1961, 15, 134–154. [Google Scholar] [CrossRef] [Green Version]
  17. Ramos, S.; Faquin, V.; Guilherme, L.; Castro, E.; Ávila, F.; Carvalho, G.; Bastos, C.; Oliveira, C. Selenium biofortification and antioxidant activity in lettuce plants fed with selenate and selenite. Plant. Soil Environ. 2010, 56, 584–588. [Google Scholar] [CrossRef] [Green Version]
  18. Nour, V.; Trandafir, I.; Ionica, M.E. HPLC organic acid analysis in different citrus juices under reversed phase conditions. Not. Bot. Horti Agrobot. Cluj-Napoca 2010, 38, 44–48. [Google Scholar] [CrossRef]
  19. Yu, Z.; Dahlgren, R.A. Evaluation of Methods for Measuring Polyphenols in Conifer Foliage. J. Chem. Ecol. 2000, 26, 2119–2140. [Google Scholar] [CrossRef]
  20. Cheng, Y.; Wei, H.; Sun, R.; Tian, Z.; Zheng, X. Rapid method for protein quantitation by Bradford assay after elimination of the interference of polysorbate 80. Anal. Biochem. 2016, 494, 37–39. [Google Scholar] [CrossRef] [PubMed]
  21. Nakano, Y.; Asada, K. Hydrogen peroxide is scarvenged by ascorbate-specific peroxidase in spinach chloroplasts. Plant Cell Physiol. 1981, 22, 867–880. [Google Scholar]
  22. Cansev, A.; Gulen, H.; Eris, A. The activities of catalase and ascorbate peroxidase in olive (Olea europaea L. cv. Gemlik) under low temperature stress. Hortic. Environ. Biotechnol. 2011, 52, 113–120. [Google Scholar] [CrossRef]
  23. Flohé, L.; Günzler, W.A. Assays of glutathione peroxidase. Methods Enzymol. 1984, 105, 114–120. [Google Scholar] [CrossRef]
  24. Xue, T.; Hartikainen, H.; Piironen, V. Antioxidative and growth-promoting effect of selenium on senescing lettuce. Plant. Soil 2001, 237, 55–61. [Google Scholar] [CrossRef]
  25. Sahoo, S.; Prakash-Awasthi, J.; Sunkar, R.; Kumar Panda, S. Methods Molecular Biology. In Determining Glutathione Levels in Plants; Sunkar, R., Ed.; Humana Press: New York, NY, USA, 2017; pp. 273–277. [Google Scholar]
  26. Atanacković, M.; Cvejić, J.; Gojković-Bukarica, L.; Veljović, M.; Despotović, S.; Pecić, S.; Gaćeša, B.; Leskošek-Čukalović, I. Quantitative determination of total anthocyanins and flavonoids in natural products obtained from grapes and malt. In Proceedings of the 6th Central European Congress on Food (CEFood 2012), Novi Sad, Serbia, 23–26 May 2012; pp. 183–188. [Google Scholar]
  27. Munira, S.; Hossain, M.M.; Zakaria, M.; Ahmed, J.U.; Islam, M.M. Evaluation of Potato Varieties against Salinity Stress in Bangladesh. Int. J. Plant. Soil Sci. 2015, 6, 73–81. [Google Scholar] [CrossRef]
  28. AOAC. Official Methods of Analysis of the Association of Official Analytical Chemists, 15th ed.; Association of official Analytical Chemist : Washington, DC, USA; 1990.
  29. Patel, S.P.; Patel, M.A.; Modi, H.R.; Katyare, S.S. Improved method for estimation of inorganic phosphate: Implications for its application in enzyme assays. Indian J. Biochem. Biophys. 2007, 44, 88–93. [Google Scholar] [PubMed]
  30. Ujowundu, C.O.; Ukoha, A.I.; Agha, N.C.; Nwachukwu, N.; Igwe, K.O. Iodine Biofortification of Selected Plants Using Potassium Iodide. Niger. J. Biochem. Mol. Biol. 2009, 24, 17–21. [Google Scholar]
  31. Eggink, L.L.; LoBrutto, R.; Brune, D.C.; Brusslan, J.; Yamasato, A.; Tanaka, A.; Hoober, J.K. Synthesis of chlorophyll b: Localization of chlorophyllide a oxygenase and discovery of a stable radical in the catalytic subunit. BMC Plant. Biol. 2004, 4, 5. [Google Scholar] [CrossRef] [PubMed] [Green Version]
  32. Puccinelli, M.; Pezzarossa, B.; Rosellini, I.; Malorgio, F. Selenium Enrichment Enhances the Quality and Shelf Life of Basil Leaves. Plants 2020, 9, 801. [Google Scholar] [CrossRef] [PubMed]
  33. Blasco, B.; Rios, J.J.; Leyva, R.; Cervilla, L.M.; Sánchez-Rodríguez, E.; Rubio-Wilhelmi, M.M.; Rosales, M. Ángel; Ruiz, J.M.; Romero, L. Does Iodine Biofortification Affect Oxidative Metabolism in Lettuce Plants? Biol. Trace Elem. Res. 2010, 142, 831–842. [Google Scholar] [CrossRef]
  34. Blasco, B.; Rios, J.J.; Cervilla, L.M.; Sánchez-Rodríguez, E.; Rubio-Wilhelmi, M.M.; Rosales, M.A.; Ruiz, J.M.; Romero, L. Photorespiration Process and Nitrogen Metabolism in Lettuce Plants (Lactuca sativa L.): Induced Changes in Response to Iodine Biofortification. J. Plant. Growth Regul. 2010, 29, 477–486. [Google Scholar] [CrossRef]
  35. Krzepiłko, A.; Prażak, R.; Skwaryło-Bednarz, B.; Molas, J. Agronomic biofortification as a means of enriching plant foodstuffs with iodine. ACTA Agrobot. 2019, 72, 1–9. [Google Scholar] [CrossRef]
  36. Li, Z.; Liang, D.; Peng, Q.; Cui, Z.; Huang, J.; Lin, Z. Interaction between selenium and soil organic matter and its impact on soil selenium bioavailability: A review. Geoderma 2017, 295, 69–79. [Google Scholar] [CrossRef]
  37. Weng, H.-X.; Hong, C.-L.; Yan, A.-L.; Pan, L.-H.; Qin, Y.-C.; Bao, L.-T.; Xie, L.-L. Mechanism of Iodine Uptake by Cabbage: Effects of Iodine Species and Where It is Stored. Biol. Trace Elem. Res. 2008, 125, 59–71. [Google Scholar] [CrossRef] [PubMed]
  38. Weng, H.-X.; Weng, J.-K.; Yan, A.-L.; Hong, C.-L.; Yong, W.-B.; Qin, Y.-C. Increment of Iodine Content in Vegetable Plants by Applying Iodized Fertilizer and the Residual Characteristics of Iodine in Soil. Biol. Trace Elem. Res. 2008, 123, 218–228. [Google Scholar] [CrossRef]
  39. Hasegawa, P.M.; Bressan, R.A.; Zhu, J.-K.; Bohnert, H.J. Plantcellular and molecularresponses tohighsalinity. Annu. Rev. Plant. Biol. 2000, 51, 463–499. [Google Scholar] [CrossRef] [Green Version]
  40. Choudhury, F.; Rivero, R.; Blumwald, E.; Mittler, R. Reactive oxygen species, abiotic stress and stress combination–Choudhury. Plant J. 2017. [Google Scholar] [CrossRef]
  41. Leyva, R.; Sánchez-Rodríguez, E.; Ríos, J.J.; Rubio-Wilhelmi, M.M.; Romero, L.; Ruiz, J.M.; Blasco, B. Beneficial effects of exogenous iodine in lettuce plants subjected to salinity stress. Plant. Sci. 2011, 181, 195–202. [Google Scholar] [CrossRef]
  42. Zhou, Y.; Wen, Z.; Zhang, J.; Chen, X.; Cui, J.; Xu, W.; Liu, H.-Y. Exogenous glutathione alleviates salt-induced oxidative stress in tomato seedlings by regulating glutathione metabolism, redox status, and the antioxidant system. Sci. Hortic. 2017, 220, 90–101. [Google Scholar] [CrossRef]
  43. Li, R.; Liu, H.-P.; Hong, C.-L.; Dai, Z.-X.; Liu, J.-W.; Zhou, J.; Hu, C.-Q.; Weng, H.-X. Iodide and iodate effects on the growth and fruit quality of strawberry. J. Sci. Food Agric. 2016, 97, 230–235. [Google Scholar] [CrossRef]
  44. Smoleń, S.; Rożek, S.; Strzetelski, P.; Ledwożyw-Smoleń, I. Preliminary evaluation of the influence of soil fertilization and foliar nutrition with iodine on the efficiency of iodine biofortification and chemical composition of lettuce. J. Elem. 2011, 16, 613–622. [Google Scholar] [CrossRef]
  45. Smoleń, S.; Sady, W.; Rożek, S.; Strzetelski, P.; Ledwożyw-Smoleń, I. Preliminary evaluation of the influence of iodine and nitrogen fertilization on the effectiveness of iodine biofortification and mineral composition of carrot storage roots. J. Elem. 2011, 16, 275–285. [Google Scholar] [CrossRef]
  46. García Osuna, H.T.; Mendoza, A.B.; Morales, C.R.; Rubio, E.M.; Star, J.V.; Ruvalcaba, R.M.; Pakistan, L. Iodine application increased ascorbic acid content and modified the vascular tissue in Opuntia Ficus-Indica. J. Bot. 2014, 46, 127–134. [Google Scholar]
  47. Smoleń, S.; Skoczylas, Ł.; Rakoczy, R.; Ledwożyw-Smolen, I.; Kopec, A.; Piatkowska, E.; Bieżanowska-Kopec, R.; Pysz, M.; Koronowicz, A.; Kapusta-Duch, J.; et al. Mineral composition of field-grown lettuce (Lactuca sativa L.) depending on the diversified fertilization with iodine and selenium compounds. ACTA Sci. Pol. Hortorum Cultus 2015, 14, 97–114. [Google Scholar]
  48. Terzano, R.; Cesco, S.; Mimmo, T. Dynamics, thermodynamics and kinetics of exudates: Crucial issues in understanding rhizosphere processes. Plant. Soil 2015, 386, 399–406. [Google Scholar] [CrossRef]
  49. Venturi, S.; Venturi, M. Evolution of Dietary Antioxidants: Role of Iodine. Tutto Sulla Nutr. 2007, 1–25. [Google Scholar]
  50. Ashworth, D.; Shaw, G. Effects of moisture content and redox potential on in situ Kd values for radioiodine in soil. Sci. Total Environ. 2006, 359, 244–254. [Google Scholar] [CrossRef] [PubMed]
  51. Medrano-Macías, J.; Leija-Martínez, P.; González-Morales, S.; Juárez-Maldonado, A.; Benavides-Mendoza, A. Use of Iodine to Biofortify and Promote Growth and Stress Tolerance in Crops. Front. Plant. Sci. 2016, 7, 1146. [Google Scholar] [CrossRef] [Green Version]
  52. Shiroyama, K.; Kawasaki, Y.; Unno, Y.; Amachi, S. A putative multicopper oxidase, IoxA, is involved in iodide oxidation by Roseovarius sp. strain A-2. Biosci. Biotechnol. Biochem. 2015, 79, 1898–1905. [Google Scholar] [CrossRef] [Green Version]
Figure 1. Graphical Scheme of Q products treatment application frequency.
Agronomy 11 00602 g001
Figure 2. Total dry biomass of the strawberry plants treated with iodine-based products, represented in grams, in the three samplings under normal and salt stress conditions. Values with same letters do not show statistically significant differences, p ≥ 0.05.
Agronomy 11 00602 g002
Figure 3. Biplot of parameters of antioxidants, elements, quality, growth and yield in strawberry fruit, under both conditions.
Agronomy 11 00602 g003
Table 1. Q products® application frequency, in agreement with the commercial brand.
Round 1. First application (Tuesday)Q 2000 Plus® 7.5 mL L−1, Q Algy® 7.5 mL L−1, Q Riego® 0.5 mL L−1
Second application (Thursday)Q 2000 Plus® 7.5 mL L−1
Round 2. First application (next Tuesday)Q 2000 Plus® 7.5 mL L−1, Q Energy® 7.5 mL L−1, Q Riego® 0.5 mL L−1
Second application (next Thursday)Q 2000 Plus® 7.5 mL L−1.
The reported composition of the Q 2000 plus product is 1.5% free iodine, 10% catalysts, 27% surfactant, 61.5% vehicle. Q Algy extract of kelp and spirulina 22.1%, Q energy: humic and fulvic acids 3%, amino acids 7%, macros 4-2-2%, micros 12% and vehicle 78%.
Table 2. Representation of treatments applied under normal and stress conditions.
ControlQ Products KIO3
Normal conditions EC 1.5 dS m−1
NaCl 10 mMQ products + NaClKIO3 + NaCl
Salinity stress conditions EC 2.5 dS m−1
Table 3. Growth parameters in strawberry plant in third sampling.
TreatmentNumber of LeavesNumbers of CrownsLeaf Area (LA)Fresh Weight of Leaves (FWL)(g)Fresh Weight of Stem (FWS)(g)Fresh Weight of Root (FWR) (g)Fresh Weight Total FWT (g)
Q43.6 a7.4 b13.47 a46 a38 a44.3 b128.68 b
KIO362 a13 a14.91 a54 a44 a58.5 b157.76 b
KIO3 + NaCl55 a8.4 a12.9 a46 a36 a54.4 b137.71 ab
Q + NaCl46.4 a8.2 a13 a40 a35 a34.2 b109.93 b
control63.6 a11.2 ab11.3 a69 a52 a71.33 a192.9 a
NaCl66.4 a11 ab13.6 a58 a63 a58.1 b160.23 b
Values with same letters do not show statistically significant differences, p ≥ 0.05.
Table 4. Effect of iodine- based products on antioxidants content in strawberry fruits, with and without salt stress.
StressAsa g kg−1Prot g kg−1Phe g kg−1Superoxide Dismutase (SOD) (UI g−1)Ascorbate Peroxidase (APX) (UI)Catalase CAT [UI]Glutathione Peroxidase (GPX) (UI)Glutathione (GSH) (mM)Anthocy (mg 100 g−1)Antioxid Capacity (mM Teac)
QWithout NaCl 2.26 a3.38 b2.28 a6.23 a0.11 b33.9 b75.7 b0.38 ab48.8 a3 a
1.79 a2.18 b1.68 b7.8 a0.84 a66.4 a55.5 b0.54 b57.8 a2.1 a
KIO3Without NaCl1.91 a4.82 a0.94 b3.93 a0.31 b14.98 b46.1 b0.39 ab30.1 b2.91 a
2.21 a3.07 b1.11 b6.3 a0.07 b12.8 b73.7 b0.45 ab58.3 a2.97 a
controlWithout NaCl1.75 a4.11 a1.06 b4 a0.24 b19.66 b50.1 b1.46 a48.7 a2.94 a
1.99 a4.8 a1.59 a4.1 a0.05 c24.5 b107 a0.0.34 c61.7 a3.04 a
Values with same letters do not show statistically significant differences p ≥ 0.05 and in bold, are indicated the maximum and minimum statistically significant differences.
Table 5. Effect of iodine- based products on antioxidants content in leaves, with and without salt stress.
StressAsa g kg−1Prot g kg−1Phe g kg−1Superoxide Dismutase (SOD) (UI g−1)Ascorbate Peroxidasse (APX) (UI)Catalase (CAT) (UI)Glutathione Peroxidase (GPX ) (UI)Glutathione (GSH) (mM)Chlo t
(μg·g−1)
Chlo a
(μg·g−1)
Chlo b
(μg·g−1)
QWithout NaCl 1.41 b3.1 a7.7 ab7.6 a0.28 ab40.7 a94.7 a1.11 ab127.44 a77 a45.2 a
1.48 b4.1 a9.05 a6 a0.88 a41.6 a63.44 a0.73 b115.73 b76.1 b37.8 b
KIO3WithoutNaCl0.47 b4.6 a5.8 c4 a0.69 ab15.5 a50.12 a1.06 ab114.9 b75.9 b35.9 b
1.6 a5.1 a6.2 c3.5 a0.18 a15.9 a39.81.09 ab113.3 b75.5 b33.08 b
controlWithoutNaCl1.16 b4.3 a9.2 a4.3 a0.78 a10.5 a70.7 a1.36 a100.89 b74.7 b26.36 b
1.2 b4.2 a7.2 ab6 a0.66 ab20.35 a57.7 a1.35 a149.3 a79.1 a62.88 a
Values with same letters do not show statistically differences, p ≥ 0.05, and in bold, are indicated the maximum and minimum statistically significant differences.
Table 6. Effect of iodine- based products on minerals content in fruits with and without salt stress.
Macroelements (%)Microelements (ppm)
StressPKNaMgCaZnCuFeMnI
QWithout NaCl 0.20 b1.56 a0.02 c0.15 a0.13 a6.0 b8.4 a25 a14 a4.08 a
0.3 b1.73 a0.06 a0.15 a0.12 a8.3 ab5.6 a0 a13 ab5.45 a
KIO3Without NaCl0.24 b1.17 b0.02 c0.13 a0.09 bc9.4 ab2.9 a19 a13.5 a3.5 a
0.7 a1.49 a0.07 a0.14 ab0.08 c7.2 ab2.5 a64 a12.5 ab4.39 a
controlWithout NaCl0.13 b1.43 a0.02 c0.16 a0.09 bc8.7 ab1.8 a53 a12 bc3.32 a
0.11 b1.22 b0.04 b0.12 b0.05 c24 a8.4 a0 a11 b4.9 a
Values with same letters do not show statistically significant differences, p ≥ 0.05, and in bold, are indicated the maximum and minimum statistically significant differences.
Table 7. Effect of iodine-based products on minerals content in leaves, with and without salt stress.
Macroelements (%)Microelements (ppm)
StressPKNaMgCaZnCuFeMnI
QWithout NaCl 0.26 bc1.34 a0.02 b0.35 a0.9 bc20 a11 a200 a45 bc17.58 a
0.59 a1.43 a0.05 a0.44 a1 ab20 a12.5 a100 a100 a17.95 a
KIO3Without NaCl0.46 ab1.32 a0.01 b0.33 a0.78 c8.4 a12 a29 a36 c14.10 b
0.40 bc1.31 a0.04 a0.37 a0.86 bc15 a13 a100 a47 ab17.65 a
controlWithout NaCl0.25 bc1.45 a0.03 b0.42 a1.13 a11 a14 a100 a42 bc6.28 b
0.1 c1.37 a0.04 a0.36 a0.83 c11 a10 a22 a40 bc14.6 b
Values with same letter do not present statistical differences, p > 0.05, and in bold, are indicated the maximum and minimum statistically significant differences.
Table 8. Effect of iodine-based products on fruit quality and yield.
StressYield (g)BrixFirmness (kg cm−1)% loss Firmness
QWithout NaCl260.6 a5.41 b6.78 ab80.11 a
227.35 a5.78 ab4.52 c58.64 b
KIO3Without NaCl262.3 a5.92 ab5.7 bc81.46 a
140.37 b5.1 ab8.0 a85.89 a
controlWithout NaCl233.26 a5.3 b5.74 bc88.11 a
194.9 b6.5 a6.4 bc73.31 a
Values with same letter do not present statistical differences, p > 0.05, and in bold, are indicated the maximum and minimum statistically significant differences.
Table 9. Comparation between traits using multiple linear regression and Pearson coefficients.
ProtSODCATAPXAnthocyGSHPAPKCaMgNaFeMnIFWTDWTYield
asa0.40.80.600.10.90.50.60.50.50.10.40.30.30.50.20.20.30.2
prot10.10.10.10.60.90.50.30.10.40.10.90.70.10.30.60.60.7
phe10.30.10.90.30.30.50.30.10.30.10.10.10.90.90.80.90.7
SOD−0.810.10.10.80.40.90.60.40.40.10.60.70.20.90.80.90.6
APX−0.40.50.110.90.90.20.20.50.50.20.10.60.90.10.10.10.7
CAT−0.50.710.50.90.80.20.20.70.90.10.10.30.60.60.10.10.7
GPX−0.20.20.1−0.30.30.20.80.70.90.80.90.80.80.80.90.50.20.3
GSH−0.1−0.2−0.10.10.910.70.70.60.60.90.10.90.90.910.70.1
Antoc−0.10.10.1−0.110.10.50.30.50.40.40.80.20.50.90.20.60.40
PA0.10.1−0.2−0.1−0.1−0.110.50.80.80.50.30.30.80.90.80.80.1
In bold are indicated the values highly correlated.
Publisher’s Note: MDPI stays neutral with regard to jurisdictional claims in published maps and institutional affiliations.

