Article

Impact of Pests on Cereal Grain and Nutrient Yield in Boreal Growing Conditions

1
Natural Resources Institute Finland, Tietotie 4, 31600 Jokioinen, Finland
2
Department of Agricultural Sciences, University of Helsinki, Koetilantie 5, 00790 Helsinki, Finland
*
Author to whom correspondence should be addressed.
Agronomy 2021, 11(3), 592; https://doi.org/10.3390/agronomy11030592
Submission received: 17 February 2021 / Revised: 12 March 2021 / Accepted: 18 March 2021 / Published: 20 March 2021

Abstract

:
The effect of weeds, plant diseases and insect pests on spring barley (Hordeum vulgare) and spring wheat (Triticum aestivum) grain and nutrient yield was examined. Long-term field trial data was used to assess the impact of different pests on grain yield. In the absence of pesticides, fungal diseases caused the largest annual yield-reduction in spring wheat and spring barley, 500 kg ha−1 on average. Converting yield loss to nutrient yield loss this represented reductions of 8.1 and 9.2 kg ha−1 in nitrogen and 1.5 and 1.6 kg ha−1 in phosphorus, respectively. Likewise, it was estimated that weeds decrease the yield of spring barley and spring wheat for 200 kg ha−1, which means reductions of 3.7 and 3.2 kg ha−1 in nitrogen and 0.6 kg ha−1 in phosphorus, respectively. For insect pests yield-reduction in spring barley and spring wheat varied between 418 and 745 kg ha−1 respectively. However, because bird cherry-oat aphid (Rhopalosiphum padi L.) incidence data was limited, and aphids are highly variable annually, nutrient yield losses caused by insect pests were not included. Based on the current study, the management of weeds, plant diseases and insects maintain cereal crop yield and may thus decrease the environmental risks caused by unutilized nutrients.

1. Introduction

In the Boreal region the growing conditions are unique. In Finland over half of the cereal grain cultivation area is located between 60° N and 65° N [1]. However, climate change is forecasted to extend the length of the potential growing season at middle and higher latitudes [2] and different solutions are needed to reduce the potential adverse effects of warming autumns, such as nutrient leaching [3]. Longer growing seasons may also affect the incidence of pests (weeds, insects and plant diseases): plant disease risk may increase due to accelerated and more aggressive plant pathogen evolution and a larger number of infection cycles [4,5] while longer and warmer growing seasons constitute ideal conditions for pests to thrive [6,7,8].
Pests have a negative effect on crop yield, and at the worst, some pests may destroy entire crops leading to a total loss of crop yield. In addition to decreasing crop yield, pests may also have a negative effect on the quality of crop yield. According to Oerke [9], weeds can cause high yield losses (up to 34%) in spring wheat (Triticum aestivum), rice (Oryza sativa), maize (Zea mays), potatoes (Solanum tuberosum), soybeans (Glycine max) and common flax (Linum usitatissimum), whereas insects and plant diseases cause lower but still substantial average yield losses (18% for insects and 16% for plant diseases) for the same crops. The yield losses of spring wheat and spring barley (Hordeum vulgare) caused by weeds were found to depend more on the relative time of weed emergence than weed density [10,11]. There are also differences with different crop densities: Lutman et al. [12] found that when winter wheat density increased from 100 wheat plants m−2 to 200 or 300 plants m−2, it decreased the head numbers of black grass (Alopecurus myosuroides) by 17 and 32%, respectively. In Finland, Salonen [13] found that the use of herbicides increases the average spring wheat yield by 202 kg ha−1 and spring barley yield by 30 kg ha−1. In Sweden, increased weed biomass was found to explain 31% yield losses of both spring and winter cereals [14].
Yield reduction caused by plant diseases varies considerably between host plant and pathogen cognate pairs. For spring wheat, Murray and Brennan [15] found that diseases caused an 18% annual yield loss; for spring barley, annual yield reduction due to plant pathogens was 19.6% [16]. In a long-term (1976–2000) study, Bockus et al. [17] found that the annual grain yield loss caused by spring wheat diseases was on average 13.7%. In a recent study, Jalli et al. [18] found that leaf blotch diseases, with severity above 50% at the milk ripening stage, caused an average yield loss of 1072 kg ha−1 in winter wheat and 1114 kg ha−1 in spring barley in northern European countries.
There may also be combined effects of insects and pathogens. Riedell et al. [19] examined the effect of bird cherry-oat aphid (Rhopalosiphum padi L.) and barley yellow dwarf virus (BYDV), both separately and in combination, on winter wheat. It was shown that the combined effects of pests decreased winter wheat yield by 58% while yield reduction caused by R. padi alone was 21% and yield reduction caused by BYDV alone was 46%. McKirdy et al. [20] also observed a clear connection between BYDV and grain yield loss: the grain yield reduction caused by BYDV was 0–2700 kg ha−1 for wheat and oats (Avena sativa L.). For barley, BYDV-resistance in cultivars differs. For example, in Jefferies et al. [21] study it was shown that a relatively tolerant cultivar had a 13% reduction in grain yield due to BYDV whereas a more sensitive cultivar had a yield reduction of 71%. In addition, R. padi has been shown to decrease the grain yield of oats by 19–22% [22] and the yield of spring barley by 0–1810 kg ha−1 [23].
Crop protection actions strongly define the formation and realization of crop yield. Farmers in the EU are committed to implementing the Integrated Pest Management (IPM)-directive which aims to minimize the risk of pesticides to human health and the environment. In IPM, the focus is on prevention of pests or their damage through a combination of different techniques like crop rotation and plant disease resistance. A decision on the use of chemicals for crop protection should be based on verified need [24]. In Finland, herbicide application was used on over 90% of the cultivated area while fungicide application was used on 20−30% and insecticide application on less than 10% of the cultivated area in 2018 [25].
Besides IPM, farmers in the EU are also committed to Farm to Fork strategy, which aims to reduce nutrient losses by at least 50% from 2020 level and to reduce the use of fertilizers by 20% by the end of 2030 [26]. Globally, the nitrogen fertilizer use has increased around 1.5% (1.7 M tonnes) and phosphorus around 2.4% (1M tonnes) annually during the years 2014–2018 [27]. However, in Finland, the mean field balance (nutrient applied as in fertilizer/manure—nutrient harvested in (grain) yield (kg/ha)) of nitrogen (N) has decreased from 90 to 50 kg ha−1 and balance of phosphorus (P) from 30 to 4 kg ha−1 in 1985–2015 [28]. However, still significant nutrient losses to watercourses occur [29,30,31] and the efficacy of N and P uptake of plants has been lower than 50 and 10% of applied fertilizers [32]. For protecting soil, water and air for unused nutrients, different actions like avoiding overfertilization and favoring the use of crops with the high nutrient use efficiency are needed [33,34]. However, not just the ability of crops to use nutrients but also several types of stresses like flooding, salinity and water stress may affect plant growth and disturb crop nutrient uptake [35].
Previous studies in plant health have focused mainly on the effects of pests on crop yield but seldom the interaction of crop protection and nutrient yield of cereals has been reported. The aim of the current study was to estimate the impact of plant protection on spring cereal grain yield and crop nutrient uptake by determining the N and P-yield harvested in grain yield in a Boreal climate. The current study is based on long-term data in different pest pressures and climatic conditions covering several growth zones in Finland.

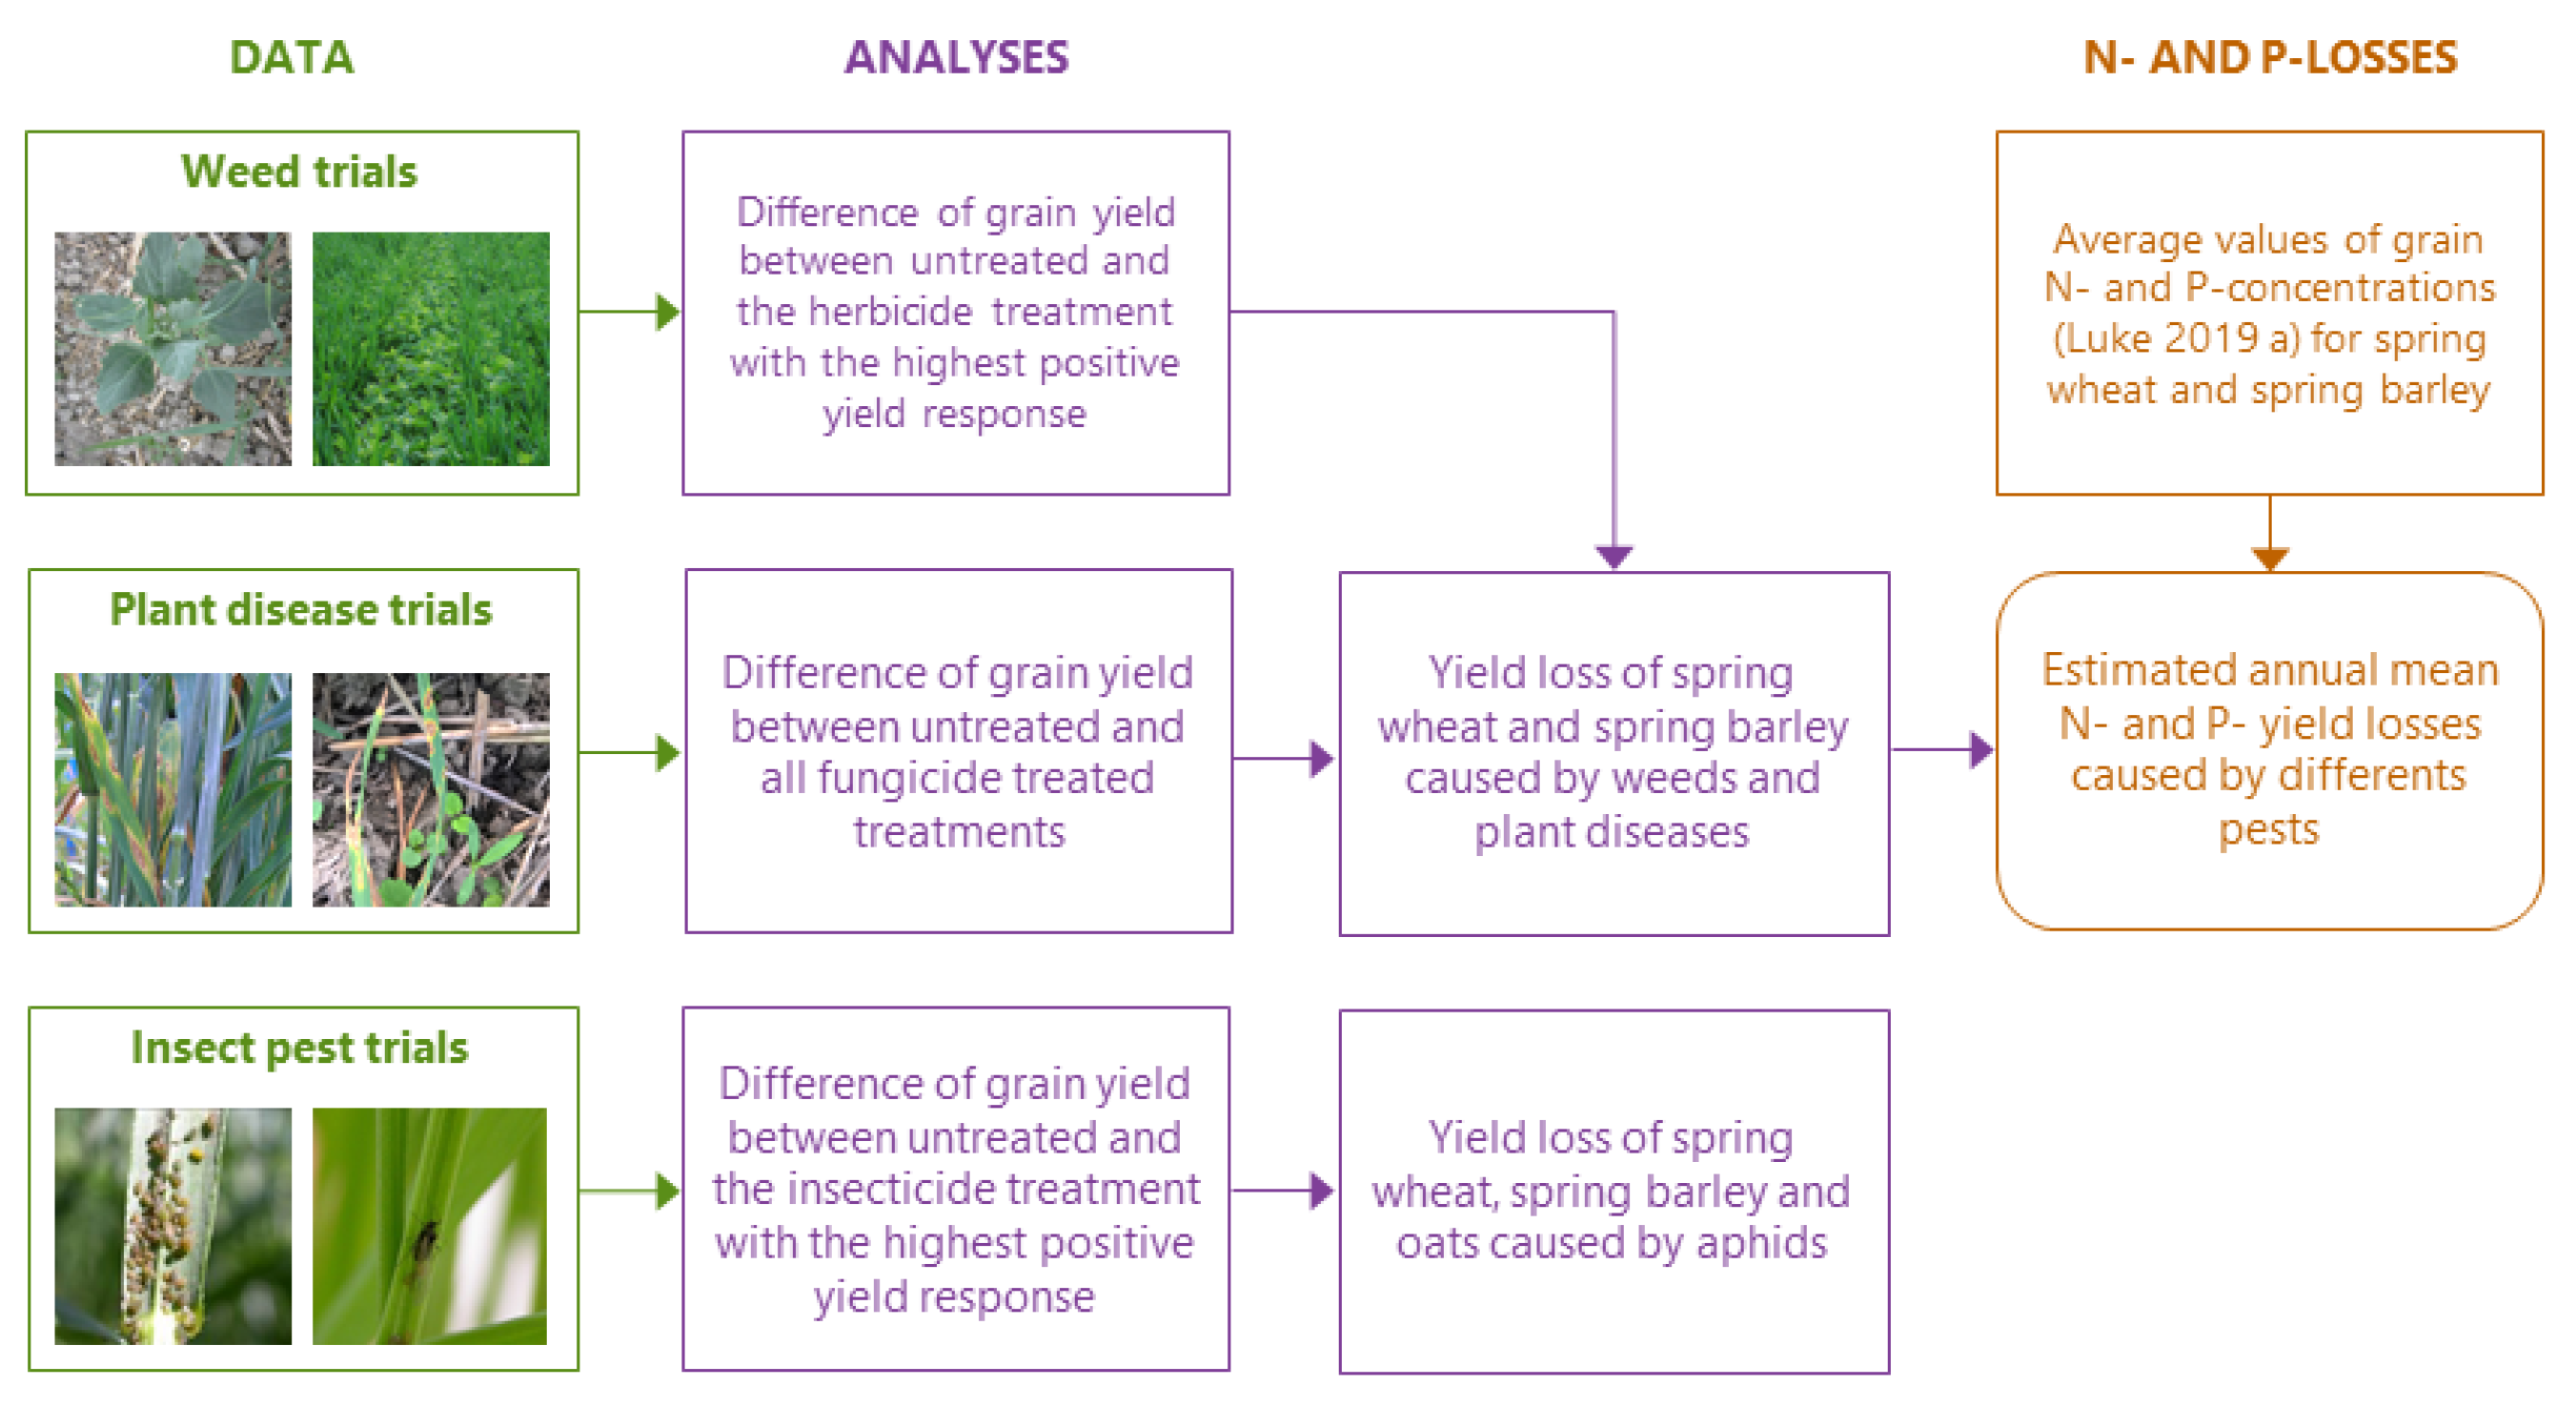
2. Material and Methods

In the current study, the effects of weeds, plant diseases and insect pests on the grain yield of spring barley and spring wheat were examined in long-term field trials between 1965 and 2016. The collected grain yield data were used when examining the estimation of nutrient yield of spring barley and spring wheat in the current study (Figure 1).

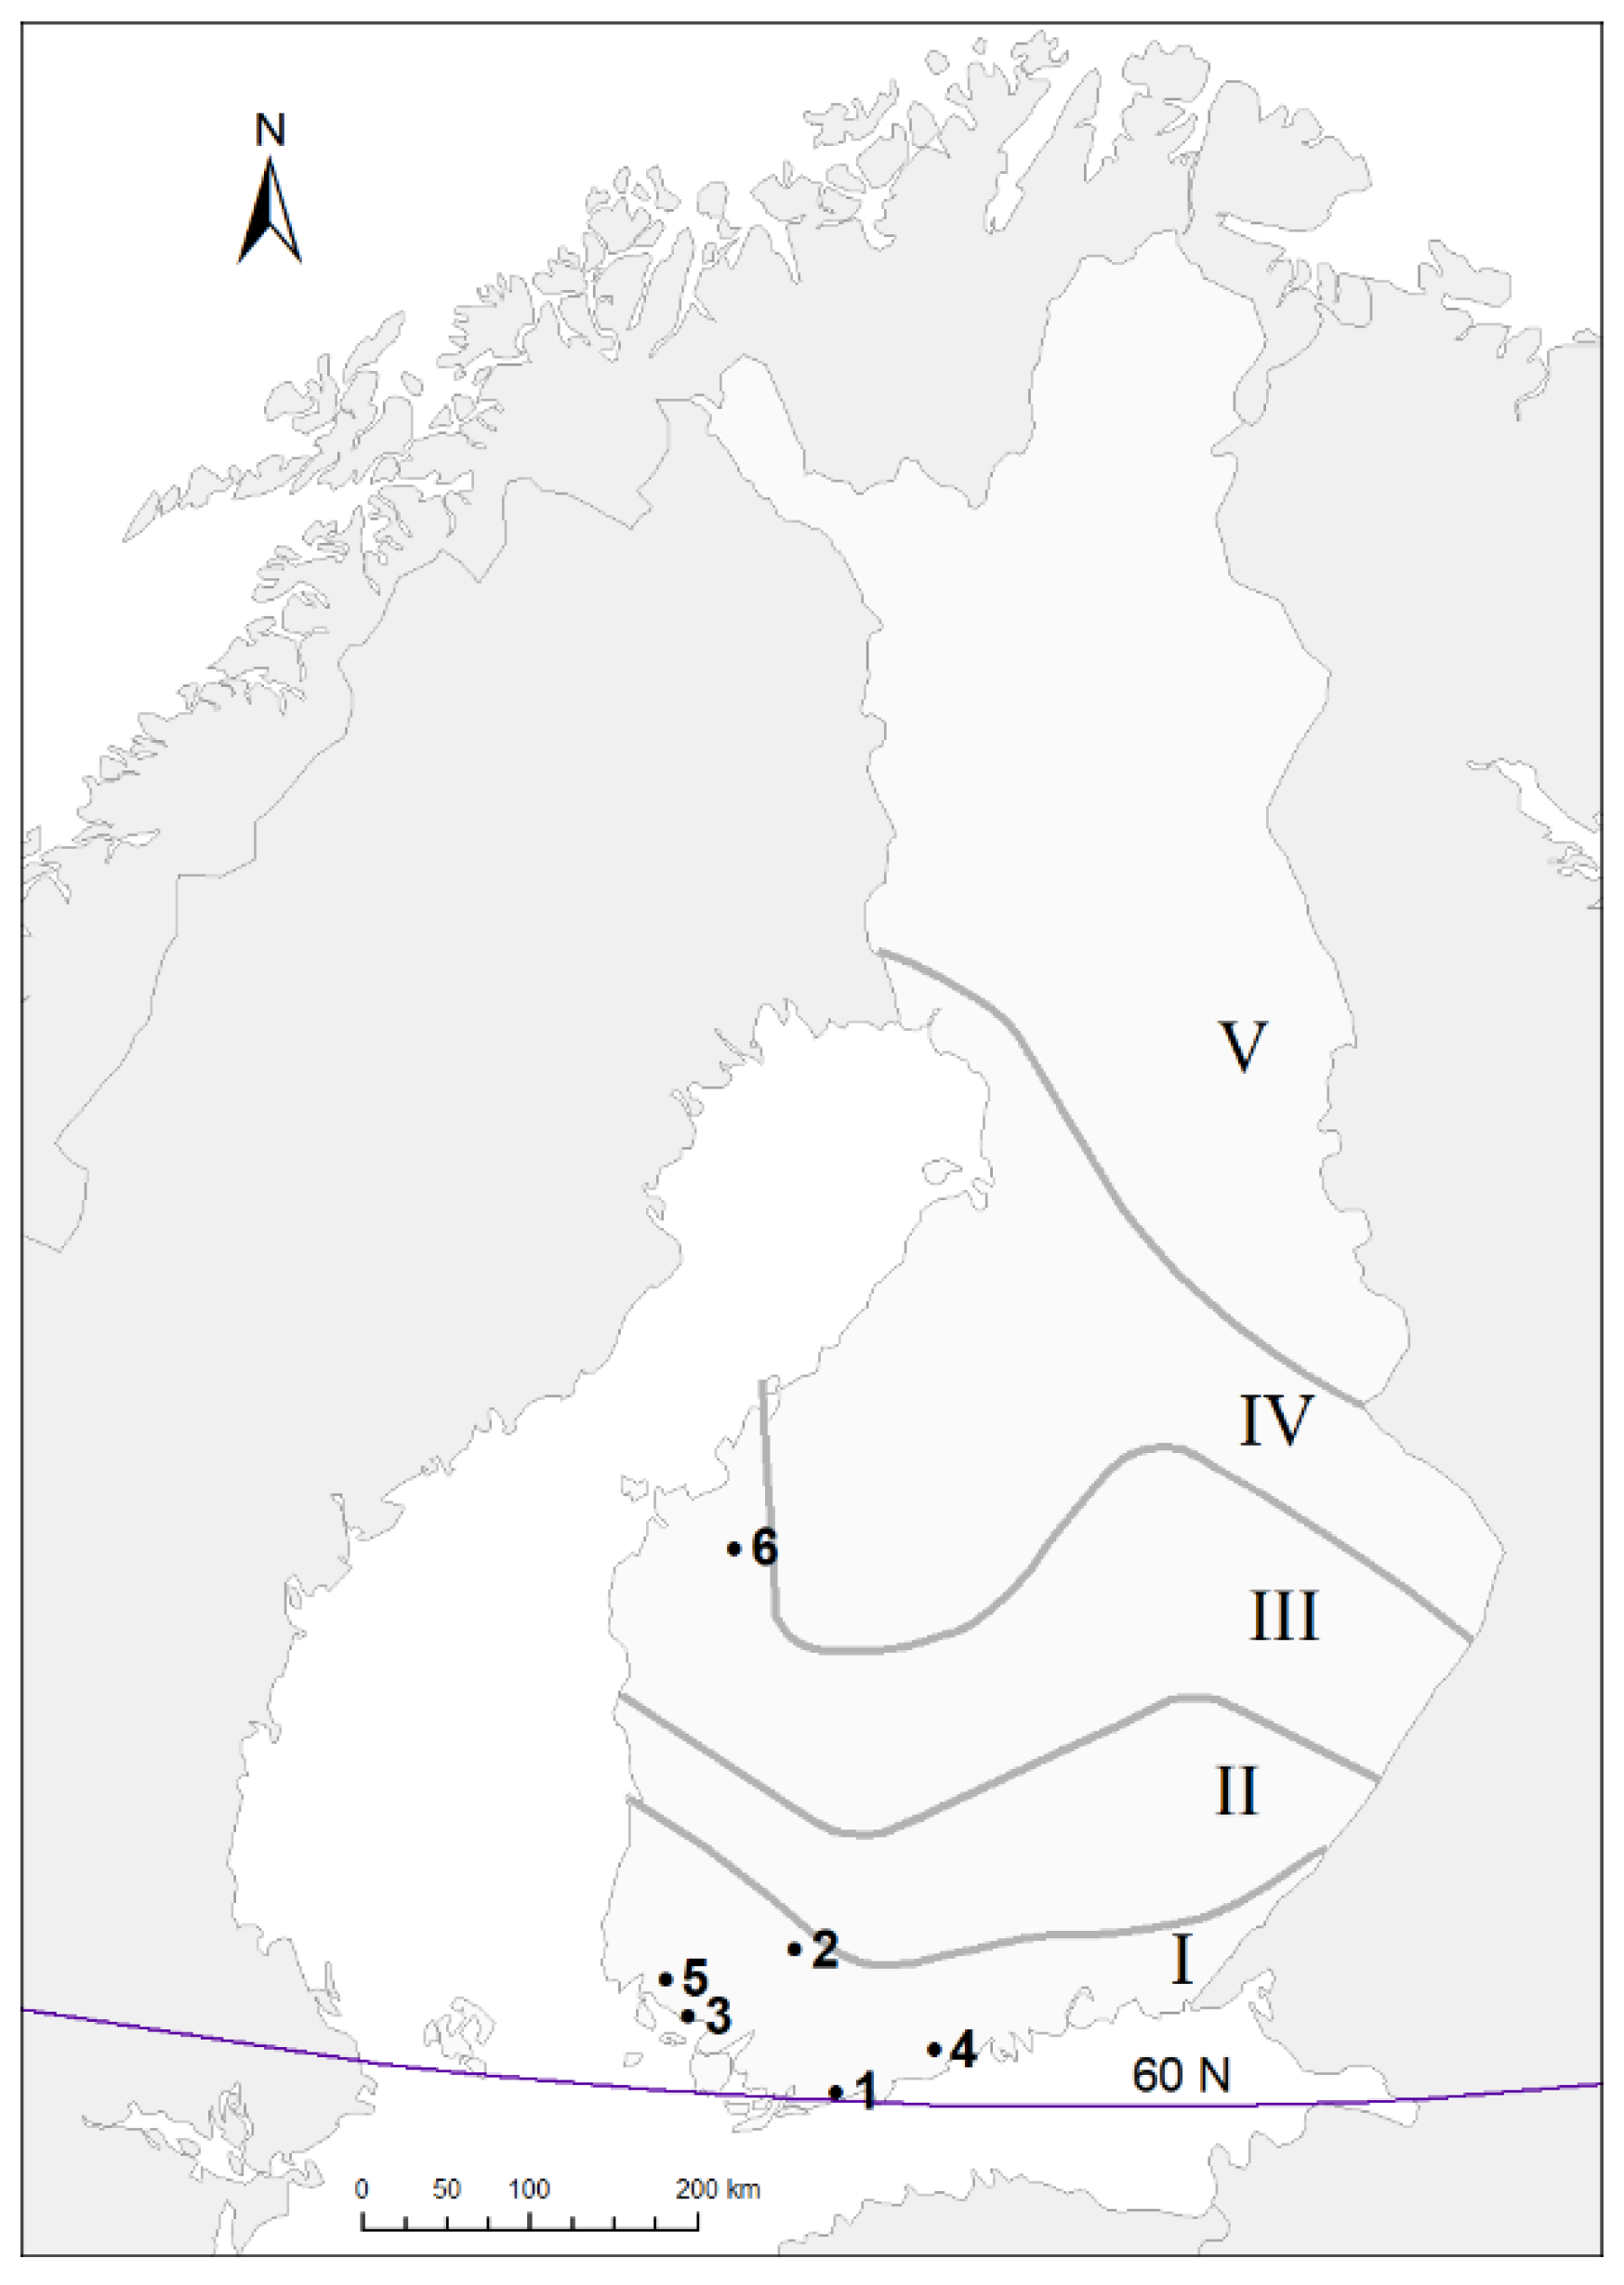
2.1. Data Collection

Finland has been divided into five different growth zones based on the different effective temperature sum in different parts of Finland which define the crops that can be cultivated in certain growth zones [1]. In the current study, trials were sited at six different locations in Finland: Inkoo, Jokioinen, Kaarina, Nousiainen, Tikkurila and Ylistaro in which only Ylistaro was located in growth zone III while other sites were located in growth zone I (Figure 2). During the experimental period, fields were autumn ploughed annually. Typical spring wheat and spring barley varieties for each decade were used. In addition, the fertilizer levels followed the general recommendations in Finland in each decade: in 1960s the common nitrogen dose (N) was 20 kg ha−1 [36], in 1970s 70 kg ha−1 [36] and in 1980s onwards 90 kg ha−1 [37]. Similarly, the common dose of phosphorus (P) was in the 1960s 20 kg ha−1 [36], in the 1970s 30 kg ha−1 [36], in the 1980s 20 kg ha−1 [37], in the 1990s 15 kg ha−1 [37,38] and from 2000 onwards 10 kg ha−1 [37].

2.1.1. Weed Trials

Luke’s (Natural Resources Institute Finland, previously known as MTT Agrifood Research Finland and MTTK Agrifood Research Finland) herbicide efficacy testing field trial data from the years 1965 to 2012 was used to study the effect of weeds on the cereal yield of crops grown on mineral soils. There were 72 trials in spring wheat and 107 trials in spring barley: the collected data included weed biomass data (density and dry biomass) as well as observations of the effect of herbicide treatment on grain yield [39]. Up until 1979 the trials were located in Tikkurila and thereafter in Jokioinen (Figure 2). The field trials were conducted in order to test the biological efficacy of new herbicide products before their approval for use in Finland. Therefore, the trials included new products of each period of history [39]. In 1960s and 1970s mainly phenoxy herbicides were used, in 1980s and 1990s mainly sulfonyl ureas and from 2000 onwards mainly mixtures of sulfonyl ureas and phenoxy herbicides.
All herbicide trials contained one untreated (control) treatment and 4–14 herbicide treatments. The trials were carried out as randomized complete block design, typically with a plot size of 3 m × 8–10 m and with four replicates. The herbicide applications were generally made from the growth stage (BBCH) 12 to 31 [40] of the crop.
The weed assessments were made from six to eight weeks after the last herbicide application of the trial. The weed samples were taken from two 0.1–0.5 m2 subsample areas in each plot, after which the weeds were counted, sorted by species, placed into pre-weighed paper bags, air-dried and then weighed to determined weed biomass yield [39]. The total weed dry biomass and the grain yield of the untreated treatment and the herbicide treatment with the highest positive yield response per trial were chosen for data analyses (Figure 1). This demonstrated the highest potential yield increase of weed control in each trial.

2.1.2. Plant Disease Trials

Spring barley and spring wheat plant disease severity data originated from untreated plots in national fungicide efficacy trials conducted on mineral soils held between 1999 and 2016. The fungicides represented a range of broad-spectrum fungicides, mainly triazole and strobilurin and their mixtures, with different modes of actions and good efficacy to leaf blotch diseases. Data from 49 trials for spring barley and 55 trials for spring wheat were included in the analyses. The spring barley data was collected from Jokioinen, Ylistaro and Inkoo, and the spring wheat data from Jokioinen, Inkoo and Kaarina (Figure 2).
The trial design was a randomized block field trial with four replicates [41]. In each trial, the grain yield difference between the untreated and average of fungicide treated treatments was chosen for data analyses (Figure 1).
The disease severity was observed at the milk ripening stage, BBCH 73–77. The disease scale was based on the percentage of leaf area covered by disease on the four uppermost leaves [41]. For spring barley, symptoms attributed to net blotch (Pyrenophora teres f. teres), scald (Rhynchosporium commune) and powdery mildew (Blumeria graminis) were recorded. For spring wheat, the symptoms attributed to stagonospora nodorum blotch (Parastagonospora nodorum), tan spot (Pyrenophora tritici-repentis), powdery mildew (Blumeria graminis) and wheat leaf rust (Puccinia recondita) were recorded. The trials with mixed infections were avoided. The disease resistance of the cultivars used in the trials varied, ranging from moderately susceptible to susceptible.
The estimation of yield loss caused by seed borne diseases was based on a seed quality study carried out on spring barley [42] and spring wheat [43]. In both studies, the yield from untreated seeds was 300 kg/ha lower than yield of the fungicide treated seed lot.

2.1.3. Insect Pest Trials

Insect pest data includes results from field trials to test biological efficacy of insecticides against bird cherry-oat aphid, Rhopalosiphum padi (15 field trials held between 1999–2008) on barley, wheat, and oats. The trials were carried out in Jokioinen and Ylistaro (Figure 2). Insecticides used in the field trials were mainly pyrethroids, after insecticide spraying the number of aphids per plant was counted 1–5 times. The grain yield of the untreated treatment and the insecticide treatment with the highest positive yield response per trial were chosen for data analyses (Figure 1).

2.2. Statistical Analysis

Data from weeds, plant diseases and insects were analyzed separately. However, there were different testing methods in analyzing different pests’ data: for weed and insect trials new herbicides and insecticides were tested with varying success on different weed and insect species, while for plant disease trials all of the used fungicides were commonly used and their efficacy against diseases were known. Thus, for getting the realistic picture about the ability of pests to disturb crop growth and decrease crop yield, for weeds and insects the difference in yields between the untreated plot and the corresponding treated plot with the highest yield potential was included, while for plant diseases all treated plots were included (Figure 1).
The data were categorized into different severity classes of weeds, diseases and insect pests. For weeds the amount of air-dry weed biomass of untreated plots was categorized into five equally sized classes (20% of observations for each). The median of weed biomasses in different classes was: 52 kg ha−1 in class 1, 106 kg ha−1 in class 2, 214 kg ha−1 in class 3, 415 kg ha−1 in class 4 and 959 kg ha−1 in class 5. In addition, the average densities of the most abundant weed species were analyzed in order to describe the spectrum of the weed species in the trials. Similarly, for plant diseases the disease severity observations were categorized into the following severity classes: 0–1, 1.01–10, 10.01–25, 25.01–35, 35.01–100% of diseased leaf area for spring barley and 0–2, 2.01–10, 10.01–25, 25.01–100% of diseased leaf area for spring wheat. For the insect pests the aphid incidence of untreated plots was categorized into three aphid-abundance classes: 0–5 aphids in class 1, 5.01–25 aphids in class 2 and 25.01–100 aphids in class 3. However, the number of classes presented above and their boundaries were chosen based on the sample size and the distribution of observations still maintaining the effectiveness of statistical inference. Weed classes were equally classified having the same number of observations, but for plant diseases and insects the boundaries were modified based on more meaningful class levels.
For weeds both spring barley and spring wheat data were analyzed together. A linear mixed model (LMM) consisted of interaction between the classified weed biomass classes (1–5) and crop (spring barley and spring wheat) in addition to their main effects. Random effects based on experimental design were year and year × trial × crop × (weed biomass class). Thus, yield loss between treated and untreated plots was analyzed using the model:
Yield loss = intercept + weed biomass class + crop + weed biomass class × crop + year + year × trial × crop × (weed biomass class) + residual
For plant diseases and insects, yield losses were calculated by comparing fungicide or insecticide, respectively, treated plots with corresponding untreated plots (=untreated yield − treated yield). Classified plant diseases or insects were used as a fixed effect. These models had no other fixed effects, because for plant diseases both crops were analyzed separately, and for insects the effect of crop was not included in the model. For plant diseases, three random effects were used: fungicide, year × site × trial × (plant disease class) and replicate × year × site × trial × (plant disease class). For insects there were no random effects, but unequal variances for aphid classes were allowed. However, one insect trial had an exceptional high yield increase (800 kg ha−1) in the untreated plot and was not included in the analysis.
All models were fitted by using the restricted maximum likelihood (REML) estimation method, and degrees of freedom were calculated using the Kenward-Roger method [44]. The residuals were plotted against the fitted values, which indicated that the assumptions of the models were adequate. Comparison of the means was performed using the Tukey–Kramer post hoc test at significance level 0.05 (Supplementary Tables S1–S3) [45] while the analyses were performed using the GLIMMIX procedure in SAS version 9.4 (SAS Institute Inc., Cary, NC, USA).

2.3. Nitrogen and Phosphorus Yield Loss Estimation

The effect of grain yield loss caused by weeds and plant diseases on N and P yield loss was assessed by using N-and P-concentrations of spring barley and spring wheat (Figure 1). However, because aphid incidence data was limited and aphids are highly variable annually [46], N-and P-yield losses caused by insect pest were not included in the current study.
Average values of 19.0 and 21.6 g kg−1 for grain N and 3.6 and 3.7 g kg−1 for grain P concentrations, were used in N- (kg N ha−1) and P-loss (kg P ha−1) calculations for barley and wheat, respectively [47]. These N and P concentrations represent average values for cultivars cultivated in 2010s, thus providing relatively recent and reliable estimations for N- and P-yield calculations. In nutrient calculations, yield loss (kg ha−1) for both spring barley and spring wheat was converted from 15% moisture to dry matter.
N-and P-yield loss was calculated as follows:
Nitrogen   yield   loss   =   grain   loss   ( kg   dry   matter   ha 1 )   ×   grain   N   concentration   ( g   dm   kg 1 ) 1000
Phosphorus   yield   loss   =   grain   loss   ( kg   dry   matter   ha 1 )   ×   grain   P   concentration   ( g   dm   kg 1 )   1000
Potential total national N- and P-yield loss was estimated by multiplying hectare-based N- and P-yield loss by the average cultivation area in Finland in 2019 for spring barley (500,000 ha) and spring wheat (200,000 ha) [48].

3. Results

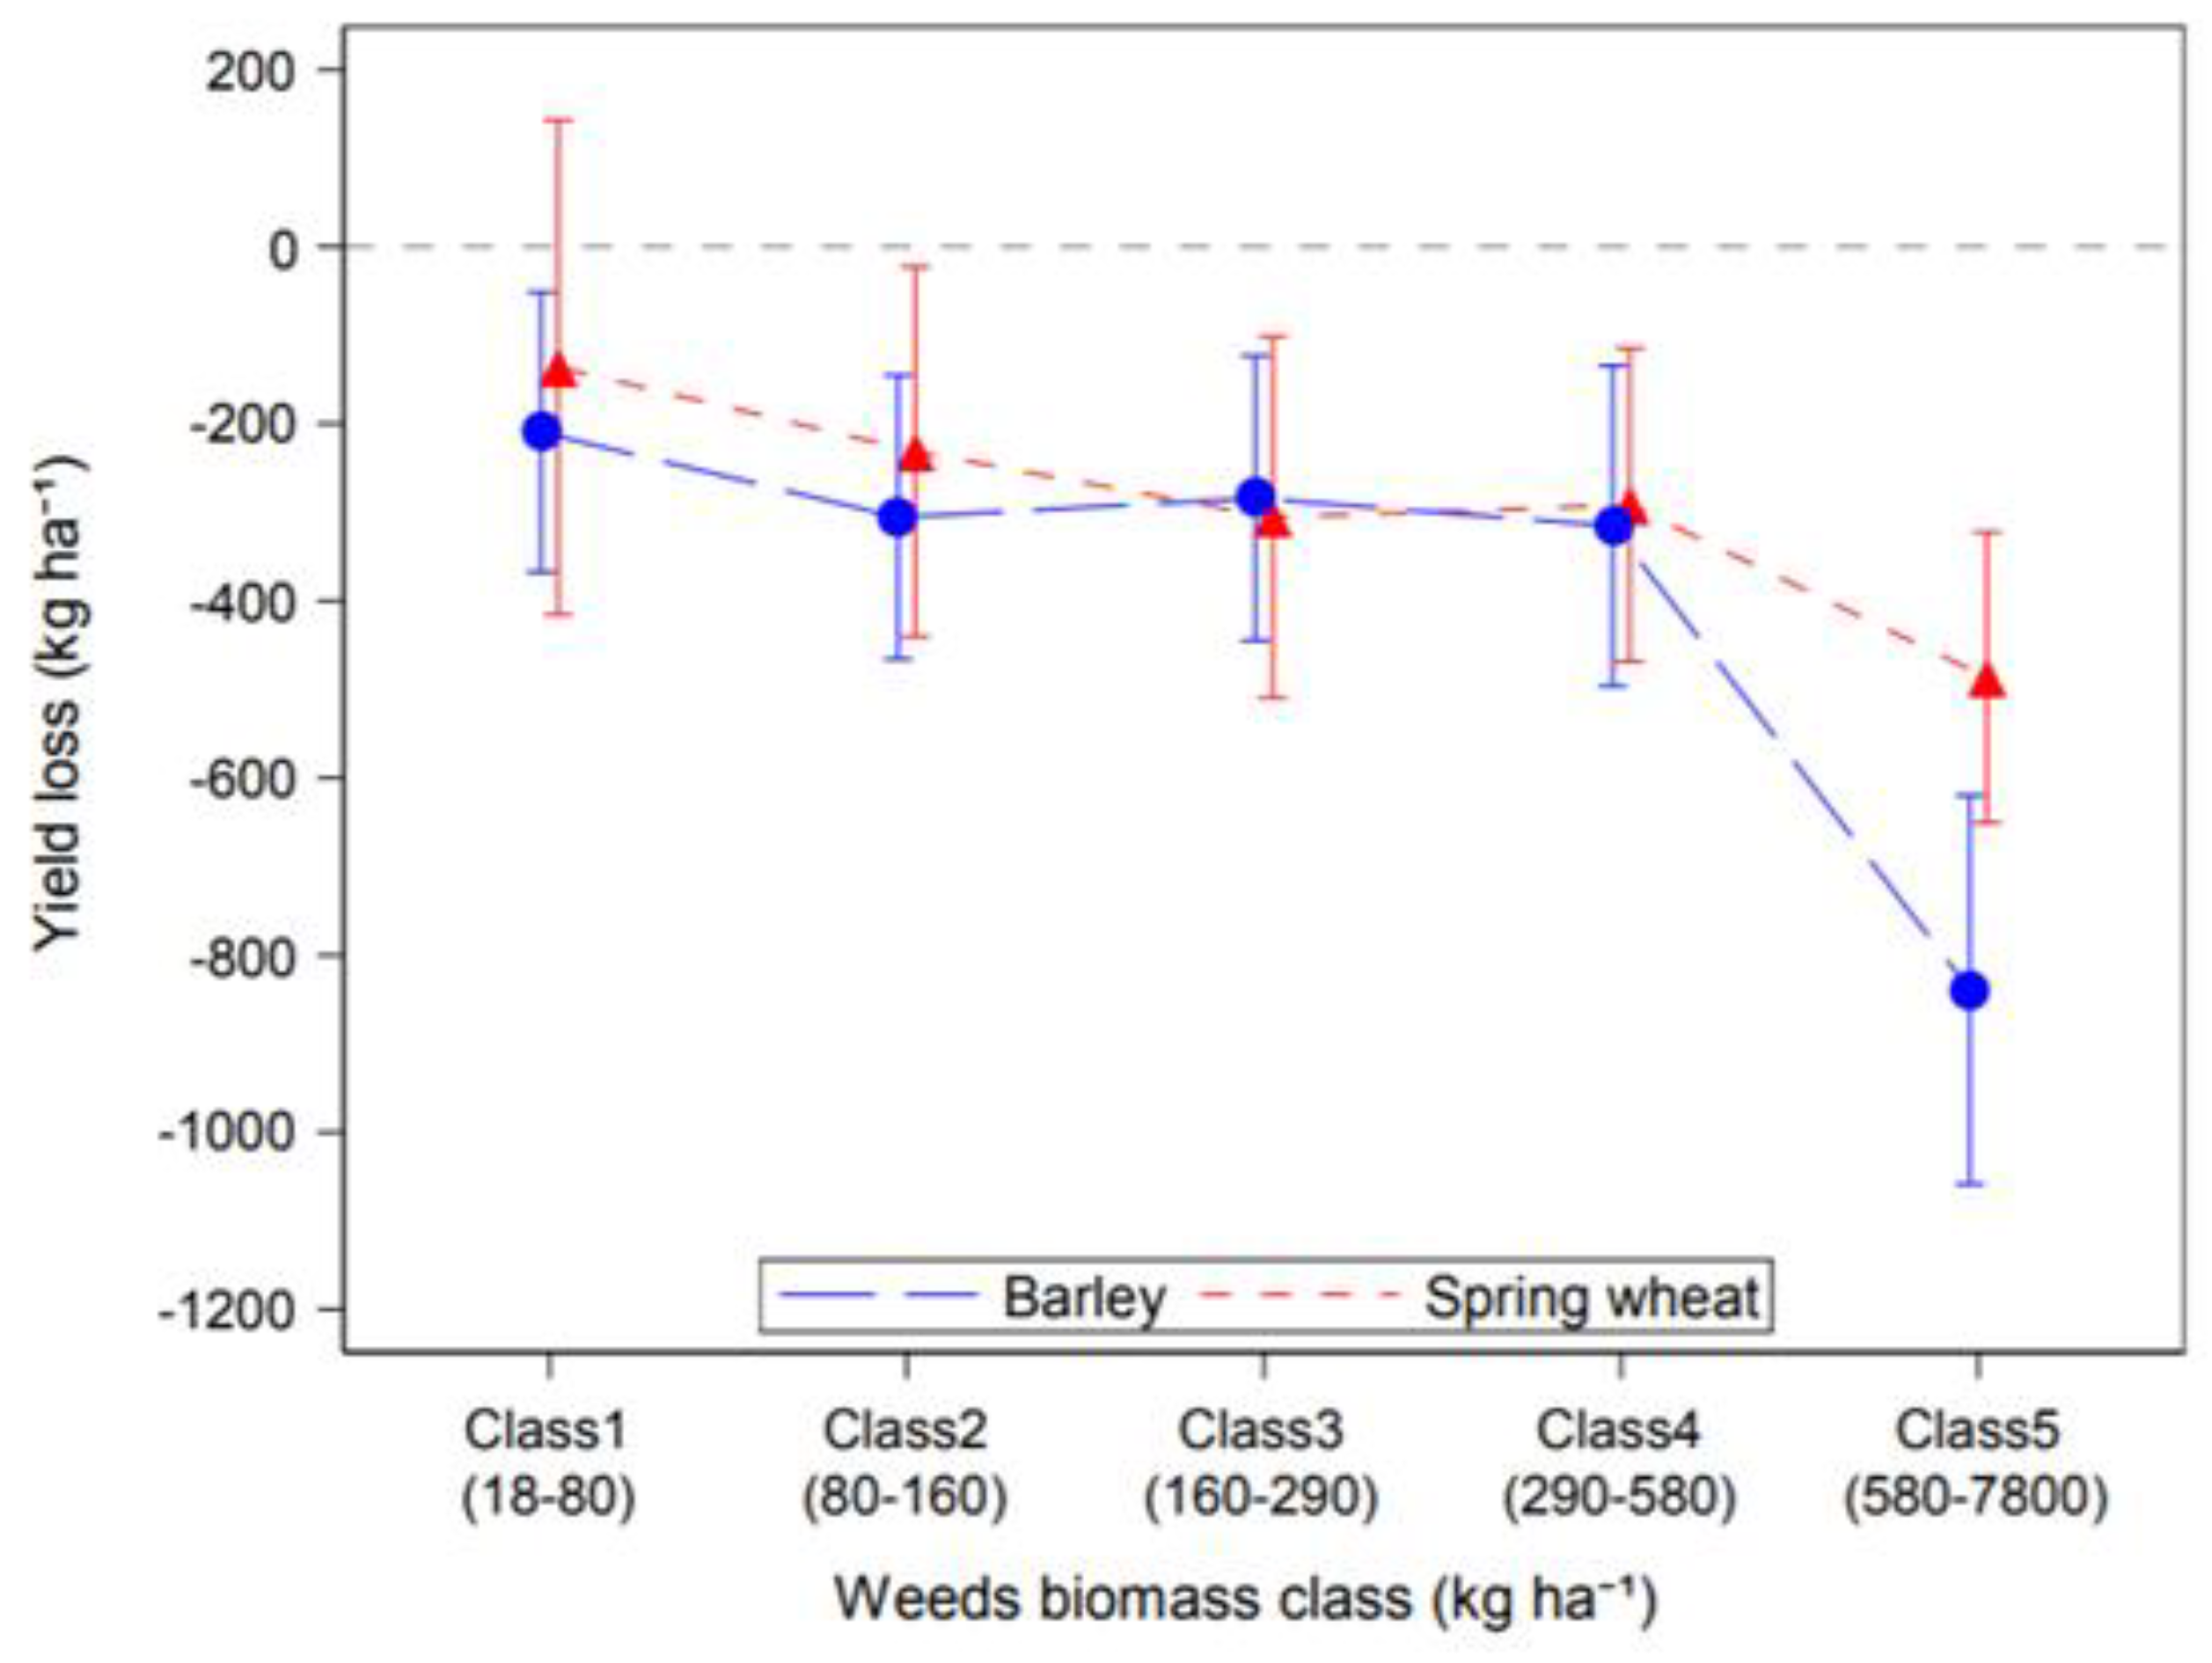
3.1. Effect of Weeds on Cereal Yield

In 179 spring barley and spring wheat herbicide trials, the most abundant weed species in untreated plots were chickweed (Stellaria media (L.)), white goosefoot (Chenopodium album (L.)), field pansy (Viola arvensis (L.)) and hemp-nettle (Galeopsis (L.)) (Table 1). All of these weed species are commonly found in spring cereal fields in Finland [49].
The trial data were classified into five weed biomass classes according to the total weed biomasses of the untreated treatments (Figure 3). For spring barley, in the fifth class, with the highest weed biomass (580–7800 kg ha−1), the yield loss differed statistically significantly from the other classes (p < 0.001), whereas for spring wheat there were no statistically significant yield loss differences (p > 0.320) between the weed biomass classes. The yield loss was also significantly higher for spring barley than for spring wheat (p = 0.037) in the fifth class. Based on current results, when comparing average yield of each weed biomass class, weeds decreased the yield of spring barley 5–7% in weed classes 1–4 and 19% in class 5. For spring wheat, yield loss was 4–8% in weed classes 1–4 and 13% in class 5 (Figure 3).

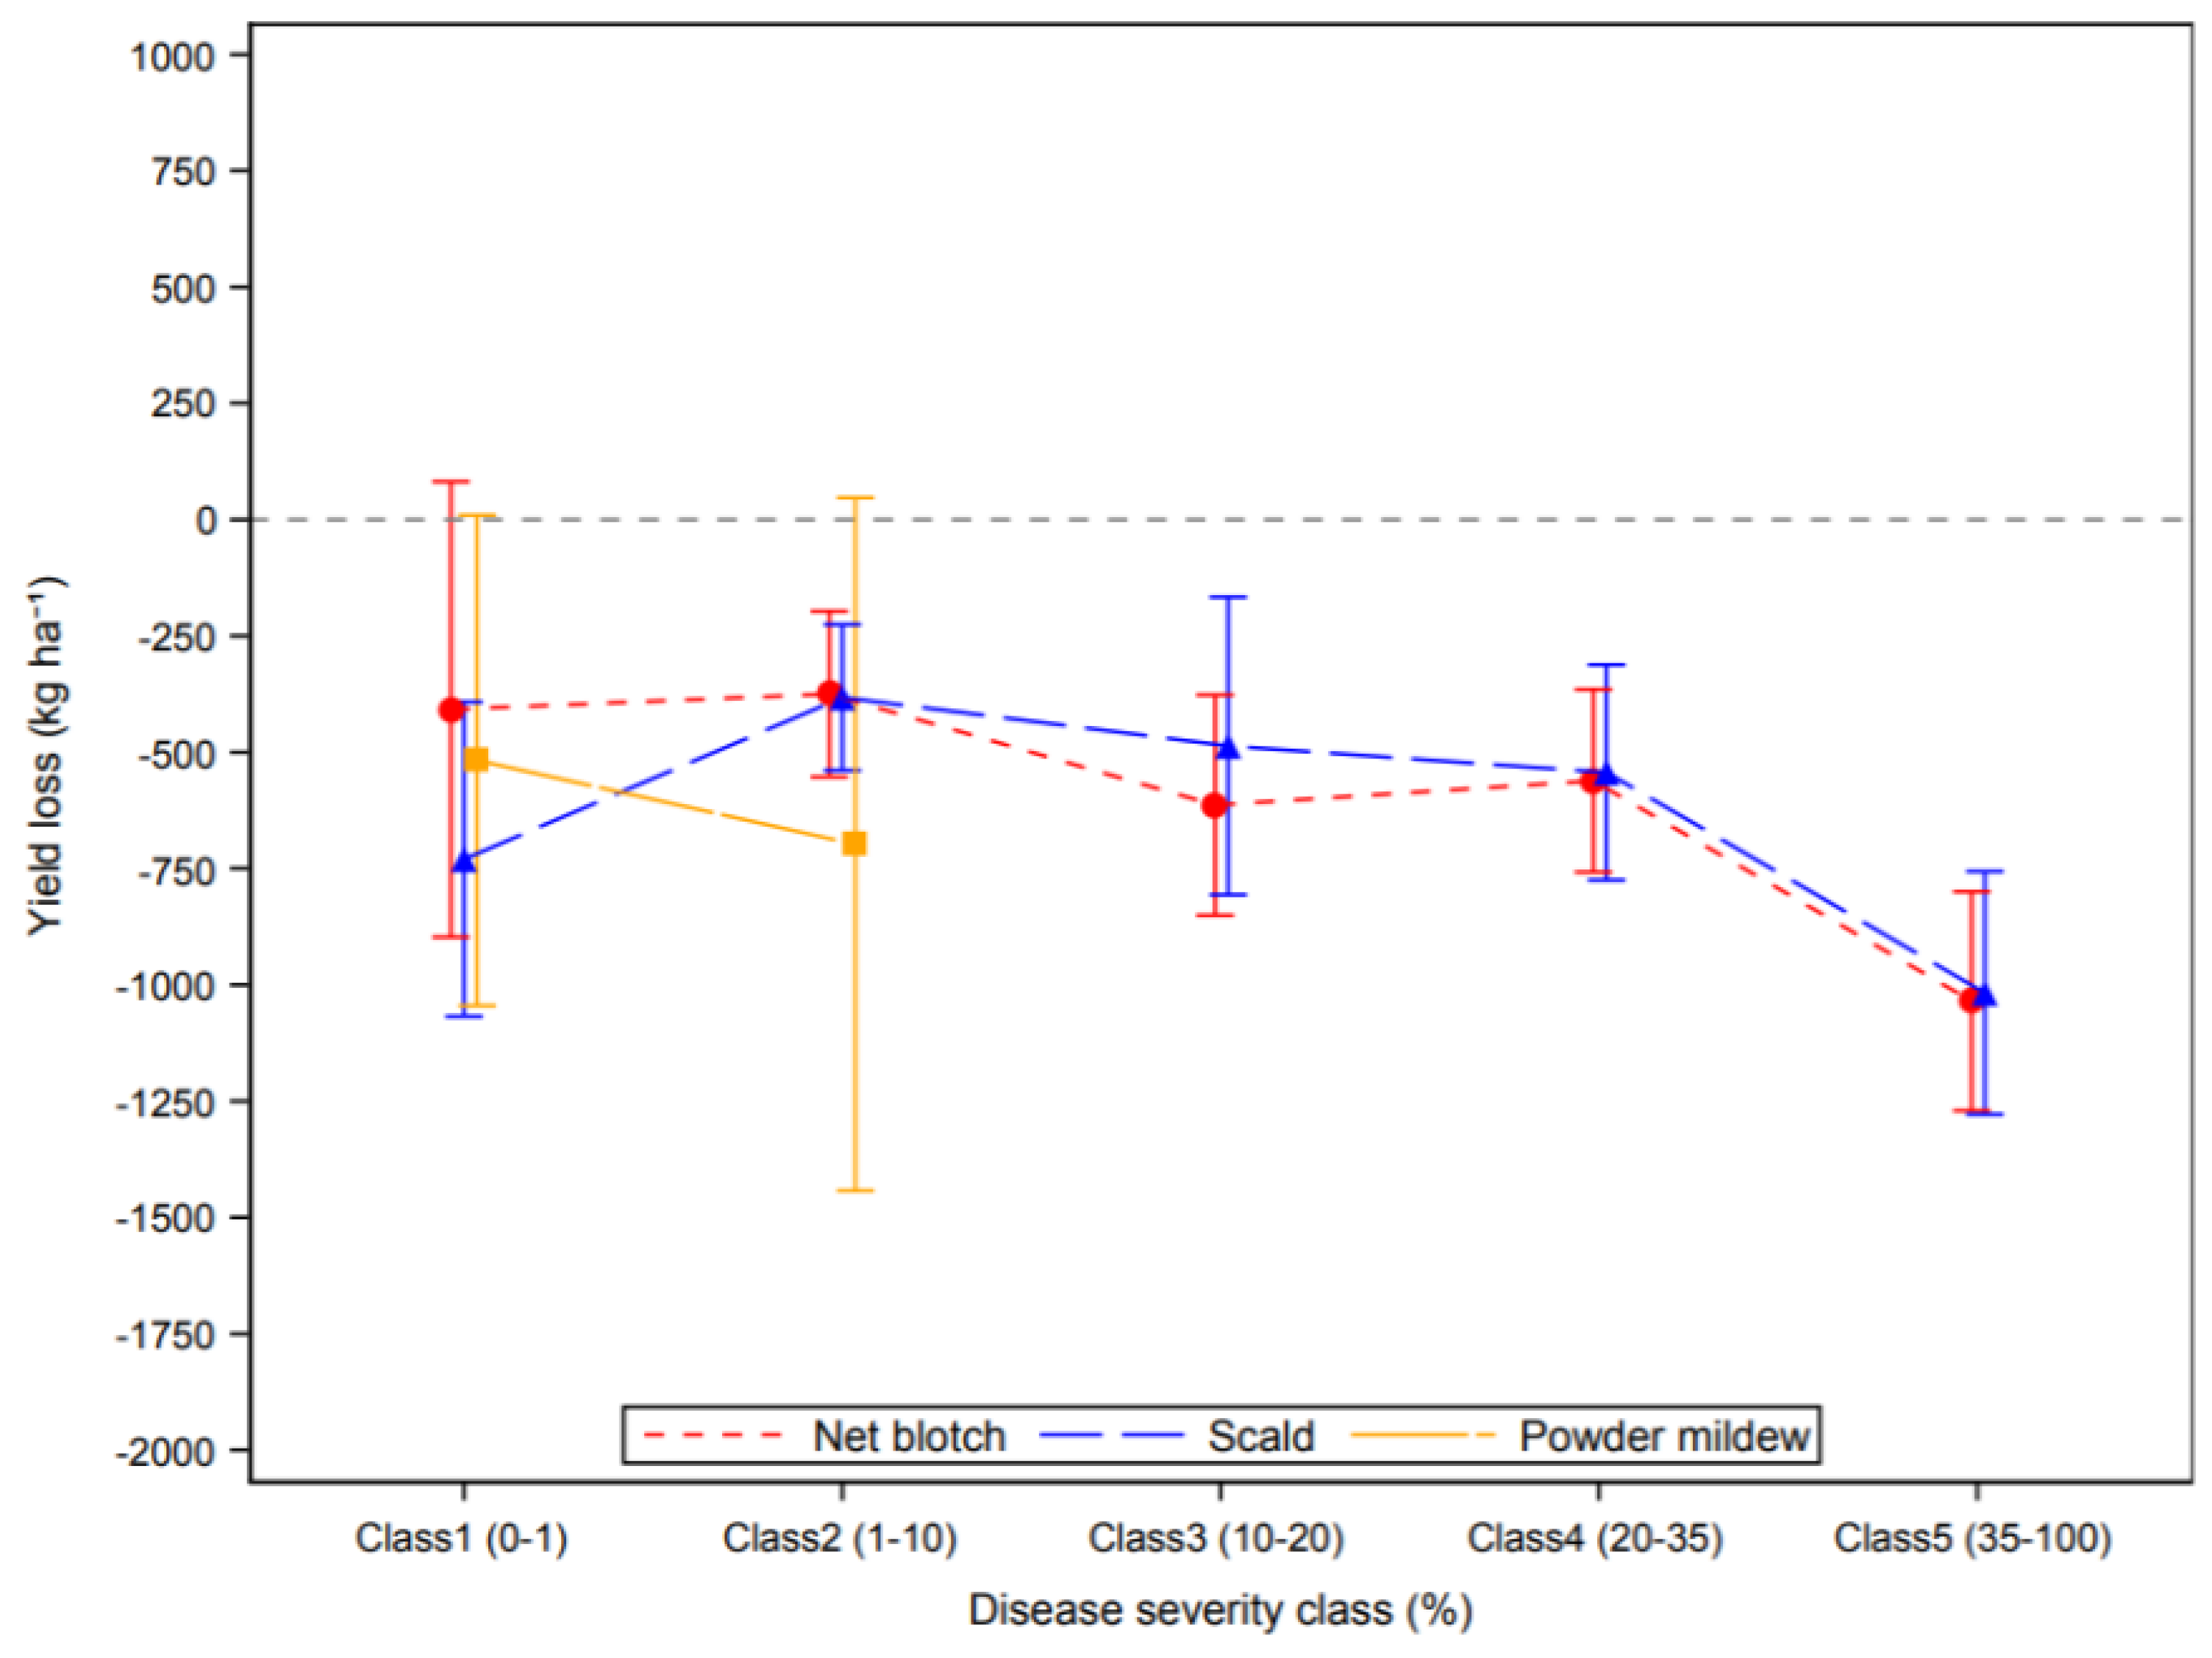
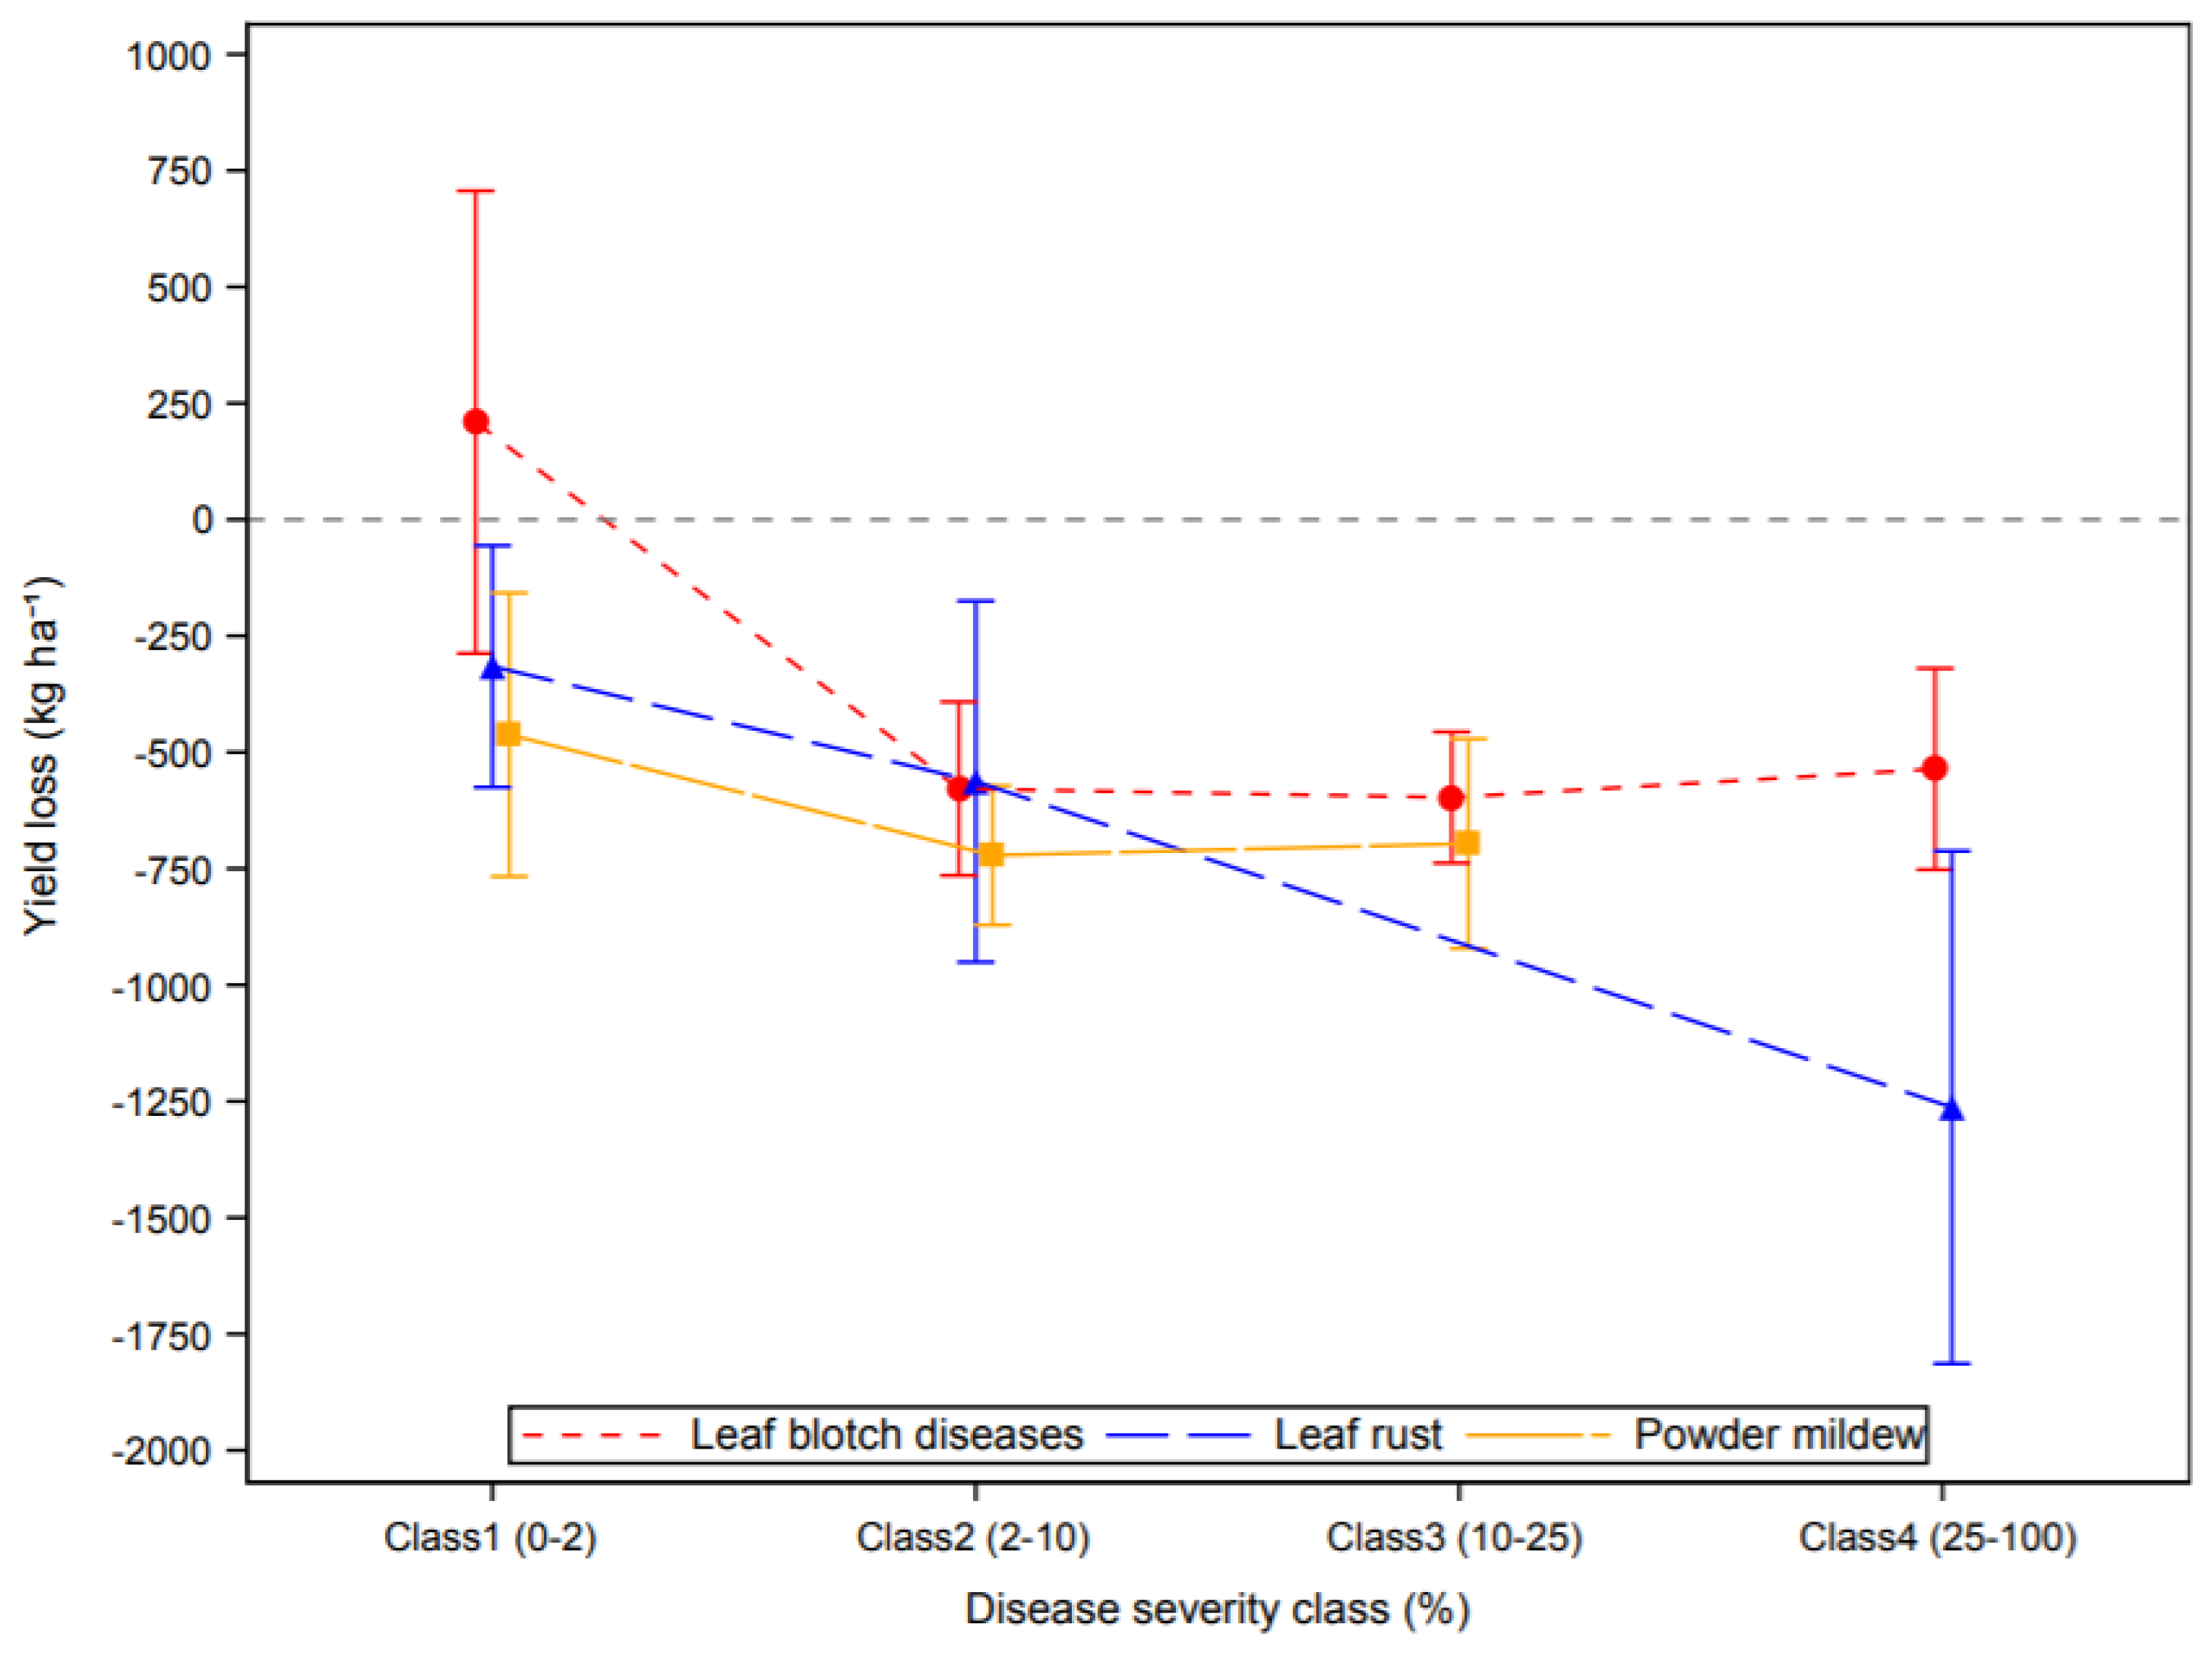
3.2. Effect of Plant Diseases on Cereal Yield

The trial data were classified into five disease severity classes according to the total disease severity of the untreated treatments for spring barley (Figure 4). In 49 spring barley fungicide trials studied, net blotch symptoms were observed in 47 of the trials. In the untreated plots of these 47 trials, maximum net blotch severity was 95% and the average severity was 26%. For net blotch, the yield losses in the highest disease class (class 5) differed from classes 2 and 4 significantly (p < 0.001 and p = 0.020) and nearly significantly for class 3 (p = 0.086). The mean yield loss caused by net blotch at disease severity 35.01–100% was 1035 kg ha−1.
Scald data was compiled from 32 trials with a maximum disease severity of 80% and an average disease severity of 18%. The yield loss in the highest disease class (class 5) for scald differs from class 2 significantly (p = 0.001) and almost significantly from classes 3 and 4 (p = 0.082 and p = 0.061, respectively). The mean yield loss estimate caused by scald at disease severity 35.01–100% was 1017 kg ha−1.
Powdery mildew was only observed in 9 of the 49 trials with a maximum disease severity value of 8% and an average disease severity of 1.7% overall (Figure 4). In the lowest disease severity class (0–1%), powdery mildew caused 517 kg ha−1 yield reduction. When the disease severity was 1.01–10%, powdery mildew caused higher yield losses (697 kg ha−1) than net blotch or scald (375 and 382 kg ha−1, respectively).
In spring wheat, the trial data were classified into four disease severity classes according to the total disease severity of the untreated treatments (Figure 5). For the 55 spring wheat fungicide trials, the sum of stagonospora blotch severity and tan spot severity was combined to give a composite leaf blotch value. Leaf blotch symptoms were observed in all 55 trials. In the untreated plots, the maximum disease severity was 90% and the average severity was 19%. There was no clear correlation between increased leaf blotch severity and yield loss. However, yield loss caused by the lowest infection level (0–2%) did differ significantly from the yield losses caused by higher leaf blotch severity classes (p < 0.05). The mean yield loss caused by leaf blotch at disease severity 25.01–100% was 535 kg ha−1.
Powdery mildew was observed in 22 of the 55 trials with a maximum disease severity value of 15% and an average disease severity of 7.4%. In the lowest disease severity class (0–2%), powdery mildew caused 462 kg ha−1 yield reduction. When the disease severity was 2.01–10%, powdery mildew caused higher yield losses (721 kg ha−1) than leaf blotch or leaf rust (578 and 562 kg ha−1, respectively).
Wheat leaf rust symptoms were only observed in seven of the 55 trials, with the maximum disease severity 62% and the average disease severity of 7.5%. In the highest disease severity class (25.01–100%) the yield loss caused by wheat leaf rust (1262 kg ha−1) was clearly higher than in the first two classes (p = 0.014 and p = 0.100, respectively) and significantly higher (p = 0.001) than that caused by leaf blotch diseases (536 kg ha−1). On average, leaf rust decreased the yield of spring wheat by 26% and leaf blotch disease by 11% in the highest disease severity class.

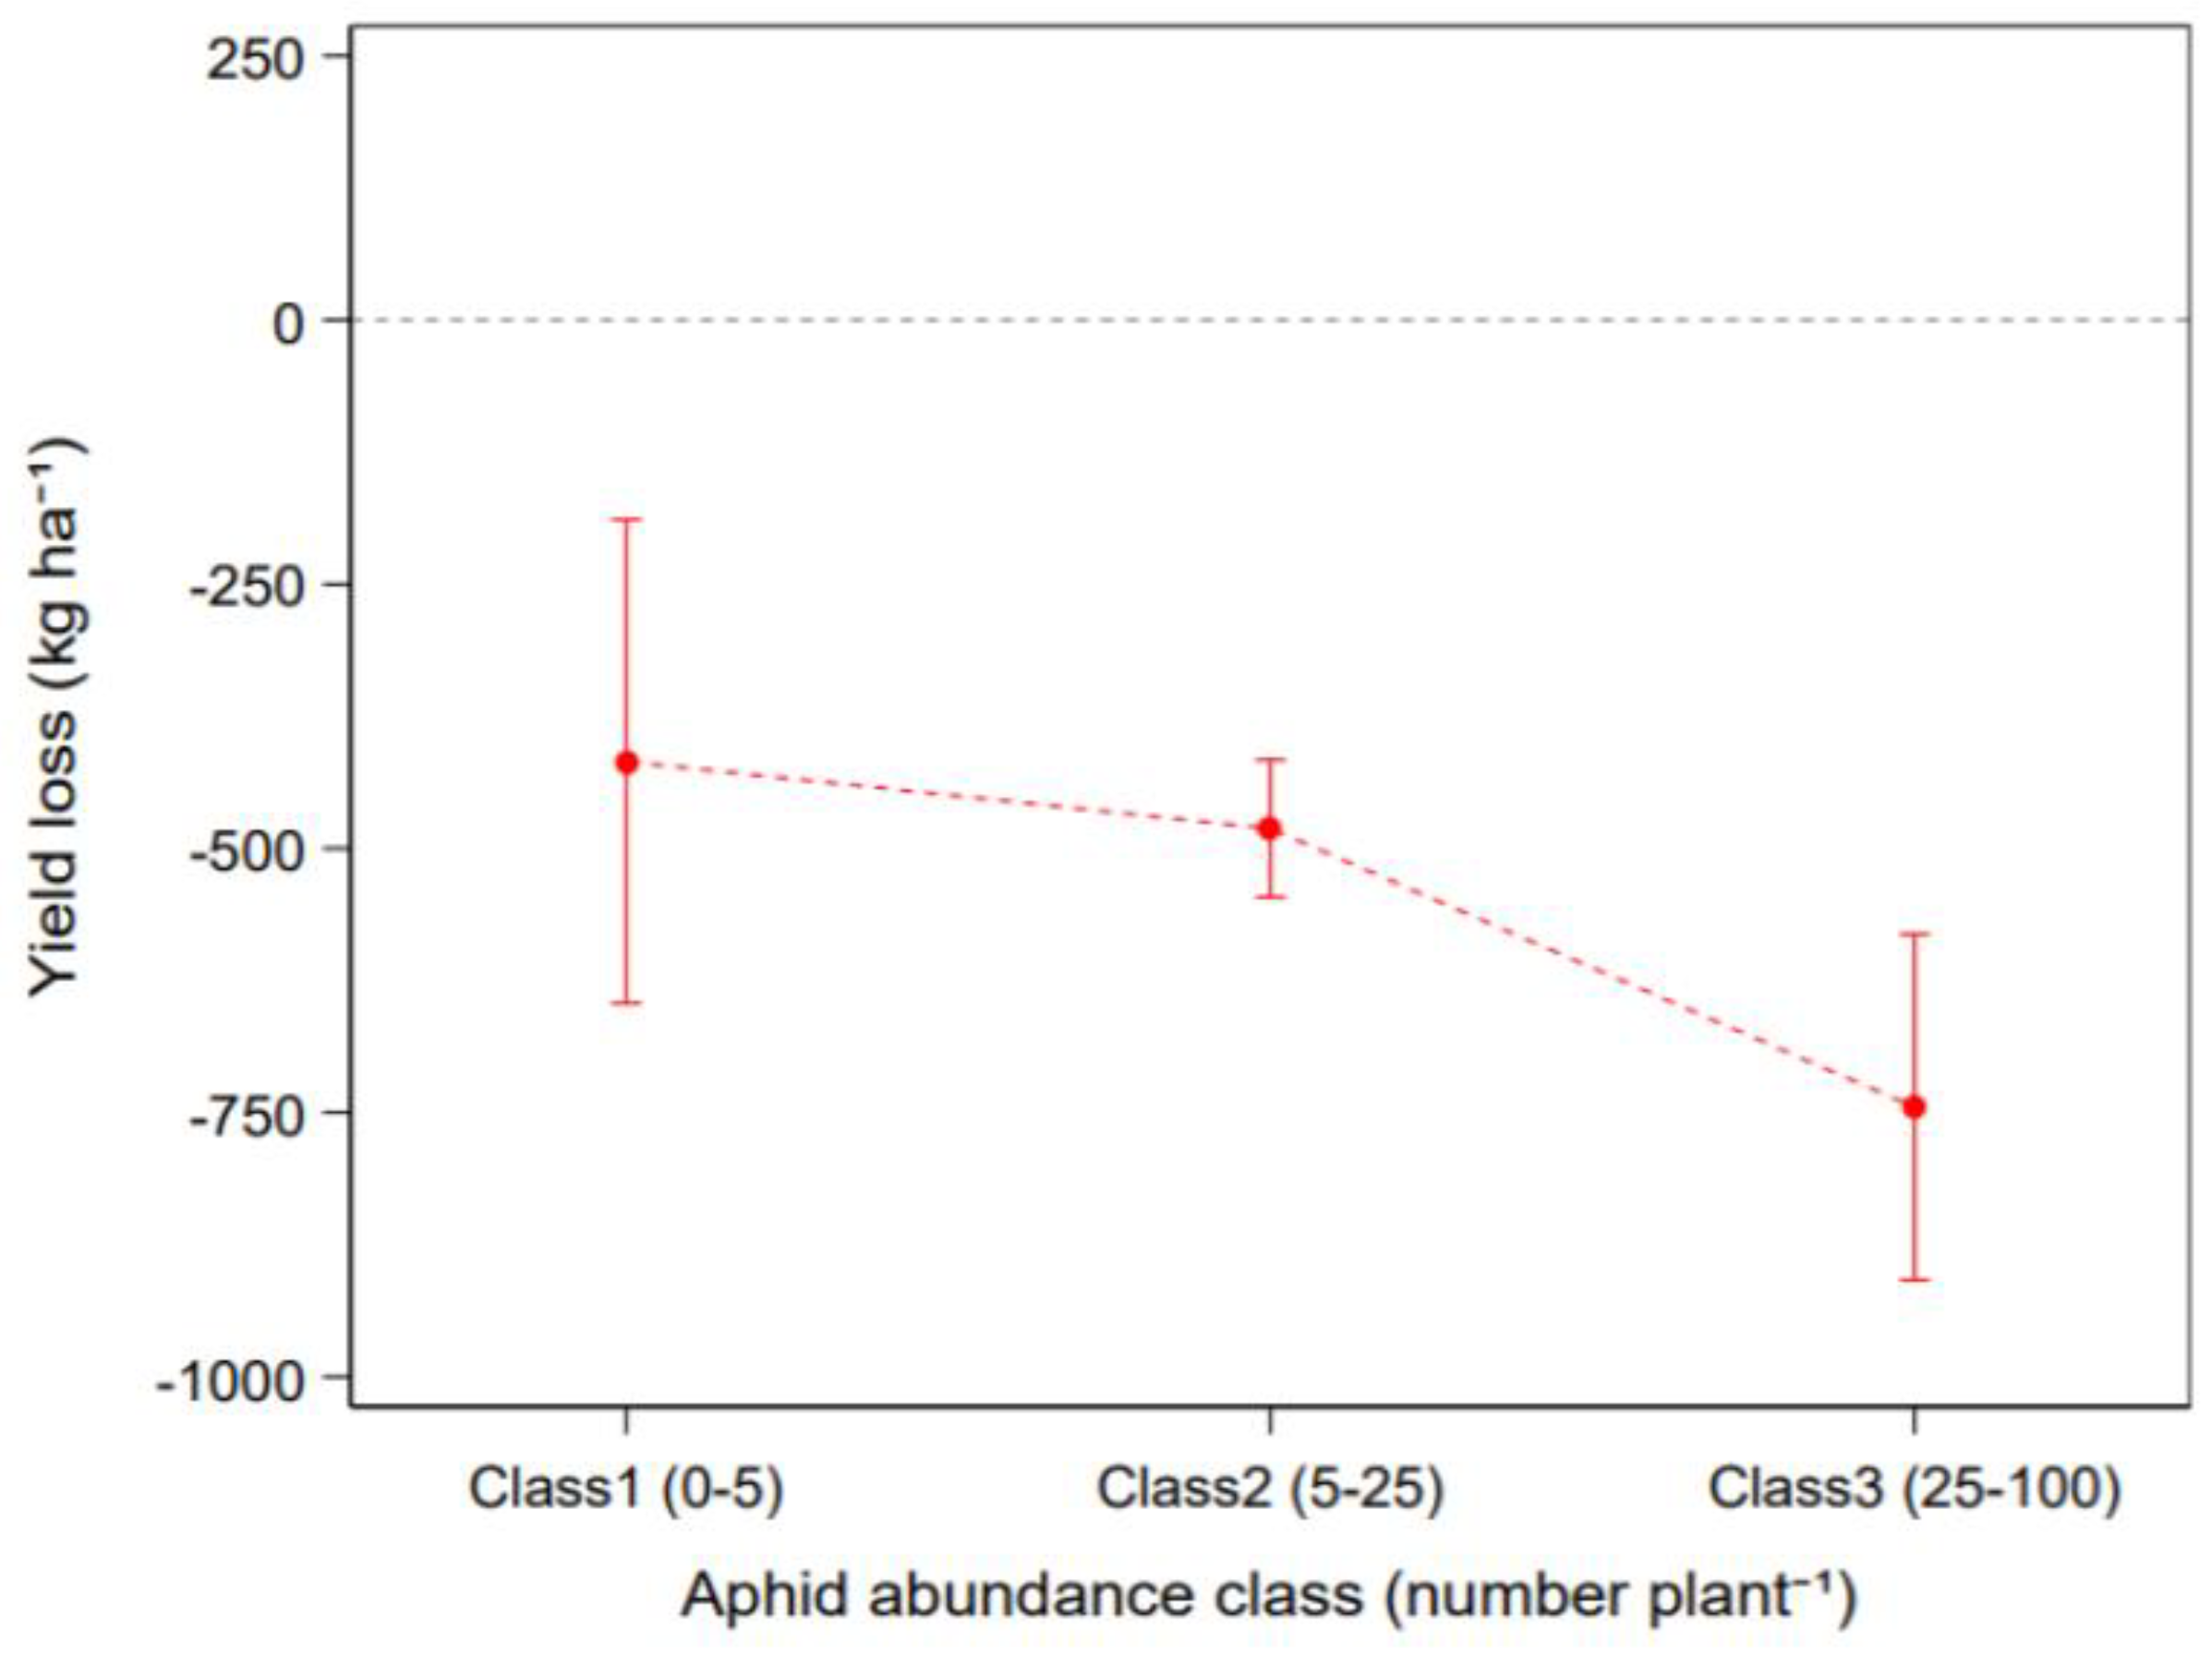
3.3. Effect of Pest Insects on Crop Yield

In 15 insecticide trials of bird cherry-oat aphids held between 1999 and 2008, the number of aphids varied widely in cereal crops, as is typical in Finland [50]. Yield loss caused by aphids increased particularly when there were more than 25 aphids per plant (Figure 6). Yield losses caused by bird cherry-oat aphid were significantly higher in the highest allocated aphid-abundance class (class 3): class 3 differed from classes 2 and 1 significantly (p = 0.016 and p = 0.064). Estimated yield losses in different insect classes 1, 2 and 3 were 418, 481 and 745 kg ha−1, respectively. Based on these results, bird cherry-oat aphid decreased the yield of cereal crops on average by 7, 9 and 13% in aphid-abundance classes 1–3 (Figure 6), respectively.

3.4. Nitrogen and Phosphorus Yield Loss

Based on the results of herbicide and fungicide trials described above, the estimated yield loss for both spring barley and spring wheat in the untreated conditions (at 15% grain moisture content) was set to 200 kg ha−1 for weeds (Figure 3) and 500 kg ha−1 for fungal leaf diseases (Figure 4 and Figure 5). The estimated yield loss, when no seed treatment was used, was set 300 kg ha−1 based on a study by Khanzada et al. [43], and Rajala et al. [42]. The hectare-based N- and P-yield losses were similar for both spring barley and spring wheat, though mean N-yield loss was slightly higher in spring wheat, due to higher grain N concentration of spring wheat compared to spring barley (Table 2). In case of none of the chemical plant protection actions being carried out (seed treatment, herbicide treatment and fungicide treatment), estimated theoretical maximum N yield loss was 16.1 kg N ha−1 for barley and 18.4 kg N ha−1 for wheat. Phosphorus yield loss was 3.0 kg P ha−1 for barley and 3.1 kg P ha−1 for wheat (Table 2).

4. Discussion

Even though pests and their effect to crop yield has been an object of interest in agricultural studies for decades, the effect of pests on nutrient yield harvested in grain yield is seldom reported. There is, however, an urgent need to reduce nutrient leaching from field to surface water [30,51,52,53]. Crop nutrient uptake efficiency related to nutrients applied as fertilizer is one indicator for the risk of nutrient leaching especially outside growing season [33,42,54]. We addressed the question by examining the effects of pests on spring cereal grain yield and nutrient yield harvested in grain yield. The effects of weeds, plant diseases and insect pests on the grain yield of spring barley and spring wheat were examined in 47 study years with 299 trials. This long-term data covered several growth zones in Finland and wide range of growing seasons with variable weather conditions and cultivars.
In the studied herbicide trials, it was estimated that weeds caused a 200 kg ha−1 annual yield loss both in spring barley and spring wheat in northern European growing conditions. The estimate is based on the Salonen et al. [49] survey, where the average air-dry weed biomass was 167 kg ha−1 with the median of 82 kg ha−1 in conventional fields in Finland (523 fields). That represents the weed biomass class 1 and class 2 in the current study, which caused on average 200 kg ha−1 yield losses to spring barley and spring wheat. In addition, similar yield losses caused by weeds were found by Salonen [13] for spring wheat in Finland, but Milberg and Hallgren [14] estimated much higher yield losses for spring and winter cereals in Sweden (31% yield losses).
In the current study, when the average weed biomass was below 580 kg ha−1, the grain yield loss of spring wheat and spring barley caused by weeds was on the same level, below 300 kg ha−1. However, when the weed biomass exceeded 580 kg ha−1, the average yield loss for spring barley was higher than for spring wheat. Current results are not congruent with other studies, which report that spring wheat is more sensitive to weeds than spring barley [55,56]. However, it is reported that in unfavorable weather conditions, prolonged drought or excess soil moisture, especially early in the season or high temperatures at heading, spring barley is sensitive to stress [57] which may give more opportunity for weeds to further compete aggressively. Besides, morphological characters like crop height and tillering capacity have an effect on weed suppression [58] as well as sowing density and nitrogen fertilization [59] when part of the given fertilization is taken up by weeds [60,61]
In the studied fungicide trials, the variation in yield losses were high among trials. This illustrates the challenge of quantifying the actual yield loss based on specific disease severities in different environmental conditions and crop growth stages in which the crop is affected by the disease [62]. According to the results, more than 35% of leaf area infected by net blotch or scald in spring barley and more than 25% of leaf area infected leaf rust in spring wheat caused significant yield reduction compared to lower disease severities. On average, 10–25% cereal leaf diseases infection on three uppermost leaves cause 500 kg ha−1 yield reduction both in spring barley and spring wheat in Finland without plant protection. This agrees with a study by Jayasena et al. [63] where on average, every 10% increase of net blotch disease severity decreased the spring barley yield by 400 kg ha−1.
Bird cherry-oat aphid is the predominant insect pest found on spring cereals in Finland [50] but its abundance and influence on spring cereal yield vary widely, both temporally and regionally. Heavy aphid infestations generally occur twice in a decade [46]. In the current study, aphid data was restricted to 15 trials from 1999 to 2008 in the absence of a heavy outbreak of bird cherry-oat aphid. According to the current results, cereal yield loss caused by aphids was approximately 750 kg ha−1 when there were 25–100 aphids per plant. Similarly, Kieckhefer and Kantack [64] found that 25–30 aphids per stem decreased the yield of winter cereals by up to 50%. Furthermore, barley yellow dwarf virus (BYDV) transmitted by aphids can notably increase yield loss [19].
Yield loss estimations based on extensive experimental data were the basis for N- and P-yield calculations. Grain yield is the primary determinant for the nutrient removal from the field. Typically, 75–85% of the above-ground plant N and P is in the grain of barley and wheat, grown in northern growing conditions ([34], Rajala, unpublished data). Thus, reduction in grain yield directly affects N- and P-yield and N and P removal from the field. When the N- and P removal compared to the N- and P- dose given as fertilizes decreases, the positive nutrient balance (nutrient dose kg ha−1—nutrient removal in yield kg ha−1) increases. In this situation after harvester, the amount of nutrients that were left unused by crops will increase the risk of nutrient leaching outside the growing season. As shown in Turtola et al. [37] study, higher N-balance (nitrogen applied as in fertilize/manure—nitrogen harvested in grain (yield)) increase the risk of nitrogen leaching. Similarly, in Uusitalo et al. [53] study, values of phosphorus in soil tests change over time affected by the reduction of P-balance and the reduction of soil P level decreases the risk of phosphorus leaching. As pests disturb crop growth causing significant yield losses and increasing the positive nutrient balance, this probably also increases the risk of nutrient leaching. This will also reduce the secure yield of crops: in the current study, if none of the crop protection measures (seed treatment, herbicide and fungicide treatment) were applied, hypothetical annual average reduction in cereal grain yield could be as high as 1000 kg ha−1 which corresponds to a 27% yield loss of the average yield of spring cereals in Finland [65].
In 2019 in Finland, the total land area allocated for spring barley and spring wheat was 700 thousand hectares with average crop yield 4230 and 4300 kg ha−1 for spring wheat and spring barley, respectively [65] which are clearly lower than average crop yield in Europe [66]. In spring cereal production during normal Finnish growing conditions, average theoretical nutrient yield losses caused by weeds and plant diseases was on a per hectare basis in current study: 16 kg N ha−1 and 3 kg P ha−1 for spring barley and 18 kg N ha−1 and 3 kg P ha−1 for spring wheat. However, when the total cultivation area of spring barley and spring wheat in Finland (700,000 ha in 2019) [49] is taken account, the situation changes. Theoretical annual nutrient loss estimation due to weeds and fungal diseases without plant protection totals 12 Mkg N and 2.2 Mkg P per year in Finland. The observation that nutrient concentration and grain yield tend to be negatively correlated [34,67], was not taken account in N and P loss calculations in the current study. This effect is relatively small and challenging to estimate.
In Finland, the average annual nutrient input per hectare for the years between 2010 and 2014, was 100 kg N and 9.8 kg P for spring wheat and 80 kg N and 9.3 kg P for spring barley [37]. When the N- and P-yield loss estimation (16 kg N ha−1 and 3 kg P ha−1 for spring barley and 18 kg N ha−1 and 3 kg P ha−1 for spring wheat) is compared to annual nutrient input for spring barley and spring wheat in Finland [37], theoretical estimated N- and P-yield loss as unused nutrient input without any plant protection is 20% (N) and 32% (P) for spring barley and 18% (N) and 32% (P) for spring wheat. This reduces the use efficiency of fertilizer nutrients and may increase the risk of nutrient leaching by leaving surplus N and P in the soil [33,42,54]. For farmers, these nutrient losses translate also into commercially damaging economic losses by unused fertilizer and crop yield losses.
Ensuring plant health and high grain yield enhances effective nutrient utilization of the crop, which may decrease the potential risk of nutrient leaching [68,69]. Nutrient loss estimations reveal the underlying scale and magnitude of the potential crop pest-induced losses in both grain yield and N- and P-yield. Different plant protection methods such as for example crop rotation [70,71,72], cultivar resistance [73,74,75] and tillage [76,77,78,79] are available to prevent these losses caused by weeds, plant diseases and insects. In situations where preventive control measures are not available or are not sufficiently effective, the use of plant protection products is justified.

5. Conclusions

The results presented above indicate that there is a positive correlation between plant protection actions and nutrient yield in spring wheat and spring barley. Fortifying plant health secures cereal grain yield and may decrease the environmental risks caused by unutilized nutrients due to weaker plant growth caused by pests. The phenomena associated with plant health and the potential impact of pests on crop yield and nutrient uptake are universal and thus the results presented in this paper are expected to be of value to the wider global crop-production sector.

Supplementary Materials

The following are available online at https://www.mdpi.com/2073-4395/11/3/592/s1, Table S1. Least squares means of spring barley and spring wheat yield loss differences between different weed biomass classes (lower minus higher class as ‘Mean diff’), their standard error (SE) and P value (P). P values of multiple comparisons were calculated using the method of Tukey-Kramer (α = 0.05). Positive values of the differences of the means in yield indicate greater yield loss as weed biomass class increases. Table S2. Least squares means of spring barley yield loss differences between net blotch, scald and powdery mildew severity classes (lower minus higher severity class as ‘Mean diff’), their standard error (SE) and P value (P). P values of multiple comparisons were calculated using the method of Tukey-Kramer (α = 0.05). Positive values of the differences of the means in yield indicate greater yield loss as the disease severity class increases. Table S3. Least squares means of spring wheat yield loss differences between leaf blotch disease, powdery mildew and leaf rust severity classes (lower minus higher severity class as ‘Mean diff’), their standard error (SE) and P value (P). P values of multiple comparisons were calculated using the method of Tukey-Kramer (α = 0.05). Positive values of the differences of the means in yield indicate greater yield loss as the disease severity class increases.

Author Contributions

Conceptualization, K.K., L.A. and M.J.; methodology, J.K.; software, J.K.; validation, M.J., E.H. and P.R.; formal analysis, J.K.; investigation, E.H., P.R. and H.J.; data curation, J.K., M.J., E.H., P.R. and A.R.; writing—original draft preparation, K.K., A.R., E.H., J.K., P.R., H.J., L.A. and M.J.; writing—review and editing, K.K., J.K., M.J. and L.A.; visualization, J.K.; supervision, L.A. and M.J.; project administration, K.K., M.J. and L.A.; funding acquisition, M.J., L.A. and K.K. All authors have read and agreed to the published version of the manuscript.

Funding

This work was supported by Finnish ministry of agriculture and forestry (1531/03.01.02/2016) through the TerveKasvi-project (2017–2019), by The Finnish Cultural Foundation through Shared waters project (2019–2021) and by Maa- ja vesitekniikan tuki ry through personal scholarship to Katja Kauppi.

Acknowledgments

For the skilled laboratory analyses and field work, we wish to thank MTTK/MTT/Luke’s technical staff in Inkoo, Jokioinen, Kaarina, Nousiainen, Tikkurila and Ylistaro. Open access funding provided by University of Helsinki.

Conflicts of Interest

The authors declare that they have no known competing financial interests or personal relationships that could have appeared to influence the work reported in this paper.

References

  1. Peltonen-Sainio, P.; Jauhiainen, L.; Laurila, I.P. Cereal yield trends in northern European conditions: Changes in yield potential and its realization. Field Crop. Res. 2009, 110, 85–90. [Google Scholar] [CrossRef]
  2. Olesen, J.E.; Bindi, M. Consequences of climate change for European agricultural productivity, land use and policy. Eur. J. Agron. 2002, 16, 239–262. [Google Scholar] [CrossRef]
  3. Peltonen-Sainio, P.; Palosuo, T.; Ruosteenoja, K.; Jauhiainen, L.; Ojanen, H. Warming autumns at high latitudes of Europe: An opportunity to lose or gain in cereal production? Reg. Environ. Chang. 2018, 18, 1453–1465. [Google Scholar] [CrossRef]
  4. Coakley, S.M.; Scherm, H.; Chakraborty, S. Climate change and plant disease management. Annu. Rev. Phytopathol. 1999, 37, 399–426. [Google Scholar] [CrossRef] [PubMed]
  5. Juroszek, P.; von Tiedemann, A. Potential strategies and future requirements for plantdisease management under a changing climate. Plant Pathol. 2011, 60, 100–112. [Google Scholar] [CrossRef]
  6. Cammell, M.E.; Knight, J.D. Effects of climatic change on the population dynamics of crop pests. Adv. Ecol. Res. 1992, 22, 117–162. [Google Scholar] [CrossRef]
  7. Bale, J.S.; Masters, G.J.; Hodkinson, I.D.; Awmack, C.; Bezemer, T.M.; Brown, V.K.; Butterfield, J.; Buse, A.; Coulson, J.C.; Farrar, J.; et al. Herbivory in global climate change research: Directeffects of rising temperature on insect herbivores. Glob. Chang. Biol. 2002, 8, 1–16. [Google Scholar] [CrossRef]
  8. Hakala, K.; Hannukkala, A.O.; Huusela-Veistola, E.; Jalli, M.; Peltonen-Sainio, P. Pests and diseases in a changing climate: A major challenge for Finnish crop production. Agric. Food Sci. 2011, 20, 3–14. [Google Scholar] [CrossRef] [Green Version]
  9. Oerke, E.-C. Crop losses to pests. J. Agric. Sci. 2006, 144, 31–43. [Google Scholar] [CrossRef]
  10. Cousens, R.; Brain, P.; O’Donovan, J.T.; O’Sullivan, A. The use of biolicallu realitic equations to descrobe the effect of weeds density and relative time of emergence on crop yield. Weed Sci. 1987, 35, 720–725. [Google Scholar] [CrossRef]
  11. Kropff, M.J. Modelling the effect of weeds on crop production. Weed Res. 1988, 28, 465–471. [Google Scholar] [CrossRef]
  12. Lutman, P.J.W.; Moss, S.R.; Cook, S.; Welham, S.J. A review of the effects of crop agronomy on the management of Alopecurus myosuroides. Weed Res. 2013, 53, 299–313. [Google Scholar] [CrossRef]
  13. Salonen, J. Yield responses of spring cereals to reduced herbicide doses. Weed Res. 1992, 32, 493–499. [Google Scholar] [CrossRef]
  14. Milberg, P.; Hallgren, E. Yield loss due to weeds in cereals and its large-scale variability in Sweden. Field Crop. Res. 2004, 86, 199–209. [Google Scholar] [CrossRef]
  15. Murray, G.M.; Brennan, J.P. The Current and Potential Costs from Diseases of Wheat in Australia; Grains Research and Development Corporation: Kingston, Australia, 2009; p. 21. ISBN 978-1-875477-92-0. [Google Scholar]
  16. Murray, G.M.; Brennan, J.P. Estimating disease losses to the Australian barley industry. Aust. Plant Pathol. 2010, 39, 85–96. [Google Scholar] [CrossRef]
  17. Bockus, W.W.; Appel, J.A.; Bowden, R.L.; Fritz, A.K.; Gill, B.S.; Martin, T.J.; Sears, R.G.; Seifers, D.L.; Brown-Guedira, G.L.; Eversmeyer, M.G. Success Stories: Breeding for Wheat Disease Resistance in Kansas. Plant Dis. 2001, 85, 453–461. [Google Scholar] [CrossRef]
  18. Jalli, M.; Kaseva, J.; Andersson, B.; Ficke, F.; Nistrup-Jørgensen, L.; Ronis, A.; Kaukoranta, T.; Ørum, J.E.; Djurle, A. Yield increases due to fungicide control of leaf blotch diseases in wheat and barley as a basis for IPM decision-making in the Nordic-Baltic region. Eur. J. Plant Pathol. 2020, 158, 315–333. [Google Scholar] [CrossRef]
  19. Riedell, W.E.; Kieckhefer, R.W.; Haley, S.D.; Langham, M.A.C.; Evenson, P.D. Winter wheat responses to bird cherry-oat aphids and barley yellow dwarf virus infection. Crop Sci. 1999, 39, 158–163. [Google Scholar] [CrossRef]
  20. McKirdy, S.J.; Jones, R.A.C.; Nutter, F.W., Jr. Quantification of yield losses caused by barley yellow dwarf virus in wheat and oats. Plant Dis. 2002, 86, 769–773. [Google Scholar] [CrossRef] [PubMed] [Green Version]
  21. Jefferies, S.P.; King, B.J.; Barr, A.R.; Warner, P.; Logue, S.J.; Langridge, P. Marker-assisted backcross introgression of the Yd2 gene conferring resistance to barley yellow dwarf virus in barley. Plant Breed. 2003, 122, 52–56. [Google Scholar] [CrossRef]
  22. Helenius, J. Effect of epigeai predators on infestation by the aphid Rhopalosiphum padi and on grain yield of oats in monocrops and mixed intercrops. Entomol. Exp. Appl. 1990, 54, 225–236. [Google Scholar] [CrossRef]
  23. Hansen, L.M. Establishing control threshold for bird cherry-oat aphid (Rhopalosiphum padi L.) in spring barley (Hordeum vulgare L.) by aphid-days. Crop Prot. 2000, 19, 191–194. [Google Scholar] [CrossRef]
  24. European Comission. Integrated Pest Management (IPM). Available online: https://ec.europa.eu/food/plant/pesticides/sustainable_use_pesticides/ipm_en (accessed on 15 October 2019).
  25. Official Statistics of Finland (OSF): Used of Pesticides. Helsinki: Natural Resources Institute Finland. Available online: http://statdb.luke.fi/PXWeb/pxweb/en/LUKE/LUKE__02%20Maatalous__04%20Tuotanto__34%20Kasvinsuojeluaineiden%20kaytto%20maataloudessa/02_Kasvinsuojeluainekaytto.px/table/tableViewLayout1/?rxid=dc711a9e-de6d-454b-82c2-74ff79a3a5e0 (accessed on 7 October 2020).
  26. Farm to Fork Strategy—for a Fair, Healthy and Environmentally-Friendly Food System. Available online: https://ec.europa.eu/food/farm2fork_en (accessed on 18 December 2020).
  27. World Fertilizer Trends and Outlook to 2018. Available online: http://www.fao.org/3/a-i4324e.pdf (accessed on 21 January 2020).
  28. Official Statistics of Finland (OSF): Nitrogen and phosphorus balance. Helsinki: Natural Resources Institute Finland. Available online: https://stat.luke.fi/en/indicator/nitrogen-and-phosphorus-balance (accessed on 15 November 2019).
  29. Syers, J.K.; Johnston, A.E.; Curtin, D. Efficiency of soil and fertilizer phosphorus: Reconciling changing concepts of soil phosphorus chemistry with agronomic information. In Proceedings of the 18th World Congress of Soil Science, Philadelphia, PA, USA, 9–15 July 2006. [Google Scholar]
  30. Jeppesen, E.; Kronvang, B.; Meerhoff, M.; Søndergaard, M.; Hansen, K.; Andersen, H.; Lauridsen, T.; Liboriussen, L.; Beklioglu, M.; Özen, A.; et al. Climate Change Effects on Runoff, Catchment Phosphorus Loading and Lake Ecological State, and Potential Adaptations. J. Environ. Qual. 2009, 38, 1930–1941. [Google Scholar] [CrossRef] [PubMed]
  31. Tattari, S.; Koskiaho, J.; Kosunen, M.; Lepistö, A.; Linjama, A.; Puustinen, M. Nutrient loads from agricultural and forested areas in Finland from 1981 up to 2010—Can the efficiency of undertaken water protection measures seen? Environ. Monit. Assess. 2017, 189, 95. [Google Scholar] [CrossRef] [PubMed] [Green Version]
  32. Baligar, V.C.; Fageria, N.K.; He, Z.L. Nutrient use efficiency in plants. Commun. Soil Sci. Plant Anal. 2001, 32, 921–950. [Google Scholar] [CrossRef]
  33. Cordell, D.; Drangert, J.-O.; White, S. The story of phosphorus: Global food security and food for thought. Glob. Environ. Chang. 2009, 19, 292–305. [Google Scholar] [CrossRef]
  34. Rajala, A.; Peltonen-Sainio, P.; Jalli, M.; Jauhiainen, L.; Hannukkala, A.; Tenhola-Roininen, T.; Ramsay, L.; Manninen, O. One century of Nordic barley breeding: Nitrogen use efficiency, agronomic traits and genetic diversity. J. Agric. Sci. 2017, 155, 582–598. [Google Scholar] [CrossRef]
  35. Alam, S.M. Handbook of Plant and Crop Stress, 2nd ed.; Marcel Dekker: New York, NY, USA, 1999; pp. 285–314. ISBN 0-8247-1948-4. [Google Scholar]
  36. Mela, T.; Haapalainen, M. Hehtaarisatojen ja Tärkeimpien Satoon Vaikuttavien Tekijöiden Kehitys Vuosina 1956-75 ja Ennuste Vuoteen 1985; Kasvinviljelylaitoksen Tiedote Numero 4; Maatalouden Tutkimuskeskus, Tikkurila: Helsinki, Finland, 1976. [Google Scholar]
  37. Turtola, E.; Salo, T.; Miettinen, A.; Iho, A.; Valkama, E.; Rankinen, K.; Virkajärvi, P.; Tuomisto, J.; Sipilä, A.; Muurinen, S.; et al. Hyötyä Taseista-Ravinnetaseiden Tulkinta Ympäristön ja Viljelyn Hyödyksi; Juvenes Print: Helsinki, Finland, 2017; ISBN 978-952-326-373-4. [Google Scholar]
  38. Yli-Halla, M.; Nykänen, A.; Siimes, K.; Tuhkanen, H.-R. Ympäristötuen Ehdot ja Maan Helppoliukoisen Fosforin Pitoisuus; Jyväskylän Yliopistopaino: Jyväskylä, Finland, 2001; ISBN 951-729-574-X. [Google Scholar]
  39. MTTK/MTT Annual Reports of Official Herbicide Testing in Finland in 1965−2012. Available at: Project Management, Pesticide Testing Pentti Ruuttunen, [email protected].
  40. Bleiholder, H.; Feller, C.; Hess, M.; Meier, U.; van den Boom, T.; Lancashire, P.D.; Buhr, L.; Hack, H.; Klose, R.; Stauss, R.; et al. Compendium of Growth Stage Identification Keys for Mono- and Dicotyledonous Plants-Extended BBCH Scale, 2nd ed.; A joint publication of BBA BSA IGZ IVA AgrEvo BASF Bayer Novartis ISBN; 1997; ISBN 3-9520749-3-4. [Google Scholar]
  41. MTT/Luke Annual Reports of Official Pesticide Testing in Finland in 1999−2016. Available at: Project Management, Pesticide Testing Pentti Ruuttunen, [email protected].
  42. Rajala, A.; Niskanen, M.; Isolahti, M.; Peltonen-Sainio, P. Seed quality effects on seedling emergence, plant stand establishment and grain yield in two-row barley. Agric. Food Sci. 2011, 20, 228–234. [Google Scholar] [CrossRef]
  43. Khanzada, K.A.; Rajput, M.A.; Shah, G.S.; Lodhi, A.M.; Mehboob, F. Effect of Seed Dressing Fungicides for the Control of Seedborne Mycoflora of Wheat. Asian J. Plant Sci. 2002, 1, 441–444. [Google Scholar] [CrossRef]
  44. Kenward, M.G.; Roger, J.H. An improved approximation to the precision of fixed effects from restricted maximum likelihood. Comput. Stat. Data Anal. 2009, 53, 2583–2595. [Google Scholar] [CrossRef]
  45. Westfall, P.; Tobias, R.D.; Wolfinger, R.D. Multiple Comparisons and Multiple Tests Using SAS, 2nd ed.; SAS Institute Inc.: North Carolina, NC, USA, 2011; ISBN 978-1-60764-783-6. [Google Scholar]
  46. Vanhat Tuomikirvaennusteet. Available online: https://portal.mtt.fi/portal/page/portal/kasper/pelto/peltopalvelut/tuomikirvaennuste/vanhattuomikirvaennusteet (accessed on 21 April 2020).
  47. Official Statistics of Finland (OSF): Feed Tables. Available online: https://portal.mtt.fi/portal/page/portal/Rehutaulukot/feed_tables_english (accessed on 26 November 2019).
  48. Official Statistics of Finland (OSF): Utilised Agricultural Area. Available online: https://stat.luke.fi/en/utilised-agricultural-area (accessed on 21 November 2019).
  49. Salonen, J.; Hyvönen, T.; Jalli, H. Composition of weed flora in spring cereals in Finland—A fourth survey. Agric. Food Sci. 2011, 20, 245–261. [Google Scholar] [CrossRef] [Green Version]
  50. Leather, S.R.; Lehti, J.P. Field studies on the factors affecting the population dynamics of the bird cherry-oat aphid, Rhopalosiphum Padi (L.) in Finland. Ann. Agric. Fenn. 1982, 21, 20–31. [Google Scholar]
  51. Di, H.J.; Cameron, K.C. Nitrate leaching in temperate agroecosystems: Sources, factors and mitigating strategies. Nutr. Cycl. Agroecosystems 2002, 46, 237–256. [Google Scholar] [CrossRef]
  52. Meisinger, J.J.; Delgado, J.A. Principles for managing nitrogen leaching. J. Soil Water Conserv. 2002, 57, 485–498. [Google Scholar]
  53. Uusitalo, R.; Närvänen, A.; Kaseva, A.; Launto-Tiuttu, A.; Heikkinen, J.; Joki-Hieskala, P.; Rasa, K.; Salo, T. Conversion of dissolved phosphorus in runoff by ferric sulfate to a form less available to algae: Field performance and cost assessment. AMBIO 2015, 44, 286–296. [Google Scholar] [CrossRef] [PubMed] [Green Version]
  54. Beaudoin, N.; Saad, J.K.; Van Laethem, C.; Machet, J.M.; Maucorps, J.; Mary, B. Nitrate leaching in intensive agriculture in Northern France: Effect of farming practices, soils and crop rotations. Agric. Ecosyst. Environ. 2005, 111, 292–310. [Google Scholar] [CrossRef]
  55. Bell, A.R.; Nalewaja, J.D. Competition of Wild Oat in Wheat and Barley. Weed Sci. 1968, 16, 505–508. [Google Scholar] [CrossRef]
  56. Bertholdsson, N.-O. Early vigour and allelopathy—two useful traits forenhanced barley and wheat competitiveness against weeds. Weed Res. 2005, 45, 94–102. [Google Scholar] [CrossRef]
  57. Hakala, K.; Jauhiainen, L.; Himanen, S.J.; Rötter, R.; Salo, T.; Kahiluoto, H. Sensitivity of barley varieties to weather in Finland. J. Agric. Sci. 2012, 150, 145–160. [Google Scholar] [CrossRef] [Green Version]
  58. Korres, N.E.; Froud-Williams, R.J. Effects of winter wheat cultivars and seed rate on the biological characteristics of naturally occurring weed flora. Weed Res. 2002, 42, 417–428. [Google Scholar] [CrossRef]
  59. Das, T.K.; Yaduraju, N.T. Effects of missing-row sowing supplemented with row spacing and nitrogen on weed competition and growth and yield of wheat. Crop Pasture Sci. 2011, 62, 48–57. [Google Scholar] [CrossRef]
  60. Qasem, J.R. Nutrient accumulation by weeds and their associated vegetable crops. J. Hortic. Sci. 1991, 67, 189–195. [Google Scholar] [CrossRef]
  61. Andreasen, C.; Litz, A.-S.; Streibig, J.C. Growth response of six weed species and spring barley (Hordeum vulgare) to increasing levels of nitrogen and phosphorus. Weed Res. 2006, 46, 503–512. [Google Scholar] [CrossRef]
  62. Lim, L.G.; Gaunt, R.E. The effect of powdery mildew (Erysiphe graminis f. sp. hordei) and leaf rust (Puccinia hordei) on spring barley in New Zealand. I. Epidemic development, green leaf area and yield. Plant Pathol. 1986, 35, 44–53. [Google Scholar] [CrossRef]
  63. Jayasena, K.W.; Van Burgel, A.; Tanaka, K.; Majewski, J.; Loughman, R. Yield reduction in barley in relation to spot-type net blotch. Australas. Plant Pathol. 2007, 36, 429–433. [Google Scholar] [CrossRef]
  64. Kieckhefer, R.W.; Kantack, B.H. Yield Losses in Winter Grains Caused by Cereal Aphids (Homoptera: Aphididae) in South Dakota. J. Econ. Entomol. 1988, 81, 317–321. [Google Scholar] [CrossRef]
  65. Official Statistics of Finland (OSF): Yield of the Main Crop. Available online: http://statdb.luke.fi/PXWeb/pxweb/en/LUKE/LUKE__02%20Maatalous__04%20Tuotanto__14%20Satotilasto/01_Viljelykasvien_sato.px/table/tableViewLayout1/?rxid=69c91bf6-f37a-4386-97bb-3c510b782811 (accessed on 21 April 2020).
  66. OECD-FAO Agricultural Outlook 2019-2028. Available online: https://stats.oecd.org/viewhtml.aspx?datasetcode=HIGH_AGLINK_2019&lang=en (accessed on 19 August 2020).
  67. Bingham, I.; Karley, A.; White, P.; Thomas, W.; Russell, J. Analysis of improvements in nitrogen use efficiency associated with 75 years of spring barley breeding. Eur. J. Agron. 2012, 42, 49–58. [Google Scholar] [CrossRef]
  68. Delin, S.; Nyberg, A.; Lindén, B.; Ferm, M.; Torstensson, G.; Lerenius, C.; Gruvaeus, I. Impact of crop protection on nitrogen utilisation and losses in winter wheat production. Eur. J. Agron. 2008, 28, 361–370. [Google Scholar] [CrossRef]
  69. Huusela-Veistola, E.; Jalli, M.; Ylivainio, K.; Turtola, E.; Lemola, R.; Ruuttunen, P. Kasvintuhoojilla Merkitystä Ravinnekuormituksessa- Verkkolaikkutartunta Vähentää Ohran Ravinteiden Ottoa. Available online: https://journal.fi/smst/article/view/75820/37204 (accessed on 10 February 2020).
  70. Bullock, D.G. Crop rotation. Crit. Rev. Plant Sci. 1992, 11, 309–326. [Google Scholar] [CrossRef]
  71. Bailey, K.L.; Gossen, B.D.; Lafond, G.P.; Watson, P.R.; Derksen, D.A. Effect of tillage and crop rotation on root and foliar diseases of wheat and pea in Saskatchewan from 1991 to 1998: Univariate and multivariate analyses. Can. J. Plant Sci. 2001, 81, 789–803. [Google Scholar] [CrossRef]
  72. Mamolos, A.P.; Kalburtji, K.L. Significance of Allelopathy in Crop Rotation. J. Crop Prod. 2001, 4, 197–218. [Google Scholar] [CrossRef]
  73. Hovmøller, M.S.; Henriksen, K.E. Application of pathogen surveys, disease nurseries and varietal resistance characteristics in an IPM approach for the control of wheat yellow rust. Eur. J. Plant Pathol. 2008, 121, 377–385. [Google Scholar] [CrossRef]
  74. Han, Y.; Wang, Y.; Bi, J.-L.; Yang, X.-Q.; Huang, Y.; Zhao, X.; Hu, Y.; Cai, Q.-N. Constitutive and induced activities of defense-related enzymes in aphid-resistant and aphid-susceptible cultivars of wheat. J. Chem. Ecol. 2009, 35, 176–182. [Google Scholar] [CrossRef] [PubMed]
  75. Andrew, I.K.S.; Storkey, J.; Sparkes, D.L. A review of the potential for competitive cereal cultivars as a tool in integrated weed management. Weed Res. 2015, 55, 239–248. [Google Scholar] [CrossRef] [PubMed]
  76. Andersen, A. Plant protection in spring cereal production with reduced tillage. II. Pests and beneficial insects. Crop Prot. 1999, 18, 651–657. [Google Scholar] [CrossRef]
  77. Bárberi, P.; Lo Cascio, B. Long-term tillage and crop rotation effects on weed seedbank size and composition. Weed Res. 2000, 41, 325–340. [Google Scholar] [CrossRef]
  78. Murphy, S.D.; Clements, D.R.; Belaoussoff, S.; Kevan, P.G.; Swanton, C.J. Promotion of weed species diversity and reduction of weed seedbanks with conservation tillage and crop rotation. Weed Sci. 2006, 54, 69–77. [Google Scholar] [CrossRef]
  79. Paulitz, T.C.; Schroeder, K.L.; Schillinger, W.F. Soilborne Pathogens of Cereals in an Irrigated Cropping System: Effects of Tillage, Residue Management, and Crop Rotation. Plant Dis. 2010, 94, 61–68. [Google Scholar] [CrossRef] [Green Version]
Figure 1. Flow chart of the analyses for different data.
Agronomy 11 00592 g001
Figure 2. Different growth zones (I–V), 60 degree latitude zone and trial sites in Finland. 1 = Inkoo, 2 = Jokioinen, 3 = Kaarina, 4 = Tikkurila, 5 = Nousiainen and 6 = Ylistaro.
Agronomy 11 00592 g002
Figure 3. The yield response (at 15% grain moisture content) of spring barley (blue) and spring wheat (red) in 1965–2012 in different biomass classes (1–5) of weeds. The ranges of the classes are shown in parenthesis. The class medians of weed biomasses were 52, 106, 214, 415 and 959 kg ha−1, respectively. Bars denote the 95% confidence interval for the means. The yield loss is calculated by subtracting the treated crop yield from the untreated crop yield.
Agronomy 11 00592 g003
Figure 4. The yield response (at 15% grain moisture content) in 1999–2016 of spring barley according to the allocated class (1–5) of total disease severity (%) for net blotch (red), scald (blue) and powdery mildew (yellow) at BBCH 73–77. The ranges of the classes are shown in parenthesis. Bars denote the 95% confidence interval for the means. The yield loss is calculated by subtracting the treated crop from the untreated crop.
Agronomy 11 00592 g004
Figure 5. The yield response (at 15% grain moisture content) in 1999–2016 of spring wheat by class of total disease severity (%) of leaf blotch diseases (red), powdery mildew (yellow) and leaf rust (blue) at BBCH 73–77. The ranges of the classes are shown in parenthesis. Bars denote the 95% confidence interval for the means. The yield loss is calculated by subtracting the treated crop from the untreated crop.
Agronomy 11 00592 g005
Figure 6. The yield response (at 15% grain moisture content) in 1999–2008 of spring barley, spring wheat and oat caused by different aphid-abundance classes of bird cherry-oat aphids (number plant−1). The ranges of the classes are shown in parenthesis. Bars denote the 95% confidence interval for the means. The yield loss is calculated by subtracting the treated crop from the untreated crop.
Agronomy 11 00592 g006
Table 1. The average annual median, minimum and maximum densities (plants m−2) and air-dry biomasses (g m−2) of the four most abundant weed species in untreated plots in 179 herbicide trials conducted between 1965 and 2012.
Weed SpeciesMedian, Plants m−2 (Min–Max)Median, g m−2 (Min–Max)
Stellaria media (L.)10 (0–999)0.60 (0–156.8)
Chenopodium album (L.)9 (0–1282) 0.80 (0–159.7)
Viola arvensis (L.)6 (0–510) 0.20 (0–48.0)
Galeopsis species (L.)6 (0–714) 1.10 (0–109.4)
Table 2. The estimated annual mean grain yield loss (kg ha−1, at 15% moisture content), N- and P-yield loss per hectare (kg N ha−1 and kg P ha−1) and N- and P-yield loss per whole spring cereal production area level (Mkg N and Mkg P) in 2019 in the absence of plant protection measures (seed treatment, weed and disease control).
Barley Yield Loss kg ha−1N-Yield Loss kg ha−1P-Yield Loss kg P ha−1N-Yield Loss Mkg N Production Area−1 *P-Yield Loss Mkg P Production Area−1 *
no seed treatment **3004.80.92.420.46
no herbicide treatment2003.20.61.610.31
no fungicide treatment5008.11.54.040.77
Wheat
no seed treatment ***3005.50.91.110.19
no herbicide treatment2003.70.60.730.13
no fungicide treatment5009.21.61.840.31
* annual barley production area 500,000 ha in 2019 annual wheat production area 200,000 ha in 2019 [48]; ** Rajala et al. [42]; *** Khanzada et al. [43].
Publisher’s Note: MDPI stays neutral with regard to jurisdictional claims in published maps and institutional affiliations.

