Article

NaCl- and Na2SO4-Induced Salinity Differentially Affect Clay Soil Chemical Properties and Yield Components of Two Rice Cultivars (Oryza sativa L.) in Burundi

by
Willy Irakoze
1,2,
Hermann Prodjinoto
1,
Séverin Nijimbere
2,
Jean Berchmans Bizimana
3,
Joseph Bigirimana
3,
Gervais Rufyikiri
4 and
Stanley Lutts
1,*
1
Groupe de Recherche en Physiologie Végétale–Earth and Life Institute–Agronomy (ELI-A), UCLouvain, 1348 Louvain-la-Neuve, Belgium
2
Faculté d’Agronomie et de Bio-Ingénierie, Université du Burundi, Bujumbura 999107, Burundi
3
International Rice Research Institute-Burundi, Bujumbura 999107, Burundi
4
Geneva Centre for Security Policy (GCSP), 1202 Geneva, Switzerland
*
Author to whom correspondence should be addressed.
Agronomy 2021, 11(3), 571; https://doi.org/10.3390/agronomy11030571
Submission received: 14 February 2021 / Revised: 14 March 2021 / Accepted: 16 March 2021 / Published: 18 March 2021
(This article belongs to the Section Soil and Plant Nutrition)

Abstract

:
Salinity may strongly influence the interaction between plant roots and surrounding soil, but this has been poorly studied for sodium sulfate (Na2SO4). The aim of this study was to investigate the effect of sodium chloride (NaCl) and Na2SO4 salinities on the soil chemical properties as well as rice physiological- and yield-related parameters of two contrasted cultivars (V14 (salt-sensitive) and Pokkali (salt-resistant)). Pot experiments were conducted using soil and electrolyte solutions, namely NaCl and Na2SO4, inducing two electrical conductivity levels (EC: 5 or 10 dS m−1) of the soil solutions. The control treatment was water with salt-free tap water. Our results showed that soil pH increased under Na2SO4 salinity, while soil EC increased as the level of saline stress increased. Salinity induced an increase in Na+ concentrations on solid soil complex and in soil solution. NaCl reduced the stomatal density in salt-sensitive cultivar. The total protein contents in rice grain were higher in V14 than in Pokkali cultivar. Saline stress significantly affected all yield-related parameters and NaCl was more toxic than Na2SO4 for most of the studied parameters. Pokkali exhibited a higher tolerance to saline stress than V14, whatever the considered type of salt. It is concluded that different types of salts differently influence soil properties and plant responses and that those differences partly depend on the salt-resistance level of the considered cultivar.

1. Introduction

World agriculture faces many challenges and must produce 70% more food for the growing population by 2050 [1], while the crop productivity does not increase along with the food demand. Reduced plant productivity is often attributed to various abiotic stresses, including the soil salinity, which affects more than 6% of the world’s land [2]. Approximately one-half of the total irrigated arable lands are adversely affected by salinity and this constraint leads to a great reduction in global agricultural production as irrigated soils contribute to roughly one third of the global food production [3,4]. In Burundi, more than 15% of the Rusizi plain area has been severely affected by salinity and 182 rice fields of about 0.5 ha each have been completely abandoned in this area [5], leading to a drastic reduction in rice production at the national level. Rice (Oryza sativa L.) is the main cereal food for the Burundian population and more than 50% of rice in Burundi is produced in the Rusizi plain [6].
According to Rengasamy [7], there are three major types of salinity based on soil and groundwater processes: (1) groundwater-associated salinity, (2) transient salinity and (3) irrigation-related salinity. These three types of soil salinization process are observed in the clay soils of the Rusizi lowland in Burundi. Nijimbere [5] showed that the primary source of the salt ions in Rusizi soils was related to the volcanism and hydrothermalism of its watershed, the widely dominant salt ions being sodium (Na+) among cations and sulfate (SO42−) among anions, unlike the largest salinized part in the world where the dominant anion remains Cl.
Abiotic stresses, including salinity, create reactive oxygen species (ROS) in plant cells that cause oxidative damage. The primary effects of salinity on plants are (1) the osmotic stress due to a water-deficit caused by increased concentration of salt in the medium and (2) ion-specific stress, leading to decrease in K+ content by altering the K+/Na+ ratio [8,9]. Ionic homeostasis, nonenzymatic and enzymatic antioxidants and capacity of efficient osmotic adjustment play a vital role to cope with salinity [10].
Components of the final rice grain yield are severely affected by root-zone salinity. Grain weight produced per plant, total number of spikelets per plant, spikelet fertility, mean 1000-grains weight, plant height, panicle length, tillers production and number of panicles per plant are, to some extent, significantly reduced by NaCl salinity [11,12]. Plant responses to Na2SO4 salinity received only minor attention, comparatively to NaCl. Our recent comparative study of NaCl and Na2SO4 effects on rice yield parameters revealed that sulfate salinity also reduced most of the aforementioned yield components, NaCl remaining, however, more toxic than Na2SO4 [13,14].
Salt resistance may be considered as the ability of plants to grow and complete their life cycle on a substrate containing high concentrations of soluble salt. For rice grown in salt conditions, the increase in total proteins content of the grains as well as the reduction in leaf stomatal density were considered as salinity stress-resistance markers [15,16,17,18]. To the best of our knowledge, no study compared the differential impact of NaCl and Na2SO4 on these precise parameters.
Most studies dealing with salinity effects on plant growth have been conducted in hydroponics or sand culture, which may be regarded as an oversimplification of real field conditions. Interactions between root-zone environments and plant responses to increased osmotic pressure or specific ion concentrations in the field are indeed complicated by many soil processes, such as soil water dynamics, soil structural stability, solubility of compounds in relation to pH and pE (electron concentration related to redox potential), nutrient and water movement in soil [19]. Salinity may cause dispersion of the soil particles in relation to flocculation processes resulting from the replacement of calcium and magnesium adsorbed on the soil exchange complex by sodium [20]. Furthermore, under field soil conditions, soil water content fluctuates and hence, the salt concentrations in the soil solution around roots also vary [21]. Conducting experiments in conditions close to field realities should allow to produce a new set of data in order to better understand the effects of the soil salinity on plants. Moreover, it is not well-established if cultivars exhibiting a high level of resistance to NaCl also exhibit a comparable high level of resistance to Na2SO4.
The aim of the present study was to compare the effect of NaCl and Na2SO4 on clay soil chemical properties in relation to rice physiological- and yield-related parameters in two cultivars exhibiting contrasting levels of salt resistance. For this purpose, we conducted pot experiments in a greenhouse using typical clay soil sampled in Rusizi lowlands (Burundi). The plants from two contrasted rice cultivars (V14: salt-sensitive and Pokkali: salt-resistant) were exposed to soil salinized with three different iso-strength Na+ nutrient solutions (electrical conductivity (EC): 0, 5 or 10 dS m−1) at the seedling stage, which is commonly considered as one of the most salt-sensitive development stages in Oryza sativa [19]. Salinity was maintained until harvest.

2. Materials and Methods

2.1. Soil

Non-salinized clay soil (EC of 0.17 dS m−1) collected from a vertisol surface layer (0–20 cm) in a farmer’s field in the Rusizi plain (29°19′–21′ E; 3°13′–15′ S) was used in this study. The soil was air-dried for two weeks, sieved passing through a 2 mm mesh and homogenized. Fertilizers to provide the equivalent of 75 kg N (CO(NH2)2), 30 kg P ((NH4)2HPO4) and 30 kg K (KCl) ha−1 were uniformly mixed in soil before filling the pots, as previously recommended for this soil [5]. Each pot (22 × 22 × 15 cm) contained 4 kg of fertilized soil.

2.2. Plant Material and Experimental Design

The experiment was conducted from November 2018 to April 2019 in a greenhouse of IRRI (International Rice Research Institute), Burundi. The temperature in the greenhouse with natural light varied between 25–30 °C (day time) and 20–25 °C (night time). Seeds of the rice cultivars Pokkali (salt-resistant) and V14 (salt-sensitive) were respectively obtained from IRRI and ISABU (Institut des Sciences Agronomiques du Burundi; Burundi). V14 was chosen as the most popular cultivar used in Burundi while Pokkali is a tall indica landrace commonly used as one of the most salt-tolerant rice cultivars [13,22]. Seeds were germinated on two layers of filter paper (Whatman N° 2) moistened with 10 mL half-strength Hoagland solution in a growth chamber at 28 °C under a 12 h daylight period. Ten-day-old seedlings of the two cultivars were transferred into the greenhouse. Four seedlings were transplanted into each pot and afterwards thinned to two plants per pot. Pots were watered to maintain a minimal value of 60% of field capacity.
After two weeks, the rice seedlings (3 leaves stage) growing on a substrate containing 18% water were subjected only once to saline irrigation treatments by using the saline solutions equivalent to 50 and 100 mM NaCl (EC: 5 and 10 dS m−1 NaCl) or 25 and 50 mM Na2SO4 (EC: 5 and 10 dS m−1 Na2SO4). Chemicals were obtained from Sigma-Aldrich (Overijse, Belgium). Salts were dissolved in tap water having an initial electrical conductivity of 0.06 dS m−1. 1400 mL of the saline solution was added to the soil, providing concentrations of 10 mmol NaCl/100 g soil (treatment Cl5d), 20 mmol NaCl/100 g soil (treatment Cl10d), 5 mmol Na2SO4/100 g soil (treatment S5d) and 10 mmol Na2SO4/100 g soil (treatment S10d). The control treatment was watered by salt-free tap water. Each treatment was replicated three times in a randomized complete block design, with each block containing 5 pots (10 plants) per treatment. Thereafter, irrigation was applied manually to approximately 80% of pot water-holding capacity using tap water. The first watering for stressed plants started one week after salt imposition when seedlings were at the 4 leaves stage.
The following growth- and yield-related parameters were measured: plant height, days to heading, panicle length, straw fresh weight, tillers number per plant, fertile tillers number per plant, number of grains per panicle, grains weight per plant, % solid grains per panicle and 1000-grains weight. We referred to the flowering tillers as fertile tillers. The panicle length, the grains number per panicle, the % filled grains per panicle and the 1000-grains weight were recorded on the main stem.

2.3. Soil Analysis

The analysis of soil electrical conductivity (EC), pH (H2O), exchangeable cations and cation exchange capacity (CEC) was performed on an uncultivated and unsalinized soil sample as well as in the soils recovered at the end of the complete life cycle of the rice plant (after the harvest of the rice grains).
Soil EC determined with an EC-meter and pH (H2O) were measured in a 1:5 soil/water suspension ratio with a shaking time of about 2 min (Seven MultiTM, METTLER TOLEDO, Greifensee, Switzerland).
Exchangeable cations and CEC were determined by the Metson method (extraction of cations by NH4-acetate 1 M, pH 7, washing excess extractant with ethanol, extraction of NH4+ by KCl 1 M) [23]. The content of the soil solution in soluble cations and anions was measured in a 1:2 soil/water suspension ratio. The suspensions were left to equilibrate for 12 h and then stirred for 15 min before switching to centrifugation at 10,000× g for 10 min. Decanted solutions were filtered on paper Whatman n° 41. Cations’ concentrations (Ca2+, Mg2+, Na+, K+) were quantified by the atomic emission spectrophotometry ICP-AES (Inductively Coupled Plasma Atomic Emission Spectrometry; CAP 6500 Thermo Scientific), while the non-carbonated anions’ (Cl, S) concentrations were quantified by high-performance liquid-phase ion chromatography (HPLC-Dionex ICS2000). Carbonate concentrations were determined by potentiometric titration [24].

2.4. Estimation of Plant Ion Content

Harvested shoots (leaf + stem) were cut in small pieces and homogenized before incubation in an oven at 70 °C. Twenty mg dry weight (DW) was digested with nitric acid (68%) at 80 °C. After complete evaporation, residues were dissolved with HNO3 (68%) + HClcc (1:3, v/v). The solution was filtered using a layer of Whatman filter paper (85 mm, Grade 1). The filtrate was used to determine the cations’ concentration (Na+ and K+) by flame emission using an Atomic Absorption Spectrometer (Thermo scientific S series model AAS4, Thermo Fisher Scientific, Waltham, MA, USA). Chloride was specifically extracted according to Hamrouni et al. [25]. Anions (S and Cl) were quantified by liquid chromatography (HPLC-Dionex ICS2000, Dionex Corporation, Sunnyvale, CA, USA).

2.5. Measurement of Stomatal Density and Stomatal Index

At the beginning of the maturity stage, the flag leaf was sampled and the abaxial epidermis was carefully cleared and smeared with nail varnish in the mid-area between the central vein and the leaf edge, for approximately 20 min. The thin film (approximately 5 × 15 mm) was peeled off from the leaf surface, mounted on a glass slide, immediately covered with a cover slip, and then lightly pressured with fine-point tweezers. Numbers of stomata and epidermal cells for each film strip were counted under a photomicroscope system (Euromex Microscope Holland; 400×). Impressions were taken from three flag leaves for each treatment. The leaf stomatal index was estimated using the formula: stomatal index = (number of stomata/(number of stomata + number of epidermal cells)) × 100%.

2.6. Total Grain Protein Content

Total protein of the harvested grains was determined by the Kjeldahl method. A Büchi Digestion System (Flawil, Switzerland) and Büchi Distillation unit (K-355) were used for the analysis: 1 g of finely ground rice grains was used in the Kjeldahl procedure. Samples were weighed and transferred into a Kjeldahl digestion flask containing 10 g of catalyst (prepared by mixing 9.65 g of K2SO4, 0.15 g of CuSO4 × 5H2O and 0.2 g of Se) and 25 mL of concentrated H2SO4. After 1.5 h of digestion in a unit with electrical fume removal and cooling to room temperature, 80 mL of NaOH base (mass fraction w = 0.33%) was added to each flask. By distillation, ammonium hydroxide was trapped as ammonium borate in a boric acid solution (mass concentration γ = 40 g.L−1) [5,6]. Total nitrogen was determined by titration with standardized HCl to a mixed indicator endpoint. The obtained nitrogen content was corrected for moisture content, and the total protein content was calculated by using the factor 6.25 [15].

2.7. Statistical Analysis

Statistical analyses were performed using JMP Pro 14 software. Data were treated by variance analysis and means were compared using Tukey’s Honest Significant Difference (HSD) all-pairwise comparisons at the p = 0.05 level as a post-hoc test. The graphs were plotted using SigmaPlot 10.0 software.

3. Results

3.1. Soil Chemical Properties

Table 1 shows that the soil pH significantly increased under sodium sulfate salinity comparatively to soil control by passing from near neutral (6.9) to alkaline values (8.2), while such an increase was not observed in response to the chloride salt treatments. The soil EC significantly increased with increment in the level of salt stress. At the end of the experiment, the soil EC values were almost 10 times lower than the EC values of the saline solution initially applied. For a given salt concentration in the initial solution, no difference was recorded for the final soil EC values between chloride and sulfate treatment.
The CEC parameter represents the total capacity of soil to hold exchangeable cations, which is part of the soil reservoir providing nutrient elements for plant growth. Compared to higher values reported for other vertisols [26], the soil taken from the Rusizi field had medium CEC values that correspond to low soil fertility [27]. In general, salt stress did not significantly impact the soil CEC, with the exception of a high level of Na2SO4 salinity (10 dS m−1) which significantly reduced the CEC values, although such a decrease was recorded for soils cultivated with Pokkali, only.
The exchangeable cations and water-soluble ion contents of the soils are presented in Table 2 and Table 3, respectively. The exchangeable Na+ and water-soluble Na+ contents significantly increased with increment in the level of salt stress and the highest values were recorded under sulfate stress. After converting the Na+ concentration in the soil solution from mmol L−1 to meq/100 g of soil (dilution ratio of 2 mL for 1 g of soil, which gives a conversion factor of 0.2), we observed that sodium ions were equally distributed in exchangeable forms and free ions in soil solutions. The exchangeable sodium percentage (ESP) (Table 2) and sodium adsorption ratio (SAR) (Table 3) parameters are conventionally used to determine the level of soil salinity and sodicity. Our results showed that both SAR and ESP values increased significantly in salt-treated soils and more particularly, in soils salinized by the high level of sulfate salinity. At the highest dose of NaCl, ESP values were significantly higher in soil cultivated with Pokkali, comparatively to V14. A similar difference between cultivars was recorded for SAR in response to high NaCl concentration.
Overall, the exchangeable K+ and water-soluble K+ contents were not impacted by the type or level of applied salt. The water-soluble Ca2+ and Mg2+ contents increased significantly as the level of salt stress applied increased, and to a similar extent in the two cultivars. As expected, the water-soluble chlorine and sulfate contents were respectively higher in NaCl- and Na2SO4-treated soils. The recorded increase in S was lower in V14 than in Pokkali at the highest dose of Na2SO4. The culture of plants in unsalinized soil (C, Table 3) increased the carbonate content, comparatively to non-cultured soil. Chloride treatment decreased carbonate content, with the minimal value being recorded for V14 exposed to Chl10d.

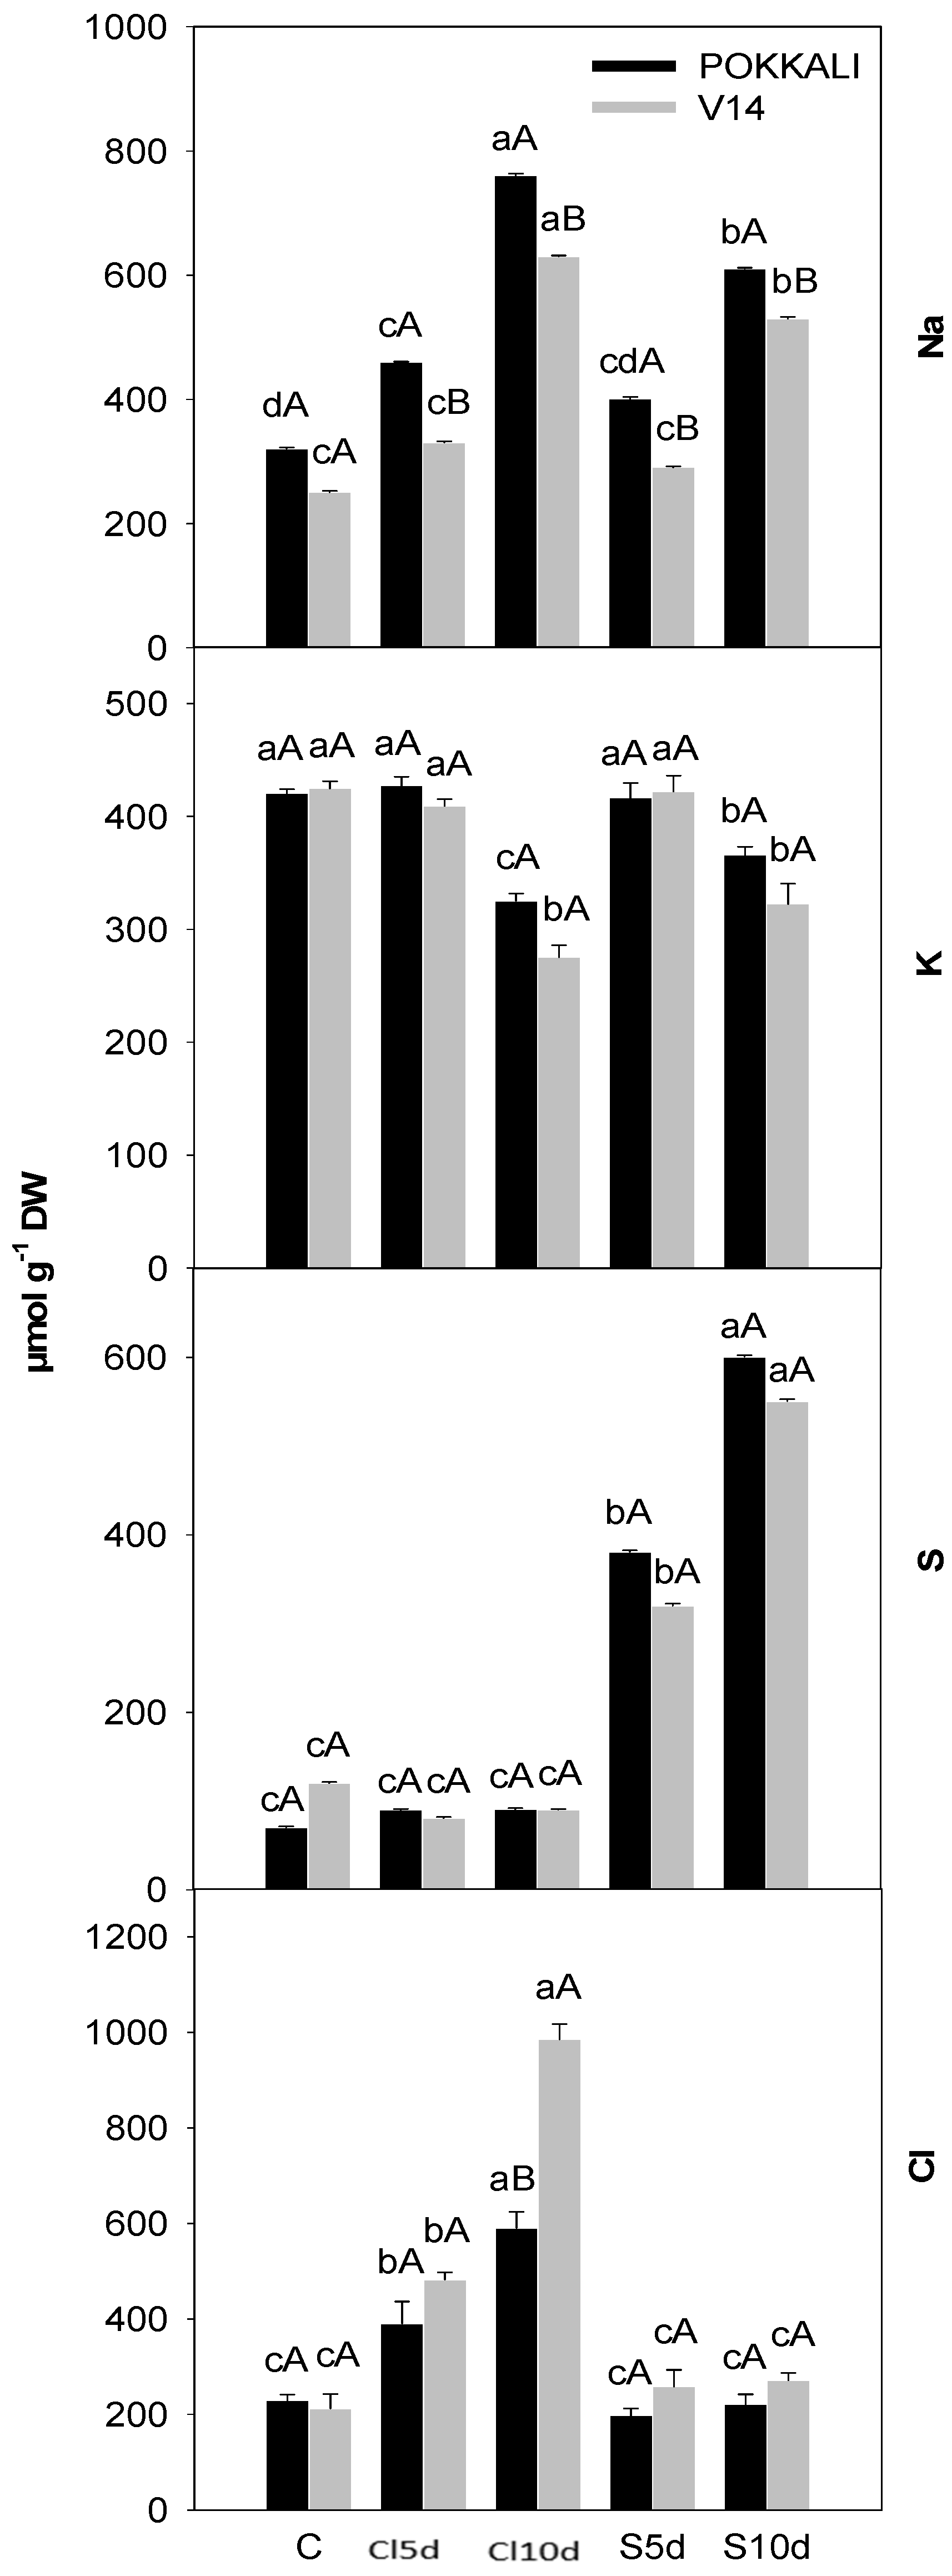
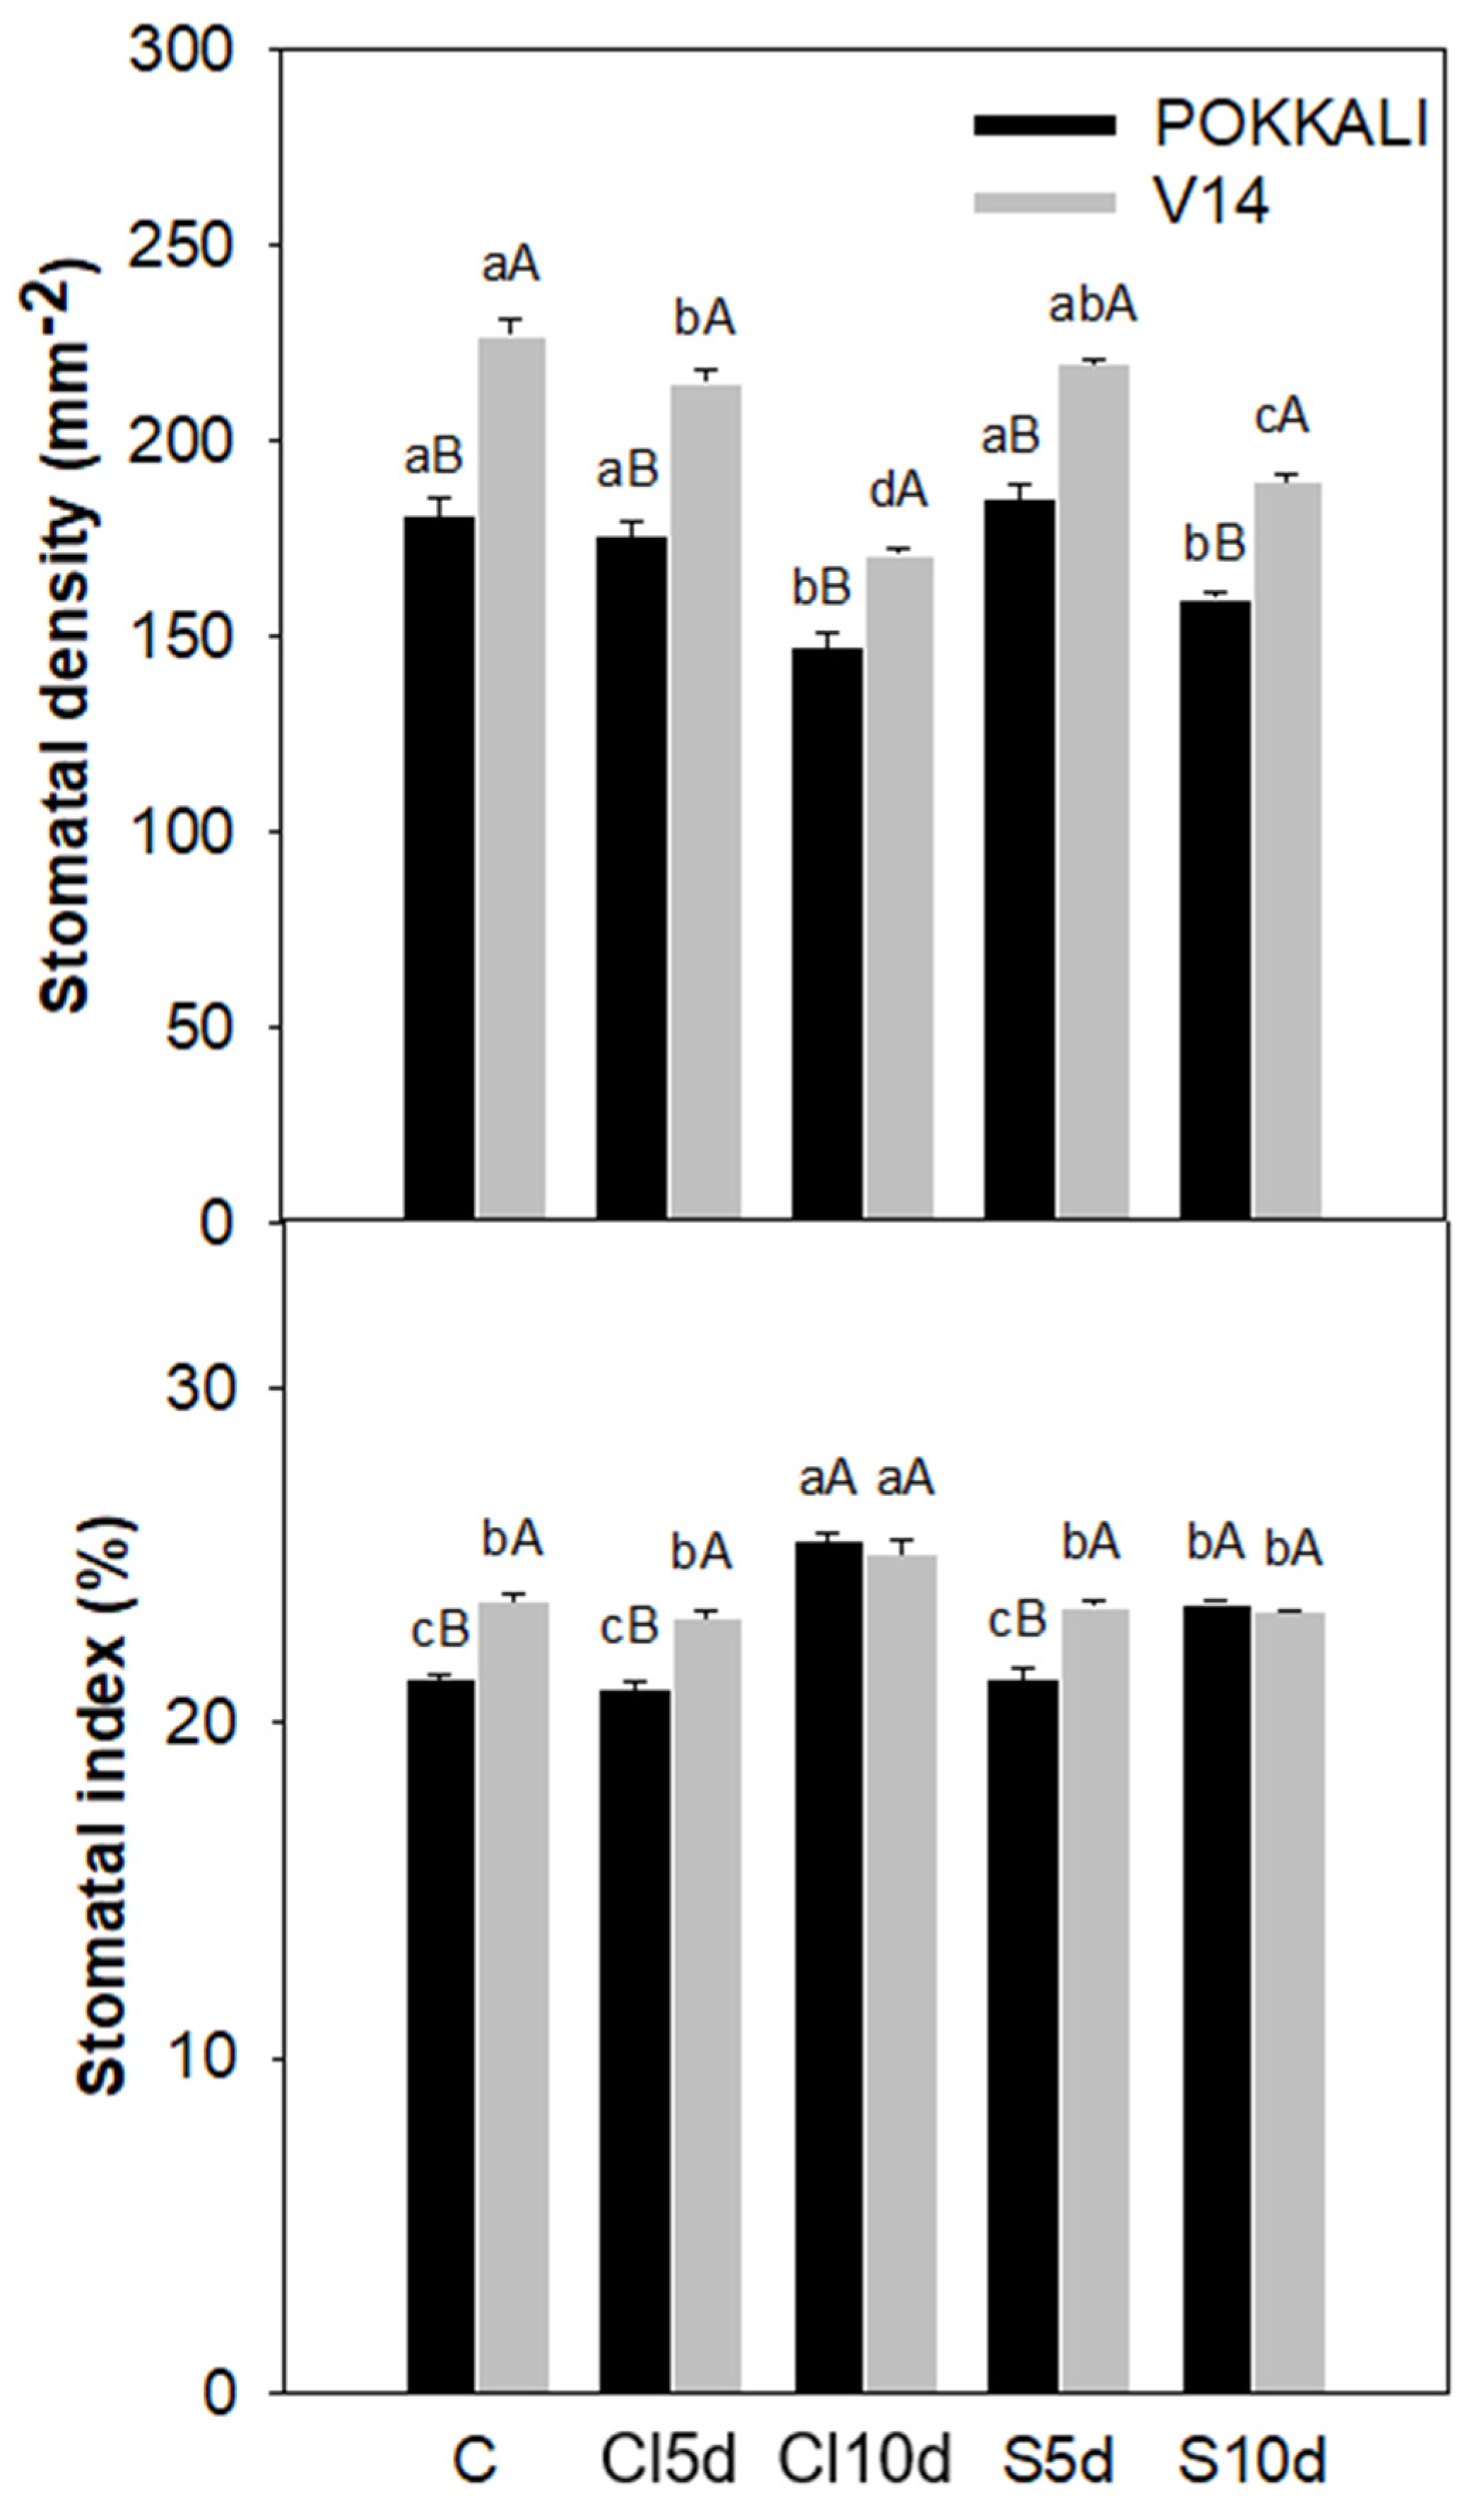
3.2. Physiological- and Yield-Related Parameters

During the time-course of the experiment, all plants remained alive and set seeds, whatever the cultivar or the salt treatment. The two types of salinity induced a significant increase in shoot Na+ content and Na+ accumulation was obviously higher in plants exposed to NaCl salinity than in those exposed to Na2SO4 at the highest salinity level (Figure 1). Sodium accumulation was higher in Pokkali than in V14. The high level (10 dS m−1) of NaCl or Na2SO4 salinity significantly decreased K+ concentration in shoot, comparatively to control plants, but no difference between cultivars was recorded. As expected, sulfur and chloride highly accumulated in Na2SO4- and NaCl-treated plants, respectively. Cl accumulation was significantly higher in V14 than in Pokkali cultivar at the highest level of NaCl stress (10 dS m−1), while no difference between cultivars (cvs) was recorded for S concentration in Na2SO4-treated plants.
In the absence of salt, stomatal density was significantly lower in Pokkali than in V14 (Figure 2). NaCl and Na2SO4 salinities induced a decrease in the stomatal density, but only at the high level of salt stress for Pokkali. For the V14 cultivar, stomatal density decreased as the salt stress level increased. In addition, for this salt-sensitive cultivar, the recorded decrease in leaf stomatal density was higher under the high level of chloride than sulfate stress. The high level of NaCl salinity significantly increased the leaf stomatal index for both salt-sensitive and salt-tolerant cultivars. For Na2SO4 treatment, a slight increase of the leaf stomatal index was observed only for Pokkali at the highest dose.
Total protein contents of rice grains are provided in Figure 3. The highest level of chloride stress significantly increased the total grain protein in both cultivars, and the value recorded for V14 was higher than for Pokkali. As far as Na2SO4 is concerned, the recorded increase was significant for V14 only.
The two considered cultivars displayed contrasting properties in the absence of salt for yield-related parameters (Table 4): Pokkali exhibited a higher plant height, panicle length, straw fresh weight per plant and grain number per panicle than V14, while an opposite trend was recorded for tillers number per plant and number of panicles per plant. In contrast, the number of days to heading, the 1000-grains weight and the grain yield per plant were similar for the two considered cultivars. Most yield-related parameters were affected by salinity. Considering the two rice cultivars, the deleterious impact of NaCl was higher than the impact of Na2SO4 for the mean number of tillers and number of panicles per plant, grains number and filled grains percentage per panicle, grain yield and straw fresh weight per plant. The differences between the two types of salinity were more marked for high doses than for low ones. Pokkali was more resistant than V14 for most parameters, like plant height, grains number and filled grains percentage per panicle, 1000-grains weight, grain yield and straw fresh weight per plant. The number of days to heading was reduced by the high level of NaCl and Na2SO4 in all cultivars. Overall, a more deleterious effect was recorded under the high level of salt stress, while a moderate level showed an intermediate behavior.

4. Discussion

Salt stress significantly affected the soil chemical properties as well as physiological- and yield-related parameters in rice, but these effects depend on the cultivar and the type of salinity.

4.1. Soil Properties

The significant effects of salinity on soil chemical properties occurred especially for the exchangeable and soluble Na+ ion and for the soil pH. The application of salt resulted in increased saturation of sodium on exchangeable sites, and the conditions akin to sodic soils (EC < 4 dS m−1, ESP > 15%, except that the pH was <8.5) were observed in some salt-treated soils. Although the effects of soluble salts and exchangeable sodium are currently known, the sensitivity thresholds remain questionable [28,29]. Regarding the harmful effect of exchangeable sodium on the soil structure, the 15% threshold is considered to be the critical level characterizing the structural instability of the soil [30]. However, some studies showed that this threshold is variable according to soil parameters such as the soil texture, the clay mineralogy as well as the content and the nature of the organic compounds [31,32]. McIntyre [33] considered a threshold of 5% exchangeable sodium to define a sodic soil, while Saidi et al. [34] found that the acceptable threshold values of SAR and ESP necessary to maintain a stable structure are respectively 2% and 5%.
The increase of soil pH was observed only under sulfate salt treatment. This could be explained by the adsorption of SO42− anions onto soil particles and the subsequent release of OH desorbed in the soil. Previous studies had shown that the sulfate anion could be adsorbed in several types of soil [35,36,37,38]. Knowing that only the soil pH between 5.5 and 6.5 are suitable for rice culture, the pH values between 7.3 and 8.2 resulting from soil salinization might be regarded as detrimental for plant growth and development. It has been proven that the high soil pH values negatively affect the plant through the ion imbalance of soil solution due to low solubility and high adsorption of some nutrients, like N, P, K, Ca, Cu, Zn, Fe and Mn [39,40].
As expected, the soil EC increased significantly as the level of applied salinity increased. Unlike the hydroponic set experiment where the electrical conductivity of the culture solution remained stable [41,42], the soil solution EC values at the end of our experiment were almost 10 times lower than the EC values of saline solution initially applied. The high reduction of the soil solution EC could be related to the gradual migration of salt ions in plants and to the solid soil complex. Mizanur and Roxana [43] applied a saline solution of 13 dS m−1 NaCl in the soil and recorded only an EC of 2 dS m−1 at the end of the experiment. Under field conditions in the Rusizi plain, an EC as low as 1 dS m−1 highly decreased the rice yield and the growth of the rice plant was completely hindered at 2.96 dS m−1 [5]. The accumulation of salt ions in the soil solution and on the solid soil complex are largely responsible for the degradation of soil structure as well as osmotic stress, nutritional imbalance and ion toxicity, limiting plant production [44]. According to Naher et al. [45], the attractive forces which bind clay particles together are disrupted when too many sodium ions get between the clay particles and the soil eventually disperses. The sodium-induced dispersion causes the reduction in air and water infiltration and reduces hydraulic conductivity.
In addition to sodium accumulation, we also observed a high concentration of chloride and sulfur in soil salinized by NaCl and Na2SO4, respectively. Previous studies highlighted the deleterious effects of Cl and SO42− accumulation on the soil structure [5,44]. We observed a high concentration of Ca2+ and Mg2+ ions on the exchange complex in contrast to the Na+, which highly accumulated in the soil solution. This observation could be explained by the high binding capacity of divalent cations on exchangeable sites compared to the monovalent cations.
The root system may also influence surrounding soil properties during plant culture. The present study demonstrates that long-term interaction between soil and plant roots may vary depending the level of salt-resistance of the considered cultivar since the salt-resistant Pokkali reduced CEC in the presence of high Na2SO4 and increased ESP and SAR in the presence of high NaCl, while chloride treatment decreased carbonate content mainly in soil cultivated with the sensitive V14. This novel information could lead to interesting additional research.

4.2. Plant Properties

The sodium ion accumulation was higher in NaCl- than in Na2SO4-treated shoots (Figure 1), and this observation suggests that Na+ uptake is influenced by the nature of anion excess present in the soil solution. The higher accumulation of Na+ in Pokkali confirms its ability to tolerate salt stress during the whole cycle. The mechanism for managing excess accumulated sodium could be related to Na+-sequestration in the vacuole, but also, at the whole plant level to accumulation of Na+ in the oldest leaves, which exhibit the lowest photosynthetic rate in mature plants, thus preserving the youngest leaves contributing to grain filling [46]. It might be postulated that a higher accumulation of Na+ in plant tissues is related to a faster accumulation of Cl and regarded as an attempt to maintain electroneutrality. This explanation, however, is not valid in the present case since Cl accumulation was higher in V14 than in Pokkali.
Chloride toxicity received less attention than Na+ toxicity in physiological studies devoted to salt stress, but recent data clearly demonstrate that Cl excess induces a wide range of physiological disorders in non-halophyte [47]. Jeschke and Pate [48] also showed that Cl, unlike Na+, was not substantially retained in the root of Ricinus communis L, but deposited more or less uniformly in stem, petiole and leaf lamina tissues. Studying the effects of chloride versus sulfate anions on nutrient-ion absorption by several plant species, Kretschmer et al. [49] showed higher concentration of Cl than SO42− in shoots, and according to Gauch and Wadleigh [50], the anionic imbalance observed could be explained by the low mobility of SO42−. Chloride fluxes were reported to play an important role in pollen tube elongation: although this question is still a matter of debate [51], a high chloride content in reproductive organs of V14 exposed to the highest dose of NaCl might explain the very low percentage of solid grain recorded per panicle in these plants (Table 4).
Stomatal density in the flag leaf was higher in V14 (sensitive cultivar) than in Pokkali (resistant cultivar) for all treatments (Figure 2). According to Yunita et al. [18], a lower density of stomata on the leaves is related to salt resistance and this fits with our observation. Stomatal density was analyzed in flag leaves, which are major contributors to grain filling, and this could be considered as an attempt to limit transpiration fluxes of toxic ions in this crucial photosynthetically active organ. Previous studies on rice showed that a change in stomatal density depended on rice cultivar as well as the type and level of stress applied [18,52,53,54]. Ouyang et al. [16] found that the receptor-like kinase OsSIK1 improved the salt stress tolerance in rice (Oryza sativa L.) plants by regulating the stomatal density in the abaxial and adaxial leaf epidermis. Studying the responses of the tomato plants to exposure to different salt forms and rates, Yokas et al. [55] showed the strong reduction of stomatal density in NaCl-treated plants compared to those in Na2SO4- and CaCl2-treated plants. Differences in stomatal density can result from either a general effect on non-stomatal epidermal cell density or a specific reduction in stomatal development [56]. We therefore calculated the stomatal index. Plants treated by the high level of salinity exhibited a higher stomatal index compared to control plants, revealing that the high salt stress changes the proportion of epidermal cells that differentiate into stomata.
Although starch is the main grain reserve in rice, accumulating up to 50−90% of dry weight, protein usually contributes 5−12% to the total [57]. Our results showed that salinity stress significantly increased the total proteins content in rice grains (Figure 3). Baxter et al. [15] found that the NaCl treatment resulted in significantly higher protein contents in the milled rice, and according to the authors, the increase in protein content was mainly attributed to increase of glutelin, with lower contributions from albumin. Similarly, the study on rice (Oryza sativa L.) cv. Nipponbare response to salinity stress also proved that rice grain proteins were increased by NaCl stress, with a major contribution from glutelin and prolamin [58]. The increase in protein content in rice grown under saline conditions could be related to rice plant response to salinity stress, since Ramani and Apte [17] found that salinity stress induced the synthesis of around 40 polypeptides previously shown to be associated with stress in rice. Under high levels of salt stress, the total protein content was higher in V14 than in Pokkali. Only poor differences were recorded between NaCl and Na2SO4 for the grain protein content, which contrasts with the data provided by Wu et al. [59], who mentioned in the halophyte quinoa a higher grain protein content for plants exposed to Na2SO4 than for those exposed to NaCl. It might be argued that if the salt-induced decrease in seed set is more important than the decrease in sugar and amino acid translocation to the grain, a higher amount of these organic compounds could be available per sink organ. This explanation is probably not valid in the present case since we recorded a significant decrease in 1000-grains weight in stressed plants, suggesting that a higher protein content must be regarded as a specific impact of salt on protein metabolism during grain filling.
Salinity significantly affected most yield-related parameters measured in this study (Table 4). NaCl was more toxic than Na2SO4 for most of the studied parameters, while Pokkali exhibited a higher resistance to salt stress than V14. Similar results were observed in our hydroponic experiment, where the yield components of salt-sensitive I Kong Pao cultivar were more affected by NaCl than Na2SO4 salinity [13]. Other studies conducted on different rice cultivars grown in hydroponics or soil conditions also showed the detrimental effect of salinity stress on yield-related parameters [11,12,60,61]. Salinity stress significantly reduced the 1000-grains weight in Pokkali as well as in V14 cultivar. According to Abdullah et al. [62], the reduction in seed set is mainly due to reduced translocation of soluble carbohydrates to primary and secondary spikelets, accumulation of more sodium and less potassium in all rice floral parts and inhibition of the specific activity of starch synthetase in developing rice grains. Unlike previous studies that showed the effect of NaCl on plant flowering delay heading [22,63,64], our results revealed the significant effect of salinity on the heading time shortening in V14, which could be related to a strategy of this specific cultivar to avoid the deleterious consequence of a long-term exposure to stress conditions.

5. Conclusions

It is concluded that NaCl was more detrimental to rice growth and yield than Na2SO4. Sulfate salinity induced an increase in the soil pH in relation to OH desorption, while chloride salinity decreased the carbonate content. Sodium ions were equally distributed between exchangeable form and free ions in soil solution for the two types of salinity. The salt-resistant cultivar Pokkali accumulated higher amounts of Na+ and lower concentrations of Cl in the shoot part than the salt-sensitive cultivar V14. A decrease in stomatal density may be regarded as an attempt to limit translocation of toxic ions to the flag leaf. The salt-resistant cultivar Pokkali and the salt-sensitive V14 have different impacts on soil chemical properties in the presence of NaCl and Na2SO4: the physiological analysis of the root system thus appears as a priority to decipher the complex interactions between specific ion toxicity, soil properties and plant response to salinity.

Author Contributions

Conceptualization, W.I., S.N., J.B., and J.B.B.; investigation, W.I. and H.P.; formal analysis, W.I., J.B. and J.B.B.; writing original draft, W.I. and S.L., writing—review and editing, S.L., supervision, G.R., S.N. and S.L.; project administration, G.R. and S.L. All authors have read and agreed to the published version of the manuscript.

Funding

This research received no external funding.

Institutional Review Board Statement

Not applicable.

Informed Consent Statement

Not applicable.

Data Availability Statement

Data available on request to the corresponding author.

Acknowledgments

The authors are very grateful to the UCLouvain (Conseil de l’Action Internationale) for the doctoral grant of W. Irakoze and to the Burundian authorities for efficient administrative support.

Conflicts of Interest

The authors declare that there are no conflicts of interest.

References

  1. FAO. How to Feed the World in 2050. Available online: http://www.fao.org/fileadmin/templates/wsfs/docs/expert_paper/How_to_Feed_the_World_in_2050.pdf (accessed on 28 November 2019).
  2. Parihar, P.; Singh, S.; Singh, R.; Singh, V.P.; Prasad, S.M. Effect of salinity stress on plants and its tolerance strategies: A review. Environ. Sci. Pol. Res. 2015, 22, 4056–4075. [Google Scholar] [CrossRef]
  3. Munns, R. Comparative physiology of salt and water stress. Plant Cell. Environ. 2002, 25, 239–250. [Google Scholar] [CrossRef] [PubMed]
  4. Munns, R.; Tester, M. Mechanisms of salinity tolerance. Annu. Rev. Plant Biol. 2008, 59, 651–681. [Google Scholar] [CrossRef] [Green Version]
  5. Nijimbere, S. Physico-Chimie de Sols Rizicultivés Affectés par la Salinité Dans la Basse Vallée de la Rusizi au Burundi [Physico-Chemistry of Salinity-Affected Rice Soils in Burundi’s Lower Rusizi Valley]; Thèse Présentée en vue de L’obtention du Grade de Docteur en Sciences Agronomiques et Ingénierie Biologique; UCLouvain: Ottignies-Louvain-la-Neuve, Belgium, 2014. [Google Scholar]
  6. Gahiro, L. Compétitivité des Filières Rizicoles Burundaises: Le riz de l’Imbo et le riz des Marais [Competitiveness of Burundian Rice Fields: Imbo Rice and Marsh Rice]; Thèse Présentée en vue de L’obtention du Grade de Docteur en Socio-économie Rurale; Université de Liège: Liège, Belgium, 2011. [Google Scholar]
  7. Rengasamy, P. World salinization with emphasis on Australia. J. Exp. Bot. 2006, 57, 1017–1023. [Google Scholar] [CrossRef] [PubMed] [Green Version]
  8. Sarker, U.; Oba, S. The response of salinity stress-induced A. tricolor to growth, anatomy, physiology, non-enzymatic and enzymatic antioxidants. Front. Plant Sci. 2020, 11, 559876. [Google Scholar] [CrossRef]
  9. Sarker, U.; Oba, S. Augmentation of leaf color parameters, pigments, vitamins, phenolic acids, flavonoids and antioxidant activity in selected Amaranthus tricolor under salinity stress. Sci. Rep. 2018, 8, 12349. [Google Scholar] [CrossRef] [Green Version]
  10. Sarker, U.; Oba, S. Catalase, superoxide dismutase and ascorbate-glutathione cycle enzymes confer drought tolerance of Amaranthus tricolor. Sci. Rep. 2018, 8, 16496. [Google Scholar] [CrossRef] [PubMed] [Green Version]
  11. Ndayiragije, A.; Lutts, S. Long term exogenous putrescine application improves grain yield of a salt-sensitive rice cultivar exposed to NaCl. Plant Soil 2007, 29, 225–238. [Google Scholar] [CrossRef]
  12. Zhu, G.; Kinet, J.; Lutts, S. Characterisation of rice (Oryza sativa) F3 populations selected for salt resistance. 2. Relationships between yield-related parameters and physiological properties. Austral. J. Exp. Agric. 2004, 44, 333–342. [Google Scholar] [CrossRef]
  13. Irakoze, W.; Prodjinoto, H.; Nijimbere, S.; Rufyikiri, G.; Lutts, S. NaCl and Na2SO4 salinities have different impact on photosynthesis and yield-related parameters in Rice (Oryza sativa L.). Agronomy 2020, 10, 864. [Google Scholar] [CrossRef]
  14. Irakoze, W.; Vanpee, B.; Rufyikiri, G.; Dailly, H.; Nijimbere, S.; Lutts, S. Comparative effects of chloride and sulfate salinities on two contrasting rice cultivars (Oryza sativa L.) at the seedling stage. J. Plant. Nut. 2019, 42, 1001–1015. [Google Scholar] [CrossRef]
  15. Baxter, G.; Zhao, J.; Blanchard, C. Salinity alters the protein composition of rice endosperm and the physicochemical properties of rice flour. J. Sci. Food Agric. 2011, 91, 2292–2297. [Google Scholar] [CrossRef] [PubMed]
  16. Ouyang, S.Q.; Liu, Y.F.; Liu, P.; Lei, G.; He, S.J.; Ma, B.; Zhang, W.K.; Zhang, J.S.; Chen, S.Y. Receptor-like kinase OsSIK1 improves drought and salt stress tolerance in rice (Oryza sativa) plants. Plant J. 2010, 62, 316–329. [Google Scholar] [CrossRef] [PubMed]
  17. Ramani, S.; Apte, S.K. Transient expression of multiple genes in salinity-stressed young seedlings of rice (Oryza sativa L.) cv. Bura Rata. Biochem. Biophys. Res. Commun. 1997, 233, 663–667. [Google Scholar] [CrossRef] [PubMed]
  18. Yunita, R.; Khumaida, N.; Sopandie, D.; Marisha, I. Somaclonal putative mutants of rice tolerant to salinity. Indon. J. Agric. Sci. 2018, 19, 67–74. [Google Scholar] [CrossRef]
  19. Rengasamy, P. Soil processes affecting crop production in salt-affected soils. Funct. Plant Biol. 2010, 37, 613–620. [Google Scholar] [CrossRef]
  20. Machado, R.M.A.; Serralheiro, R.P. Soil salinity: Effect on vegetable crop growth. Management practices to prevent and mitigate soil salinization. Horticulture 2017, 3, 30. [Google Scholar] [CrossRef]
  21. Rengasamy, P.; Chittleborough, D.; Helyar, K. Root-zone constraints and plant-based solutions for dryland salinity. Plant Soil 2003, 257, 249–260. [Google Scholar] [CrossRef]
  22. Lutts, S.; Kinet, J.; Bouharmont, J. Changes in plant response to NaCl during development of rice (Oryza sativa L.) varieties differing in salinity resistance. J. Exp. Bot. 1995, 46, 1843–1852. [Google Scholar] [CrossRef]
  23. Cieleski, H.; Sterckeman, T.A. Comparison between three methods for the determination of cation exchange capacity and exchangeable cations in soils. Agronomie 1997, 17, 9–16. [Google Scholar] [CrossRef] [Green Version]
  24. Rodier, J. L’Analyse de l’eau: Eaux Naturelles, Eaux Résiduaires, Eau de Mer, 8th ed.; Dunod: Malakoff, France, 2005; p. 1381. [Google Scholar]
  25. Hamrouni, L.; Hanana, M.; Abdelly, C.; Ghorbel, A. Exclusion du chlorure et inclusion du sodium: Deux mécanismes concomitants de tolérance à la salinité chez la vigne sauvage Vitis vinifera subsp. sylvestris (var.‘Séjnène’) [Exclusion of chloride and inclusion of sodium: Two concomitant mechanisms of salinity tolerance in wild vine Vitis vinifera subsp. sylvestris (var.‘Sejnène’)]. Biotech. Agron. Soc. Environ. 2011, 15, 387–400. [Google Scholar]
  26. Hazelton, P.; Murphy, B. Interpreting Soil Test Results: What Do All the Numbers Mean? CSIRO Publishing: Clayton South, VIC, Australia, 2016; p. 185. [Google Scholar]
  27. HillLab. Cation Exchange Capacity & Base Saturation. Available online: https://www.hill-laboratories.com/assets/Documents/Technical-Notes/Agriculture/CATION-EXCHANGE-CAPACITY-BASE-SATURATION.pdf (accessed on 28 November 2019).
  28. Skaggs, T.H.; Arya, L.M.; Shouse, P.J.; Mohanty, B.P. Estimating particle-size distribution from limited soil texture data. Soil Sci. Soc. Am. J. 2001, 65, 1038–1044. [Google Scholar] [CrossRef]
  29. Suarez, D.L. Sodic soil reclamation: Modelling and field study. Soil Res. 2001, 39, 1225–1246. [Google Scholar] [CrossRef]
  30. Richards, L.A. Diagnosis and improvement of saline and alkali soils. Soil Sci. 1954, 78, 54. [Google Scholar] [CrossRef]
  31. Lebron, I.; Suarez, D.; Yoshida, T. Gypsum effect on the aggregate size and geometry of three sodic soils under reclamation. Soil Sci. Soc. Am. J. 2002, 66, 92–98. [Google Scholar] [CrossRef]
  32. Shainberg, I.; Letey, J. Response of soils to sodic and saline conditions. Hilgardia 1984, 52, 1–57. [Google Scholar] [CrossRef] [Green Version]
  33. McIntyre, D. Exchangeable sodium, subplasticity and hydraulic conductivity of some Australian soils. Soil Res. 1979, 17, 115–120. [Google Scholar] [CrossRef]
  34. Saidi, D.; Le Bissonnais, Y.; Duval, O.; Daoud, Y.; Halitim, A. Effet du sodium échangeable et de la concentration saline sur les propriétés physiques des sols de la plaine du Cheliff (Algérie) [Effect of exchangeable sodium and saline concentration on the physical properties of the soils of the Cheliff plain (Algeria)]. Etud. Gest. Sols. 2004, 11, 137–148. [Google Scholar]
  35. Alves, M.; Lavorenti, A. Sulfate adsorption and its relationships with properties of representative soils of the São Paulo State, Brazil. Geoderma 2004, 118, 89–99. [Google Scholar] [CrossRef]
  36. Bolan, N.; Syers, J.; Tillman, R. Ionic strength effects on surface charge and adsorption of phosphate and sulphate by soils. J. Soil Sci. 1986, 37, 379–388. [Google Scholar] [CrossRef]
  37. Kitadai, N.; Nishiuchi, K.; Tanaka, M. A comprehensive predictive model for sulfate adsorption on oxide minerals. Geochim. Cosmochim. Acta 2018, 238, 150–168. [Google Scholar] [CrossRef]
  38. Sokolova, T.; Alekseeva, S. Adsorption of sulfate ions by soils (a review). Euras. Soil Sci. 2008, 41, 140–148. [Google Scholar] [CrossRef]
  39. Marlet, S.; Job, J.O. Processus et Gestion de la Salinité des Sols [Soil Salinity Process and Management], 1st ed.; Tec & Doc—Lavoisier: Paris, France, 2006; pp. 797–822. Available online: http://www.documentation.ird.fr/hor/fdi:010067448 (accessed on 14 April 2019).
  40. Qadir, M.; Noble, A.D.; Schubert, S.; Thomas, R.J.; Arslan, A. Sodicity-induced land degradation and its sustainable management: Problems and prospects. Land Degrad. Dev. 2006, 17, 661–676. [Google Scholar] [CrossRef]
  41. Rengasamy, P. Osmotic and ionic effects of various electrolytes on the growth of wheat. Soil Res. 2010, 48, 120–124. [Google Scholar] [CrossRef]
  42. Almansouri, M.; Kinet, J.M.; Lutts, S. Compared effects of sudden and progressive impositions of salt stress in three durum wheat (Triticum durum Desf.) cultivars. J. Plant Physiol. 1999, 154, 743–752. [Google Scholar] [CrossRef]
  43. Mizanur, R.B.; Roxana, A. Effect of Salinity on Physical and Chemical Properties of Soils of Khulna Region; Khulna University: Khulna, Bangladesh, 2005; 17p. [Google Scholar]
  44. Li, M.; Chai, S.; Du, H.; Wang, C. Effect of chlorine salt on the physical and mechanical properties of inshore saline soil treated with lime. Soils Found. 2016, 56, 327–335. [Google Scholar] [CrossRef]
  45. Naher, N.; Uddin, M.K.; Alam, A. Impacts of salinity on soil properties of coastal areas in Bangladesh. J. Agric. Sci. 2011, 33, 161–173. [Google Scholar] [CrossRef]
  46. Lutts, S.; Bouharmont, J.; Kinet, J.M. Physiological characterisation of salt-resistant rice (Oryza sativa) somaclones. Aust. J. Bot. 1999, 47, 835–849. [Google Scholar] [CrossRef]
  47. Wu, H.; Li, Z. The Importance of Cl- exclusion and vacuolar Cl sequestration: Revisiting the role of Cl transport in plant salt tolerance. Front. Plant Sci. 2019, 10. [Google Scholar] [CrossRef]
  48. Jeschke, W.D.; Pate, J.S. Cation and chloride partitioning through xylem and phloem within the whole plant of Ricinus communis L. under conditions of salt stress. J. Exp. Bot. 1991, 42, 1105–1116. [Google Scholar] [CrossRef]
  49. Kretschmer, A.; Toth, S.; Bear, F. Effect of chloride versus sulfate ions on nutrient-ion absorption by plants. Soil Sci. 1953, 76, 193–200. [Google Scholar] [CrossRef]
  50. Gauch, H.G.; Wadleigh, C.H. Effect of high concentrations of sodium, calcium, chloride, and sulfate on ionic absorption by bean plants. Soil Sci. 1945, 59, 139–155. [Google Scholar] [CrossRef]
  51. Messerli, M.A.; Smith, P.J.S.; Lewis, R.C.; Robinson, K.R. Chloride fluxes in lily pollen tubes: A critical reevaluation. Plant J. 2004, 40, 799–812. [Google Scholar] [CrossRef] [PubMed] [Green Version]
  52. Bahaji, A.; Mateu, I.; Sanz, A.; Cornejo, M.J. Common and distinctive responses of rice seedlings to saline-and osmotically-generated stress. Plant Growth Regul. 2002, 38, 83–94. [Google Scholar] [CrossRef]
  53. Lestari, E.G. The relation between stomata index and drought resistant at rice somaclones of Gajahmungkur, Towuti, and IR 64. Biodivers. J. Biol. Divers. 2006, 7, 44–48. [Google Scholar] [CrossRef]
  54. Wankhade, S.D.; Bahaji, A.; Mateu-Andrés, I.; Cornejo, M.J. Phenotypic indicators of NaCl tolerance levels in rice seedlings: Variations in development and leaf anatomy. Acta Physiol. Plant. 2010, 32, 1161–1169. [Google Scholar] [CrossRef] [Green Version]
  55. Yokas, İ.; Tuna, A.L.; Bürün, B.; Altunlu, H.; Altan, F.; Kaya, C. Responses of the tomato (Lycopersicon esculentum Mill.) plant to exposure to different salt forms and rates. Turk. J. Agric. For. 2008, 32, 319–329. [Google Scholar]
  56. Boccalandro, H.E.; Rugnone, M.L.; Moreno, J.E.; Ploschuk, E.L.; Serna, L.; Yanovsky, M.J.; Casal, J.J. Phytochrome B enhances photosynthesis at the expense of water-use efficiency in Arabidopsis. Plant Physiol. 2009, 150, 1083–1092. [Google Scholar] [CrossRef] [Green Version]
  57. Chen, Y.; Wang, M.; Ouwerkerk, P.B. Molecular and environmental factors determining grain quality in rice. Food Energy Sec. 2012, 1, 111–132. [Google Scholar] [CrossRef]
  58. Thitisaksakul, M.; Tananuwong, K.; Shoemaker, C.F.; Chun, A.; Tanadul, O.; Labavitch, J.M.; Beckles, D.M. Effects of timing and severity of salinity stress on rice (Oryza sativa L.) yield, grain composition, and starch functionality. J. Agric. Food Chem. 2015, 63, 2296–2304. [Google Scholar] [CrossRef] [Green Version]
  59. Wu, G.; Peterson, A.J.; Morris, C.F.; Murphy, K.M. Quinoa seed quality response to sodium chloride and sodium sulfate salinity. Front. Plant Sci. 2016, 7, 790. [Google Scholar] [CrossRef] [Green Version]
  60. Hasanuzzaman, M.; Nahar, K.; Alam, M.; Bhowmik, P.C.; Hossain, M.; Rahman, M.M.; Prasad, M.N.V.; Ozturk, M.; Fujita, M.H. Performance of four irrigated rice varieties under different levels of salinity stress. Int. J. Integr. Biol. 2009, 6, 85–90. [Google Scholar]
  61. Khan, M.A.; Abdullah, Z. Salinity–sodicity induced changes in reproductive physiology of rice (Oryza sativa) under dense soil conditions. Environ. Exp. Bot. 2003, 49, 145–157. [Google Scholar] [CrossRef]
  62. Abdullah, Z.; Khan, M.A.; Flowers, T. Causes of sterility in seed set of rice under salinity stress. J. Agron. Crop. Sci. 2001, 187, 25–32. [Google Scholar] [CrossRef]
  63. Grieve, C.; Lesch, S.M.; Maas, E.V.; François, L.E. Leaf and spikelet primordia initiation in salt-stressed wheat. Crop Sci. 1993, 33, 1286–1294. [Google Scholar] [CrossRef]
  64. Khatun, S.; Rizzo, C.; Flowers, T. Genotypic variation in the effect of salinity on fertility in rice. Plant Soil 1995, 173, 239–250. [Google Scholar] [CrossRef]
Figure 1. Mineral nutrients concentration in shoot of rice control plants (C) and plants stressed by 5 dS m−1 (5d) or 10 dS m−1 (10d) of NaCl (Cl) or Na2SO4 (S). Plants belong to two cultivars (Pokkali: salt-resistant and V14: salt-sensitive). Each value is the mean of three replicates per treatment and vertical bars are standard errors of the mean. Treatments followed by the same lowercase letter for a particular cultivar do not differ statistically. Cultivars followed by the same uppercase letter in a particular treatment do not differ statistically.
Agronomy 11 00571 g001
Figure 2. Comparisons of stomatal density and stomatal index in the flag leaf of rice control plants (C) and plants stressed by 5 dS m−1 (5d) or 10 dS m−1 (10d) of NaCl (Cl) or Na2SO4 (S). Plants belong to two distinct cultivars (Pokkali: salt-resistant and V14: salt-sensitive). Each value is the mean of three replicates per treatment and vertical bars are standard errors of the mean. Treatments followed by the same lowercase letter for a particular cultivar do not differ statistically. Cultivars followed by the same uppercase letter in a particular treatment do not differ statistically.
Agronomy 11 00571 g002
Figure 3. Total protein content in the rice grain of control plants (C) and plants stressed by 5 dS m−1 (5d) or 10 dS m−1 (10d) of NaCl (Cl) or Na2SO4 (S). Each value is the mean of three replicates per treatment and vertical bars are standard errors of the mean. Treatments followed by the same lowercase letter for a particular cultivar do not differ statistically. Cultivars followed by the same uppercase letter in a particular treatment do not differ statistically.
Agronomy 11 00571 g003
Table 1. Hydrogen potential (pH), electric conductivity (EC) and cation exchange capacity (CEC) of uncultivated and unsalted soil (Soil), unsalted soil cultivated with control plant (C) and cultivated soil salinized by 5 dS m−1 (5d) or 10 dS m−1 (10d) of NaCl (Cl) or Na2SO4 (S). Plants belong to two distinct cultivars (Pokkali: salt-resistant and V14: salt-sensitive). Parameters were recorded after plant harvest.
CultivarTreatmentpHEC (dS/m)CEC (meq/100 g Soil)
PokkaliSoil6.9 ± 0.09 bA0.17 ± 0.003 cA 22.67 ± 1.16 aA
C7.0 ± 0.05 bA0.21 ± 0.022 cA 21.62 ± 0.13 aA
Cl 57.4 ± 0.2 bA0.72 ± 0.116 bA 21.14 ± 0.15 aA
Cl10d7.5 ± 0.2 bA0.97 ± 0.027 aA 19.34 ± 0.68 aA
S5d8.2 ± 0.04 aA0.69 ± 0.019 bA 22.34 ± 1.05 aA
S10d8.2 ± 0.01 aA1.03 ± 0.017 aA 15.27 ± 1.14 bB
V14Soil6.9 ± 0.09 bA0.17 ± 0.003 cA22.67 ± 1.16 aA
C7.1 ± 0.03 bA0.25 ± 0.050 cA18.50 ± 0.60 aA
Cl5d7.3 ± 0.07 bA0.65 ± 0.038 bA17.19 ± 1.15 aA
Cl10d7.0 ± 0.14 bA0.98 ± 0.033 aA17.60 ± 0.84 aA
S5d8.1 ± 0.06 aA0.61 ± 0.078 bA19.32 ± 1.10 aA
S10d8.0 ± 0.15 aA0.91 ± 0.021 aA20.53 ± 6.14 aA
Notes: ± standard error of means. Treatments followed by the same lowercase letter for a particular cultivar do not differ statistically. Cultivars followed by the same uppercase letter in a particular treatment do not differ statistically.
Table 2. Exchangeable cations content and exchangeable sodium percentage (ESP) of uncultivated and unsalted soil (Soil), unsalted soil cultivated with control plants (C) and cultivated soil salinized by 5 dS.m−1 (5d) or 10 dS.m−1 (10d) of NaCl (Cl) or Na2SO4 (S). Plants belong to two distinct cultivars (Pokkali: salt-resistant and V14: salt-sensitive). Parameters were recorded after plant harvest.
CultivarTreatmentExchangeable Cations (meq/100g Soil)
Na+K+Ca2+Mg2+ESP (%)
PokkaliSoil0.8 ± 0.02 cA0.9 ± 0.05 bA20.3 ± 0.4 aA10 ± 0.2 cA3.5 ± 0.2 cdA
C0.3 ± 0.06 cA1.8 ± 0.05a bA20.4 ± 0.3 aA15.7 ± 0.4 aA1.4 ± 0.3 dA
Cl5d1.3 ± 0.5 cA2.8 ± 0.5 aA19.9 ± 0.6 aA12.9 ± 0.9 bA6.1 ± 2.1 cdA
Cl10d3.4 ± 0.3 bA2.4 ± 0.2 aA19.3 ± 0.3 aA12 ± 0.4 bcA17.6 ± 1.7 bA
S5d3.0 ± 0.15 bA2.0 ± 0.02 abA20.0 ± 0.3 aA14 ± 0.5 abA13.4 ± 1.3 bcA
S10d5.5 ± 0.2 aA2.3 ± 0.04 aA20.2 ± 0.4 aA13.9 ± 0.8 abA36 ± 5 aA
V14Soil0.8 ± 0.02 dA0.9 ± 0.05 cA20.3 ± 0.4 aA10 ± 0.2 cA3.5 ± 0.2 dA
C1 ± 0.009 dA2.4 ± 0.09 aA18.3 ± 1.3 abA15 ± 0.4 cA5.4 ± 0.2 dA
Cl5d2 ± 0.2 cA2.0 ± 0.24 abA18.4 ± 0.6 abA12 ± 0.2 bA11.6 ± 1.2 bcA
Cl10d1.4 ± 0.2 cdb2.2 ± 0.1 abA16.9 ± 0.18 abA9.9 ± 0.2 cA8 ± 1.4 cdB
S5d3.1 ± 0.3 bA1.7 ± 0.13 bA16.7 ± 0.7 bB13 ± 0.3 abA16.1 ± 1.4 abA
S10d4.2 ± 0.9 aA2.1 ± 0.06 abA18 ± 0.8 abA13 ± 0.6 bA20.5 ± 1 aB
Notes: ± standard error of means. Treatments followed by the same lowercase letter for a particular cultivar do not differ statistically. Cultivars followed by the same uppercase letter in a particular treatment do not differ statistically.
Table 3. Water-soluble ions content and sodium adsorption ratio (SAR) of uncultivated and unsalted soil (Soil), unsalted soil cultivated with control plants (C) and cultivated soil salinized by 5 dS m−1 (5d) or 10 dS m−1 (10d) of NaCl (Cl) or Na2SO4 (S). Plants belong to two distinct cultivars (Pokkali: salt-resistant and V14: salt-sensitive). Parameters were recorded after plant harvest.
CultivarTreatmentWater Soluble Ions (mmol/L)
NaKCaMgClSCO32−SAR
PokkaliSoil4 ± 0.03 dA0.5 ± 0.02 bA1.9 ± 0.005 bcA0.8 ± 0.007 dA1.5 ± 0.03 cA1.4 ± 0.06 cA 3.7 ± 0.2 cA3.4 ± 0.02 dA
C2.2 ± 0.2 dA1.3 ± 0.06a bA1.6 ± 0.03 cA1.1 ± 0.04c dA1.7 ± 0.7 cA0.8 ± 0.04 cA 9.1±0.5 abA1.9 ± 0.1 dA
Cl5d7.5 ± 1.3 cA3.3 ± 1.23 aA2.8 ± 0.7a bcA1.6 ± 0.3 abcA16 ± 4.9 bA1.2 ± 0.16 cA 6.6±1.4 bcA5.3 ± 1 cA
Cl10d17 ± 0.8 bA2.8 ± 0.3 abA3.2 ± 0.28 abA1.8 ± 0.06a dA27 ± 1.6a A1.2 ± 0.02 cA 6.8±0.7 abcA11 ± 0.8 bA
S5d14 ± 0.6 bA1.7 ± 0.02 abA2.4 ± 0.16a bcA1.5 ± 0.02 bcA2.8 ± 0.5 cA7.4 ± 0.3 bA 10.5±0.6 aA10.5 ± 0.7 bA
S10d27 ± 0.3 aA2.3 ± 0.14 abA3.4 ± 0.15 aA2.2 ± 0.03 aA2.7 ± 0.5 cA17 ± 0.6 aA 10.1±0.7 abA16.4 ± 0.3 aA
V14Soil4 ± 0.03 dA0.5 ± 0.02 cA1.9 ± 0.005 bA0.8 ± 0.007 cA1.5 ± 0.03 cA1.4 ± 0.06 cA 3.7±0.2 cA3.4 ± 0.02 dA
C3 ± 0.07 dA1.7 ± 0.37 abA1.8 ± 0.09 bA1.1 ± 0.04 bcA1.2 ± 0.1 cA0.8 ± 0.07 cA 9.5±0.3 aA2.5 ± 0.02 dA
Cl5d8 ± 0.7 cA1.6 ± 0.3 bcA1.7 ± 0.1 bA0.9 ± 0.02 cB13 ± 2.4 bA0.8 ± 0.03 cA 7.8±0.05 bA7.3 ± 0.5 cA
Cl10d10 ± 1.1 bcB2.8 ± 0.3 aA3.4 ± 0.3 aA1.7 ± 0.12 aA27 ± 1.3 aA1.4 ± 0.03 cA 2.6±0.48 cB6.3 ± 0.9 cB
S5d13 ± 0.7 bA1.5 ± 0.1 bcA1.7 ± 0.1 bA1.1 ± 0.06 bcA1.5 ± 0.3 cA7.5 ± 1.5 bA 8.4±0.3 abA10.5 ± 0.5 bA
S10d19 ± 0.7 aB1.9 ± 0.07 abA2.4 ± 0.17 bA1.4 ± 0.14 abB1.1 ± 0.09 cA14 ± 0.6 aB 8.4±0.2 abA13.7 ± 0.1 aA
Notes: ± standard error of means. Treatments followed by the same lowercase letter for a particular cultivar do not differ statistically. Cultivars followed by the same uppercase letter in a particular treatment do not differ statistically.
Table 4. Rice yield parameters measured on control plants (C) and plants stressed by 5 dS m−1 (5d) or 10 dS m−1 (10d) NaCl (Cl) or Na2SO4 (S). Plants belong to two distinct cultivars (Pokkali: salt-resistant and V14: salt-sensitive).
Yield Parameters MeasuredCultivar
PokkaliV14
CCl5dCl10dS5dS10dCCl5dCl10dS5dS10d
Plant height157 ± 3.5 aA154 ± 4.6 aA124 ± 3.2 bA154 ± 3 aA136 ± 3 bA73 ± 1.7 aB70 ± 1.2abB60 ± 0.58 dB68 ± 1.15 bcB64 ± 0.7 cdB
Number tiller/plant25 ± 0.7 aB16 ± 2.6 abB7 ± 3.3 bA20 ± 2 aB16 ± 1.2a bA45 ± 1.5 aA38 ± 0.6bA6 ± 1.9 dA45 ± 1.5 aA30 ± 1.5c A
Number panicle/plant25 ± 0.7 aB16 ± 2.6 abB5 ± 2.3 cA20 ± 2 abB14 ± 0.9 bcB45 ± 1.5 aA35 ± 1.2bA3 ± 1 dA39 ± 2 abA24 ± 0.9 cA
Days to heading time110 ± 1.7 aA107 ± 0.1 abA106 ± 1.2a bA109 ± 0.7 aA104 ± 0.1 bA107 ± 2 aA108 ± 2aA95 ± 0.9b B107 ± 0.3 aA96 ± 1.9b B
Panicle length (cm)28 ± 0.6 aA26.7 ± 0.9 aA20 ± 0.6 bA27.7 ± 0.9 aA22.3 ± 0.9 bA21 ± 0.09 aB18.5 ± 1aB14 ± 0.5 bB19.3 ± 0.3 aB15.2 ± 0.8 bB
Straw fresh weight g/plant87 ± 2 aA74.7 ± 1.9 bA38 ± 3.2 cA76.3 ± 1.9 bA67.7 ± 0.9 bA76 ± 0.7 aB69 ± 1 bA22.7 ± 1.5 dB71 ± 0.6 bA37 ± 1.5 bA
Grains number/panicle195 ± 4.7 aA186 ± 3.8a A72.7 ± 8 cA192 ± 5 aA128 ± 10 bA160 ± 5 aB139 ± 2 bB92.3 ± 4.4 dA146 ± 1.5ab B118 ± 1.9 cA
Filled grains/panicle (%)85 ± 1.8 aA55.4 ± 5 bA35.6 ± 3.7 cA84.3 ± 1.8 aA58.7 ± 3.1 bA81.3 ± 3a A51 ± 0.6 cA12.6 ± 1.2 bB64.3 ± 1.2 bB41.7 ± 1.5 dB
1000-grains weight (g)19.5 ± 1 aA18.4 ± 0.4 aA12.6 ± 0.5 bA17.4 ± 0.4 aA14 ± 0.6 bA21.6 ± 0.8 aA16.4 ± 0.5 bcA11.4 ± 0.9 dA19 ± 0.6 abA14.3 ± 0.9 cdA
Grain yield/plant (g)23 ± 1.2 aA17 ± 0.58 bA10.7 ± 0.9 bA18.3 ± 0.9 bA15.3 ± 0.7 bA24.7 ± 0.3aA16.3 ± 0.3 cA6.3 ± 0.3e B19.3 ± 0.3 bA10.7 ± 0.9 dB
Notes: ± standard error of means. Treatments followed by the same lowercase letter for a particular cultivar do not differ statistically. Cultivars followed by the same uppercase letter in a particular treatment do not differ statistically.
Publisher’s Note: MDPI stays neutral with regard to jurisdictional claims in published maps and institutional affiliations.

