Article

Soil Organic Carbon Dynamics in Semi-Arid Irrigated Cropping Systems

1
Northwest Irrigation and Soils Research Lab, USDA-ARS, Kimberly, ID 83341, USA
2
Department of Crop and Soil Science, Oregon State University, Corvallis, OR 97331, USA
*
Authors to whom correspondence should be addressed.
Agronomy 2021, 11(3), 484; https://doi.org/10.3390/agronomy11030484
Submission received: 19 January 2021 / Revised: 24 February 2021 / Accepted: 25 February 2021 / Published: 5 March 2021
(This article belongs to the Special Issue Management of Soil Organic Carbon for Soil Health in Agroecosystems)

Abstract

:
Insufficient characterization of soil organic carbon (SOC) dynamics in semi-arid climates contributes uncertainty to SOC sequestration estimates. This study estimated changes in SOC (0–30 cm depth) due to variations in manure management, tillage regime, winter cover crop, and crop rotation in southern Idaho (USA). Empirical data were used to drive the Denitrification Decomposition (DNDC) model in a “default” and calibrated capacity and forecast SOC levels until 2050. Empirical data indicates: (i) no effect (p = 0.51) of winter triticale on SOC after 3 years; (ii) SOC accumulation (0.6 ± 0.5 Mg ha–1 year–1) under a rotation of corn-barley-alfalfax3 and no change (p = 0.905) in a rotation of wheat-potato-barley-sugarbeet; (iii) manure applied annually at rate 1X is not significantly different (p = 0.75) from biennial application at rate 2X; and (iv) no significant effect of manure application timing (p = 0.41, fall vs. spring). The DNDC model simulated empirical SOC and biomass C measurements adequately in a default capacity, yet specific issues were encountered. By 2050, model forecasting suggested: (i) triticale cover resulted in SOC accrual (0.05–0.27 Mg ha–1 year–1); (ii) when manure is applied, conventional tillage regimes are favored; and (iii) manure applied treatments accrue SOC suggesting a quadratic relationship (all R2 > 0.85 and all p < 0.0001), yet saturation behavior was not realized when extending the simulation to 2100. It is possible that under very large C inputs that C sequestration is favored by DNDC which may influence “NetZero” C initiatives.

1. Introduction

Soil organic carbon (SOC) accumulation is of interest in agroecosystems as a gauge of relative soil quality through benefitting physical soil properties and influencing soil biogeochemistry. Interest in SOC as a pool for global C sequestration continues as the Intergovernmental Panel on Climate Change (IPCC) promotes increasing SOC as part of integrated response options to mitigate global C emissions [1]. The magnitude of mitigation that SOC storage can provide is dependent on climate, soil, and agroecological conditions [2]. For example, there is a positive relationship between SOC content and fine particle size silts and noncrystalline clays [3,4,5]. Some climates are predisposed for SOC sequestration while others are less inclined to sequester C [6]. Complicating this, various management practices such as varied tillage regimes, winter cover during annual cropping rotations, and manure, biosolids, or nitrogen applications have been shown to affect SOC accumulation [7,8,9]. Therefore, the importance of discussing SOC accumulation contextually among various climates and management strategies cannot be understated.
Soil organic C sequestration estimates are not abundant in semi-arid environments. These environments have been estimated to cover ~18% of global land surface area and will contribute unnecessary uncertainty to global SOC sequestration estimates if not properly characterized [10]. Soil C sequestration in semi-arid cropland has been studied in some areas of the United States [11] but estimates for specific regions could be improved. The cold semi-arid region of the United States, Köppen-Geiger climate classified “BsK”, extends from eastern Montana south through eastern Colorado and is also present along the Snake River Plain in southern Idaho [12]. In this region of Idaho, agriculture consists of dryland cropping systems of barley (Hordeum vulgare) and wheat (Triticum aestivum) or more diverse irrigated systems comprised of potato (Solanum tuberosum), sugar beet (Beta vulgaris ssp.), dry beans (Phaseolus vulgaris), corn (Zea mays), and alfalfa (Medicago sativa) production. Studies of SOC dynamics are lacking in this region. A few have considered dryland cropping systems [13,14] or native vegetation [15], however, knowledge of SOC dynamics under irrigated cropping systems in this region can be improved.
Agricultural computer models are used to simulate real world systems in order to obtain inferences where observed data is absent. Several biogeochemistry models commonly utilized by researchers are the Environmental Policy Integrated Climate Model (EPIC), Rothamsted carbon model (RothC), denitrification decomposition model (DNDC), daily century model (DayCent), and the root zone water quality model (RZWQM2) [16,17,18,19,20]. Typically, these system models are used in “calibration-validation” cases in which models are calibrated to a subset of real observations and validated against additional observations to gauge the accuracy of the model in representing a particular system. Model calibration and validation for a particular use case is imperative if accurate forecasting of data is anticipated. However, as these models are openly available to the public they are sometimes being used in an “off-the-shelf” capacity without calibration to make inferences about potential for C storage as part of Net-Zero C neutrality initiatives. To that end, the performance of these models used in such a capacity is relatively unknown. One popular model in use, due to its longevity and graphical user interface, is the DNDC model.
The DNDC model is a process-based biogeochemistry model in which users specify climate parameters (temperature and precipitation), soil properties (slope, texture, bulk density, pH, initial SOC), and management practices (crop, tillage, fertilization and manure, irrigation, grazing, etc.) to drive a simulation. The DNDC model operates daily to calculate crop growth and balance C and N pools from the interaction of individual submodules. Observations can be used to supplement model information as available; required inputs include minimal climate data (daily average temperature and precipitation), soil data (pH, and initial SOC), and management practices (crop grown, planting and harvest dates, tillage, etc.) For a complete description of the DNDC model refer to the user manual [21] and a guide to DNDC model version and development [22].
The opportunity exists to improve estimates of SOC accumulation under irrigated semi-arid environments in southern Idaho due to the presence of diverse research sites, including one within the United States Greenhouse Gas Reduction through Agricultural Carbon Enhancement Network initiative (GRACEnet). Three long-term studies located in southern Idaho are relevant to this work. The Long-Term Manure study, hereafter LT Manure, was designed to identify the effect of manure application rate and timing (annual vs. biennial application) on nutrient cycling and greenhouse gas emissions. The CoverCrop study was designed to determine the effect of integrating cover crops into continuous corn rotations utilizing conventional (disk/chisel) and minimum-till (strip-tillage) practices on nutrient cycling. The third study is part of the GRACEnet initiative, referred to as GRACEnet throughout, to assess diverse fertilizer forms and timing on nutrient cycling and greenhouse gas emissions. These studies provide a diverse set of management practices to improve estimates of SOC dynamics in irrigated semi-arid climates. Additionally, these studies provide a challenging array of systems to assess the performance of biogeochemistry models in a default and calibrated capacity. Therefore, objectives of this work were (i) to estimate SOC changes due to variation in manure management, tillage regime, cover crop, and crop rotation; (ii) to assess the performance of the DNDC model with minimal “default” input and after calibration for SOC, crop biomass C, N mineralization, soil water contents, and actual evapotranspiration (AET); and (iii) to use the calibrated model to make inferences on the long-term impact on SOC of diverse management practices taking place on irrigated croplands in the semi-arid region of southern Idaho.

2. Materials and Methods

2.1. Sites

All studies are located within the greater Twin Falls area in ID (42°15′0” N, 114°30′0” W). Mean annual temperature and precipitation are 9.6 °C and 24 cm year–1, respectively. Soils of the region can be characterized as loess deposits overlying basalt; typical taxonomy is represented by the Portneuf soil series (coarse-silty, mixed, superactive, mesic Durinodic Xeric Haplocalcids). A recent study reported some basic soil properties of the region (n = 75); mean soil pH was 8.0, silt and clay size particle fraction was 538 and 315 g kg–1 respectively, soil organic carbon content was 13 mg kg−1, and soil carbonate content was 59 g kg–1 [23].
The LT manure study was initiated in the fall of 2012 with a 4 year crop rotation of wheat–potato–barley–sugarbeet. Plots were 18.3 m by 12.2 m and arranged in a randomized complete block design with four replications. Treatments include a no-treatment control (Control), spring application of synthetic fertilizer (Fertilizer), and drystack dairy manure applied at rates of 18, 36, or 52 Mg ha–1 on a dry weight basis annually or biennially (18A, 18B, 36A, 36B, 52A, and 52B, respectively) in the fall. Synthetic fertilizer applications were made based on pre-plant soil analysis following University of Idaho guidelines for each crop as well as in-season petiole sampling for potato [24]. All plots were disked following manure and synthetic fertilizer applications to incorporate treatments; plots were moldboard plowed preceding potato and sugarbeet crops. As nutrient requirements were intended to be met each year, synthetic fertilizer applications were made in some manure treatments in some years. Additional information regarding study set-up is reported in Leytem et al. [25].
The CoverCrop study was initiated in the fall of 2015 as a continuous corn cropping system. Plots 12.2 m by 12. 2 m were established using a two by four split plot design with a main treatment of tillage (disk/chisel plow and no-till direct seeding/strip tillage) and a secondary treatment of cover crop by manure application (winter triticale with manure, winter triticale without manure, fallow with manure, fallow without manure) with four replications. For the purposes of this study, disk/chisel plow use was considered conventional tillage and strip tillage was considered minimum tillage. Hereafter, treatments will be referred to by hyphenated character code; conventional tillage (CT) or minimum-till (MT), manure application (M) or no manure application (NM), and triticale (T) or fallow (F). Drystack dairy manure was applied in manured treatments each fall at a target weight of 52 Mg ha–1 on dry weight basis before cover crop seeding. Treatments without manure application received synthetic fertilizer in the spring based on pre-plant soil testing and University of Idaho guidelines for corn [24]. Where manure applications did not meet nutrient recommendations, synthetic fertilizer was supplemented accordingly. All conventionally tilled plots were disked following manure or synthetic fertilizer application to incorporate treatments.
The GRACEnet study was initiated in the fall of 2012 using a typical regional dairy forage rotation of corn-barley-alfalfa-alfalfa-alfalfa. Plots 21.3 m by 22.9 m were arranged in a randomized complete block design with four replications of six treatments; fall applied dairy manure (Fall manure), fall applied composted dairy manure (Fall compost), spring applied dairy manure (Spr manure), spring applied urea or Super-Urea stabilized with N-butyl-thiophosphoric triamide and dicyandiamide urease and nitrification inhibitors (Spr urea or Spr super-U), and a no-manure or synthetic fertilizer application control (Control). Drystack manure and composted manure were applied to treatments at a target weight of 52 Mg ha–1 and 33 Mg ha–1 on a dry weight basis, respectively. All plots were disked following manure, compost, or synthetic fertilizer applications to incorporate treatments. Synthetic fertilizer application was based on pre-plant soil testing and University of Idaho guidelines for each crop [24]. As Fall compost treatments did not meet nutrient recommendations, synthetic fertilizer was supplemented accordingly. Additional information regarding site set-up is reported in Dungan et al. [26].

2.2. Calibration Data

Although the focus of this study was SOC stock, multiple parameters were used to assess and calibrate the DNDC model [21] for each site. For annual SOC stocks, soil samples were collected each fall before treatment application to a depth of 122 cm using a hydraulic soil probe (9100 Ag Probe, AMS Inc. American Falls, ID). Soil cores were separated into five segments (0–15, 15–30, 31–60, 61–91, and 92–122 cm) airdried and ground to pass a 2 mm sieve before SOC analysis by dichromate oxidation on a microplate spectrophotometer [23,27]. A correction factor of 1.33 was applied for incomplete oxidation of SOC [28]. For the purposes of this study, SOC contents were utilized from 0–30 cm as significant changes to SOC at lower depth intervals were not encountered over the duration of each study. Soil organic carbon contents were calculated on an area basis (Mg ha–1) using estimated values of soil bulk density for 0–15 cm and 15–30 cm, of 1.28 g cm3 and 1.37 g cm3, respectively.
Crop yields were measured during mechanical harvest of research plots at each site; biomass-C calculated from dry combustion in a FlashEA1112 C/N analyzer is presented in lieu of dry matter mass (CE Elantech, Lakewood, NJ, USA). At CoverCrop, corn was harvested as silage and triticale was harvested as a forage. At GRACEnet, corn was harvested as silage, barley as grain with barley residue baled and removed, and alfalfa as a forage with 2–3 cuttings per year. At LT manure, wheat and barley were harvested as grain (with residue baled and removed); potato and sugarbeet were harvested as tubers/roots. Yield data were available up until 2019 at CoverCrop and LT manure and 2018 at GRACEnet.
In-season estimates of N mineralization were made using a buried bag method employed in the study region [29]. Briefly, soil was sampled with a bucket auger from the 0–30 and 30–60 cm depths within each plot, composited and then packed into polyethylene tubes and reset in core holes to facilitate aerobic in-field incubation. Polyethylene bags were periodically removed from the field during the growing season and analyzed for inorganic N by flow injection colorimetry using Quickchem methods 12-107-06-2-A and 12-107-04-1-B [30,31]. For model assessment and calibration, cumulative N mineralization was utilized. Logistical requirements constrained N mineralization estimates at some sites and treatments. At CoverCrop, data were available for 2018 and 2019 seasons for CT-M-F, CT-M-T, CT-NM-F, and CT-NM-T while only the 2019 season was available for MT-NM-F and MT-NM-T treatments; no data existed for MT-M-F and MT-M-T treatments. At GRACEnet, data were available for 2018 and 2019 seasons except for Fall compost and Spr super-U treatments where no data existed. At the LT manure site, data were available for all treatments and seasons.
Observed values of volumetric soil water content were obtained by time domain reflectometry (GRACEnet and LT Manure) or neutron probe (CoverCrop) at a depth of 0–15 cm. Soil water content data were available for all seasons and treatments at GRACEnet and CoverCrop. At LT manure 2013 to 2017 records were available excluding 18B, 36A, and 52B treatments which had records for 2015 to 2017. Lastly, AET estimates from ETIdaho, a multi-crop ET estimator for Idaho, were compared with DNDC AET estimates between planting and harvest dates for model calibration [32,33]. When a perennial was grown year-round, the annual AET was used. Although the ETIdaho estimated AET is most similar to DNDC estimated AET (by accounting for crop stresses and more complex shallow soil water dynamics), the ETIdaho database was last updated in 2016 which limited comparisons. As a result, where ETIdaho data were lacking, a more generalized crop specific AET estimate (Agrimet) was compared with DNDC AET. Calibration was performed solely on ETIdaho estimates; however, figures and statistics were updated to include the Agrimet data (2017 to 2019) to enhance comparison. Generally, the Agrimet AET estimates are slightly larger than ETIdaho estimates, however trends in water use are similar.

2.3. DNDC

The DNDC models began 1 year prior to the beginning of each study to permit fall treatment applications to occur. The DNDC model was initialized after selecting weather records and designating site management practices while allowing soil and crop parameters to be populated by default values where applicable. For example, selecting a soil texture results in default values of porosity, hydraulic conductivity, field capacity, and wilting point. Weather data were gathered from an Agrimet weather station within close proximity of research plots in Kimberly, Idaho (www.usbr.gov/pn/agrimet accessed on 10 January 2021). Soil parameters supplied under the default scenario were texture class, soil pH, and initial SOC content as obtained at 0–15 cm the fall each study began. Cropping parameters supplied included rotation information, fraction of residue left in field after a harvest event, planting and harvest dates, tillage events, fertilization conditions, manure or compost applications, and irrigation schedules.
DNDC model performance was evaluated using goodness of fit indicators: percent bias (PBIAS), Nash-Sutcliffe model efficiency coefficient (NSE), and model mean absolute error (MAE). Model PBIAS determines the tendency of simulated values to be larger or smaller than corresponding observed values; the optimal PBIAS value is 0 with positive and negative values indicating overestimation or underestimation bias, respectively. The NSE describes the predictive accuracy of a model ranging from negative infinity to 1, a perfect model; when NSE is equal to 0 the model has the same predictive ability as the mean of observations. Typically, NSE is a goodness of fit metric used in hydrologic simulations of streamflow where NSE ≥ 0.75 is considered good and NSE ≥ 0.36 < 0.75 is considered satisfactory agreement [34]. Model MAE is the calculated average of absolute errors between simulated and observed values.
P B I A S = 100 i = 1 n ( s i m i o b s i ) i = 1 n ( o b s i )   ;   N S E = 1 i = 1 n ( o b s i s i m i ) 2 i = 1 n ( o b s i o b s ¯ ) 2   ;   M A E = i = 1 n | s i m i o b s i | n
To initiate calibration, parameter values were replaced with observed values where measurements or estimates existed for crop parameters (max biomass production and partitioned biomass C:N) and soil parameters (initial N concentration, bulk density, field capacity, wilting point, clay fraction, and hydraulic conductivity). Preliminary calibration was attempted on a singular synthetic fertilizer treatment at each site; however, it became apparent that a calibration performed in this way would not accurately represent treatments where manure was applied. Therefore, two treatments were considered at each site for the calibration. At CoverCrop, CT-NM-T and CT-M-T treatments were considered; at GRACEnet, Spr urea and Fall manure treatments were considered; at LT manure, Fertilizer and 52A treatments were considered. The trial and error method was used to manually calibrate model output at each of the three locations to observed values of volumetric soil water contents, biomass C, SOC, cumulative N mineralization, and estimated AET in that order and reiterated until model performance was deemed adequate or further benefit to goodness of fit indicators was not obtained. The priority of parameter consideration was based upon available empirical data and previous recommendations [35]. Utilization of the open source parameter estimation software (PEST; pesthomepage.org) was not feasible due to the graphical user interface of the DNDC model. Upon completion of the calibration, remaining treatments were initialized in the model and goodness of fit indicators produced. Although quasi perfect model performance was not an anticipated outcome of this study, substantial consideration was given to the calibration which is the product of numerous individual model runs. To reasonably constrain the length of this report, complete summary statistics and visualizations of model fit are reported as Supplementary Material. Instead, summary statistics are reported for all 3 locations for each parameter used in calibration; PBIAS and NSE were recalculated based on all treatments.

2.4. Forecasting

The calibrated models were used to forecast SOC levels under a subset of treatments up until year 2050. All treatments were forecasted at CoverCrop; at GRACEnet, Spr urea, Fall and Spr manure were forecasted; at LT manure 18A, 36B, 52A and Fertilizer treatments were forecasted. Model event schedules were modified in order to loop cropping rotations for the length of the forecasted scenario. For CoverCrop, the continuous corn cropping system permitted all events (2015–2019) to be looped. For GRACEnet, the first complete rotation of corn-barley-alfalfa-alfalfa-alfalfa (2013–2017) was looped. For LT Manure, two cycles of the wheat–potato–barley–sugarbeet rotation (2013–2020) was looped after repeating the 2016 sugarbeet year in 2020. Climate files used for each respective looping period were also repeated to reduce variability in the forecasted scenario. Precipitation in climate files was modified to reflect a projected 7.5% increase in regional precipitation by 2050 [36]. Similarly, temperature was modified according to “high” or “low” emissions projections resulting in 2.64 and 1.94 °C higher temperatures on average by 2050 and output for both the “high” and “low” emissions future climate scenarios are reported. Atmospheric CO2 was held constant during the scenario as the default value of 350 ppmv was not altered during the “default” and calibrated scenarios.

2.5. Statistical Analysis

To assess treatment effects on SOC stocks, observed values of SOC were analyzed by ANOVA performed by site and year in R (version 3.6.3; [37]). ANOVA data were checked for normality and homogeneity of variance assumptions and transformed using the bestNormalize package in R as necessary [38]. Treatment means were separated using Tukey’s multiple range test using the agricolae package in R [39]. Non-transformed data are shown in tables and figures. To calculate the average annual rate of change in SOC, simple linear regression was used to plot SOC level as a function of year among treatments at each site, slope estimates and their confidence intervals were extracted from the models. At each site, further testing was conducted based on points of interest.
At CoverCrop, to assess whether any effect of tillage practice or winter triticale could be separated from the effect of manure application a linear mixed effects model fitting fixed factors of manure (M & NM), cover (F & T), tillage (CT & MT), and year (2015:2019), their interactions, and random intercept effects attributed to block, block:cover:manure, and block:tillage:cover:manure was constructed using the lme4 package in R [40]. Data were log-transformed to satisfy assumptions of homogeneity of variance and normality of residuals before subsequent ANOVA and contrast testing was conducted to explain significant effects.
At GRACEnet, data were subset to manure applied treatments and a linear mixed effects model fitting timing (Fall & Spring), year (2012:2019), their interaction, and a random intercept effect of block was constructed to determine whether manure application timing (Fall & Spring) affected SOC accumulation. To determine if including 3 years of alfalfa in the rotation affected SOC stocks, data were subset to years before and directly proceeding the 3 years of alfalfa growth (2014 & 2017) before a Welch’s two sample paired t-test was conducted to assess if the difference in SOC means in 2014 and 2017 was different from 0.
At LT manure, a linear mixed effects model was fit with application rate (18, 36, 52 Mg ha–1), frequency (annual, biennial), year (2012:2018), their interactions, and a random intercept effect of block to assess the difference, if any, in SOC accumulation between annual and biennial manure applications. Data were transformed to satisfy homogeneity of variance and residual normality assumptions before an ANOVA was conducted to assess the significance of model parameters. Here, contrast testing was conducted to assess the difference, if any, in SOC accumulation of 18A and 36B treatments.
The DNDC models were assessed in a “default” and calibrated capacity using goodness of fit indicators discussed above. Overall location (CoverCrop, GRACEnet, LT manure) statistics were recalculated using data from all simulated treatments, in the case of MAE this is the mean of all treatments. Where applicable all tests were considered significant at the 0.05 level; in one explicit instance, a marginally significant effect was considered at the 0.10 level.

3. Results and Discussion

3.1. Annual SOC Stocks

Soil organic carbon contents of the surface soil (0–30 cm) was measured annually at each of three locations from the beginning of each study to 2019. There was no known history of manure application before the commencement of each study. As a result, a wide range in SOC contents was observed between all three sites from 25.1 Mg kg–1 to 89.6 Mg kg–1 (Table 1).
To assist interpretation, using assumed bulk densities of 1.28 g cm3 and 1.37 g cm3 for 0–15 cm and 15–30 cm depths, respectively, 20 Mg ha–1 is slightly less than 0.5% SOC. Average SOC content at the CoverCrop site was numerically lower when the study was initiated in 2015 (26.5 Mg ha–1) than when either GRACEnet (39.9 Mg ha–1) or LT manure (40.7 Mg ha–1) studies were initiated in 2012. This can be attributed to the CoverCrop study being located on the head of a historically furrow irrigated field, as these locations are highly erosive [41,42]. At the CoverCrop site, by 2017 SOC content was universally significantly higher where manure was applied, and this persisted through 2019. Conversely, where manure had not been applied SOC increased by approximately 30% by 2019; however, any effect of triticale cover or tillage practice was not apparent. At the GRACEnet location, in no year were SOC stocks different between synthetic fertilizer treatments and control treatments. By 2019, SOC of the fall manure treatment was ~18% higher than, but not significantly different from the spring applied manure treatment. Curiously, any significant difference between fall and spring manure applications was not apparent from fall 2013 to 2015 even though more manure-C had been applied under the Fall manure treatment during this time (Table 2).
As perhaps expected, the compost application was numerically between the manure applications and the remaining treatments, but not significantly different from either. When observing SOC stocks of the LT manure site, one trend encountered was an apparent reduction in SOC values the fall succeeding potato and sugarbeet harvest. In 2016 and 2018, mean SOC levels decreased an average of 15.7% and 6.2% relative to the respective preceding year. This could be a product of homogenization of soil depths during tuber/root harvest; alternatively, low residue C input, increased decomposition due to low residue C:N, and removal of belowground biomass during these crops has been attributed to decreases in SOC [43,44,45]. The current study anecdotally supports a degradative coefficient [46] for potato and sugar beet; though, our data is limited. Nonetheless, when tracking SOC content over time it could be advantageous to standardize the point of comparison in a crop rotation that includes tuber/root crops. In no year was there a significant difference in SOC content between the Control and Fertilizer treatments (Table 1). As anticipated, by 2019 the annual manure applications and increasing application rates resulted in numerically higher SOC levels than biennial and lower application rate counterparts, nevertheless the differences were not always significant.

3.2. Average Rate of Change

Average rate of SOC change in each treatment was determined using simple linear regression at each site (Table 3).
At the CoverCrop location, slopes of the regressions were exceptionally high where manure was applied, indicating annual SOC accumulations of ~ 10 Mg ha–1 year–1. This is considerably higher than studies of comparative lengths of manure application in the literature [47,48,49] and at the other locations of the present study. However, considering the relatively extreme manure application rate at CoverCrop (52 Mg ha–1 year–1), the cumulative manure-C input amassed quickly (Table 2). Additional SOC accumulation may be related to the shift to a continuous corn cropping system thought to be beneficial in some cases due to an increase in residue-C input [50,51,52]. Corn stover retention is estimated to increase SOC stocks at a rate of 0.41 Mg ha–1 year–1 relative to baseline values [53] but was removed for silage in the present study. Elsewhere, Bolinder et al. [54] attributed a ~0.3 Mg ha–1 year–1 SOC increase mainly to corn root derived C. Therefore, average annual C additions of manure applied plots at CoverCrop may approach 12 Mg ha–1 year–1. If we assume a moderate estimated SOC maintenance C addition rate of 1.9 Mg ha–1 year–1 [55], our estimate of SOC accumulation is conceivable. Additional explanation may be attributed to an additive effect of a less erosive irrigation regime (furrow to sprinkler) which was adopted when this study was initiated. Accumulation of SOC where no manure was applied was far lower, nonetheless considerable given the SOC accumulations at GRACEnet and LT manure locations (Table 3). As a result, this study indicates that SOC can be accrued rapidly from a diminished point by high manure-C input, although there are other considerations for high manure application rates in this region such as soil P and soluble salt accumulation [56].
At GRACEnet, the slope of the regression for the Spr super-U treatment was not significantly different from 0; consequently, SOC had not meaningfully changed since initial 2012 levels (Table 3). We propose that accumulation rates were lower at GRACEnet relative to CoverCrop for two reasons. First, CoverCrop received ~40% more manure-C over the span of 3 fewer years (Table 2). Second, initial SOC level was considerably higher at GRACEnet and responses to C inputs are related to initial SOC levels and effective equilibriums [57,58].
The slope estimates at LT manure were not significantly different from 0 in Control, Fertilizer, 18B and 36B treatments; suggesting in this cropping system manure-C input of at least 18 Mg ha–1 annually or 36 Mg ha–1 biennially is necessary for accrual of SOC (Table 3). As the GRACEnet and LT manure studies were initiated in 2012 at approximately equivalent SOC levels on very similar soils, they are relevant to compare. The control and synthetic fertilizer (Spr urea for GRACEnet) treatments appear to be accumulating SOC in the GRACEnet study but not at LT manure (Table 3). This was attributed to both a lesser amount of soil disturbance and potentially higher residue C input under the GRACEnet cropping rotation; residue C under potato or sugarbeet has been estimated as 2 to 3 times lower than residue C from cereal crops [59]. Our estimates of SOC accumulation can be compared with others but is limited by the scarcity of SOC records in potato or sugarbeet rotations receiving manure. Our own estimate using data from Moulin et al. [60] suggests SOC accumulation of 2.7 Mg ha–1 year–1 under a composted cattle manure application rate of ~ 15 Mg ha–1 year–1 in a 5-year bean-potato succession. Elsewhere, data from Miao et al. [61] indicated SOC accrual (~ 3 Mg ha–1 year–1) under a similar application rate (14 Mg ha–1 year–1) in a corn soybean succession; both studies estimates were higher than in the 18A treatment of the present study (1.5 Mg ha–1 year–1, Table 3).

3.3. Specific Management Questions
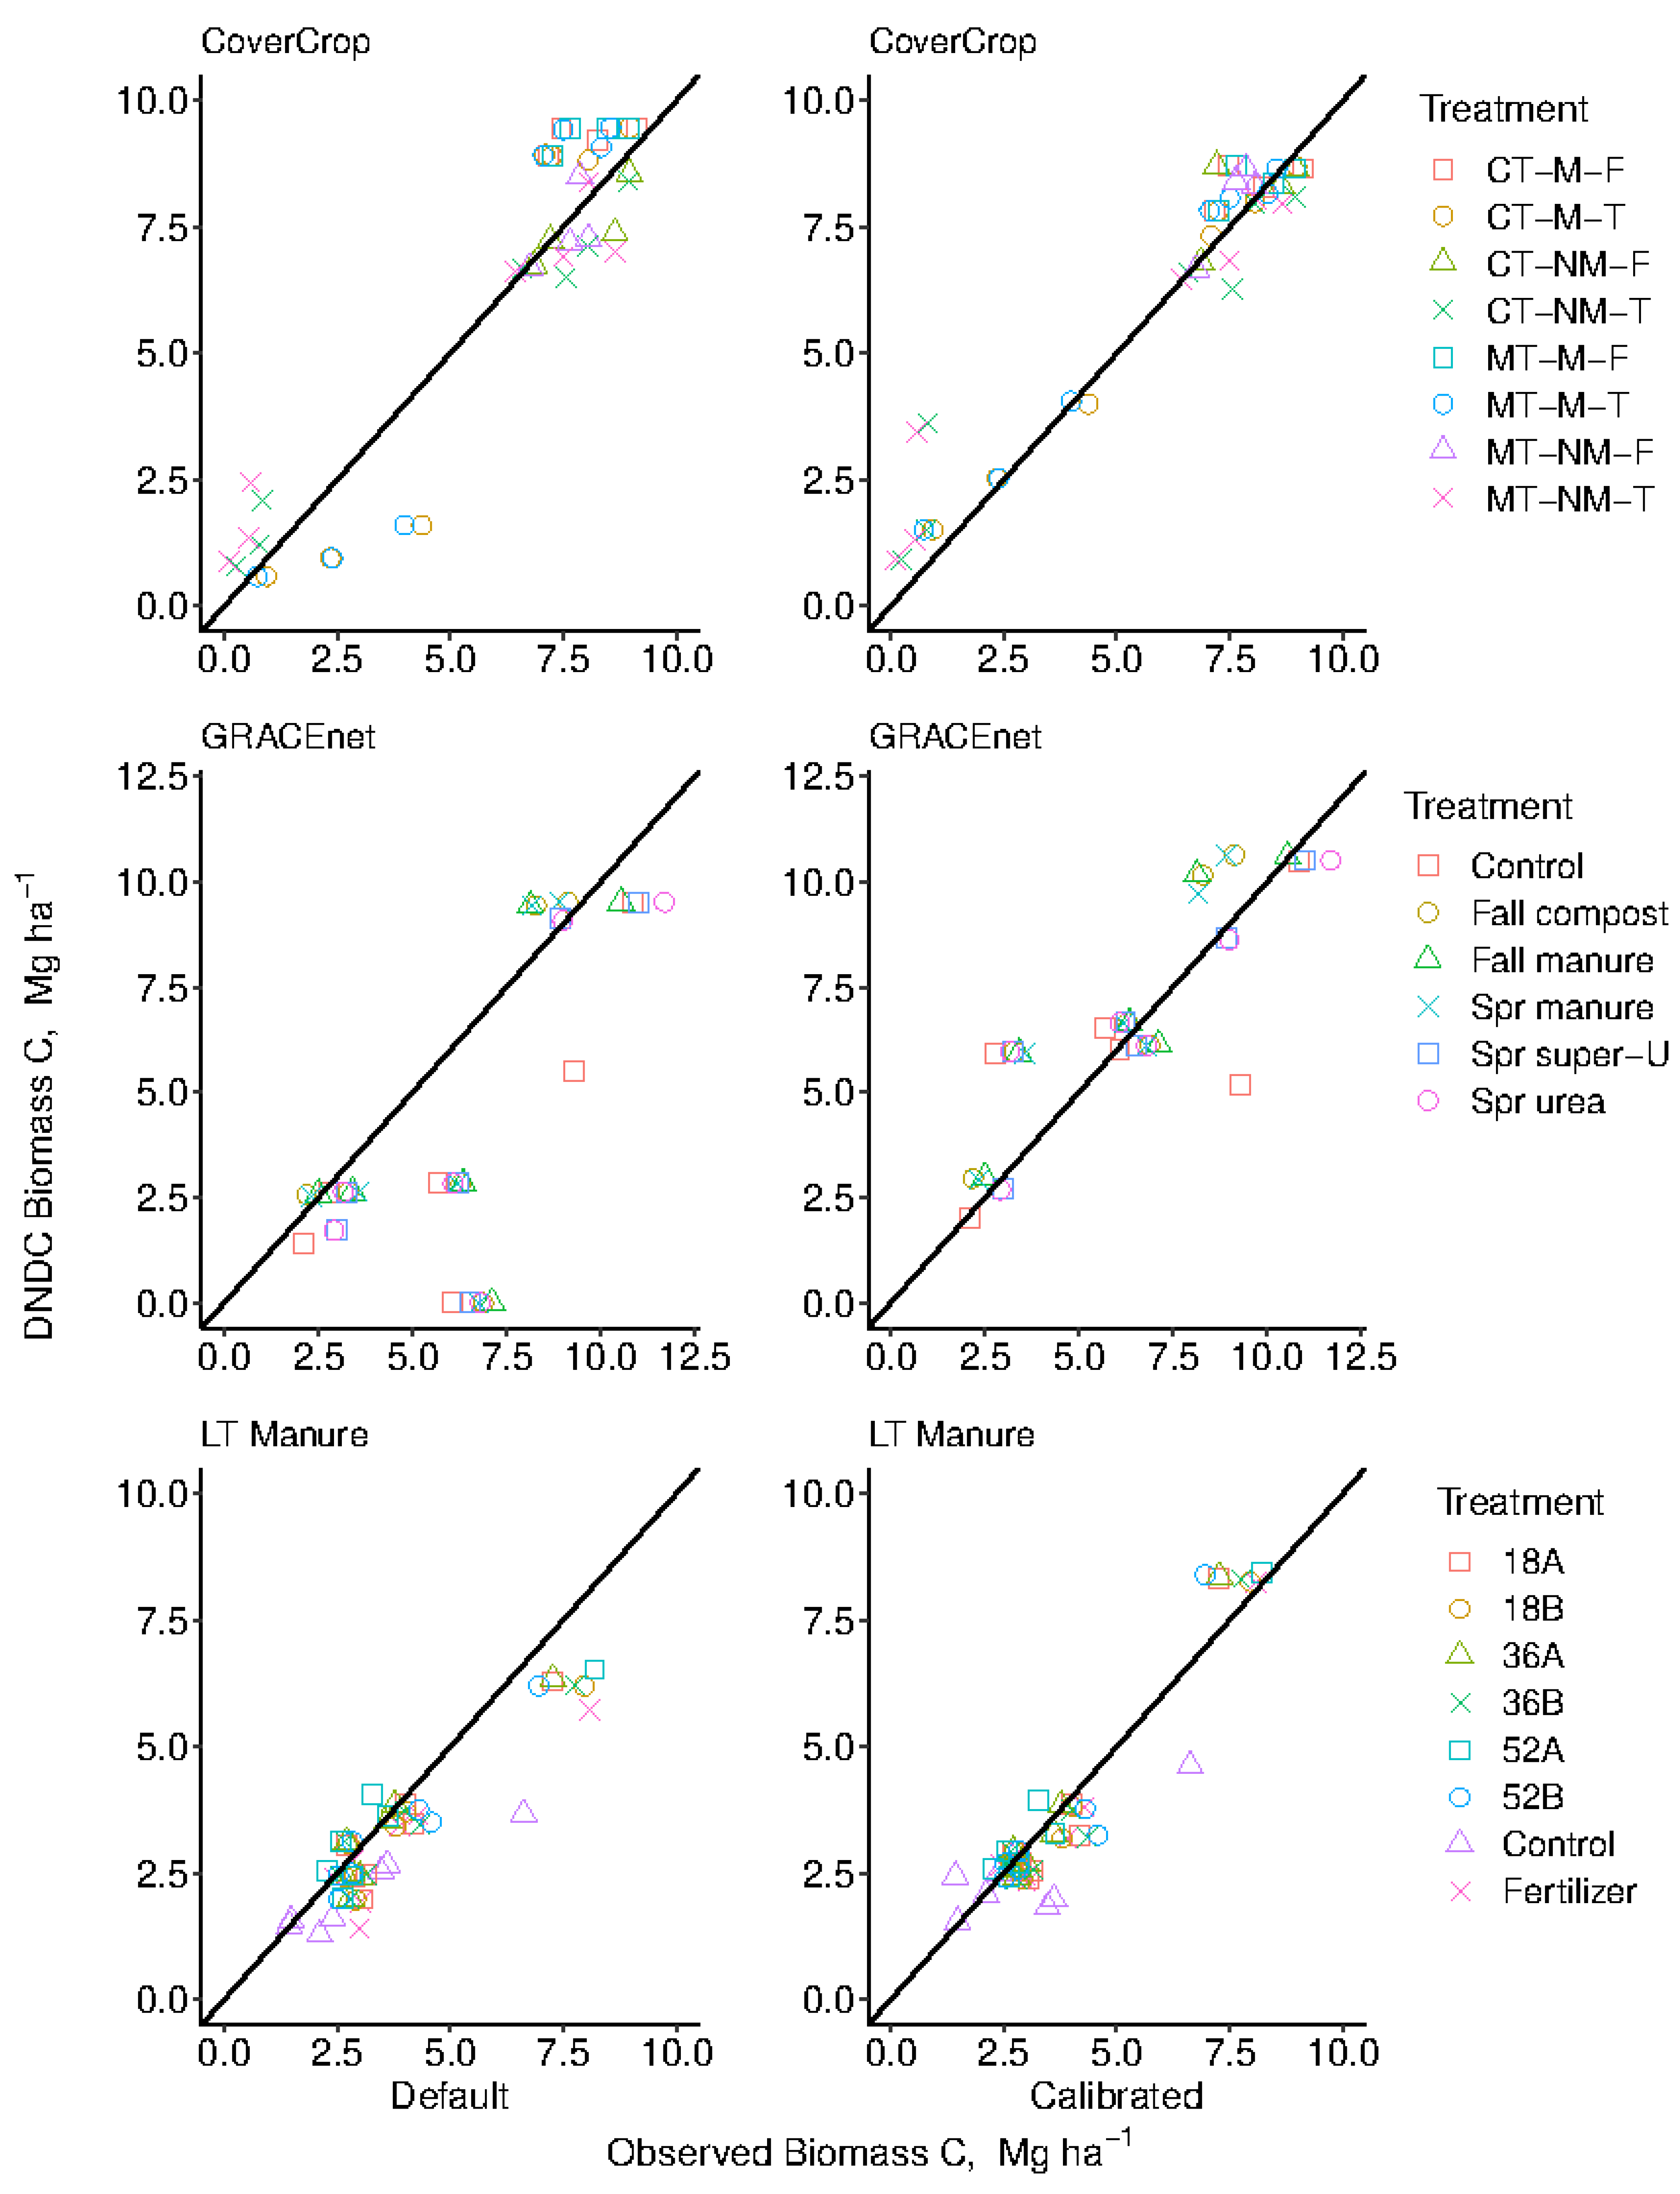
At CoverCrop, a linear mixed effects model was used to determine any significant effect of tillage practice or winter cover (triticale) on SOC stocks irrespective of manure application. An ANOVA of the model indicated significant main effects of manure application and year (both p < 0.0001), no effect of winter cover (p = 0.51) and an interaction effect between manure, tillage, and year (p < 0.05). Contrast testing indicated that tillage practice effected SOC levels only in 2019, solely where manure was applied (p < 0.01). This appears to be the result of the large individual mean measured under the MT-M-T treatment in 2019 relative to other manure applied treatments (Table 1). Consequently, we do not believe there is conclusive evidence that tillage practice or winter triticale cover has affected SOC accumulation in this system. Meta-analyses in the literature are often contradictory on the effect of tillage intensity on total SOC stock. Some are in agreement with the present study [62] others are not [63,64], but most report differences in SOC depth distribution and utilize only studies beyond a selected duration length. The CoverCrop study duration is ~ 5 years and would have been included in each of the mentioned meta-analyses. Conversely, meta-analyses considering the impact of cover crops on SOC stock consistently report accumulation at rates of 0.2 to 0.6 Mg ha–1 year–1 [65,66,67,68]. The present study encountered limited triticale growth where manure had not been applied before corn had to be planted (Figure S6); additionally, triticale was harvested as forage instead of returning to the soil as a green manure. Both are possible explanations for why triticale cover did not have a significant effect on SOC stock.
A linear mixed effects model was used to determine the difference, if any, in SOC accumulation between fall and spring applied manure at the GRACEnet location. Results indicated a significant main effect of year (p < 0.0001), no effect of timing (p = 0.41), and a timing (fall vs. spring) by year interaction that could be considered marginally significant (p < 0.1). Contrast testing of this interaction indicated the only difference between the effect of timing on SOC levels was in 2019 (p < 0.001). Considering individual years, the SOC stock of Fall manure and Spr manure treatments differed <6% from 2012–2018. Therefore, we find that there is insufficient evidence to state that there is a significant difference in SOC accumulation between fall and spring applications of manure. There are a limited number of comparative studies of manure application timing on SOC stock. One study reported higher SOC content in 1 of 2 years under fall application relative to spring application [69]; Ahmed et al. [70] reported higher organic matter under injected spring applications relative to fall applications after 6 years. Theoretically, if total manure-C input is equal it is likely there is not a substantial difference between timing as SOC stock changes are related to cumulative total C inputs [71]. One reason this may not be true is if differences in nitrogen release and retention between timings results in increases in above and below ground crop biomass. In this respect, there may be a slight preference for spring applications as fall application leaves an elongated window for nitrogen losses, although, precipitation dynamics must also be considered [70,72,73]. In the region of study, total precipitation is low (~24 cm year–1) and characterized by low intensity rainfall events [74]; that in addition to well managed sprinkler irrigation systems suggests minimal leaching of N.
In the present study, the effect of including alfalfa in the GRACEnet dairy forage rotation on SOC stock was also of interest. A paired Welch’s t-test was used to determine any difference in SOC stocks before and after alfalfa was grown in the rotation (2014 and 2017). The estimated stock difference (0.18 ± 0.68 Mg ha–1) was not significantly different from 0 (p = 0.59). Nonetheless, as the Control treatment accumulated SOC from 2012 to 2019 at GRACEnet but not at LT manure, the overall effect of the dairy forage rotation on SOC can be considered positive (Table 3). In comparable studies, alfalfa has been credited for improving SOC when included in rotations due to a reduction in tillage frequency and high residue C input [75,76].
At the LT manure study, a linear mixed effects model was used to determine the difference, if any, between manure application frequency (annual vs. biennial). Model fixed effects showed no significant difference (p = 0.75) between application frequency on SOC stock. Another point of comparison was made after an ANOVA of the model indicated a significant (p < 0.05) interaction between application rate, frequency, and year. Contrast testing of frequency and rate combinations receiving equivalent quantities of manure (18A and 36B) suggested differences in SOC stock only in the first year of manure application, thus annual application at rate 1X is approximately equivalent to biennial application at rate 2X. These findings are in agreement with Eghball [77] who reported no difference in SOC stock after 4 years of annual and biennial application of cattle manure at rate 1X and rate 2X, respectively.

3.4. DNDC Modeling

Overall model performance was dependent upon the parameter of interest and study location. The overall model goodness of fit statistics for both the default and calibrated models are reported in Table 4.
Generally, SOC values were simulated well by the default DNDC model. Under the default capacity, model PBIAS was ± 10% and NSE ranged from 0.45 to 0.74 (Table 4). The MAE indicated on average, SOC estimates were within 4.65 Mg ha–1, approximately 1.2 mg kg–1, of their measured values. Calibration attempts resulted in a slight deterioration of SOC fit statistics for CoverCrop and LT manure locations and a slight improvement at the GRACEnet location (Table 4). Unsurprisingly, individual treatment MAE indicated that both the default and calibrated DNDC models encountered the largest absolute error where manure was applied (Table S2). However, a tendency for underprediction of SOC when manure was applied was only encountered at the CoverCrop location which had unusually high SOC accumulation (Table 1 and Figure 1).
The MAE was considerably higher under minimum-till treatments (Table S2); subsequent examination of output files indicated that decomposition of C was questionably high (≥100 ≤ 500 kg–1 ha–1 day–1) when manure was unincorporated. We suggest that DNDC modeled decomposition of manure applied C was excessively rapid when not incorporated (Figure 1). This presents an opportunity for model progression in future iterations; in a report on DNDC model development, Li et al. [78]:
“…a change in manure application depth can simultaneously alter the soil temperature, moisture, pH, Eh, and concentrations of DOC, NH4+ or NO3. These changes will simultaneously and collectively affect the rates of decomposition, nitrification and denitrification occurring in the manure-amended soil that eventually alters the emissions of CO2, N2O and NH3 from the soil.”
This result is also demonstrative of the utility of pairing empirical data with modeled output, even though adequate simulation of SOC by DNDC is typically reported [79,80]. Overall, our results indicate DNDC simulated SOC values adequately over the duration of our research studies in a default capacity considering the diverse management practices simulated, although calibration can improve model performance.
Model simulation of crop yield was assessed through biomass-C. The default model performance was highly dependent on the cropping system being simulated. The continuous corn system of CoverCrop had a PBIAS of 4.1% in default capacity and 5.0% after calibration, the calibration markedly improved simulation of triticale growth improving NSE from 0.84 to 0.92 and MAE from ~ 1 Mg C ha–1 to 0.58 Mg C ha–1 (Table 4 and Figure 2).
The commercial rotation of LT manure (wheat–potato–barley–sugarbeet) was simulated acceptably in the default capacity, PBIAS= –14.4%, NSE = 0.73, MAE = 0.67 Mg C ha–1, but improved under calibration, mostly by increasing sugarbeet yield where manure was not applied (Table 4, Figures S26 and S27). The commercial forage rotation of GRACEnet poorly simulated crop yields under the default condition, PBIAS = –32.6%, NSE = –0.69, MAE = 2.62 Mg C ha–1, as result of consistent underprediction of alfalfa yield and a failure of scheduled cuttings to occur in 2017 (Table 4 and Figure S16). An explanation for the failed cuttings in 2017 was not ascertained, however all cuttings occurred after calibration (Figure S17). Calibration of the GRACEnet location improved upon the default model, PBIAS = 8.3%, NSE = 0.70, MAE = 1.13 Mg C ha–1, mostly by changing alfalfa growth parameters similar to those reported by He et al. [81]. Under the calibration, alfalfa growth simulation was overestimated in 2015 (Figure S17). A flaw forcing perennial crops to accumulate thermal degree days starting on 1 January of each year results in overestimation of yields when simulating spring planted perennials; subsequent model iterations should permit an exception to this rule. An additional peculiarity encountered under the default condition was an apparent lack of restriction on alfalfa root growth that resulted in an abrupt increase in SOC when alfalfa was terminated and root biomass was transferred to SOC pools (Figure S18). Alteration of the alfalfa growth parameters in the calibration addressed this concern (Figure S19). He et al. [81], reported “fair” simulation (NSE > 0 and nRSME > 30%) of alfalfa yield before improving simulation of winterkill effects, but did not report problems with root growth or spring planting. It is our view that biomass C was adequately simulated by the default model parameters if the alfalfa error is overlooked, yet attentiveness to model output is advised.
The DNDC model consistently underpredicted cumulative N mineralization in the default capacity where manure was not applied (Figure 3).
This was especially evident at the LT manure location as goodness of fit statistics improved with increasing application rates and were more favorable under annual as opposed to biennial applications (Figure 3, Table S3 and Figure S30). In response, decomposition rates were increased for the litter and humus pools under the calibration at all locations. The modeled N mineralization at the LT manure location was improved from the default scenario, PBIAS from –30.9% to 6.2%, NSE from 0.70 to 0.92, and MAE from 121 kg ha–1 to 59 kg ha–1 (Table 4 and Figure S31). Although decomposition rates were increased by the same margin at the GRACEnet location, fit was only modestly improved. At CoverCrop, overall goodness of fit indicators declined after calibration as only CT-NM-F and CT-NM-T treatments were improved (Table 4, Table S3). However, the quantity of comparable data was low at this location (Figures S10 and S11). Similar evaluations of the DNDC model have reported underestimation of N mineralization when contrasting various soil N pools [82,83], more so where N inputs were low [84,85]. Smith et al. [82] recommended revision of the mineralization module within DNDC if improvements to the hydraulic simulation could be completed beforehand. Krobel et al. [83] suggested that while increasing the decomposition rates would ameliorate underprediction of soil N pools, it may be detrimental to the soil C budget. In our calibration, decomposition rates were increased without degrading SOC simulation in 2 of 3 locations; although, changes to cropping parameters were required (Table 4).
The DNDC model was unable to acceptably simulate 0–15 cm soil water contents at all three locations under the default and initial calibration scenarios (Table 4 and Figure 4).
The calibration improved goodness of fit statistics at all locations, with reasonable PBIAS at GRACEnet (9.4%) and LT manure (4.2%); nevertheless, the NSE remained below 0 suggesting the mean soil water content was a better predictor of temporal soil water dynamics than the DNDC model (Table 4). A similar result was obtained by Jiang et al. [86] who reported reasonable simulation of soil water within an acceptable range (PIBAS ~ 3%) but worse simulated trends. Presently, soil water content was overestimated at all locations (PBIAS= 9–46%); elsewhere, comparable ranges of overestimation have been reported by Abdalla et al. [84] (13–30%) and Uzoma et al. [87] (13–26%). There is a consensus amongst researchers that a simplified approach to hydrologic simulation likely accounts for errors in modeled soil water content [88]. An additional consideration is that soil water content is a dynamic property, especially in irrigation driven agriculture, meaning it is likely difficult for models to correctly simulate values on specific days. The DNDC model uses a “tipping bucket”/cascade approach to model soil water movement; water entering the profile must saturate each soil layer before advancing to successive layers. While computationally less demanding, this method cannot account for movement of water in the vadose zone. A more precise approach is given by numerical solution to the Richards equation for movement of water in unsaturated media but has not been integrated in DNDC at this time. Additionally, water passing below a depth of 1 m is considered leached [89]. The present study indicates that the computationally inexpensive cascade approach is not suitable for modeling soil water trends in semi-arid irrigated croplands. Moreover, as water filled pore space is integral to other sub-models (nitrification, denitrification, decomposition), the accuracy of modelled emissions of GHG’s (CH4, CO2, N2O) should be further evaluated for semi-arid regions.
Generally, the DNDC model estimated AET did not agree with ETIdaho estimates and was comparatively under predictive of water use (Figure 5).
The DNDC model estimated crop AET was simulated poorly at CoverCrop and GRACEnet locations under the default scenario with a PBIAS of –36.8% and –39.7%, respectively (Table 4). At CoverCrop, this appeared to be largely related to triticale water use affecting AET under the corn crop, despite soil water being overestimated by DNDC (Figure 5, Table S4 and Figure S14). One occurrence of near perfect agreement was seen in year 2015 at CoverCrop, probably as the field was fallowed in this year and no crop was simulated. At GRACEnet, estimated AET was farthest from ETIdaho estimates under years alfalfa was grown, likely exacerbating the overall NSE (–1.92) which was indicative of poor simulation of trends in water use by each crop (Table 4, Figures S24 and S25). Errors in alfalfa biomass simulation likely contributed to poor AET simulation at GRACEnet. Model AET estimates were more agreeable with ETIdaho at the LT manure location with a PBIAS of –14.3% and an NSE of 0.25; note that all research locations used identical weather files as they are near in proximity. Calibration endeavors only had a substantive impact on the LT manure location, NSE improved from 0.25 to 0.75, indicating good agreement. At GRACEnet, problems encountered with simulation of alfalfa growth require further attention to accurately reflect water use. In DNDC, the Penmen-Montieth equation is used to calculate daily potential evapotranspiration (PET); potential transpiration is then calculated based on crop demand for water and crop growth rate. If enough water is present and there is adequate supply of soil N, PET is met (i.e., AET = PET), otherwise water stress is incurred and crop growth is reduced. In ETIdaho, PET is calculated using the Penmen-Montieth equation and AET is calculated using the FAO-56 dual crop coefficient procedure that considers the effects of irrigation and precipitation surface wetting on evaporation [90]. While ETIdaho estimates are not direct field measurements, the AET estimation it employs has been shown to be accurate over a variety of crops in the western U.S. [33]. Guest et al. [89] reported that plans were in development to refine DNDC estimates of ET. In the present study, it was evident that problems encountered with DNDC simulated soil water and crop water use prevented their accurate simulation in a default capacity and were not acceptably ameliorated by calibration attempts. Additionally, though not considered in the present study, as the water balance underpredicted ET, leaching and/or runoff was likely overestimated.

3.5. DNDC Model Forecasting

The calibrated DNDC models were run for a subset of treatments at each location until 2050 to project management influence on long-term SOC stocks. Relative differences in SOC stock between “high” and “low” future emissions scenarios were 1.5%, 1%, and 1% at CoverCrop, GRACEnet, and LT manure respectively (Figure 6).
As an additional exercise, the simulation length was extended to year 2100 under the 52A treatment at LT manure which resulted in a more extensive relative difference (7.7%) between emission scenarios with the “high” scenario resulting in lower SOC (Figure S36).
The LT manure projection indicated no long-term advantage to applying manure annually or biennially when the net quantity of application was equal, supporting our empirical analysis. Soil organic C stocks of the 18A and 36B treatments best fit quadratic relationships (all R2 > 0.85 and all p < 0.001), model critical points suggest an equilibrium will be reached at 63 Mg ha–1 obtained by 2057. The 52A treatment also had a quadratic relationship (R2 > 0.95, p < 0.001), the modeled critical point suggested an equilibrium of 130 Mg ha–1 obtained by 2058. An additional simulation was carried out until year 2100 for the 52A treatment. This simulation indicated that an equilibrium level was not, in fact, realized as SOC contents were in excess of 200 Mg ha–1 (Figure S36). This is incompatible with regional soils data which indicate that long-term (20–30 years records) manure application results in SOC levels between 80 and 120 Mg ha–1 with only a handful of sites obtaining > 160 Mg ha–1 SOC (Megan Satterwhite, IDA, personal communication). Considering all 2050 simulations, SOC was always within the levels of regional soil data (<160 g kg–1); nevertheless, overestimation is possible as an equilibrium level was not explicitly obtained during the modeling period. In a comparable 45 years DNDC simulation of a ryegrass forage system, Khalil et al. [91] reported that SOC equilibrium was not obtained under several simulated management practices including additions of cattle and swine manure. Elsewhere in other long-term DNDC simulations, equilibrium states were suggested or obtained, but overall C input was much lower than in the present study [92,93]. Therefore, it is possible that when C inputs are very large the DNDC model projected SOC dynamics may erroneously favor sequestration which could inaccurately influence various NetZero C initiatives. The DNDC model may require integration of a “SOC ceiling” for variations in management, climate, and physical soil properties or a tuning of the process-based feedbacks that should regulate SOC levels. Additionally, when possible model projections should be supported by long term data records as is best practice.
At GRACEnet, fall manure applications resulted in 32% higher SOC stock relative to spring applications by 2050, likely resulting from unintentional imbalanced manure-C input which was exacerbated over time due to the cycled yearly model input (Table 2). Under synthetic fertilizer applications SOC was projected to decline over the next 30 years at a linear rate of 0.25 Mg ha–1 year–1at both LT manure and GRACEnet and 0.11 Mg ha–1 year–1 at CoverCrop except where triticale cover and minimum-till were utilized concurrently (Figure 6). Theoretically, synthetic fertilizer application should result in SOC accrual only if a net increase in C input is attained through increased crop growth. At CoverCrop, the addition of triticale cover would provide additional C input, yet DNDC projects this is not sufficient to positively effect SOC levels under a more disruptive tillage regime. Here, the MT-NM-T treatment accumulated SOC following a quadratic model (y = –34302 + 34x –0.0082x2, R2 = 0.9, p < 0.001), while SOC of the CT-NM-T treatment declined linearly at 0.08 Mg ha–1 year–1. Under manure applied treatments at CoverCrop, projected SOC similarly followed strong quadratic relationships (all R2 > 0.95 and all p < 0.001); evaluation of model critical points suggested new SOC equilibriums would be met between 2055 and 2056 at SOC levels between 94 and 121 Mg ha–1. By 2050, SOC stock of conventionally tilled treatments receiving manure were 17% higher on average than their minimum-till counterparts. Contrasting this, when no manure was applied minimum-till treatments were 8% higher on average than conventionally tilled treatments. Continuing comparison of CoverCrop, projected SOC of manure applied treatments employing triticale cover were 8% higher on average than corresponding fallow treatments by 2050; when no manure was applied, treatments utilizing triticale cover were 15% higher on average. Thus, the DNDC projections indicate a long-term benefit of triticale cover regardless of tillage or manure application, and a variable effect of tillage practice dependent on manure application. Our projections on tillage support the meta-analysis by Gross and Glaser ([94], Under Review) and the reasoning of Baker et al. [95] that suggest SOC accumulation appears to favor conventional tillage management, at least to incorporate manure, when it is applied. The effect of adding triticale cover can be calculated as the absolute difference in the rate of SOC change in no-manure treatments as projected by DNDC; these estimates (conventional tilled = 0.05 Mg ha–1 year–1 and minimum-till = 0.27 Mg ha–1 year–1) are comparable to the annual rate of change (0.32 ± 0.08 Mg ha–1 year–1) reported in a recent meta-analysis of cover cropping [66]. Poeplau and Don [66] included only those studies where winter cover was not harvested which may explain our smaller estimates.

4. Conclusions

Empirical measurements indicated a commercial dairy forage rotation of corn-barley-alfalfax3 accumulated SOC (0.6 ± 0.5 Mg ha–1 year–1) while a commercial rotation of wheat–potato–barley–sugarbeet had not significantly changed in 8 years excluding the effects of manure. Manure application timing (fall vs. spring) and frequency (1X annual vs. 2X biennial) did not significantly affect SOC accrual (p = 0.41 and p = 0.75) when the total amount applied was equivalent. These findings better inform crop producers in semi-arid climates utilizing manure resources and may also influence attempts to sequester C in similar regions. The DNDC model simulated observed values of SOC and biomass C acceptably in a “default” capacity throughout the duration of observed data, but problems were encountered with simulation of soil water contents and AET. Difficulties in simulation of soil water suggests further evaluation of modelled GHG emissions (CH4, CO2, N2O) in semi-arid regions. Forecasting of calibrated models to 2050 suggests triticale cover accrues SOC (0.05–0.27 Mg ha–1 year–1), and that conventional (disk/chisel) tillage is favored over minimum-till (relative SOC difference = 17%) when manure is applied. Forecasting SOC of manure applied treatments suggested quadratic relationships (all R2 > 0.85 and all p < 0.0001), however when extended to year 2100 no equilibrium was realized. Modeling results provide a reference for users of the “default” DNDC model in similar regions and indicate that overestimation of SOC sequestration potential is possible.

Supplementary Materials

The following are available online at https://www.mdpi.com/2073-4395/11/3/484/s1; Table (S1): Denitrification decomposition (DNDC) model goodness of fit statistics for biomass carbon, Mg ha−1, as run in a “Default” and “Calibrated” capacity for each treatment of 3 simulated research locations. Fit statistics were recalculated considering all treatments for the values next to each location. c b; Table (S2): Denitrification decomposition (DNDC) model goodness of fit statistics for soil organic carbon, Mg ha−1, as run in a “Default” and “Calibrated” capacity for each treatment of 3 simulated research locations. Fit statistics were recalculated considering all treatments for the values next to each location. c b; Table (S3): Denitrification decomposition (DNDC) model goodness of fit statistics for cumulative nitrogen mineralization, kg ha−1, as run in a “Default” and “Calibrated” capacity for each treatment of 3 simulated research locations. Fit statistics were recalculated considering all treatments for the values next to each location. c b; Table (S4): Denitrification decomposition (DNDC) model goodness of fit statistics for soil water contents, cm3 cm−3 or Θv, as run in a “Default” and “Calibrated” capacity for each treatment of 3 simulated research locations. Fit statistics were recalculated considering all treatments for the values next to each location. c b; Table (S5): Denitrification decomposition (DNDC) model goodness of fit statistics for estimated actual evapotranspiration, mm water, as run in a “Default” and “Calibrated” capacity for each treatment of 3 simulated research locations. Fit statistics were recalculated considering all treatments for the values next to each location. c b; Figure (S6): Denitrification decomposition (DNDC) modeled biomass carbon, kg ha−1, relative to observed values at the CoverCrop location. Bars without the triticale indicator represent corn silage. The DNDC model was run in the “Default” capacity without calibration. Error bars indicate 1 standard error of the observed mean. Figure (S7): Denitrification decomposition (DNDC) modeled biomass carbon, kg ha−1, relative to observed values at the CoverCrop location. Bars without the triticale indicator represent corn silage. The DNDC model was run in the “Calibrated” capacity. Error bars indicate 1 standard error of the observed mean. Figure (S8): Denitrification decomposition (DNDC) modeled soil organic carbon, Mg ha−1, relative to observed values at the CoverCrop location. The DNDC model was run in the “Default” capacity without calibration. Error bars indicate 1 standard error of the observed mean. Figure (S9): Denitrification decomposition (DNDC) modeled soil organic carbon, Mg ha−1, relative to observed values at the CoverCrop location. The DNDC model was run in the “Calibrated” capacity. Error bars indicate 1 standard error of the observed mean. Figure (S10): Denitrification decomposition (DNDC) modeled cumulative nitrogen mineralization, kg ha−1, relative to observed values at the CoverCrop location. The DNDC model was run in the “Default” capacity without calibration. Figure (S11): Denitrification decomposition (DNDC) modeled cumulative nitrogen mineralization, kg ha−1, relative to observed values at the CoverCrop location. The DNDC model was run in the “Calibrated” capacity. Figure (S12): Denitrification decomposition (DNDC) modeled soil water contents, cm3 cm−3 or Θv, relative to observed values at the CoverCrop location. The DNDC model was run in the “Default” capacity without calibration. Figure (S13): Denitrification decomposition (DNDC) modeled soil water contents, cm3 cm−3 or Θv, relative to observed values at the CoverCrop location. The DNDC model was run in the “Calibrated” capacity. Figure (S14): Denitrification decomposition (DNDC) modeled crop actual evapotranspiration, mm water, relative to observed values at the CoverCrop location. The DNDC model was run in the “Default” capacity without calibration. Figure (S15): Denitrification decomposition (DNDC) modeled crop actual evapotranspiration, mm water, relative to observed values at the CoverCrop location. The DNDC model was run in the “Calibrated” capacity. Figure (S16): Denitrification decomposition (DNDC) modeled biomass carbon, kg ha−1, relative to observed values at the GRACEnet location. The DNDC model was run in the “Default” capacity without calibration. Error bars indicate 1 standard error of the observed mean. Figure (S17): Denitrification decomposition (DNDC) modeled biomass carbon, kg ha−1, relative to observed values at the GRACEnet location. The DNDC model was run in the “Calibrated” capacity. Error bars indicate 1 standard error of the observed mean. Figure (S18): Denitrification decomposition (DNDC) modeled soil organic carbon, Mg ha−1, relative to observed values at the GRACEnet location. The DNDC model was run in the “Default” capacity without calibration. Error bars indicate 1 standard error of the observed mean. Figure (S19): Denitrification decomposition (DNDC) modeled soil organic carbon, Mg ha−1, relative to observed values at the GRACEnet location. The DNDC model was run in the “Calibrated” capacity. Error bars indicate 1 standard error of the observed mean. Figure (S20): Denitrification decomposition (DNDC) modeled cumulative nitrogen mineralization, kg ha−1, relative to observed values at the GRACEnet location. The DNDC model was run in the “Default” capacity without calibration. Figure (S21): Denitrification decomposition (DNDC) modeled cumulative nitrogen mineralization, kg ha−1, relative to observed values at the GRACEnet location. The DNDC model was run in the “Calibrated” capacity. Figure (S22): Denitrification decomposition (DNDC) modeled soil water contents, cm3 cm−3 or Θv, relative to observed values at the GRACEnet location. The DNDC model was run in the “Default” capacity without calibration. Figure (S23): Denitrification decomposition (DNDC) modeled soil water contents, cm3 cm−3 or Θv, relative to observed values at the GRACEnet location. The DNDC model was run in the “Calibrated” capacity. Figure (S24): Denitrification decomposition (DNDC) modeled crop actual evapotranspiration, mm water, relative to observed values at the GRACEnet location. The DNDC model was run in the “Default” capacity without calibration. Figure (S25): Denitrification decomposition (DNDC) modeled crop actual evapotranspiration, mm water, relative to observed values at the GRACEnet location. The DNDC model was run in the “Calibrated” capacity. Figure (S26): Denitrification decomposition (DNDC) modeled biomass carbon, kg ha−1, relative to observed values at the LT Manure location. The DNDC model was run in the “Default” capacity without calibration. Error bars indicate 1 standard error of the observed mean. Figure (S27): Denitrification decomposition (DNDC) modeled biomass carbon, kg ha−1, relative to observed values at the LT Manure location. The DNDC model was run in the “Calibrated” capacity. Error bars indicate 1 standard error of the observed mean. Figure (S28): Denitrification decomposition (DNDC) modeled soil organic carbon, Mg ha−1, relative to observed values at the LT Manure location. The DNDC model was run in the “Default” capacity without calibration. Error bars indicate 1 standard error of the observed mean. Figure (S29): Denitrification decomposition (DNDC) modeled soil organic carbon, Mg ha−1, relative to observed values at the LT Manure location. The DNDC model was run in the “Calibrated” capacity. Error bars indicate 1 standard error of the observed mean. Figure (S30): Denitrification decomposition (DNDC) modeled cumulative nitrogen mineralization, kg ha−1, relative to observed values at the LT Manure location. The DNDC model was run in the “Default” capacity without calibration. Figure (S31): Denitrification decomposition (DNDC) modeled cumulative nitrogen mineralization, kg ha−1, relative to observed values at the LT Manure location. The DNDC model was run in the “Calibrated” capacity. Figure (S32): Denitrification decomposition (DNDC) modeled soil water contents, cm3 cm−3 or Θv, relative to observed values at the LT Manure location. The DNDC model was run in the “Default” capacity without calibration. Figure (S33): Denitrification decomposition (DNDC) modeled soil water contents, cm3 cm−3 or Θv, relative to observed values at the LT Manure location. The DNDC model was run in the “Calibrated” capacity. Figure (S34): Denitrification decomposition (DNDC) modeled crop actual evapotranspiration, mm water, relative to observed values at the LT Manure location. The DNDC model was run in the “Default” capacity without calibration. Figure (S35): Denitrification decomposition (DNDC) modeled crop actual evapotranspiration, mm water, relative to observed values at the LT Manure location. The DNDC model was run in the “Calibrated” capacity. Figure (S36): Denitrification decomposition (DNDC) model prediction of soil organic carbon (SOC) stocks, Mg ha−1, under “high” and “low” emission projections for the 52A treatment at the LT manure location until 2100. The model was forecast in the “Calibrated” state.

Author Contributions

Conceptualization: A.M.B., A.B.L., R.S.D., A.D.M. and D.L.B. Methodology: A.M.B. and A.B.L. Software: A.M.B. Validation: A.M.B., A.B.L., R.S.D. and A.D.M. Formal Analysis: A.M.B. Investigation: A.M.B., A.B.L., R.S.D. and A.D.M. Resources: A.B.L., R.S.D., A.D.M. and D.L.B. Data curation: A.M.B., A.B.L., R.S.D. and A.D.M. Writing-original draft preparation: A.M.B. Writing-review and editing: A.M.B., A.B.L., R.S.D. and D.L.B. Visualization: A.M.B. Supervision: A.B.L., R.S.D., A.D.M. and D.L.B. Project administration: A.B.L., R.S.D., A.D.M. and D.L.B. Funding acquisition: A.B.L., R.S.D., A.D.M. and D.L.B. All authors have read and agreed to the published version of the manuscript.

Funding

This work was supported by the Idaho Barley Commission; Idaho Wheat Commission; Independent Dairy Environmental Action League; and the Northwest Potato Research Consortium. This research was also supported in part by the U.S. Department of Agriculture, Agricultural Research Service. USDA is an equal opportunity provider and employer.

Acknowledgments

This work was made possible by the collective efforts of the North West Irrigation and Soils Research Laboratory (NWISRL), the University of Idaho, and supportive funds. Special thanks to the laboratory technicians of NWISRL who tirelessly work to collect the data which make this work possible. Reference of any trade names or commercial products in the publication is solely for the purpose of providing specific information and does not imply recommendation or endorsement by the USDA. The USDA is an equal opportunity provider and employer.

Conflicts of Interest

The authors declare no conflict of interest.

References

  1. IPCC. Climate Change and Land: An IPCC Special Report on Climate Change, Desertification, Land Degradation, Sustainable Land Management, Food Security, and Greenhouse Gas Fluxes in Terrestrial Ecosystems; Shukla, P.R., Skea, J., Buendia, E.C., Masson-Delmotte, V., Pörtner, H.-O., Roberts, D.C., Zhai, P., Slade, R., Connors, S., van Diemen, R., et al., Eds.; IPCC: Geneva, Switzerland, 2019; in press. [Google Scholar]
  2. Luo, Z.; Feng, W.; Luo, Y.; Baldock, J.; Wang, E. Soil organic carbon dynamics jointly controlled by climate, carbon inputs, soil properties and soil carbon fractions. Global Chang. Biol. 2017, 23, 4430–4439. [Google Scholar] [CrossRef]
  3. Powers, J.S.; Schlesinger, W.H. Relationships among soil carbon distributions and biophysical factors at nested spatial scales in rain forests of northeastern Costa Rica. Geoderma. 2002, 109, 165–190. [Google Scholar] [CrossRef]
  4. Haile, S.G. Soil Carbon Sequestration and Stabilization in Tree-Based Pasture Systems in Florida. Ph.D. Thesis, University of Florida, Gainesville, FL, USA, 2007. [Google Scholar]
  5. Takimoto, A.; Nair, P.K.R.; Nair, V.D. Carbon stock and sequestration potential of traditional and improved agroforestry systems in the west African Sahel. Agric. Ecosyst. Environ. 2008, 125, 159–166. [Google Scholar] [CrossRef]
  6. Carvalhais, N.; Forkel, M.; Khomik, M.; Bellarby, J.; Jung, M.; Migliavacca, M.; Mu, M.; Saatchi, S.; Santoro, M.; Thurner, M.; et al. Global covariation of carbon turnover times with climate in terrestrial ecosystems. Nature 2014, 514, 213–217. [Google Scholar] [CrossRef] [PubMed] [Green Version]
  7. Jenkinson, D.S. The Rothamsted long-term experiments: Are they still of use? Agron. J. 1991, 83, 2–10. [Google Scholar] [CrossRef]
  8. Halvorson, A.D.; Reule, C.A.; Follett, R.F. Nitrogen fertilization effects on soil carbon and nitrogen in a dryland cropping system. Soil Sci. Soc. Am. J. 1999, 63, 912–917. [Google Scholar] [CrossRef]
  9. Follett, R.F. Soil management concepts and carbon sequestration in cropland soils. Soil Till. Res. 2001, 61, 77–92. [Google Scholar] [CrossRef]
  10. Lal, R.; Kimble, J.M. Pedogenic carbonates and the global carbon cycle. In Global Climate Change and Pedogenic Carbonates; Lal, R., Kimble, J.M., Eswaran, H., Stewart, B.A., Eds.; CRC Press: Boca Raton, FL, USA, 2000; pp. 1–14. [Google Scholar]
  11. Martens, D.A.; Emmerich, W.; McLain, J.E.T.; Johnsen, T.N. Atmospheric carbon mitigation potential of agricultural management in the southwestern USA. Soil Till. Res. 2005, 83, 95–119. [Google Scholar] [CrossRef]
  12. Peel, M.C.; Finlayson, B.L.; McMahon, T.A. Updated world map of the Koppen-Geiger climate classification. Hydrol. Earth Syst. Sci. 2007, 11, 1633–1644. [Google Scholar] [CrossRef] [Green Version]
  13. Ghimire, R.; Machado, S.; Rhinhart, K. Long-term crop residue and nitrogen management effects on soil profile carbon and nitrogen in wheat-fallow systems. Agron. J. 2015, 107, 2230–2240. [Google Scholar] [CrossRef]
  14. Ghimire, R.; Machado, S.; Bista, P. Soil ph, soil organic matter, and crop yields in winter wheat-summer fallow systems. Agron. J. 2017, 109, 706–717. [Google Scholar] [CrossRef] [Green Version]
  15. Huber, D.P.; Lohse, K.A.; Commendador, A.; Joy, S.; Aho, K.; Finney, B.; Germino, M.J. Vegetation and precipitation shifts interact to alter organic and inorganic carbon storage in cold desert soils. Ecosphere 2019, 10, e02655. [Google Scholar] [CrossRef] [Green Version]
  16. Williams, J.R.; Jones, C.A.; Dyke, P.T. A modeling approach to determining the relationship between erosion and soil productivity. T. ASABE 1984, 27, 129–144. [Google Scholar] [CrossRef]
  17. Coleman, K.; Jenkinson, D.S. Rothc–26.3—A model for the turnover of carbon in soil. In. Evaluation of Soil Organic Matter Models Using Existing Long-Term Datasets; Powlson, D.S., Smith, P., Smith, J.U., Eds.; Springer: Berlin/Heidelberg, Germany, 1996. [Google Scholar] [CrossRef]
  18. Li, C. The dndc model. In Evaluation of Soil Organic Matter Models; Powlson, D.S., Smith, P., Smith, J.U., Eds.; Springer: Berlin/Heidelberg, Germany, 1996; pp. 263–268. [Google Scholar]
  19. Del Grosso, S.J.; Parton, W.J.; Mosier, A.R.; Hartman, M.D.; Keough, C.A.; Peterson, G.A.; Ojima, D.S.; Schimel, D.S. Simulated effects of land use, soil texture, and precipitation on N gas emissions using daycent. In Nitrogen in the Environment: Sources, Problems, and Management; Follet, R.F., Hatfield, J.L., Eds.; Elsevier: Amsterdam, The Netherlands, 2001; pp. 413–431. [Google Scholar]
  20. Ma, L.; Ahuja, L.R.; Nolan, B.T.; Malone, R.W.; Trout, T.J.; Qi, Z. Rootzone water quality model (rzwqm2): Model use, calibration, and validation. T. ASABE. 2012, 55, 1425–1446. [Google Scholar] [CrossRef]
  21. Institute for the Study of Earth, Ocean, and Space. The DNDC Model. Version 9.5. University of New Hampshire. Durham, NH 03824. 2012. Available online: www.dndc.sr.unh.edu (accessed on 1 October 2019).
  22. Gilhespy, S.L.; Anthony, S.; Cardenas, L.; Chadwick, D.; del Prado, A.; Li, C.; Misselbrook, T.; Rees, R.M.; Salas, W.; Sanz-Cobena, A.; et al. Fist 20 years of dndc (denitrification decomposition): Model evaluation. Ecol. Model. 2014, 292, 51–62. [Google Scholar] [CrossRef] [Green Version]
  23. Bierer, A.M.; Leytem, A.B.; Rogers, C.W.; Dungan, R.S. Evaluation of a microplate spectrophotometer for soil organic carbon determination in south central Idaho. Soil Sci. Soc. Am. J. 2020. [Google Scholar] [CrossRef]
  24. University of Idaho Extension. University of Idaho. Available online: https://www.uidaho.edu/extension (accessed on 3 March 2021).
  25. Leytem, A.B.; Moore, A.D.; Dungan, R.S. Greenhouse gas emissions from an irrigated crop rotation utilizing dairy manure. Soil Soc. Am. J. 2019, 83, 137–152. [Google Scholar] [CrossRef] [Green Version]
  26. Dungan, R.S.; Leytem, A.B.; Tarkalson, D.D.; Ippolitio, J.A.; Bjorneberg, D.L. Greenhouse gas emissions from an irrigated dairy forage rotation as influenced by fertilizer and manure applications. Soil Sci. Soc. Am. J. 2017, 81, 537–545. [Google Scholar] [CrossRef] [Green Version]
  27. Souza, D.M.; Morais, P.A.O.; Matsushige, I.; Rosa, L.A. Development of alternative methods for determining soil organic matter. Rev. Bras. Cienc. Solo. 2016, 40. [Google Scholar] [CrossRef] [Green Version]
  28. Walkley, A.; Black, I.A. An examination of the degtjareff method for determining soil organic matter, and a proposed modification of the chromic acid titration method. Soil Sci. 1934, 37, 29–38. Available online: https://journals.lww.com (accessed on 1 October 2019). [CrossRef]
  29. Westermann, D.T.; Crothers, S.E. Measuring soil nitrogen mineralization under field conditions. Agron. J. 1980. [Google Scholar] [CrossRef] [Green Version]
  30. Hofer, S. Determination of Ammonia (Salicylate) in 2MKCl Soil Extracts by Flow Injection Analysis; QuickChem Method 12-107-06-2-A; Revised by K. Bogren 2003; Lachat Instruments: Loveland, CO, USA, 2001. [Google Scholar]
  31. Knepel, K. Determination of Nitrate in 2MKCl Soil Extracts by Flow Injection Analysis; QuickChem Method 12-107-04-1-B. Revised by K. Bogren 2003; Lachat Instruments: Loveland, CO, USA, 2001. [Google Scholar]
  32. Robison, C.W.; Allen, R.G. ETIdaho update through 2015—ETIdaho 2016; Idaho Department of Water Resources, University of Idaho: Moscow, ID, USA, 2017. [Google Scholar]
  33. Allen, R.G.; Robison, C.W.; Huntingtion, J.; Wright, J.L.; Kilic, A. Applying the FAO56 dual kc method for irrigation water requirements over large areas in the USA. Trans. ASABE 2020, 63, 1–23. [Google Scholar] [CrossRef]
  34. Van Liew, M.W.; Garbrecht, J. Hydrologic simulation of the little washita river experimental watershed using swat. JAWRA 2003, 39, 413–426. [Google Scholar] [CrossRef]
  35. Li, C. Steps for Calibration and Validation of DNDC. 2013. Available online: https://www.arb.ca.gov/cc/capandtrade/protocols/rice/steps-for-dndc-12-20-13.pdf (accessed on 1 May 2020).
  36. NOAA, National Centers for Environmental Information, State Summaries, 149-ID. 2019. Available online: www.ncei.noaa.gov (accessed on 10 October 2020).
  37. R Core Team. R: A Language and Environment for Statistical Computing; R Foundation for Statistical Computing: Vienna, Austria, 2020; Available online: https://www.R-project.org/ (accessed on 1 October 2019).
  38. Peterson, R.A.; Cavanaugh, J.E. Ordered quantile normalization: A semiparametric transformation built for the cross-validation era. J. Appl. Stat. 2019. [Google Scholar] [CrossRef]
  39. Mendiburu, F. “Agricolae”. Statistical Procedures for Agricultural Research; National University of Engineering: Lima, Peru, 2020; Available online: cran.r-project.org (accessed on 1 October 2019).
  40. Bates, D.; Maechler, M.; Bolker, B.; Walker, S.; Christensen, R.H.B.; Singmann, H.; Dai, B.; Scheipl, F.; Grothendieck, G.; Green, P.; et al. ‘lme4’. 2020. Available online: cran.r-project.org (accessed on 1 October 2019).
  41. Kemper, W.D.; Trout, T.J.; Brown, M.J.; Rosenau, R.C. Furrow erosion and water and soil management. Trans. ASAE. 1985, 28, 1564–1572. Available online: nwisrl.ars.usda.gov (accessed on 1 October 2020). [CrossRef]
  42. Trout, T.; Carter, D.; Sojka, B. Irrigation-induced soil erosion reduces yields and muddies rivers. Irrig. J. 1994, 44, 11–12. Available online: nwisrl.ars.usda.gov (accessed on 1 October 2020).
  43. Beck, T. Einfluss langjähriger monokultur auf die bodenbelebung im vergleich zur fruchtfolge. Landwirtsch. Forschung Sonderh. 1975, 31, 268–276. [Google Scholar]
  44. Steinbrenner, K.; Smukalski, M. Einfluss von anbaustruktur und fruchtfolge auf einige bodeneigenschaften, dargestellt an ergebnissen des Internationalen fruchtfolgeversuches dewitz. Arch. Agron. Soil Sci. 1984, 28, 611–616. [Google Scholar]
  45. Grandy, A.S.; Porter, G.A.; Erich, M.S. Organic amendment and rotation crop effects on the recovery of soil organic matter and aggregation in potato cropping systems. Soil Sci. Soc. Am. J. 2002, 66, 1311–1319. [Google Scholar] [CrossRef] [Green Version]
  46. Gradziuk, P.; Gradziuk, B.; Trocewicz, A.; Jendrzejewski, B. Potential of straw for energy purposes in Poland—forecasts based on trend and causal models. Energies 2020, 13, 5054. [Google Scholar] [CrossRef]
  47. Franzluebbers, A.J.; Stuedemann, J.A.; Wilkinson, S.R. Bermudagrass management in the southern piedmont USA. Soil Sci. Soc. Am. J. 2001, 65, 834–841. [Google Scholar] [CrossRef]
  48. Kanaujia, V.K. Effect of fym and fertilizers nutrition on production potential, nutrients uptake and soil properties under rice-wheat cropping system. JAS 2016, 3, 101–105. Available online: https://www.jsure.org.in (accessed on 1 October 2019). [CrossRef]
  49. Jesus, K.N.D.; Menezes, R.S.C.; Filho, R.N.D.A.; Sampaio, E.V.D.S.B.; Antonino, A.C.D.; Primo, D.C. Maize and sunflower yields and soil changes after five years of organic fertilization in the semi-arid region of Paraiba, Brazil. Arid Land Res. Manag. 2020, 34, 460–473. [Google Scholar] [CrossRef]
  50. Clapp, C.E.; Allmaras, R.R.; Layese, M.F.; Linden, D.R.; Dowdy, R.H. Soil organic carbon and 13C abundance as related to tollage, crop residue, and nitrogen fertilization under continuous corn management in Minnesota. Soil Tillage Res. 2000, 55, 127–142. [Google Scholar] [CrossRef]
  51. McCallister, D.L.; Chien, W.L. Organic carbon quantity and forms as influenced by tillage and cropping sequence. Commun. Soil Sci. Plant Anal. 2000, 31, 465–479. [Google Scholar] [CrossRef]
  52. Varvel, G.E.; Wilhelm, W.W. Long-term soil organic carbon as affected by tillage and cropping systems. Soil Sci. Soc. Am. J. 2010, 74, 915–921. [Google Scholar] [CrossRef] [Green Version]
  53. Xu, H.; Sieverding, H.; Kwon, H.; Clay, D.; Stewart, C.; Johnson, J.M.F.; Qin, Z.; Karlen, D.L.; Wang, M. A global meta-analysis of soil organic carbon response to corn stover removal. GCB Bioenergy 2019, 11, 1215–1233. [Google Scholar] [CrossRef] [Green Version]
  54. Bolinder, M.A.; Angers, D.A.; Giroux, M.; Laverdiere, M.R. Estimating C inputs retained as soil organic matter from corn (zea mays l.). Plant Soil. 1999, 215, 85–91. [Google Scholar] [CrossRef]
  55. Coleman, K.; Jenkinson, D.S.; Crocker, G.J.; Grace, P.R.; Klir, J.; Korschens, M.; Poulton, P.R.; Richter, D.D. Simulating trends in soil organic carbon in long-term experiments using RothC–26.3. Geoderma 1997, 81, 29–44. [Google Scholar] [CrossRef]
  56. Moore, A.; Ippolito, J.A. Dairy Manure Field Applications-How much is too much? University of Idaho. College of Agricultural and Life Sciences. Extension Bulletin CIS1156. 2009. Available online: www.extension.uidaho.edu (accessed on 1 October 2020).
  57. Stewart, C.E.; Paustian, K.; Conant, R.T.; Plante, A.F.; Six, J. Soil carbon saturation: Concept, evidence and evaluation. Biogeochemistry 2007, 86, 19–31. Available online: oce.ovid.com (accessed on 1 October 2020). [CrossRef]
  58. Castellano, M.J.; Mueller, K.E.; Olk, D.C.; Sawyer, J.E.; Six, J. Integrating plant litter quality, soil organic matter stabilization, and the carbon saturation concept. Global Change Biol. 2015, 21, 3200–3209. [Google Scholar] [CrossRef] [PubMed]
  59. Bolinder, M.A.; Katterer, T.; Poeplau, C.; Borjesson, G.; Parent, L.E. Net primary productivity and below-ground crop residue inputs for root crops: Potato (solanum tuberosum l.) and sugar beet (beta vulgaris l.). Can. J. Soil Sci. 2015, 95, 87–93. [Google Scholar] [CrossRef] [Green Version]
  60. Moulin, A.P.; Buckley, K.E.; Volkmar, K. Soil quality as affected by amendments in pinto bean-potato rotations. Can. J. Soil Sci. 2011, 91, 533–542. [Google Scholar] [CrossRef]
  61. Miao, S.; Qiao, Y.; Yin, Y.; Jin, J.; Marten, B.; Liu, X.; Tang, C. Ten-year application of cattle manure contributes to the build-up of soil organic matter in eroded mollisols. J. Soils Sediments. 2019, 19, 3035–3043. [Google Scholar] [CrossRef]
  62. Luo, Z.; Wang, E.; Sun, O.J. Can no-tillage stimulate carbon sequestration in agricultural soils? A meta-analysis of paired experiments. Agric. Ecosyst. Environ. 2010, 139, 224–231. [Google Scholar] [CrossRef]
  63. West, T.O.; Post, W.M. Soil organic carbon sequestration rates by tillage and crop rotation, a global data analysis. Soil Sci. Soc. Am. J. 2002, 66, 1930–1946. [Google Scholar] [CrossRef] [Green Version]
  64. Angers, D.A.; Eriksen-Hamel, N.S. Full-inversion tillage and organic carbon distribution in soil profiles: A meta-analysis. Soil Sci. Soc. Am. J. 2008, 72, 1370–1374. [Google Scholar] [CrossRef]
  65. Aguilera, E.; Lassaletta, L.; Gattinger, A.; Gimeno, B. SManaging soil carbon for climate change mitigation and adaptation in Mediterranean cropping systems: A meta-analysis. Agric. Ecosyst. Environ. 2013, 168, 25–36. [Google Scholar] [CrossRef]
  66. Poeplau, C.; Don, A. Carbon sequestration in agricultural soils via cultivation of cover crops—A meta-analysis. Agric. Ecosyst. Environ. 2015, 200, 33–41. [Google Scholar] [CrossRef]
  67. Jian, J.; Du, X.; Reiter, M.S.; Stewart, R.D. A meta-analysis of global cropland soil carbon changes due to cover cropping. Soil Biol. Biochem. 2020, 143, 107735. [Google Scholar] [CrossRef]
  68. Bolinder, M.A.; Crotty, F.; Elsen, A.; Frac, M.; Kismanyoky, T.; Lipiec, J.; Tits, M.; Toth, Z.; Katterer, T. The effect of crop residues, cover crops, manures and nitrogen fertilization on soil organic carbon changes in agroecosystems: A synthesis of reviews. Mitig. Adapt. Strateg. Glob. Chang. 2020, 25, 929–952. [Google Scholar] [CrossRef]
  69. Lepsch, H.C.; Brown, P.H.; Peterson, C.A.; Gaudin, A.C.M.; Khalsa, S.D.S. Impact of organic matter amendments on soil and tree water status in a California orchard. Agric. Water Manag. 2019, 222, 204–212. [Google Scholar] [CrossRef]
  70. Ahmed, S.I.; Mickelson, S.K.; Pederson, C.H.; Baker, J.L.; Kanwar, R.S.; Lormir, J.C.; Webber, D.F. Swine manure rate, timing, and application method effects on post-harvest soil nutrients, crop yield, and potential water quality implications in a corn-soybean rotation. Trans. ASABE. 2013, 56, 395–408. [Google Scholar] [CrossRef]
  71. Maillard, E.; Angers, D.A. Animal manure application and soil organic carbon stocks: A meta-analysis. Global Change Biol. 2013, 20, 666–679. [Google Scholar] [CrossRef] [PubMed]
  72. Cherney, J.H.; Ketterings, Q.M.; Cherney, D.J.; Davis, M.H. Timing of semisolid dairy manure applications does not affect yield and quality of orchardgrass. Agron. J. 2010, 102, 553–558. [Google Scholar] [CrossRef]
  73. Randall, G.W.; Schmitt, M.A.; Schmidt, J.P. Corn production as affected by time and rate of manure application and nitrapyrin. J. Prod. Agric. 2013, 12, 317–323. [Google Scholar] [CrossRef]
  74. Bjorneberg, D.L.; King, B.A.; Koehn, A.C. Watershed water balance changes as furrow irrigation is converted to sprinkler irrigation in an arid region. J. Soil Water Conserv. 2020, 75, 254–262. [Google Scholar] [CrossRef]
  75. Morari, F.; Lugato, E.; Berti, A.; Giardini, L. Long-term effects of recommended management practices on soil carbon changes and sequestration in north-eastern Italy. Soil Use Manag. 2006, 22, 71–81. [Google Scholar] [CrossRef]
  76. Triberti, L.; Nastri, A.; Baldoni, G. Long-term effects of crop rotation, manure and mineral fertilization on carbon sequestration and soil fertility. Eur. J. Agron. 2016, 74, 47–55. [Google Scholar] [CrossRef]
  77. Eghball, B. Soil properties as influenced by phosphorous and nitrogen based manure and compost applications. Agron. J. 2002, 94, 128–135. [Google Scholar] [CrossRef] [Green Version]
  78. Li, C.; Salas, W.; Zhang, R.; Krauter, C.; Rotz, A.; Mitloehner, F. Manure-dndc: A biogeochemical process model for quantifying greenhouse has and ammonia emissions from livestock manure systems. Nutr. Cycl. Agroecosystems. 2012, 93, 163–200. [Google Scholar] [CrossRef]
  79. Li, S.; Li, J.; Li, C.; Huang, S.; Li, X.; Li, S.; Ma, Y. Testing the rothc and dndc models against long-term dynamics of soil organic carbon stock observed at cropping field soils in north China. Soil Tillage Res. 2016, 163, 290–297. [Google Scholar] [CrossRef]
  80. Zhang, J.; Hu, K.; Li, K.; Zheng, C.; Li, B. Simulating the effects of long-term discontinuous and continuous fertilization with straw return on crop yields and soil organic carbon dynamics using the dndc model. Soil Tillage Res. 2017, 165, 302–314. [Google Scholar] [CrossRef]
  81. He, W.; Grant, B.B.; Smith, W.N.; VanderZaag, A.C.; Piquette, S.; Qian, B.; Jing, Q.; Rennie, T.J.; Belanger, G.; Jego, G.; et al. Assessing alfalfa production under historical and future climate in eastern Canada: Dndc model development and application. Environ. Model Softw. 2019, 122, 104540. [Google Scholar] [CrossRef]
  82. Smith, W.N.; Grant, B.B.; Desjardins, R.L.; Rochette, P.; Drury, C.F.; Li, C. Evaluation of two process-based models to estimate soil N2O emissions in eastern Canada. Can. J. Soil Sci. 2008, 88, 251–260. [Google Scholar] [CrossRef]
  83. Krobel, R.; Smith, W.; Grant, B.; Desjardins, R.; Campbell, C.; Tremblay, N.; Li, C.; Zentner, R.; McConkey, B. Development and evaluation of a new Canadian spring wheat sub-model for DNDC. Can. J. Soil Sci. 2011, 91, 503–520. [Google Scholar] [CrossRef] [Green Version]
  84. Abdalla, M.; Wattenbach, M.; Smith, P.; Ambus, P.; Jones, M.; Williams, M. Application of the DNDC model to predict emissions of N2O from Irish agriculture. Geoderma 2009, 151. [Google Scholar] [CrossRef]
  85. Grant, B.; Smith, W.N.; Campbell, C.A.; Desjardins, R.L.; Lemke, R.L.; Krobel, R.; McConkey, B.G.; Smith, E.G.; Lafond, G.P. Comparison of DayCent and DNDC models: Case studies using data from long-term experiments on the Canadian prairies. In Advances in Agricultural Systems Modeling (volume 6); Del Grosso, S.J., Ahuja, L.R., Parton, W.J., Eds.; ASA, CSSA, SSSA: Madison, WI, USA, 2015. [Google Scholar] [CrossRef]
  86. Jiang, Q.; Qi, Z.; Madramootoo, C.A.; Smith, W.; Abbasi, N.A.; Zhang, T. Comparison of rzwqm2 and dndc models to simulate greenhouse gas emissions under combined inorganic/organic fertilization in a subsurface-drained field. Trans. ASABE. 2020, 63, 771–787. [Google Scholar] [CrossRef]
  87. Uzoma, K.C.; Smith, W.; Grant, B.; Desjardins, R.L.; Gao, X.; Hanis, K.; Tenuta, M.; Goglio, P.; Li, C. Assessing the effects of agricultural management on nitrous oxide emissions using flux measurements and the DNDC model. Agric. Ecosyst. Environ. 2015, 206, 71–83. [Google Scholar] [CrossRef]
  88. Zhang, Y.; Niu, H. The development of the DNDC plant growth sub-model and the application of DNDC in agriculture: A review. Agric. Ecosyst. Environ. 2016, 230, 271–282. [Google Scholar] [CrossRef]
  89. Guest, G.; Krobel, R.; Grant, B.; Smith, W.; Sansoulet, J.; Pattey, E.; Desjardins, R.; Jego, G.; Tremblay, N.; Tremblay, G. Model comparison of soil processes in eastern Canada using DayCent, DNDC and STICS. Nutr. Cycl. Agroecosystems 2017, 109, 211–232. [Google Scholar] [CrossRef]
  90. Allen, R.G.; Pereira, L.S.; Raes, D.; Smith, M. Crop evapotranspiration: Guidelines for computing crop water requirements. In Irrigation and Drainage Paper No. 56; United Nations FAO: Rome, Italy, 1998. [Google Scholar]
  91. Khalil, M.J.; Fornara, D.A.; Osborne, B. Simulation and validation of long-term changes in soil organic carbon under permanent grassland using the DNDC model. Geoderma. 2020, 361, 114014. [Google Scholar] [CrossRef]
  92. Xu, S.; Shi, X.; Zhao, Y.; Yu, D.; Wang, S.; Tan, M.; Sun, W.; Li, C. Spatially explicit simulation of soil organic carbon dynamics in China’s paddy soils. CATENA 2012, 92, 113–121. [Google Scholar] [CrossRef]
  93. Duo, F.; Wight, J.P.; Wilson, L.T.; Storlien, J.O.; Hons, F.M. Simulation of biomass yield and soil organic carbon under bioenergy sorghum production. PLoS ONE 2014. [Google Scholar] [CrossRef] [Green Version]
  94. Gross, A.; Glaser, B. Soil organic carbon change upon manure application to agricultural soils—Which factors do really matter: A meta-analysis. In Review.
  95. Baker, J.M.; Ochsner, T.E.; Venterea, R.T.; Griffis, T.J. Tillage and soil carbon sequestration–what do we really know? Agric. Ecosyst. Environ. 2007, 118, 1–5. [Google Scholar] [CrossRef]
Figure 1. Denitrification decomposition (DNDC) model prediction of soil organic carbon (SOC) values in a Default and Calibrated capacity relative to observed values. The diagonal line indicates a slope of 1.
Agronomy 11 00484 g001
Figure 2. Denitrification decomposition (DNDC) model prediction of biomass C (yield) values in a Default and Calibrated capacity relative to observed values. The diagonal line indicates a slope of 1.
Agronomy 11 00484 g002
Figure 3. Denitrification decomposition (DNDC) model prediction of cumulative N mineralization in a Default and Calibrated capacity relative to observed values. The diagonal line indicates a slope of 1.
Agronomy 11 00484 g003
Figure 4. Denitrification decomposition (DNDC) model prediction of soil water contents, 0–15 cm, in a Default and Calibrated capacity relative to observed values. The diagonal line indicates a slope of 1.
Agronomy 11 00484 g004
Figure 5. Denitrification decomposition (DNDC) model prediction of actual evapotranspiration (AET) in a default and initially calibrated capacity relative to values estimated by ETIdaho, a multi-crop evapotranspiration estimator for Idaho. The diagonal line indicates a slope of 1.
Agronomy 11 00484 g005
Figure 6. Denitrification decomposition (DNDC) model prediction of soil organic carbon (SOC) stocks under “high” and “low” emission projections for select treatments until 2050. Models were forecast in the Calibrated state.
Agronomy 11 00484 g006
Table 1. Soil organic carbon contents obtained from fall soil sampling from 0–30 cm. Soil organic carbon contents were calculated on an area basis using assumed bulk densities of 1.28 g cm3 and 1.37 g cm3 for 0–15 cm and 15–30 cm depths, respectively 1,2.
Total Soil Organic Carbon 0–30 cm
Treatment20122013201420152016201720182019
––––––––––––––––––––––––––– Mg ha−1 –––––––––––––––––––––––––––
CoverCrop
CT-M-F---27.2 a37.5 ab49.3 a57.8 a66.5 a
CT-M-T---28.8 a39.0 a51.0 a50.8 a66.8 a
CT-NM-F---26.2 a28.8 c29.8 b29.0 b35.3 b
CT-NM-T---26.7 a28.6 c31.4 b29.6 b35.5 b
MT-M-F---26.8 a37.3 ab47.2 a59.8 a69.9 a
MT-M-T---25.2 a37.1 ab48.9 a58.5 a89.6 a
MT-NM-F---25.9 a30.8 bc29.2 b29.2 b33.0 b
MT-NM-T---25.1 a29.2 c27.9 b30.2 b34.4 b
p 0.63<0.001<0.001<0.001<0.001
GRACEnet
Control38.5 a38.1 bc37.9 c42.5 b40.5 b39.6 b41.8 b42.2 c
Fall compost39.2 a42.0 abc44.1 b43.8 b43.8 ab42.8 b46.9 ab49.0 bc
Fall manure40.5 a47.5 ab54.2 a60.7 a52.5 a49.5 a53.8 a72.2 a
Spr manure39.1 a48.7 a52.1 a60.6 a55.2 a52.4 a54.0 a61.1 ab
Spr super-U44.3 a36.6 c40.3 bc41.9 b37.3 b40.2 b42.9 b41.9 c
Spr urea37.8 a41.4 abc39.0 c40.3 b39.1 b40.9 b41.9 b43.0 c
p0.080.01<0.001<0.001<0.001<0.001<0.001<0.001
LT manure
18A40.8 a36.6 bcd42.5 abc51.5 abc38.9 bc45.3 bcd41.6 b55.4 bc
18B41.4 a39.4 abcd36.8 bc42.4 cd37.5 bc38.6 de37.8 b48.8 c
36A43.2 a40.3 abcd45.9 ab58.3 ab54.8 a57.7 ab45.5 ab67.5 ab
36B40.4 a43.9 abc40.9 bc45.3 bcd38.4 bc44.2 cd41.2 b51.9 c
52A38.7 a49.9 a53.9 a69.7 a57.5 a67.9 a59.8 a83.7 a
52B40.9 a44.9 ab40.0 bc69.2 a47.0 ab54.0 abc43.1 ab67.9 ab
Control40.9 a33.5 d35.3 c37.4 d33.5 c34.0 e37.7 b39.4 d
Fertilizer39.3 a35.3 cd35.4 c37.8 d34.7 c34.5 e37.9 b41.5 d
p0.29<0.001<0.001<0.001<0.001<0.001<0.001<0.001
1 Values within each column and site containing the same letter are not significantly different at the α = 0.05 level by Tukey’s multiple range test. The p-values at the bottom of each column reflect the F-statistic of the overall ANOVA. 2 Cover Crop treatments: CT-M-F, conventional tillage-manure application-fallow; CT-M-T, conventional tillage-manure application-triticale; CT-NM-F, conventional tillage-no manure-fallow; CT-NM-T, conventional tillage-no manure-triticale; MT-M-F, Minimum-till-manure application-fallow; MT-M-T, Minimum-till-manure application-triticale; MT-NM-F, Minimum-till-no manure-fallow; MT-NM-T, Minimum-till-no manure-triticale. Treatments with manure were applied annually at a target rate of 52 Mg ha−1 on a dry weight basis. GRACEnet treatments: Control, no synthetic fertilizer or manure; Fall compost, composted dairy manure applied in the Fall; Fall manure, dairy manure applied in the Fall; Spr manure, dairy manure applied in the Spring; Spr super-U, Super-U applied annually in the spring based on soil test N; Urea, Urea applied annually in the spring based on soil test N. Compost and manure applications were made on a dry weight basis according to crop rotation at target application rates of 33 Mg ha–1 and 52 Mg ha–1, respectively. LT manure treatments: 18A, dairy manure applied annually at a rate of 18 Mg ha–1; 18B, dairy manure applied biennially at a rate of 18 Mg ha–1; 36A, dairy manure applied annually at a rate of 36 Mg ha–1; 36B, dairy manure applied biennially at a rate of 36 Mg ha–1; 52A, dairy manure applied annually at a rate of 52 Mg ha–1; 52B, dairy manure applied biennially at a rate of 52 Mg ha–1; Control, no synthetic fertilizer or manure; Fertilizer, synthetic fertilizer. All target manure application rates are on a dry weight basis.
Table 2. Manure carbon inputs and biomass carbon removed from yield and residues where applicable 1.
Applied Manure-CBiomass-C Removed
20122013201420152016201720182019Cumulative20122013201420152016201720182019Cumulative
CoverCrop––––––––––––––––––––––––––– Mg ha–1 –––––––––––––––––––––––––––
CT-M-F---14.9216.709.178.8810.8460.51----8.269.127.467.1932.03
CT-M-T---14.3017.169.258.1910.8359.73----8.0613.358.039.6139.05
CT-NM-F-------------8.648.977.226.8631.69
CT-NM-T-------------8.049.777.807.3632.98
MT-M-F---14.7216.949.008.1810.8559.68----8.478.967.647.2632.32
MT-M-T---15.5017.459.898.5610.8462.24----8.3412.548.249.4538.57
MT-NM-F-------------8.067.877.656.7630.33
MT-NM-T-------------8.658.677.616.9831.91
GRACEnet
Control----------9.293.722.795.676.0810.84-38.39
Fall compost2.983.38---3.301.78-11.45-8.284.293.306.286.889.13-38.16
Fall manure15.9715.45---9.267.99-48.67-8.136.213.416.347.1210.54-41.75
Spr manure-7.9313.22---5.1010.0636.30-8.184.993.566.206.788.91-38.61
Spr super-U----------8.915.773.246.246.5410.99-41.69
Spr urea----------9.006.063.176.086.8011.69-42.78
LT manure
18A4.946.403.754.023.372.802.172.1029.54-2.904.016.207.265.644.186.6336.81
18B4.94-3.75-3.37-2.17-14.22-2.664.026.147.965.583.806.2936.46
36A9.9412.897.548.106.785.634.364.2359.46-3.013.786.387.275.133.626.5335.71
36B9.94-7.54-6.78-4.36-28.61-2.554.006.247.765.824.346.7037.41
52A14.8719.3011.2912.1210.148.436.536.3389.00-2.833.266.928.205.573.645.6136.03
52B14.87-11.29-10.14-6.53-42.83-2.524.306.796.965.834.596.0537.04
Control----------2.403.613.906.632.783.472.9525.74
Fertilizer----------2.434.295.658.085.823.895.7235.88
1Cover Crop treatments: CT-M-F, conventional tillage-manure application-fallow; CT-M-T, conventional tillage-manure application-triticale; CT-NM-F, conventional tillage-no manure-fallow; CT-NM-T, conventional tillage-no manure-triticale; MT-M-F, Minimum-till-manure application-fallow; MT-M-T, Minimum-till-manure application-triticale; MT-NM-F, Minimum-till-no manure-fallow; MT-NM-T, Minimum-till-no manure-triticale. Treatments with manure were applied annually at a target rate of 52 Mg ha−1 on a dry weight basis. GRACEnet treatments: Control, no synthetic fertilizer or manure; Fall compost, composted dairy manure applied in the Fall; Fall manure, dairy manure applied in the Fall; Spr manure, dairy manure applied in the Spring; Spr super-U, Super-U applied annually in the spring based on soil test N; Urea, Urea applied annually in the spring based on soil test N. Compost and manure applications were made on a dry weight basis according to crop rotation at target application rates of 33 Mg ha–1 and 52 Mg ha–1, respectively. LT manure treatments: 18A, dairy manure applied annually at a rate of 18 Mg ha–1; 18B, dairy manure applied biennially at a rate of 18 Mg ha–1; 36A, dairy manure applied annually at a rate of 36 Mg ha–1; 36B, dairy manure applied biennially at a rate of 36 Mg ha–1; 52A, dairy manure applied annually at a rate of 52 Mg ha–1; 52B, dairy manure applied biennially at a rate of 52 Mg ha–1; Control, no synthetic fertilizer or manure; Fertilizer, synthetic fertilizer. All target manure application rates are on a dry weight basis.
Table 3. Slope estimate and confidence interval for simple linear regressions fit to observed annual mean soil organic carbon contents, 0–30 cm 1.
Slope
TreatmentEstimateC.I. 2.5%C.I. 97.5%p > F
CoverCrop––––––––––––––––––––––– Mg ha–1 year−1 ––––––––––––––––––––––
CT-M-F9.98.111.7<0.001
CT-M-T8.87.010.6<0.001
CT-NM-F1.80.82.9<0.010
CT-NM-T1.90.82.9<0.010
MT-M-F10.98.313.4<0.001
MT-M-T15.012.217.8<0.001
MT-NM-F1.20.32.2<0.050
MT-NM-T1.91.22.7<0.001
GRACEnet
Control0.6<0.11.1<0.050
Fall compost1.10.61.6<0.001
Fall manure2.81.44.1<0.001
Spr manure2.11.32.9<0.001
Spr super-U0.1–0.50.80.719
Spr urea0.50.10.9<0.050
LT manure
18A1.50.52.4<0.010
18B0.5–0.31.30.188
36A2.71.34.1<0.001
36B0.80.01.70.061
52A4.73.16.3<0.001
52B2.40.74.0<0.010
Control0.0–0.60.70.905
Fertilizer0.3–0.20.70.273
1Cover Crop treatments: CT-M-F, conventional tillage-manure application-fallow; CT-M-T, conventional tillage-manure application-triticale; CT-NM-F, conventional tillage-no manure-fallow; CT-NM-T, conventional tillage-no manure-triticale; MT-M-F, Minimum-till-manure application-fallow; MT-M-T, Minimum-till-manure application-triticale; MT-NM-F, Minimum-till-no manure-fallow; MT-NM-T, Minimum-till-no manure-triticale. Treatments with manure were applied annually at a target rate of 52 Mg ha–1 on a dry weight basis. GRACEnet treatments: Control, no synthetic fertilizer or manure; Fall compost, composted dairy manure applied in the Fall; Fall manure, dairy manure applied in the Fall; Spr manure, dairy manure applied in the Spring; Spr super-U, Super-U applied annually in the spring based on soil test N; Urea, Urea applied annually in the spring based on soil test N. Compost and manure applications were made on a dry weight basis according to crop rotation at target application rates of 33 Mg ha–1 and 52 Mg ha–1, respectively. LT manure treatments: 18A, dairy manure applied annually at a rate of 18 Mg ha–1; 18B, dairy manure applied biennially at a rate of 18 Mg ha–1; 36A, dairy manure applied annually at a rate of 36 Mg ha–1; 36B, dairy manure applied biennially at a rate of 36 Mg ha–1; 52A, dairy manure applied annually at a rate of 52 Mg ha–1; 52B, dairy manure applied biennially at a rate of 52 Mg ha–1; Control, no synthetic fertilizer or manure; Fertilizer, synthetic fertilizer. All target manure application rates are on a dry weight basis.
Table 4. Overall denitrification decomposition (DNDC) model goodness of fit statistics for each location. Overall location statistics were calculated using data from all treatments, in the case of mean absolute error (MAE), this is the mean of all treatments 1.
PBIASNSEMAE
DefaultCalibratedDefaultCalibratedDefaultCalibrated
––––––––––––––––– Soil Organic Carbon, Mg ha−1 –––––––––––––––––
CoverCrop−9.8−14.40.590.485.086.06
GRACEnet−6.9−3.90.450.764.742.75
LT manure0.62.90.740.734.124.36
–––––––––––––––– Biomass Carbon (yield), Mg ha−1 ––––––––––––––––
CoverCrop4.15.00.840.920.990.58
GRACEnet−32.68.3−0.690.702.621.13
LT manure−14.4−4.40.730.850.670.49
–––––––––––––––– Nitrogen Mineralization, kg ha−1 ––––––––––––––––
CoverCrop−10.020.20.370.135161
GRACEnet−42.4−33.70.330.545948
LT manure−30.96.20.700.9212159
––––––––––––––––––––––– Soil Water, Θv –––––––––––––––––––––––
CoverCrop34.127.9−4.72−3.490.090.08
GRACEnet46.19.4−2.03−0.030.110.06
LT manure14.34.2−0.73−1.070.080.09
–––––––––––– Estimated Actual Evapotranspiration, mm ––––––––––––
CoverCrop−44.5−43.7−1.17−1.11244240
GRACEnet−37.4−34.0−1.92−1.55303275
LT manure−14.3−7.90.250.5915080
1Cover Crop treatments: CT-M-F, conventional tillage-manure application-fallow; CT-M-T, conventional tillage-manure application-triticale; CT-NM-F, conventional tillage-no manure-fallow; CT-NM-T, conventional tillage-no manure-triticale; MT-M-F, Minimum-till-manure application-fallow; MT-M-T, Minimum-till-manure application-triticale; MT-NM-F, Minimum-till-no manure-fallow; MT-NM-T, Minimum-till-no manure-triticale. Treatments with manure were applied annually at a target rate of 52 Mg ha–1 on a dry weight basis. GRACEnet treatments: Control, no synthetic fertilizer or manure; Fall compost, composted dairy manure applied in the Fall; Fall manure, dairy manure applied in the Fall; Spr manure, dairy manure applied in the Spring; Spr super-U, Super-U applied annually in the spring based on soil test N; Urea, Urea applied annually in the spring based on soil test N. Compost and manure applications were made on a dry weight basis according to crop rotation at target application rates of 33 Mg ha–1 and 52 Mg ha–1, respectively. LT manure treatments: 18A, dairy manure applied annually at a rate of 18 Mg ha–1; 18B, dairy manure applied biennially at a rate of 18 Mg ha–1; 36A, dairy manure applied annually at a rate of 36 Mg ha–1; 36B, dairy manure applied biennially at a rate of 36 Mg ha–1; 52A, dairy manure applied annually at a rate of 52 Mg ha–1; 52B, dairy manure applied biennially at a rate of 52 Mg ha–1; Control, no synthetic fertilizer or manure; Fertilizer, synthetic fertilizer. All target manure application rates are on a dry weight basis.
Publisher’s Note: MDPI stays neutral with regard to jurisdictional claims in published maps and institutional affiliations.

