Article

Comparison of the Impact of Different Types of nZVI on Lolium westerwoldicum

by
Lidia Mielcarz-Skalska
1,*,
Beata Smolińska
1 and
Małgorzata Szynkowska-Jóźwik
2
1
Institute of Natural Products and Cosmetics, Faculty of Biotechnology and Food Science, Lodz University of Technology, Stefanowskiego 4/10, 90-924 Lodz, Poland
2
Surface and Track Analysis Laboratory, Institute of General and Ecological Chemistry, Faculty of Chemistry, Lodz University of Technology, 90-924 Lodz, Poland
*
Author to whom correspondence should be addressed.
Agronomy 2021, 11(3), 467; https://doi.org/10.3390/agronomy11030467
Submission received: 27 January 2021 / Revised: 19 February 2021 / Accepted: 26 February 2021 / Published: 3 March 2021
(This article belongs to the Section Agricultural Biosystem and Biological Engineering)

Abstract

:
Increasing environmental pollution causes the search for new methods of purification. Currently, the remediation potential of nanoparticles is increasingly being studied. Unfortunately, there is still a lack of data on the impact of these compounds on living organisms, including plants. This study was designed to test the effects of nanoFER 25 and nanoFER 25S iron on Lolium westerwoldicum Breakw. After cultivation of plants in a soil contaminated with nanoparticles, the biometric parameters, content of polyphenols, flavonoids, chlorophyll changes, carotenoids, anthocyanins, superoxide dismutase, catalase and pyrogallol peroxidase were studied. The conducted experiment showed that nano zero-valent iron (nZVI) is slightly taken from the soil to the plants. The iron passes to the root but there is no further transport up the plant. The content of polyphenols and flavonoids in aboveground parts of plants decreases with a simultaneous increase in roots compared to the control sample. The chlorophyll content in the leaves is strongly related to the concentration of the contaminant. Similarly, the enzyme activity of the antioxidant system in the whole plant is strongly related to the concentration of the pollutant. The amount of vegetable pigments in the leaves increases for low concentrations of contamination and then decreases at higher levels of contamination. The study has shown that both types of nanoFER are not indifferent to the plants’ growth.

1. Introduction

Currently, one of the biggest problems of modern science is environmental pollution. The increasing number of landfills, production plants, oil fields, mines and industrial plants causes more pollution enter the ecosystem. One of the biggest threats is the insertion of harmful compounds into the soil and further into aquifers [1,2].
A relatively new solution is the use of nanoremediation. This method involves the use of very small particles, at the nanoscale, that allow detection, prevention and monitoring of pollution. However, the direct application of nanoremediation, understood as insertion of nanomaterials into the contaminated environment, is not always fully studied [1,3].
The last few years have brought a lot of reports about the high efficiency of nano zero-valent iron (nZVI) used for the purification of soil and water environments from heavy metals and other pollutants. Many potential applications in which nZVI can be used for remediation will probably be based on the continuous use of microorganisms and plants [4].
The small size of nZVI is a guarantee of its high reactivity and mobility, greater than molecular forms. In addition, concentrated nZVI suspensions are directly injected into the soil near the pollution, and there is no need for additional measures (e.g., excavations). As a result, nZVI is considered as a promising remediation strategy for a wide range of applications and environments [5].
nZVI consists of a zero-valent iron, around which there is an oxide-iron coating. In addition, nZVI can be coated with polymers, surfactants or polyelectrolytes. It has been proven that uncoated nanoparticles aggregate quickly, which results in the reduction of their active surface area and hence also in reactivity. Molecular coatings are designed to stop this process and increase the stability of nZVI suspensions [6].
Fe0’s surface quickly undergoes an oxidation reaction to hydroxides or oxyhydroxides. This metal form (Fe0) is stable only under reducing conditions. The formation of the iron oxide shell reduces the reactivity of nZVI. The removal of impurities by nZVI under aerobic conditions may be stopped due to a limited amount of remaining Fe0. An additional problem is the water environment, where iron can corrode. Under anaerobic conditions, Fe0 is oxidized by two reactions: with pollution and with water. In most of the contaminated sources nZVI will probably be transformed from Fe0 to Fe2+, and further to Fe3+. The Fe2+ form is the most toxic to microorganisms and invertebrates, but quickly transforms into Fe3+ in a neutral and alkaline pH [1,6,7].
All these factors make a necessity to carry out thorough research both on the behavior of nZVI in the environment and its effect on living organisms. The use of nZVI for phytoremediation purposes should be preceded by investigation of its phytotoxicity.
Due to the increasing use of nanoparticles, it is necessary to study their impact on living organisms, including plants. The new types of soil fertilizers have been extensively searched to improve agricultural production. Iron, as an essential element for plants, exists in soil mainly in the form of its cation Fe3+, and in that form is mostly unavailable for plants. Moreover, Fe concentration in soil is usually high, but a large proportion is fixed to soil particles which results in its lowered bioavailability [8]. The main hypothesis of the work is the analysis of possibility of nZVI use in soil fertilization. However, that kind of investigation has to be preceded by detailed studies of nZVI effects on the plant growth. Therefore, the aim of the experiment was to investigate the phytotoxicity of nZVI in the form of nanoFER 25 and nanoFER 25S to Lolium westerwoldicum Breakw. The influence of nZVI in both forms on plant biometric parameters, chlorophyll content and chosen elements of plant antioxidant systems was examined.

2. Materials and Methods

2.1. Pot Experiment

L. westerwoldicum was cultivated in the soil, whose characteristics are presented in Table 1. nZVI, in the forms of 25 nanoFER and 25S nanoFER which were used in the study, was purchased from Nano Iron (Rajhrad, Czech Republic). NanoFER 25 consists of iron (Fe) at 14–18% of weight content; 2–6% weight content of iron oxide (Fe3O4), 0–1% weight content of carbon (C) and water at 80% of weight content. The composition of nanoFER 25S is as follows (in % of weight content): 14–18% of Fe, 2–6% of Fe3O4, 0–1% of C, 77% of water and 3% of surfactants [9]. NanoFER 25, used in the study, is a reactive aqueous dispersion of Fe (0) nanoparticles without any organic or inorganic modifications. It is characterized by high reactivity, a high degree of agglomeration and fast sedimentation. NanoFER 25S is a water dispersion of Fe (0) nanoparticles with biodegradable organic surface modification. Both forms are black with a size < 50 nm, specific surface > 25 m2/g and a pH of 11–12 [9]. The 25 nanoFER and 25S nanoFER were introduced into the soil as a liquid, separately, in concentrations of 0.5; 1; 5; 10; 50 and 100 g kg−1 of dry weight of soil, respectively. Soil supplemented by nZVI was homogenized and left for stabilization for 4 h. Soil without nZVI was determined as the control. The whole investigation was conducted on thirteen variants, each in triplicate.
L. westerwoldicum seeds (KUDO, Pszczyna, Polska) were introduced on the surface of control and contaminated soil samples in the amount of 0.5 g per kg of dry weight of soil. L. westerwoldicum plants were cultivated for 6 weeks in a green house in a day/night system of 14/10 h, average day/night temperature of 22/19 °C and air humidity of 50%. During the growth period plants were watered with deionized water in the amount suitable for keeping soil humidity at the level of 35%. After the cultivation process, plants were harvested, watered with deionized water to remove soil particles, weighed and subjected to further analysis.

2.2. Determination of Iron Content in Plants

Determination of Fe concentration in the plants was made by atomic absorption spectrometry (AAS) (Absorption Atomic Spectrophotometer, GBC 932, (GBC Scientific Equipment Ltd., Dandenong, VIC, Australia)), by the flame method with acetylene oxygen gas, at detection level 2–9 µg/mL, after microwave mineralization. Microwave mineralization was conducted in a Magnum II by ERTEC (ERTEC-Poland Dr Edward Reszke, Wrocław, Poland). The sample was flooded with 6 mL of 65% nitric acid (V) and placed in the apparatus for 5 min at 85% power, then 30 s for a break, and another 10 min at 60% power. Finally, it was cooled for 10 min and poured into a flask through a filter.

2.3. Biometric Parameters

Biometric parameters of L. westerwoldicum were determined on five representative plants chosen randomly from the pots of each variant of experiment in accordance with the procedure described by Wulfsohn (2010) [10]. The length of whole plant and the length of below and above ground parts of L. westerwoldicum were measured.

2.4. Plant Pigments Analysis

Determination of chlorophyll a, b, total carotenoids and anthocyanins was provided according to Israelstam and Hiscox (1979) [11]. 0.1 g of aboveground plant tissue was mixed with 2.5 mL dimethyl sulfoxide (DMSO). The samples were incubated in room temperature for 1 h in the darkness and after that were subjected to a water bath at 65 °C for 30 min. Amounts of chlorophyll a, b and carotenoids were determined on a UV/VIS8453 spectrophotometer Spectroquant Nova 400 (Merck KGaA, Darmstadt, Germany) at the following wavelengths: 663 nm (chlorophyll a), 645 nm (chlorophyll b), 470 nm (carotenoids) and 534 nm (anthocyanins). The content of plant pigments was calculated according to the Arnon formula (1949) [12] with modification by Richardson et al. (2002). The amount of individual pigments was given in mg/g of fresh weight of the plant [13].

2.5. Determination of Polyphenols

Analysis of total polyphenol content in aboveground plant tissues was carried out according to the procedure described by Meng et al. (2009) [14]. 0.5 g of plant tissue were homogenized with a 5 mL of 80% methanol. The samples were then centrifuged for 20 min at 15,000 rpm. The test sample contained 50 μL of extract, 3.85 mL of distilled water, 100 μL of Folin reagent (incubation for 3 min at room temperature) and 1 mL of 10% Na2CO3. The samples were mixed and incubated in the dark for 60 min at room temperature. After this time, the absorbance at 725 nm was measured. Polyphenol content was calculated on the basis of a standard curve. A methanol solution of gallic acid was used as a reference. The total content of polyphenols was determined as the amount of gallic acid equivalents per gram of fresh weight of the plant (mg GAE g−1 of m.).

2.6. Determination of Flavonoids Content

Determination of flavonoids in L. westerwoldicum was based on the procedure described by Lamaison and Carnat (1990) [15]. 1 g of plant by fresh weight was homogenized with 5 mL of 80% methanol and shaken for 1 h at room temperature. The total flavonoid content was determined using a colorimetric method with aluminum chloride (AlCl3). After 30 min of incubation at room temperature, the absorbance of the sample was tested and, without the presence of extract, was measured at a wavelength of 425 nm. The content of flavonoids was expressed on the basis of the calibration curve as mg of quercetin per 1 g of fresh weight of the plant (mg QE/g fresh weight) [16].

2.7. Antioxidant Enzymes Assey

The studies were carried out to determine the superoxide dismutase (SOD) activity, pyrogallol peroxidase (POD) activity and catalase (CAT) activity.
The SOD activity was tested in accordance to Roth et al (1984) [17]. 50 μL of plant extract was mixed with 1 mL of TRIS-EDTA buffer at pH 8.2 and 1 mL of 0.2 mM pyrogallol solution. The control sample contained 50 μL of distilled water instead of the plant extract. Absorbance was measured 10 min after addition of pyrogallol at 420 nm [16]. The SOD activity was calculated according to the formula:
%   i n h i b i t i o n   o f   p y r o g a l l o l   a u t o x i d a t i o n = Δ A   t e s t ÷   Δ A   c o n t r o l × 100 %
S O D   a c t i v i t y   U ÷ g   f . m . = %   i n h i b i t i o n   o f   p y r o g a l l o l   a u t o x i d a t i o n   ÷ 50 %
Determination of POD activity was prepared according to the method of Chance and Maehly (1955) [18]. 1 g of the sample was homogenized with an acetate buffer at pH 5.6, shaken for 30 min and then centrifuged. 100 μL of the supernatant was collected and mixed with 0.9 mL of acetate buffer at pH 5.6, 0.5 mL of pyrogallol and 0.5 mL of H2O2. The samples were incubated for 4 min at 30 degrees Celsius and then the absorbance was measured at 470 nm. The measure of enzyme activity is the difference between absorbance with H2O2 and without H2O2 expressed in mol/g f.m. Analysis of CAT activity was carried out according to Jiang and Zhang (2002) [19]. 20 mg of plant tissue was mixed with 800 μL of phosphate buffer (pH 7.0) and then the mixture was shaken for 30 min. The samples were then centrifuged and the filtrate was collected. 3 mL of extraction buffer containing 20 mM of H2O2, 2 mM of phosphate buffer (pH 7.0) and 1 mL of enzyme extract were poured into the tube. The time needed to change the value by 0.05 units at 240 nm was measured on the spectrophotometer. The enzyme unit is the amount of enzyme that is able to raise the absorbance by 0.05 units within 1 min (U/g f.m).

2.8. SEM

The study was performed on a scanning electron microscope with X-ray microanalysis (SEM-EDS) (HITACHI S-4700, EDS Thermo NORAN). The sample was dried in the air to obtain a constant mass. Before SEM imaging, the samples were sprayed with a thin layer of activated carbon and placed under a microscope. Imaging was carried out at a magnification of 5000 times. Imaging was carried out for all variants of the experiment in duplicate.

2.9. Statistical Analysis

The results presented in tables and figures are the mean values of five replicates with standard deviation. Significant differences between the treatments were performed using the Anova test in R-Studio. The LSD test (Fisher test) was used. Differences were considered as statistically significant when the p-value was <0.05.

3. Results and Discussion

3.1. Analysis of Biometric Parameters

In all tested concentrations of 25 nZVI samples, a decrease in the mass of plants (Table 2) was observed (by as much as 67% for 100 g) compared to the control. At the same time, for concentrations of 0.5, 1 and 5 g of nZVI the root and leaf mass increased slightly (12–26%, compared to the control). In the case of 25S nZVI, concentrations of 0.5, 50 and 100 g caused a significant increase in both whole-plant biomass and their roots and leaves. Both 25 and 25S nZVI had a stimulating effect on the growth of the entire plant (Table 3), especially on the leaf. The best effect (compared to the control) was observed for leaves at concentrations of 0.5 g of 25 nZVI (140%) and 10 g of 25 nZVI (127%). The results obtained for the shoots and roots were: 0.5 g–128%, 100 g–155% and 0.5 g–84%, 100 g–88% respectively. Similar research was carried out by Wang et al. (2016) on rice (Oryza sativa L.). After two weeks of exposure to concentrations of 500, 750 and 1000 mg of nZVI/kg, they observed chlorosis and much smaller growth of seedlings. In addition, the study showed a decrease in root and shoot length by 46.9 and 57.5% for a concentration of 1000 mg/kg. In the case of fresh mass, researchers observed a decrease of 46.8% (root) and 22.8% (shoots) at the same concentration of nZVI [20].
Ma et al. (2013) observed toxicity symptoms in the case of Typha latifolia. Plants growing in the nZVI-contaminated environment at concentrations higher than 200 mg/L were significantly shorter than the control group, while nZVI (<50 mg/L) had a stimulating effect on the growth of broadleaf parts. Plants treated with 200 mg of nZVI/L had many dry leaves and were characterized by lower biomass than control plants (for concentration of 1000 mg/L biomass was 6.93% lighter). The higher the dose of soil amendment the longer were the roots of T. latifolia [21]. El-Temsah et al. (2010) observed first negative reactions for germinating seeds in the absence of soil at 250 mg/L, where the growth of flax shoots and the growth of barley roots decreased. At higher concentration levels all species (flax, barley and ryegrass) and all parameters showed a negative effect of nZVI on plants. In the case of soil, a negative effect was observed on all species and all parameters at a concentration of 300 mg nZVI/L in soil water [4]. Marusenko and others (2013) showed that A. thaliana plants grown with a presence of nanoparticle hematite (NP) showed visible signs of Fe deficiency. Plants cultivated with NP-Fe did not grow as large, contained less chlorophyll and had lower internal concentrations of Fe than plants grown with EDTA-Fe [22].

3.2. Iron Content and SEM Imaging

The iron content in the leaves of the tested plants (Figure 1i) when using nZVI was at a similar level regardless the variant. The exception was the concentration of 100 g of nZVI/kg soil. The leaves contained different amounts of 25S nZVI and the content of nZVI in the roots increased with the increase of the concentration of soil amendment. At concentrations of 0.5–5 g nZVI/kg soils the level of amendment in the root (Figure 1ii) was at a similar level as in the control. SEM imaging showed that while a small amount of iron could be detected in the root (Figure 2), the presence of this element was not observed in the leaves (Figure 3).
According to Fajardo et al. (2015) nZVI has no negative impact on soil and has the ability to increase the bioavailability of iron [2]. Martínez-Fernández et al. (2016) showed that nZVI adhered to the roots and was not transferred to the shoots, nor even uptaken from the soil. Under the microscope, it was observed that nZVI was present in the outer layers of roots. Researchers suspect that nZVI is unable to penetrate the cell membrane [23]. A study by Gil-Díaz et al. (2015) showed reduction of iron content in leaves [24]. Yirsaw et al. (2016) showed that mixed forms of iron oxides improve remediation processes. Thanks to Fenton’s reaction, iron can remove heavy metals, e.g., by co-precipitation or absorption [25]. Wang et al. (2016) observed that at a concentration of 1000 mg/kg of nZVI soil, total and available iron in the soil was no less than in the case of control. The total iron content in the root was higher than in the shoot. In addition, high doses (500, 750 and 1000 mg/kg of soil) increased its content in the root. SEM imaging showed destruction of the cell wall of the root cells but no nZVI were observed in the vessels of the plant. ESD imaging showed that nanoparticles can pass through the epidermis via apoplastic pathways, but not through the transportable pathway [20]. According to Ma et al. (2012), nZVI penetrates epidermal cells and internalizes poplar cells [21].

3.3. Non-Enzymatic Cell Metabolites—Content of Polyphenols and Flavonoids

The content of polyphenols in the aboveground part (Figure 4i) abruptly drops by about 70% in all variants compared to the control for both types of iron nanoparticles. Both 25 and 25S nZVI cause a significant decrease in the flavonoids content (Figure 4i) in the leaves (by about 30%). The only exception is the concentration of 0.5 g of 25 nZVI, where an increase of 90%, compared to the control, was observed. When using both nanoparticles, the content of polyphenols in the roots, compared to the control, (Figure 4ii) increased sharply by more than 200%. The largest, 13-fold, increase was observed for 0.5 g of 25 nZVI and 8-fold for 1 g of 25S nZVI. The amount of flavonoids in the roots (Figure 4iii), like polyphenols, increased regardless the type of soil amendment. The exceptions were two concentrations of 25 nZVI: 10 g (decrease by 8%) and 100 g (decrease by 7%) compared to the control.
Fazlzadeh et al. (2017) showed that polyphenols have a reducing effect on iron and may prevent its aggregation [26]. This is interesting as the use of nanoparticles and polyphenol complexes can improve environmental remediation processes. This effect was observed by several research groups, including Wang et al. (2014) [27]. However, there are no studies on the non-enzymatic response of plants to nanoparticle iron.

3.4. Plants Pigments—Chlorophyll a and b, Carotenoids and Anthocyanin

The content of chlorophyll a (Figure 5) was reduced by about 20% for 5 and 10 g of nZVI and 10% for 100 g of nZVI, compared to the control. However, for concentrations of 0.5 and 50 g of 25 nZVI an increase in the content of chlorophyll a by 10% was observed. In case of 25S nZVI a slight increase was noticed only at a concentration of 5 g, while the remaining variants of the experiment caused a decrease to 20% for the three highest concentrations. The content of chlorophyll b (Figure 5) for 0.5 g of nZVI/kg of soil increased by 63% and 50 g of nZVI by 40%, compared to the control. Other variants of this type of nanoparticle, as well as all concentrations of 25S nZVI, caused a decrease compared to the control in the content of chlorophyll b.
The content of leaf anthocyanins (Figure 6i) increases by 95% for 5 g of nZVI, 58% for 0.5 g of 25 nZVI and 22% for 10 g of 25S nZVI compared to the control group. In contrast, compared to the control decreases were observed for concentrations of 50 g of nZVI by 20% (25)–30% (25S) and for 100 g of nZVI 35% (25)–57% (25S). The content of carotenoids in the leaves (Figure 6iii), compared to the control, increased by 34% for 0.5 g of 25 nZVI and 14% for 50 g of nZVI. The remaining variants of the experiment showed a decrease in the amount of carotenoids for 25 nZVI, as well as the highest concentrations used for 25S nZVI: 26% for 50 g and 33% for 100 g. The content of anthocyanin in the roots (Figure 6iii) was dependent on the concentration of the contaminant. The highest increase (compared to the control) for 25 nZVI was observed for 100 g (260%) and 0.5 g (128%). The decrease was noticed in only one case, for 50 g of 25 nZVI, by 43%. NanoFER 25S caused an increase in the amount of anthocyanin by up to 248% (5 g) and 317% (50 g). A similar relationship was also observed for the content of carotenoids in the roots (Figure 6ii). 25S nanoparticles caused an increase in all variants of the experiment (up to 280% for 50 g of 25S nZVI) compared to the control. 25 nZVI caused a smaller increase in carotenoid concentration (up to 174% for 100 g), and a decrease in the 50 g variant by 30% compared to the control.
In a study carried out by Wang et al. (2016) a significant decrease in the content of carotenoids was observed; for 1000 mg of nZVI/kg soil amendment, concentration was 85.2%. In addition, a significant decrease in the content of photosynthetic pigments was observed, the highest with soil amendment of 1000 mg of nZVI/kg—91.6% [20]. A similar effect was obtained by Martinez-Fernandez and Komarek (2016), who reported a decrease in chlorophyll a and chlorophyll b in the hydroponic cultivation of Solanum lycopersicum L. contaminated with nZVI [23]. Marusenko et al. (2013) observed that the plants treated with No-Fe and NP-Fe had less chlorophyll than the plants treated with EDTA-Fe. At the same time, visual assessment showed yellow leaves in 95% of plants in No-Fe and NP-Fe treatments, but green leaves in 100% of plants in EDTA-Fe treatment. The researchers suggest that NP Fe was not used to produce chlorophyll [22].

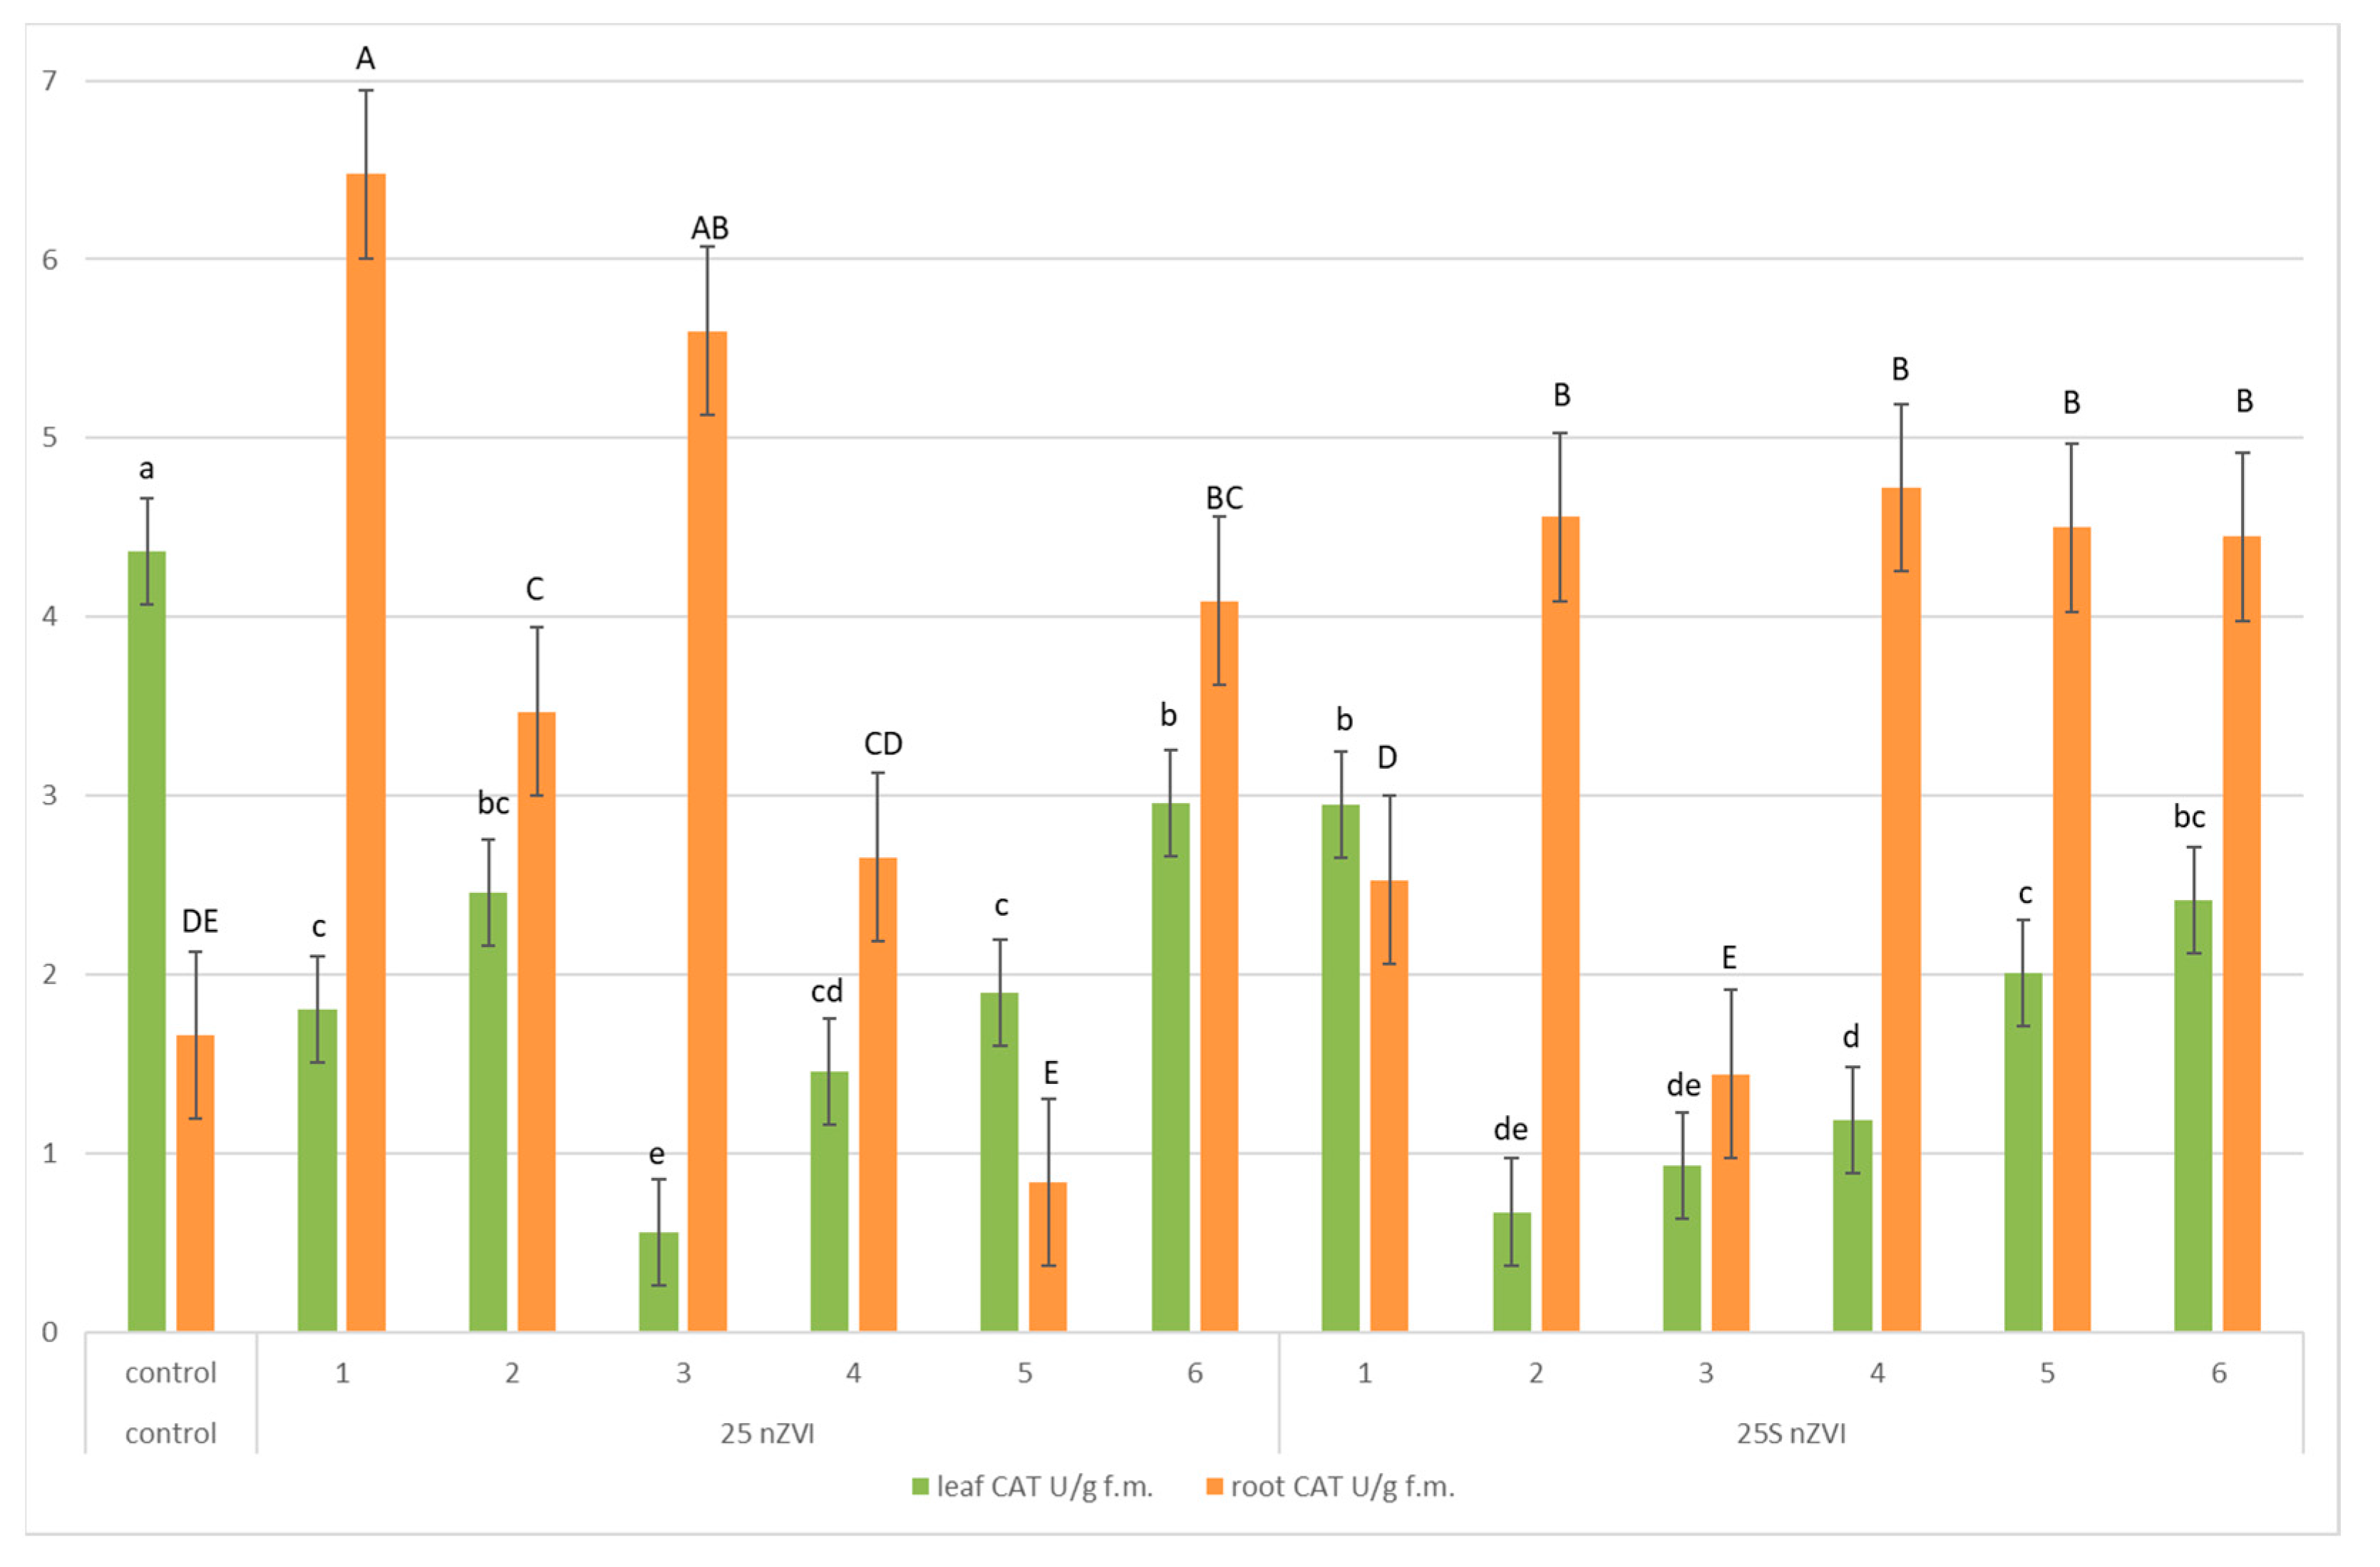
3.5. Enzymes Activities—Pyrogallol Peroxidase (POD), Superoxide Dismutase (SOD) and Catalase (CAT)

The activity of superoxide dismutase in leaves (Figure 7iii) with nZVI increased at a concentration of 10% and decreased by 13% for 0.5 and 50 g (compared to the control). An increase of SOD activity of 21% was observed for 0.5 g of nanoFER using 25S nZVI, and a 14% decrease for 10 g of nanoparticles. The content of catalase activity in the leaves (Figure 8), compared to the control, decreased in all nZVI concentrations used, the least by 32% at 100 g, the highest by 87% at 5 g. A similar situation was observed for 25S nZVI. These nanoparticles also caused a decrease in CAT activity, the lowest by 32% for 0.5 g; the highest by 84%–1 g/kg of dry soil, compared to the control. The strongest effect of iron nanoparticles was observed on pyrogallol peroxidase activity in aboveground parts (Figure 7i). The increase in activity compared to the control was 40–60 fold (less for 25 nZVI). 25 nZVI and 25S nZVI, in all variants of the experiment, had the same effect on pyrogallol peroxidase activity in the roots (decreased) (Figure 7ii) and superoxide dismutase (increased) (Figure 7iv). A different reaction of the plant to concentrations of soil amendment could be observed by examining the content of catalase in the roots (Figure 8). Almost all concentrations caused a significant increase in enzyme activity compared to the control (even by over 200%). The exception was the concentration of 50 g of 25 nZVI (decrease in activity by 50%) and 5 g of 25S nZVI (decrease in activity by 13%).
According to Wang et al. (2016) pollution at 100 mg/kg did not affect the enzymes activity of the antioxidant system in the aboveground parts of rice. The concentration of 250 mg of nanoiron/kg resulted in inhibition of dismutase by about 20–35% and increase in peroxidase activity by 36.6%. The activity of catalase was strongly related to the concentration of soil amendment: for 750 mg/kg it caused a decrease, and 1000 mg/kg increased activity [20]. Wang et al. (2016) also studied the content of enzymes of the antioxidant system in the roots of plants. They concluded that while POD activity increased with incrementing nZVI concentration, SOD and CAT activity decreased. At a concentration of 100 mg of nZVI/kg, SOD, POD and CAT activity were not significantly changed compared to the control. Above 250 mg/kg, SOD activity was significantly inhibited (20.4–35.1%) compared to the control. POD activity was notably promoted (~36.5%), compared to the control, when the nZVI concentration was higher than 250 mg/kg. At low concentrations nZVI did not significantly change the activity of CAT compared to the control, while it was inhibited at a dose of 750 mg/kg and increased for 1000 mg/kg [20]. Wang et al. (2011) studied the activity of SOD and CAT in shoots and roots of ryegrass (Lolium perenne L.) and pumpkin (Cucurbita mixta) treated with molecular and nanoparticular iron. In the case of ryegrass, the activity of SOD in the roots increased by 166, 115 and 110% at concentrations of 30 and 100 mg of Fe3O4 NP/L and 100 mg of molecular Fe3O4/L, compared to the control. The activity of SOD in the ryegrass shoots decreased by 35% and 46% when treated with 100 mg of Fe3O4 NP/L and in the molecular form, respectively. On the other hand, the activity of SOD in pumpkin roots increased at a concentration of 30 mg/L for both forms of Fe3O4, but decreased when treated with 100 mg/L for Fe3O4 NP and particulate. In pumpkins, SOD activity remained unchanged, regardless the concentrations used. CAT activity in the roots of ryegrass increased by 172, 225 and 166%, while it decreased by 40, 75 and 79% in the pumpkin roots, after treatment with 30 and 100 mg of Fe3O4 NP/L and 100 mg of Fe3O4 BP/L. CAT activity in ryegrass and pumpkin shoots increased significantly after treating NP and Fe3O4 in an amount of 30 and 100 mg/L [28].

4. Conclusions

The conducted experiment showed that nZVI is slightly taken from the soil. The iron passes to the root to a small extent and is not transported further in the plant. In the experiment variant in which 100 g of nZVI/kg was added, only 4 and 5 g of nZVI (25 and 25S, respectively) were found in the root. This suggests that iron probably accumulates in the outer layers of the roots or aggregates on their surface and closes further access to the tissues. There is no transport of the nanoFER to the aerial part of the plant or it is negligible. At the same time, it can be observed that nZVI, both in the 25 and 25S form, has no toxic effect on plant growth, albeit it reduces the mass of its tissues. The content of polyphenols and flavonoids in aboveground parts of plants decreases with contaminant increase in roots. It is possible that the plant transports these compounds to tissues that have most frequent contact with contaminants. The chlorophyll content in the leaves is strongly related to the concentration of the nZVI; however, no chlorosis was observed in any variant. Similarly, the enzyme activity of the antioxidant system in the whole plant is strongly related to the concentration of the pollutant. The amount of vegetable pigments in the leaves increases for low extents of soil amendment and then decreases at higher levels of contaminants. What was found interesting was that the amount of anthocyanins in the roots using 25 nZVI was varying. The lowest, as well as the highest, concentration of pollutant caused a significant increase in their content. However, for the concentration of 50 g, a decrease in the anthocyanin content was observed. This can be explained by the fact that the Lolium westerwoldicum initially strengthened its antioxidant system to deal with reactive oxygen species, but then lost this ability with high soil amendment.
Comparing the results obtained with the literature it can be concluded that the effect of nZVI on plants depends on the species and the concentrations used, and it cannot be unambiguously determined whether these nanoparticles are toxic.
The results obtained do not give a definite answer whether the use of nZVI is completely safe for ryegrass (Lolium westerwoldicum). Further research is necessary in this direction.

Author Contributions

Conceptualization, B.S. and L.M.-S.; methodology, B.S. and L.M.-S.; SEM analysis, M.S.-J.; formal analysis, L.M.-S.; resources, B.S. and L.M.-S.; data curation, L.M.-S.; writing—original draft preparation, L.M.-S. and B.S.; writing—review and editing, B.S.; supervision, B.S. All authors have read and agreed to the published version of the manuscript.

Funding

This research received no external funding.

Institutional Review Board Statement

Not applicable.

Informed Consent Statement

Not applicable.

Data Availability Statement

Data available on request due to limitations related to the intellectual property of the Lodz University of Technology.

Acknowledgments

The authors gratefully acknowledge Surface and Track Analysis Laboratory, Institute of General and Ecological Chemistry, Faculty of Chemistry, Lodz University of Technology, Łódź.

Conflicts of Interest

The authors declare no conflict of interest.

References

  1. Patil, S.S.; Shedbalkar, U.U.; Truskewycz, A.; Chopade, B.A.; Ball, A.S. Nanoparticles for environmental clean-up: A review of potential risks and emerging solutions. Environ. Technol. Innov. 2016, 5, 10–21. [Google Scholar] [CrossRef]
  2. Fajardo, C.; Gil-Díaz, M.; Costa, G.; Alonso, J.; Guerrero, A.; Nande, M.; Lobo, M.; Martín, M. Residual impact of aged nZVI on heavy metal-polluted soils. Sci. Total Environ. 2015, 535, 79–84. [Google Scholar] [CrossRef] [PubMed]
  3. Kim, J.-H.; Lee, Y.; Kim, E.-J.; Gu, S.; Sohn, E.J.; Seo, Y.S.; An, H.J.; Chang, Y.-S. Exposure of Iron Nanoparticles to Arabidopsis thaliana Enhances Root Elongation by Triggering Cell Wall Loosening. Environ. Sci. Technol. 2014, 48, 3477–3485. [Google Scholar] [CrossRef] [PubMed]
  4. El-Temsah, Y.S.; Joner, E.J. Impact of Fe and Ag nanoparticles on seed germination and differences in bioavailability during exposure in aqueous suspension and soil. Environ. Toxicol. 2010, 27, 42–49. [Google Scholar] [CrossRef] [PubMed]
  5. Lefevre, E.; Bossa, N.; Wiesner, M.R.; Gunsch, C.K. A review of the environmental implications of in situ remediation by nanoscale zero valent iron (nZVI): Behavior, transport and impacts on microbial communities. Sci. Total Environ. 2015, 565, 889–901. [Google Scholar] [CrossRef] [Green Version]
  6. Schmid, D.; Micić, V.; Laumann, S.; Hofmann, T. Measuring the reactivity of commercially available zero-valent iron nanoparticles used for environmental remediation with iopromide. J. Contam. Hydrol. 2015, 181, 36–45. [Google Scholar] [CrossRef] [PubMed]
  7. Grieger, K.D.; Fjordbøge, A.S.; Hartmann, N.I.B.; Eriksson, E.; Bjerg, P.L.; Baun, A. Environmental benefits and risks of zero-valent iron nanoparticles (nZVI) for in situ remediation: Risk mitigation or trade-off? J. Contam. Hydrol. 2010, 118, 165–183. [Google Scholar] [CrossRef] [PubMed]
  8. Rui, M.; Ma, C.; Hao, Y.; Guo, J.; Rui, Y.; Tang, X.; Zhao, Q.; Fan, X.; Zhang, Z.; Hou, T.; et al. Iron Oxide Nanoparticles as a Potential Iron Fertilizer for Peanut (Arachis hypogaea). Front. Plant Sci. 2016, 7, 815. [Google Scholar] [CrossRef] [PubMed] [Green Version]
  9. Nanoiron s.r.o. Nanoiron, Future Technology. 2018. Available online: https://nanoiron.cz/en/news (accessed on 10 November 2020).
  10. Wulfsohn, D. Sampling Techniques for Plants and Soil. Landbauforsch. Völk. 2010, 340, 3–30. [Google Scholar]
  11. Hiscox, J.D.; Israelstam, G.F. A method for the extraction of chlorophyll from leaf tissue without maceration. Can. J. Bot. 1979, 57, 1332–1334. [Google Scholar] [CrossRef]
  12. Arnon, D.I. Copper enzymes in isolated chloroplasts. Polyphenoloxidase in Beta Vulgaris. Plant Physiol. 1949, 24, 1–15. [Google Scholar] [CrossRef] [PubMed] [Green Version]
  13. Richardson, A.D.; Duigan, S.P.; Berlyn, G.P. An evaluation of noninvasive methods to estimate foliar chlorophyll content. New Phytol. 2002, 153, 185–194. [Google Scholar] [CrossRef] [Green Version]
  14. Meng, C.C.; Jalil, A.M.M.; Ismail, A. Phenolic and Theobromine Contents of Commercial Dark, Milk and White Chocolates on the Malaysian Market. Molecules 2009, 14, 200–209. [Google Scholar] [CrossRef] [Green Version]
  15. Lamaison, J.L.; Carnat, A. Levels of principal flavonoids in flowers and leaves of Crataegus-Monogyna Jacq and Crataegus-Laevigata (Poiret) Dc (Rosaceae). Pharm Acta Helv. 1990, 65, 315–320. [Google Scholar]
  16. Mielcarz-Skalska, L.; Smolińska, B. Response of Lepidium sativum to soil contamination with zinc in molecular and nanoparticle form. World Sci. News. 2018, 114, 55–67. [Google Scholar]
  17. Roth, E.F.; Gilbert, H.S. The pyrogallol assay for superoxide dismutase: Absence of a glutathione artifact. Anal. Biochem. 1984, 137, 50–53. [Google Scholar] [CrossRef]
  18. Chance, B.; Maehly, A. Assay of catalases and peroxidases. Methods Enzymol. 1955, 2, 764–775. [Google Scholar] [CrossRef]
  19. Jiang, M.; Zhang, J. Water stress-induced abscisic acid accumulation triggers the increased generation of reactive oxygen species and up-regulates the activities of antioxidant enzymes in maize leaves. J. Exp. Bot. 2002, 53, 2401–2410. [Google Scholar] [CrossRef] [PubMed] [Green Version]
  20. Wang, J.; Fang, Z.; Cheng, W.; Yan, X.; Tsang, P.E.; Zhao, D. Higher concentrations of nanoscale zero-valent iron (nZVI) in soil induced rice chlorosis due to inhibited active iron transportation. Environ. Pollut. 2016, 210, 338–345. [Google Scholar] [CrossRef] [PubMed]
  21. Ma, X.; Gurung, A.; Deng, Y. Phytotoxicity and uptake of nanoscale zero-valent iron (nZVI) by two plant species. Sci. Total Environ. 2013, 443, 844–849. [Google Scholar] [CrossRef] [PubMed]
  22. Marusenko, Y.; Shipp, J.; Hamilton, G.A.; Morgan, J.L.; Keebaugh, M.; Hill, H.; Dutta, A.; Zhuo, X.; Upadhyay, N.; Hutchings, J.; et al. Bioavailability of nanoparticulate hematite to Arabidopsis thaliana. Environ. Pollut. 2013, 174, 150–156. [Google Scholar] [CrossRef] [PubMed]
  23. Martínez-Fernández, D.; Komárek, M. Comparative effects of nanoscale zero-valent iron (nZVI) and Fe2O3nanoparticles on root hydraulic conductivity of Solanum lycopersicum L. Environ. Exp. Bot. 2016, 131, 128–136. [Google Scholar] [CrossRef]
  24. Gil-Díaz, M.; González, A.; Alonso, J.; Lobo, M. Evaluation of the stability of a nanoremediation strategy using barley plants. J. Environ. Manag. 2016, 165, 150–158. [Google Scholar] [CrossRef] [PubMed]
  25. Yirsaw, B.D.; Megharaj, M.; Chen, Z.; Naidu, R. Environmental application and ecological significance of nano-zero valent iron. J. Environ. Sci. 2016, 44, 88–98. [Google Scholar] [CrossRef] [PubMed]
  26. Fazlzadeh, M.; Rahmani, K.; Zarei, A.; Abdoallahzadeh, H.; Nasiri, F.; Khosravi, R. A novel green synthesis of zero valent iron nanoparticles (NZVI) using three plant extracts and their efficient application for removal of Cr(VI) from aqueous solutions. Adv. Powder Technol. 2017, 28, 122–130. [Google Scholar] [CrossRef]
  27. Wang, Z.; Fang, C.; Megharaj, M. Characterization of Iron–Polyphenol Nanoparticles Synthesized by Three Plant Extracts and Their Fenton Oxidation of Azo Dye. ACS Sustain. Chem. Eng. 2014, 2, 1022–1025. [Google Scholar] [CrossRef]
  28. Wang, H.; Kou, X.; Pei, Z.; Xiao, J.Q.; Shan, X.; Xing, B. Physiological effects of magnetite (Fe3O4) nanoparticles on perennial ryegrass (Lolium perenne L.) and pumpkin (Cucurbita mixta) plants. Nanotoxicology 2011, 5, 30–42. [Google Scholar] [CrossRef] [PubMed]
Figure 1. The concentration of iron (mg/g of soil) in the shoots (i) and roots (ii) of plants grown on soil contaminated with 25 and 25S nZVI. The numbers 1–6 correspond to the following concentrations: 0.5; 1; 5; 10; 50 and 100 g nZVI/kg soil. Vertical bars represents the mean values (n = 5) ± standard deviations. Different letters indicate significant difference at p < 0.05 by LSD test.
Agronomy 11 00467 g001
Figure 2. Scanning electron microscope (SEM) analysis of roots for 100 g 25S nZVI/kg of soil.
Agronomy 11 00467 g002
Figure 3. SEM analysis of shoots for 100 g 25S nZVI/kg of soil.
Agronomy 11 00467 g003
Figure 4. The content of polyphenols and flavonoids in the shoots (i) and content of flavonoids (ii) and polyphenols (iii) in roots of plants grown on soil contaminated with 25 and 25S nZVI. The numbers 1–6 correspond to the following concentrations: 0.5; 1; 5; 10; 50 and 100 g nZVI/kg soil. Vertical bars represents the mean values (n = 5) ± standard deviations. Different letters indicate significant difference at p < 0.05 by LSD test.
Agronomy 11 00467 g004
Figure 5. The content of chlorophyll a and chlorophyll b in the shoots of plants grown in soil contaminated with 25 and 25S nZVI. The numbers 1–6 correspond to the following concentrations: 0.5; 1; 5; 10; 50 and 100 g nZVI/kg soil. Vertical bars represents the mean values (n = 5) ± standard deviations.
Agronomy 11 00467 g005
Figure 6. The content of anthocyanins in shoots (i) and roots (iii) and carotenoids in shoots (iii) and roots (ii) of plants grown in soil contaminated with the 25 and 25S nZVI. The numbers 1–6 correspond to the following concentrations: 0.5; 1; 5; 10; 50 and 100 g nZVI/kg soil. Vertical bars represents the mean values (n = 5) ± standard deviations. Different letters indicate significant difference at p < 0.05 by LSD test.
Agronomy 11 00467 g006
Figure 7. The content of enzymes: Pyrogallol peroxidase (POD) in shoots (i), POD in roots (ii), superoxide dismutase (SOD) in shoots (iii) and SOD in roots (iv) of plants grown in soil contaminated with 25 and 25S nZVI. The numbers 1–6 correspond to the following concentrations: 0.5; 1; 5; 10; 50 and 100 g nZVI/kg soil. Vertical bars represents the mean values (n = 5) ± standard deviations. Different letters indicate significant difference at p < 0.05 by LSD test.
Agronomy 11 00467 g007
Figure 8. The content of catalase (CAT) in shoots and roots of plants grown in soil contaminated with the 25 and 25S nZVI. The numbers 1–6 correspond to the following concentrations: 0.5; 1; 5; 10; 50 and 100 g nZVI/kg soil. Vertical bars represents the mean values (n = 5) ± standard deviations. Different letters indicate significant difference at p < 0.05 by LSD test.
Agronomy 11 00467 g008
Table 1. Soil characteristics.
ParameterContent
Corg35.74%
N total0.071 mg/g
SO42−168 mg/L
Mg54 mg/L
K3.8 mg/g
Ca292.5 mg/L
Mn37.5 µg/g
P total24.4 mg/L
Cl<1.9 g/L
pH6.0
Table 2. Plant biomass after cultivation in soil supplemented by 25 nZVI and 25S nZVI.
Variant
(g/kg of Soil)
Mass of
Biomass (g)
Shoot
Mass (g)
Root
Mass (g)
Control20.93 ± 5.84 (b)16.53 ± 3.53 (a)11.74 ± 4.13 (d)
25 nZVI0.5 g41.23 ± 13.66 (a)30.10 ± 8.84 (a)24.77 ± 6.53 (a)
1 g36.5 ± 7.40 (a)28.90 ± 6.01 (ab)22.83 ± 3.49 (a)
5 g37.1 ± 7.17 (a)26.27 ± 8.39 (b)17.23 ± 1.08 (bc)
10 g38.37 ± 10.44 (a)26.70 ± 6.04 (ab)18.77 ± 1.53 (b)
50 g40.55 ± 10.46 (a)28.83 ± 4.04 (ab)14.59 ± 3.64 (c)
100 g37.05 ± 9.66 (a)26.72 ± 6.20 (b)15.57 ± 4.33 (c)
Control20.93 ± 5.84 (B)16.53 ± 3.53 (AB)11.74 ± 4.13 (B)
25S nZVI0.5 g25.27 ± 2.73 (AB)19.27 ± 2.88 (A)13.33 ± 6.45 (AB)
1 g19.6 ± 8.97(B)15.63 ± 3.03 (B)12.97 ± 1.39 (B)
5 g17.23 ± 3.32(B)13.53 ± 2.21 (B)5.70 ± 1.32 (C)
10 g19.92 ± 8.86 (B)15.37 ± 6.83 (B)15.22 ± 3.96 (AB)
50 g21.43 ± 7.14 (B)16.67 ± 2.59 (AB)15.77 ± 2.68 (A)
100 g30.02 ± 9.44 (A)20.58 ± 2.31 (A)13.43 ± 2.45 (AB)
Means (n = 5) ± standard deviation. Different letters indicate significant difference at p < 0.05 by LSD test: letters a, b, c—for nanoFER 25 treatments; letters A, B, C—for nanoFER 25S treatments.
Table 3. Plant biometric parameters—length of root, shoot and whole plant.
Variant
(g/kg of Soil)
Root
Length (cm)
Shoot
Length (cm)
Plant
Length (cm)
Control10.83 ± 3.18 (e)14.90 ± 1.35 (cd)22.40 ± 1.65 (d)
25 nZVI0.5 g19.1 ± 0.69 (a)18.70 ± 1.39 (a)34.47 ± 7.85 (a)
1 g12.5 ± 3.06 (d)17.43 ± 0.7 (b)26.60 ± 1.04 (c)
5 g17.73 ± 0.40 (b)15.47 ± 1.79 (c)29.87 ± 7.16 (b)
10 g19.70 ± 2.25 (a)13.93 ± 0.75 (d)30.30 ± 7.27 (b)
50 g15.87 ± 1.96 (c)14.47 ± 1.79 (d)27.00 ± 5.53 (c)
100 g13.57 ± 0.12 (d)13.60 ± 1.56 (d)23.83 ± 2.32 (d)
Control10.83 ± 3.18 (B)14.90 ± 1.35 (AB)22.40 ± 1.65 (B)
25S nZVI0.5 g13.2 ± 0.35 (A)15.60 ± 1.56 (A)25.47 ± 4.99 (A)
1 g11.57 ± 1.85 (AB)14.63 ± 1.50 (B)22.87± 5.43 (AB)
5 g11.60 ± 1.04 (AB)13.10 ± 1.91 (C)21.37 ± 2.83 (B)
10 g10.47 ± 2.54 (B)14.53 ± 1.79 (B)21.67 ± 1.44 (B)
50 g12.53 ± 0.06 (A)14.40 ± 0.17 (B)23.60 ± 5.89 (AB)
100 g12.73 ± 1.33 (A)15.37 ± 2.83 (A)24.77 ± 1.93 (A)
Means (n = 5) ± standard deviation. Different letters indicate significant difference at p < 0.05 by LSD test: letters a, b, c—for nanoFER 25 treatments; letters A, B, C—for nanoFER 25S treatments.
Publisher’s Note: MDPI stays neutral with regard to jurisdictional claims in published maps and institutional affiliations.

