Article

The Effect of Nitrogen Reduction at Different Stages on Grain Yield and Nitrogen Use Efficiency for Nitrogen Efficient Rice Varieties

State Key Laboratory Incubator of Jiangsu Crop Genetics and Physiology/Co-Innovation Center for Modern Production Technology of Grain Crops, College of Agriculture, Yangzhou University, No.88 South University Road, Yangzhou 225009, China
*
Author to whom correspondence should be addressed.
Agronomy 2021, 11(3), 462; https://doi.org/10.3390/agronomy11030462
Submission received: 4 February 2021 / Revised: 22 February 2021 / Accepted: 25 February 2021 / Published: 2 March 2021
(This article belongs to the Section Farming Sustainability)

Abstract

:
The reduction of nitrogen (N) fertilizer during the rice growing season is an important practice in rice production and is ecologically beneficial. Will different N reduction stages affect rice yields and NUE? The timing of the reduction in N-efficient varieties (NEVs) is yet to be identified, especially under moderate N rate applications. We investigated the effectiveness of various N reduction stages (NRSs) on grain yield and N-use efficiency (NUE) in NEVs in the lower reaches of the Yangtze River in China. Two NEVs were grown in the field, and five N reduction treatments, including basal N reduction (BR) at pre-transplanting (PT), tillering N reduction (TR) at early tillering (ET), promoting-spikelet N reduction (PR) at panicle initiation (PI), keeping-spikelet N reduction (KR) at spikelet differentiation (SD), and N split reduction (SR) at all four stages, were adopted, with no N reduction (CK) and no N application (N0) as controls. The results showed that grain yield and NUE varied substantially with the NRSs. Yield decreases were observed in descending order of magnitude in BR, PR, SR, TR, and KR when compared to CK. For both NEVs, BR and PR were the most effective treatments in decreasing yield and NUE at the same N reduction rate. BR and PR markedly decreased the panicles per unit area or spikelets per panicle, root biomass, root length, root length density, and root oxidation activity and exhibited simultaneously decreased leaf area index, grain leaf ratio, shoot biomass, and crop growth rate from joining to the heading and from heading to maturity. According to the results, PT and PI were considered to be N reduction sensitive stages, and ET and SD were considered to be N reduction insensitive stages. According to the results, an N reduction strategy was suggested as follows: N reduction at SD and ET, with increased N proportions at PT and PI for NEVs when adopting moderate N application rates.

1. Introduction

Nitrogen (N) fertilizer has a significant impact on the growth and development of rice, with N contributing more than 60% of the applied chemical fertilizers [1]. Increasing the application of fertilizer-N has long been one of the most effective methods for increasing rice yield [2]. However, high levels of fertilizer-N and low N utilization rates are major issues in rice production in China, with excessive fertilizer-N application causing a host of environmental problems [3,4]. Rice yield in the world has continuously increased in the last 60 years, partly because of the increase in fertilizer-N input [2]. However, the use of N fertilizer is generally inefficient, and the problem of low NUE is more aggravated in China [5]. It is thus urgent to improve N application managements, reduce N application rates, and increase N-use efficiency (NUE) to promote the sustainable development of agriculture.
Increasing and maintaining rice yield under reduced fertilizer-N application remains a challenge. The study shows that under moderate or low N rates, the rice yield and NUE for N-efficiency varieties (NEVs) are significantly higher than in N-inefficient varieties [5]. Thus, the use of NEVs could mitigate the negative effect of N reduction on rice growth [6]. The relationship between rice yield and N application rate follows a parabolic curve in general [7]. When the N application level is too high, reducing the N application rate could result in an increase rather than a reduction in yield [8]. Conversely, when the N application level is lower than the inflection point, the yield would decrease with a reduced N application level [7]. To prevent yield loss, the timing for N reduction should be adjusted under a moderate N application level. Fertilizer-N is mainly applied at four stages: pre-transplanting (PT), early tillering (ET), panicle initiation (PI), and spikelet differentiation (SD) as basal N, tillering N, promoting-spikelet N, and keeping-spikelet N, respectively, the promoting-spikelet N and keeping-spikelet N fertilizers are also called panicle N fertilizers [9]. Previous studies on the timing of the application focused mostly on the positive effects. For example, increasing tillering N application could increase the rate of tillering and panicle formation [10] and increasing keeping-spikelet N could increase grain weight and filling efficiency [11]. However, the negative effects of N reduction at different stages on rice growth remain unclear, as do the degrees of the effects on rice yield. Moreover, previous studies on N reduction focus on reducing N application rates [12,13,14]. These studies only show the effect of N application rate on rice and are unable to reveal the effect of N application at different stages.
To evaluate the effects of N reduction timing on rice yield, the N application rate of no N reduction treatment (CK) was established below the infection point of the parabolic curve between grain yield and N application rate. This was because reducing N above the infection point may result in an increase in yield. We maintained the level of N reduction and established different timings for N reduction. The objective was to investigate the changes of grain yield and NUE of NEVs under different N reduction treatments and to understand their agronomic and physiological bases by determining root biomass and length, root length density, root oxidation activity, leaf area index, grain-leaf ratio, crop growth rate and shoot biomass accumulation. Our purpose was to identify appropriate N reduction timing and to provide a reference for the scientific reduction of fertilizer-N.

2. Materials and Methods

2.1. Plant Materials and Growth Conditions

Field experiments were conducted at a research farm in Yizheng City, in the lower reaches of the Yangtze River, China (32°50′ N, 119°23′ E), during the rice growing season in 2017 and 2018, which was an alluvial plain that was one of the primary rice production areas in China. The soil was a sandy loam (Typic Fluvaquents, Etisols (U.S. taxonomy)), the average values of soil properties of the field across the study years were as follows: total N of 1.11 g kg−1, available phosphorus of 31.73 mg kg−1, available potassium of 74.42 mg kg−1, organic mater of 23.56 g kg−1, 6.89 of pH value, 1.33 g cm−3 of bulk density and 0.19 g g−1 of field capacity. Climate data across the study years were measured at a small weather station in the field site. The average precipitation, sunshine hours, and mean air temperature concerning the entire vegetation period were 126 mm, 194 h, and 25.1 °C, respectively, in 2017 and 145 mm, 183 h, and 24.7 °C, respectively, in 2018.
Two N-efficient varieties Huaidao 5 (HD-5) and Yangfujing 8 (YJ-8) with multiple spike types were used as the research material. Both varieties were conventional japonica rice and breed by Huai’an Academy of Agricultural Sciences and Yangzhou Academy of Agricultural Sciences, respectively. Seeds of tested varieties were provided by Huai’an Seed Company (Huai’an, China) and Yangzhou Seed Company (Yangzhou, China). Parabolic equations between grain yield and N application rate of tested varieties under an N split proportion of 4:2:2:2 were shown in Figure 1. The optimum N rate of HD-5 and YJ-8 were 255.4 kg hm−2 and 260.8 kg hm−2 according to the equations, respectively. Therefore, the N application rate of no N reduction treatment was set at 250 kg hm−2. Seedlings were raised in the seeded with a sowing date on 15 May of both year, and transplanted on 10 June of 2017 and 11 June of 2018. The hill spacing was 0.33 m × 0.13 m with three seedlings per hill by using a rice transplanter. Phosphorus was applied as calcium super-phosphate (13.5% P2O5) at a rate of 150 kg hm−2 before transplanting, potassium was applied as potassium chloride (52.0% K2O) at a rate of 150 kg hm−2 and split at 1 d before transplanting and panicle initiation. To avoid yield losses, water, weeds, diseases, and insects were intensively controlled throughout the rice growth season.

2.2. Treatments

The experiments were laid out in a split-plot design with N reduction treatments as main plots and varieties as subplots with three replicates. The plot area was 35 m2 (7 m × 5 m) and each plot was separated by 0.6 m wide ridges that were covered with plastic film. Treatments consisted of seven N treatments, including zero-N control (N0), no N reduction (CK), basal N reduction (BR) at PT, tillering N reduction (TR) at ET, promoting-spikelet N reduction (PR) at PI, keeping-spikelet N reduction (KR) at SD, and N split reduction (SR) at all four stages, for each treatment, N as urea was split four applications at four growth stages. The details of different treatments were shown in Table 1.

2.3. Sampling and Measurements

Root and shoot biomass were determined at about 40, 75 and 125 days after transplanting of rice growth stages, shown as jointing (JT), heading (HD) and maturity (MA), respectively. Plants were sampled from each central plot to minimize the border effect. All samples were separated into four parts, roots, leaves, stems, and panicles (at HD and MA). The dry matter of each component was determined after drying at 75 °C to a constant weight and weighed. Crop growth rate (CGR) was calculated using the following formula according to the method of Ju et al. [5]:
CGR (g m−2 d−1) = (W2 − W1)/(t2 − t1)
where W1 and W2 are the first and second measurement of shoot biomass (g m−2), respectively, and t1 and t2 present the first and second time (d), respectively, of the measurement.
For the measurement of root oxidation activity (ROA), the roots in soil were dug out by a spade (the soil volume around roots was 20 × 20 × 20 cm3), then carefully rinsed and detached from their nodal bases. Both fresh weight and dry weight of roots were recorded. The ROA was determined by measuring the oxidation of 1-Naphthylamine (α-NA) according to the method of Chu et al. [15]. To measure root length, roots were arranged and floated on shallow water in a transparent plastic pallet and then scanned using Canon 6030 Scanner (Canon Corporation, Tokyo, Japan) and analyzed using WinRHIZO Root Analyzer System (Regent Instruments, Quebec, Canada). Root length density was calculated from the root length and the volume of the soil core (V), root length density (cm cm−3) = root length (cm)/V (cm3).
Leaf area index (LAI) was measured with an area meter (LI-3000 C, Li-Cor, Lincoln, OR, USA). Grain leaf ratio (LFR) was calculated from the total spikelets and the LAI, grain leaf ratio = spikelets (m−2)/leaf area index. N concentrations in plants at maturity were determined by using Elementar vario MICRO cube (Elementar, Frankfurt, Germany). The methods for calculating NUE were according to Ju et al. [5], i.e., the internal NUE (IE, the ratio of grain yield over N uptake in plants at maturity), apparent recovery NUE (RE, the ratio of N uptake difference that due to N application compared with no N application over N application rate), agronomic NUE (AE, the ratio of grain yield difference that due to N application compared with no N application over N application rate), physiological NUE (PE, the ratio of grain yield difference over the N uptake difference which results from N application compared with no N application) and N partial factor productivity (PFP, the ratio of grain yield over N application rate).
The measurement of yield and yield components followed the procedure described by Fu et al. [16]. Yield was determined from a harvest area of 5.0 m2 in each plot and adjusted to the standard moisture content of 14%. Yield components, including the number of panicles per unit area, spikelets per panicle, percentage of filled grains, and 1000 grain weight, were determined from the plants of five hills sampled randomly from each field plot. Spikelets were hand-threshed and fully filled spikelets were separated from others by submerging them in salt water (specific gravity ≥1.06 g cm−3). The percentage of filled grains was defined as the filled spikelets as a percentage of the total number of spikelets.

2.4. Statistical Analysis

Statistical data analysis was performed using SAS/STAT statistical analysis package (version 6.12, SAS Institute, Cary, USA). The statistical model used included sources of variation due to replication, year, variety, N reduction treatment and the interaction of variety × N reduction treatment (model y = variety, N reduction treatment, variety × N reduction treatment). Data from each sampling date were analyzed separately. When significant, the averages were compared by the least significance difference (LSD) test at the 0.05 probability level. Since root and shoot biomass, root length, root length density, ROA and LAI exhibited a similar pattern at jointing, heading and maturity, data at heading were only presented for conciseness. Since the year was not a significant factor in the experiment, data from both years were averaged (Table 2).

3. Results

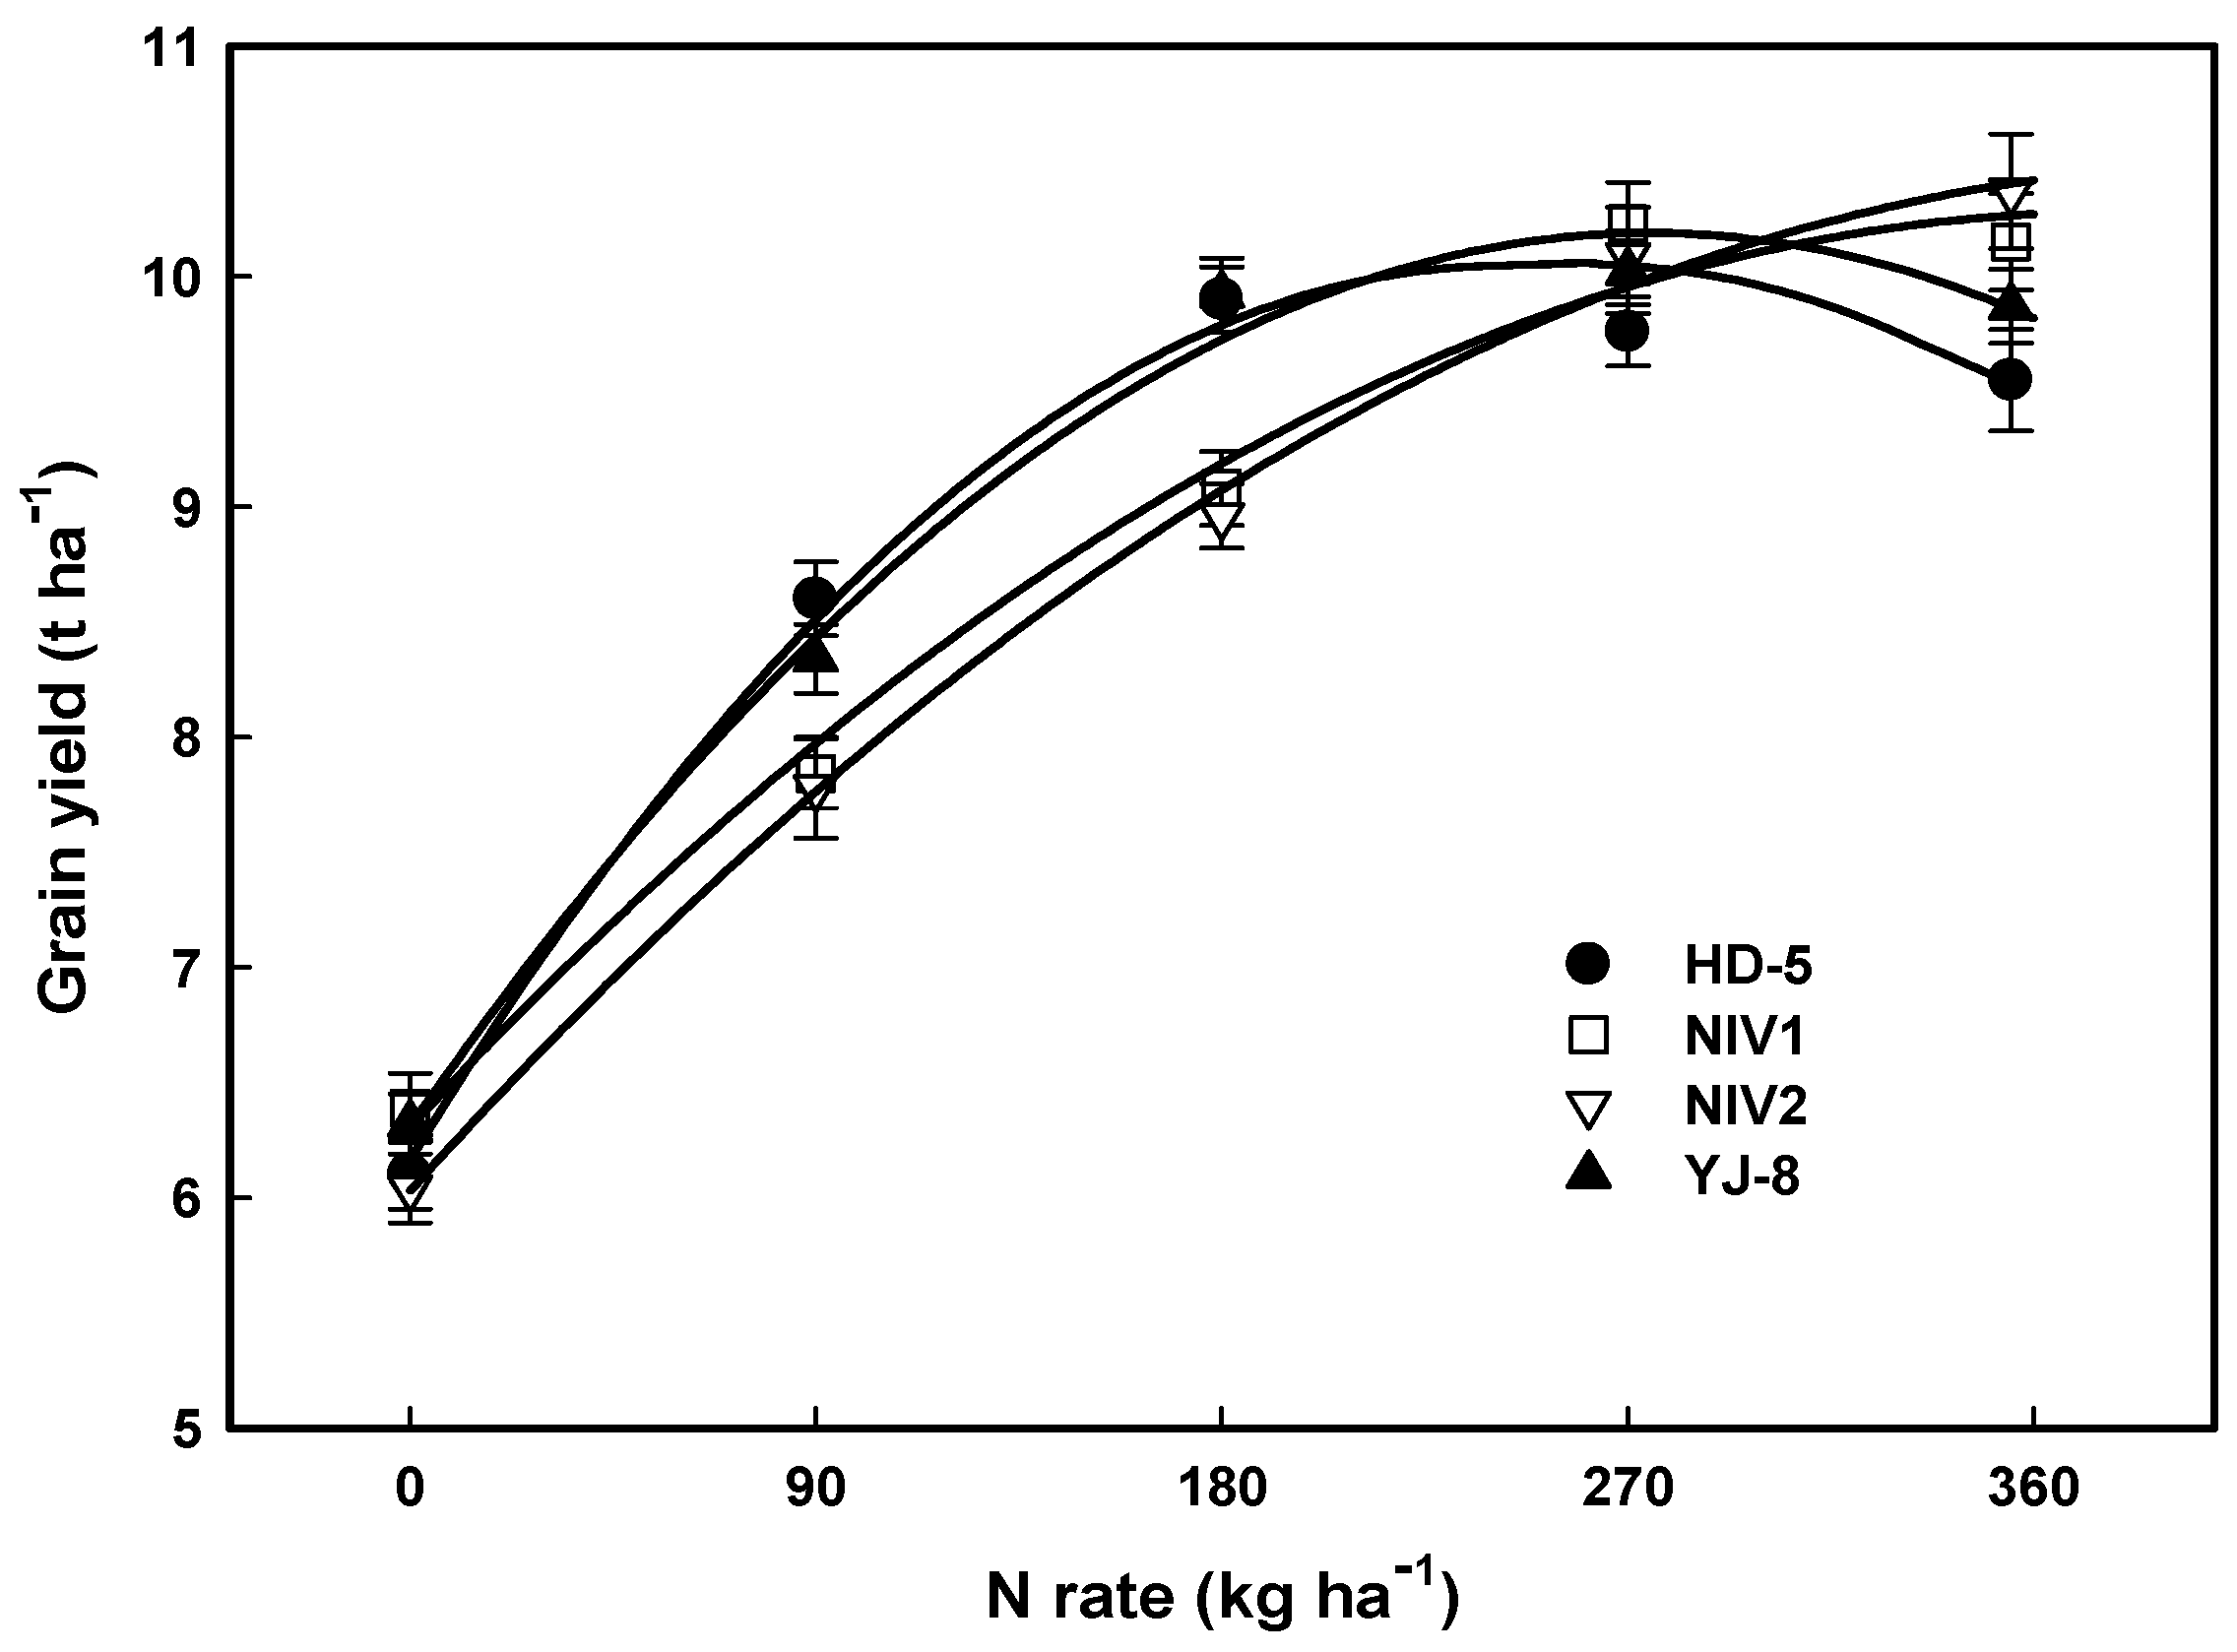
3.1. Grain Yield and NUE

As shown in Table 3, compared to CK, the N reduction treatments exhibited a decrease in yield to various degrees. The degree of yield decrease followed the order of BR, PR, SR, TR, and KR from highest to lowest. BR and PR had lower yields than SR, and TR and KR had higher yields than SR. This indicated that the yield changed drastically with the timing of N reduction. For yield components, BR resulted in a decrease in panicles per unit area and spikelets per panicle, while PR resulted in a decrease in spikelets per panicle, leading to a decrease in the total number of spikelets. TR and KR resulted in a decrease in panicles per unit area and filled grains rate, respectively, while the decrease in yield was relatively low, suggesting that the spikelet number per panicle contributed greatly to grain yield.
The changes in N uptake were similar to the changes in yield (Table 4). The IE among the N reduction treatments did not differ significantly. KR and TR had a higher RE, suggesting that N uptake was lower at SD and ET. TR and KR had a higher AE and PFP than SR, while BR and PR had a lower AE and PFP than SR. BR had the lowest PE, indicating that the basal N had the greatest effect on PE at a moderate N level.

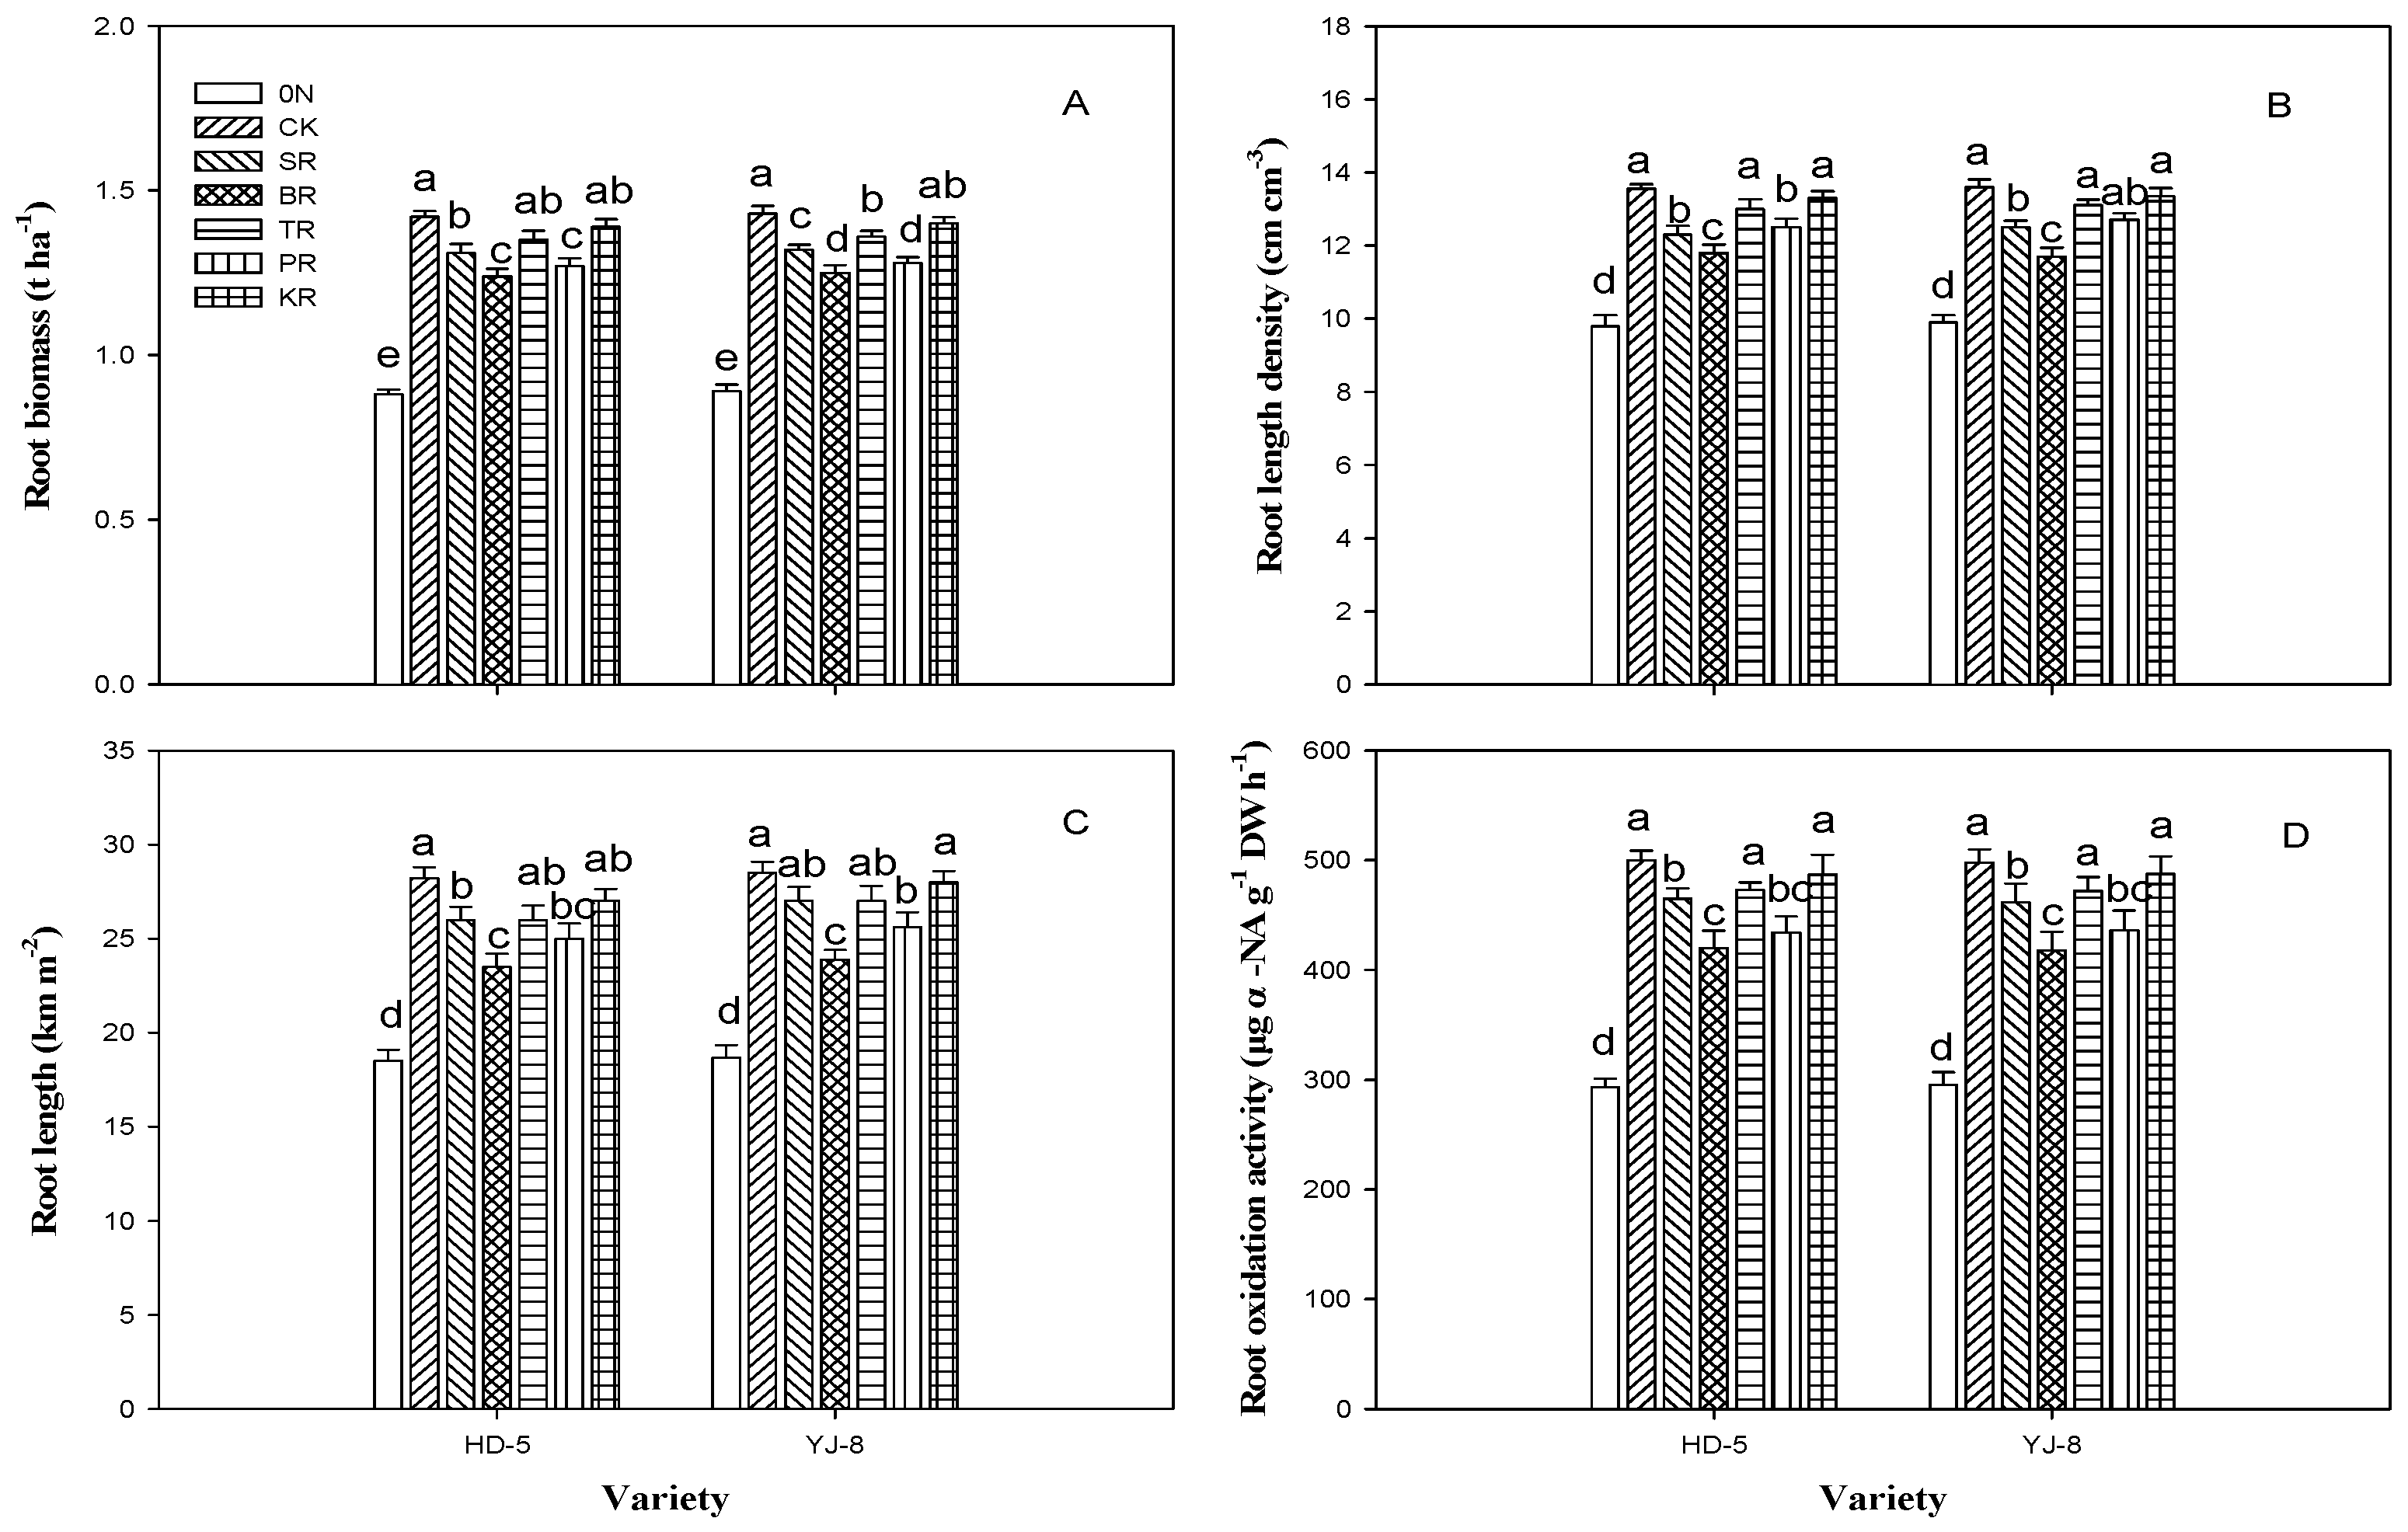
3.2. Root Biomass, Root Length, Root Length Density and Root Oxidation Activity

TR and KR exhibited higher root biomass, root length, root length density, and root oxidation activity than SR, while these parameters in BR and PR were lower than in SR, and showed no significant difference when compared to CK (Figure 2). For early stage fertilizer-N (basal N and tillering N), these root parameters were greater in TR than in BR. For panicle fertilizer-N (promoting-spikelet N and keeping-spikelet N), these root parameters were greater in KR than in PR. These results showed that during the two successive stages in early or later stages, early N application had better effects on the root system.

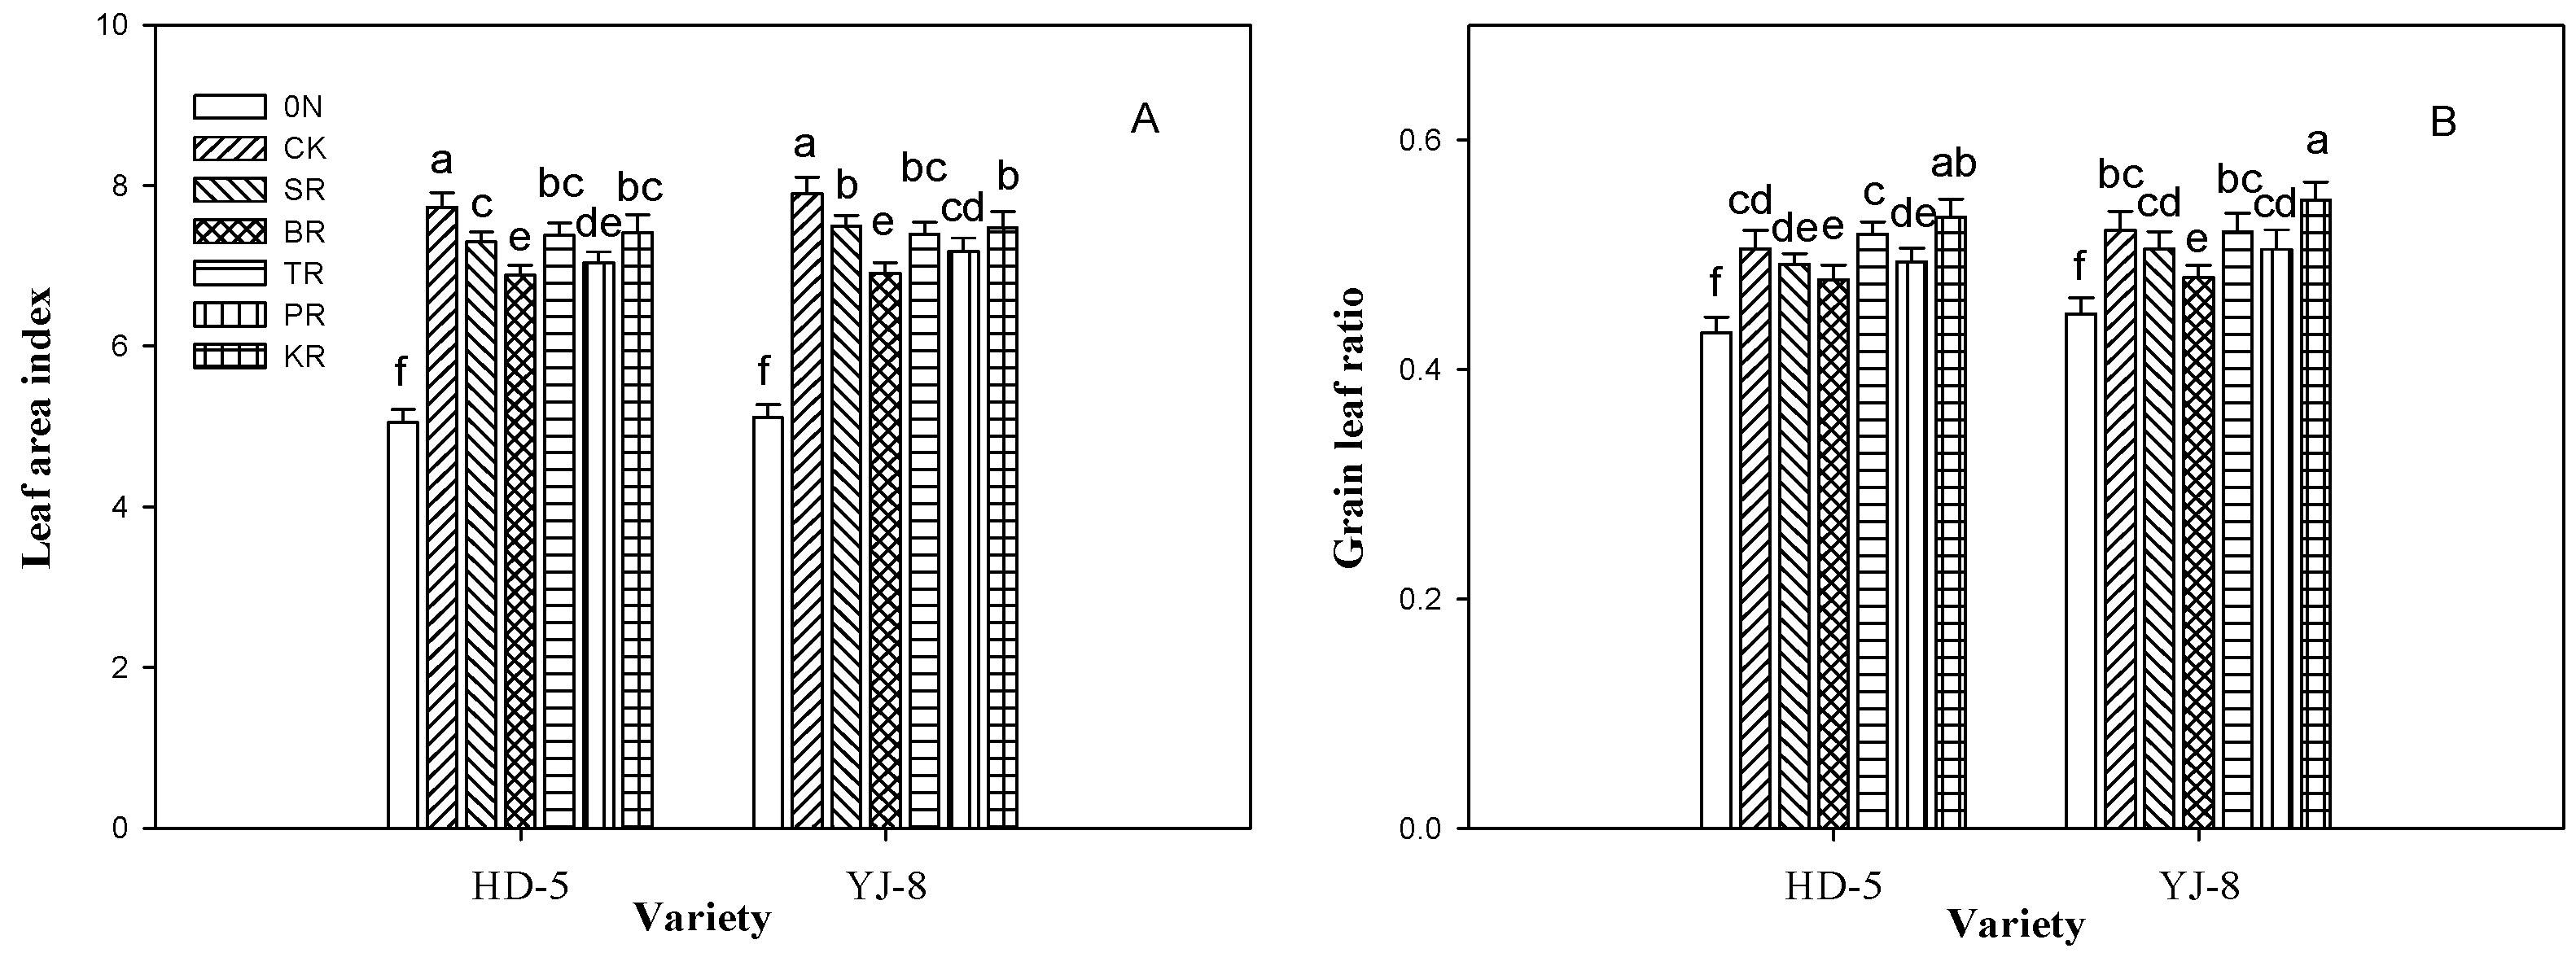
3.3. Leaf Area Index and Grain Leaf Ratio

Compared to CK, the LAI decreased in each N reduction treatment, and BR and PR exhibited a greater decrease than other N reduction treatments. Consistent with root traits, LAI were higher in TR and KR than in BR and PR. KR had the highest grain leaf ratio, and followed by TR in comparison to other treatments. CK had the largest LAI, but not the highest grain/leaf ratio, indicating that, compared to KR, the sink capacity of CK was limiting further yield increases (Figure 3).

3.4. Shoot Biomass and Crop Growth Rate

The shoot biomass at heading and maturity was the highest in CK, followed by KR and TR (Table 5). TR and KR presented higher shoot biomass than SR, while BR and PR presented lower shoot biomass than SR. KR and PR had higher CGR from jointing to heading and from heading to maturity than other N reduction treatments, which was an important contributor to the higher shoot biomass at HD and MA.

4. Discussion

When the N supply is sufficient, postponing N application is considered to be an important means by which rice yield can be increased, especially for rice in cold area [17]. It may not be because of the amount, but the ratio the early N application was reduced when the N rates were high. However, when the N rate was reduced in this study at a moderate level, basal N reduction had a greater negative effect on yield and NUE than tillering N reduction, and promoting-spikelet N reduction had a greater negative effect on yield and NUE than keeping-spikelet N reduction (Table 3 and Table 4). This indicated that, under these N reduction treatments, one should focus on the application of fertilizer-N at the early stage or on applying the panicle N earlier.
Analysis of yield components showed that basal N reduction affected both the panicle per unit area and spikelets per pancile (Table 3). Furthermore, after reducing basal N, the rice root system was not well established, which also affected the growth of the above-ground parts (Figure 2 and Figure 3, Table 5). A reduction in promoting-spikelet N affected the formation of spikelet number and reduced the rice sink capacity (Table 3). However, most NEVs are sink-limiting varieties, and thus a reduction in promoting-spikelet N had a greater effect on grain yield and NUE in the NEVs [18]. Therefore, PT and PI were considered N reduction-sensitive stages (RSSs). In this study, after reducing the tillering N, the panicle number did not significantly decrease (Table 3), indicating that NEVs have a higher tillering ability. After reducing the keeping-spikelet N, although the grain weight and grain setting rate slightly decreased, the yield did not exhibit a great decrease (Table 3). Therefore, ET and SD were considered N reduction-insensitive stages (RISs). According to the results, we suggest that under fertilizer-N reduction treatments, the reduced N should be concentrated in the RISs as much as possible. In particular, when the N rate is at a not high level, N application should be prioritized at the RSSs.
Previous studies showed that basal N labeled with 15N could still be absorbed and utilized until later growth stages [19]. The amount of transported promoting-spikelet N was the highest, and the rate of transported basal N was the highest reported [20]. Research showed that basal N compared to tillering N, promoting-spikelet N compared to keeping-spikelet N, was more beneficial to N uptake and utilization in NEVs [21]. The present study showed that a reduction in tillering N and keeping-spikelet N had a lower effect on yield and NUE, while the reduction of basal N and promoting-spikelet N had a higher effect (Table 3 and Table 4), these results were consistent with the results of the above studies. Basal N was more efficient than tillering N and this could be due to the short gap between the application at tillering N and basal N. Compared to basal N, tillering N evaporated more easily, as basal N was applied deep in the soil profile [22]. A study showed that applying keeping-spikelet N fertilizer in large panicle size varieties and promoting-spikelet N fertilizer in small panicle size varieties resulted in better yield increases [9]. NEVs such as green super rice were mostly multiple spike types as small-panicle rice was more suitable for mechanical and simplified cultivation [23]. Thus, for NEVs, increasing the sink capacity had a greater effect on yield compared to increasing the grain filling efficiency. However, this does mean that fertilizer application was not necessary for the other two stages. When soil fertility was low, supplementing tillering N could significantly increase the tillering rate [10]. In addition, N-inefficient varieties that were dependent on fertilizer-N application should be appropriately supplemented with more fertilizer to ensure yields [18].
This study showed that compared to the RSSs, varieties under N reduction treatments at RISs resulted in a higher root and shoot biomass (Figure 2 and Table 5). The root system provided basic nutrition and water transport for the above-ground parts of the plant [24]. It was believed that a longer root length and greater root length density could benefit plant roots by increasing the availability of N in the soil [25]. Varieties under N reduction treatments at RISs had a higher root length and root length density, which was more beneficial for N uptake. ROA was regarded as an important index of root physiological activity [26]. A higher ROA was necessary to maintain root biomass, root and shoot growth, and ion uptake [15]. In this study, ROA was the highest in TR and KR (Figure 2), so we believe that basal-N and promoting-spikelet N had a greater positive effect on the root system.
Leaf area was a basic parameter, and the grain leaf ratio measured the balance of the source and sink [7]. TR and KR had a higher grain leaf ratio, indicating that N reduction at these treatments resulted in a greater decrease in grain number than leaf area index (Figure 3). For sink-limiting varieties, the relative sink capacity was increased, which further balanced the source-sink relationship. It was proposed that a higher CGR enabled greater carbohydrate accumulation in the stems, which in turn contributed to a higher percentage of filled grains [27]. It was also believed that rice grain yield depended on starch from two resources: dry matter production after heading and remobilization of reserves stored in the stem pre-anthesis [28]. In this study, not only did TR and KR have a higher shoot biomass at the heading stage, but also a higher CGR from heading to maturity (Table 5); this was a major factor that led to the higher relative yield and NUE than in the other N reduction treatments.

5. Conclusions

For the NEVs, PT and PI were the N reduction-sensitive stages, while ET and SD were the N reduction-insensitive stages at a relatively moderate N rate. When N application rates are reduced, N reduction could be focused on the insensitive stages to mitigate the adverse effect of reduced fertilizer-N application on rice production. Compared to the other N reduction treatments, the important physiological reasons for maintaining high yield and NUE in NEVs under TR and KR were higher root system characteristics and leaf area, higher CGR and biomass, as well as a balanced source-sink relationship. Further research is needed to understand not only the grain yield and NUE, but also the grain quality mechanisms underlying N uptake and the assimilation of N-efficient varieties.

Author Contributions

Methodology, T.L.; validation, T.L. and C.S.; formal analysis, Y.Z. and C.J.; investigation, Y.Z. and C.J.; resources, C.S.; data curation, Y.Z. and C.J.; writing—original draft preparation, C.J.; writing—review and editing, C.J.; visualization, Y.Z. and T.L.; supervision, Y.Z. and T.L.; project administration, C.J. and C.S.; funding acquisition, T.L. and C.S. All authors have read and agreed to the published version of the manuscript.

Funding

This research was funded by the National Natural Science Foundation of China (32001465, 31872852, and 31701355), by the National Key Research and Development Program of China (2018YFD0300805), and by the Priority Academic Program Development of Jiangsu Higher Education Institutions.

Acknowledgments

We thank the editors and three anonymous reviewers for their constructive comments.

Conflicts of Interest

The authors declare no conflict of interest.

References

  1. Li, H.; Hu, B.; Chu, C. Nitrogen use efficiency in crops: Lessons from Arabidopsis and rice. J. Exp. Bot. 2017, 68, 2477–2488. [Google Scholar] [CrossRef]
  2. Peng, S.; Buresh, R.J.; Huang, J.; Zhong, X.; Zou, Y.; Yang, J.; Wang, G.; Liu, Y.; Hu, R.; Tang, Q.; et al. Improving nitrogen fertilization in rice by site-specific N management: A review. Agron. Sustain. Dev. 2010, 30, 649–656. [Google Scholar] [CrossRef]
  3. Huang, L.; Yang, D.; Li, X.; Peng, S.; Wang, F. Coordination of high grain yield and high nitrogen use efficiency through large sink size and high post-heading source capacity in rice. Field Crops Res. 2019, 233, 49–58. [Google Scholar] [CrossRef]
  4. Yu, C.; Huang, X.; Chen, H.; Godfray, H.C.; Wright, J.S.; Hall, J.; Gong, P.; Ni, S.; Qiao, S.; Huang, G.; et al. Managing nitrogen to restore water quality in China. Nature 2019, 567, 516–520. [Google Scholar] [CrossRef] [PubMed]
  5. Ju, C.; Buresh, R.J.; Wang, Z.; Zhang, H.; Liu, L.; Yang, J.; Zhang, J. Root and shoot traits for rice varieties with higher grain yield and higher nitrogen use efficiency at lower nitrogen rates application. Field Crops Res. 2015, 175, 47–55. [Google Scholar] [CrossRef]
  6. Kant, S.; Bi, Y.M.; Rothstein, S.J. Understanding plant response to nitrogen limitation for the improvement of crop nitrogen use efficiency. J. Exp. Bot. 2011, 62, 1490–1509. [Google Scholar] [CrossRef] [PubMed] [Green Version]
  7. Ling, Q. The Quality of Crop Population; Shanghai Scientific & Technical Publishers: Shanghai, China, 2005; pp. 154–196. [Google Scholar]
  8. Li, Y.; Chen, Y.; Wu, C.; Tang, X.; Ji, X. Determination of optimum nitrogen application rates in Zhejiang Province, China, based on rice yields and ecological security. J. Integr. Agric. 2015, 14, 2426–2433. [Google Scholar] [CrossRef]
  9. Zhang, Z.; Chu, G.; Liu, L.; Wang, Z.; Wang, X.; Zhang, H.; Yang, J.; Zhang, J. Mid-season nitrogen application strategies for rice varieties differing in panicle size. Field Crops Res. 2013, 150, 9–18. [Google Scholar] [CrossRef]
  10. Fan, L.; Xu, S.; Hou, P.; Xue, L.; Li, G.; Ding, Y.; Yang, L. Effect of different ratios of basal to tiller nitrogen on rice yield and nitrogen utilization under different soil fertility. Sci. Agric. Sin. 2016, 49, 1872–1884. [Google Scholar] [CrossRef]
  11. Yang, J.; Zhang, J. Grain-filling problem in ‘super’ rice. J. Exp. Bot. 2010, 61, 1–4. [Google Scholar] [CrossRef] [Green Version]
  12. Emran, S.; Krupnik, T.J.; Kumar, V.; Ali, M.Y.; Pittelkow, C.M. Agronomic, economic, and environmental performance of nitrogen rates and source in Bangladesh’s coastal rice agroecosystems. Field Crops Res. 2019, 241, 107567. [Google Scholar] [CrossRef] [PubMed]
  13. Kim, G.W.; Gutierrez-Suson, J.; Kim, P.J. Optimum N rate for grain yield coincides with minimum greenhouse gas intensity in flooded rice fields. Field Crops Res. 2019, 237, 23–31. [Google Scholar] [CrossRef]
  14. Qiao, J.; Yang, L.; Yan, T.; Xue, F.; Zhao, D. Rice dry matter and nitrogen accumulation, soil mineral N around root and N leaching, with increasing application rates of fertilizer. Eur. J. Agron. 2013, 49, 93–103. [Google Scholar] [CrossRef]
  15. Chu, G.; Chen, T.; Wang, Z.; Yang, J.; Zhang, J. Morphological and physiological traits of roots and their relationships with water productivity in water-saving and drought-resistant rice. Field Crops Res. 2014, 162, 108–119. [Google Scholar] [CrossRef]
  16. Fu, P.; Wang, J.; Zhang, T.; Huang, J.; Peng, S. High nitrogen input causes poor grain filling of spikelets at the panicle base of super hybrid rice. Field Crops Res. 2019, 244, 107635. [Google Scholar] [CrossRef]
  17. Chen, L.; Peng, X.; Liu, Y.; Li, Z.; Zhang, M.; Li, J. Effect of nutrient management od dry matter accumulation and translocation of rice in cold area. J. Northeast Agric. Univ. 2010, 41, 52–55. [Google Scholar] [CrossRef]
  18. Ju, C. Agronomic and Physiological Traits for Rice Cultivars Differing in Response to Nitrogen. Ph.D. Thesis, Yangzhou University, Yangzhou, China, 2017. [Google Scholar]
  19. Wang, D.; Chang, Y.; Xu, C.; Wang, Z.; Chen, S.; Chu, G.; Zhang, X. Soil nitrogen distribution and plant nitrogen utilization in direct-seeded rice in response to deep placement of basal fertilizer-nitrogen. Rice Sci. 2019, 26, 404–415. [Google Scholar] [CrossRef]
  20. Yan, J.; Shen, Q.; Yin, B.; Wan, X. Fertilizer-N uptake and distribution in rice plants using 15N tracer technique. J. Nucl. Agric. Sci. 2009, 23, 487–491. [Google Scholar] [CrossRef]
  21. Yuan, Q. The Effect of Nitrogen Fertilizer Treatments on the Grain Yield and Root Traits of Indica Rice Varieties with Different Nitrogen Uptake Efficiency. Master’s Thesis, Yangzhou University, Yangzhou, China, 2013. [Google Scholar]
  22. Zhou, W.; Tian, Y.; Yin, B. Ammonia volatilization and nitrogen balance after topdressing fertilization in paddy fields on Taihu Lake region. Chin. J. Eco-Agric. 2011, 19, 32–36. [Google Scholar] [CrossRef]
  23. Peng, S. Reflection on China’s rice production strategies during the transition period. Sci. Sin. Vitae 2014, 44, 845–850. [Google Scholar] [CrossRef]
  24. Yang, J.; Zhang, H.; Zhang, J. Root morphology and physiology in relation to the yield formation of rice. J. Integr. Agric. 2012, 11, 920–926. [Google Scholar] [CrossRef]
  25. Wu, W.; Cheng, S. Root genetic research, an opportunity and challenge to rice improvement. Field Crops Res. 2014, 165, 111–124. [Google Scholar] [CrossRef] [Green Version]
  26. Dong, G.; Chen, C.; Yuan, Q.; Yang, B.; Zhu, Z.; Cao, W.; Zhong, J.; Zhou, J.; Luo, G.; Wang, Y.; et al. The effect of nitrogen fertilizer treatments on root traits and nitrogen use efficiency in indica rice varieties with high nitrogen absorption efficiency. Acta Ecol. Sin. 2016, 36, 642–651. [Google Scholar] [CrossRef]
  27. Takai, T.; Matauura, S.; Nishio, T.; Ohsumi, A.; Shiraiwa, T.; Horie, T. Rice yield potential is closely related to crop growth rate during late reproductive period. Field Crops Res. 2006, 96, 328–335. [Google Scholar] [CrossRef]
  28. Fu, J.; Huang, Z.; Wang, Z.; Yang, J.; Zhang, J. Pre-anthesis non-structural carbohydrate reserve in the stem enhances the sink strength of inferior spikelets during grain filling of rice. Field Crops Res. 2011, 123, 170–182. [Google Scholar] [CrossRef]
Figure 1. Yield response curve to nitrogen application rate of different rice varieties with the nitrogen proportion of 4:2:2:2 at different applied stages. HD-5, Huaidao 5; YJ-8, Yangfujing 8, NIV: N in-efficiency varieties.
Agronomy 11 00462 g001
Figure 2. Root biomass (A), root length density (B), root length (C) and root oxidation activity (D) of rice at heading under various N reduction treatments. Vertical bars represent ± standard error of the mean where these exceed the size of the symbol. Different letters above the column indicate statistical significance at the p = 0.05 level.
Agronomy 11 00462 g002
Figure 3. Leaf area index (A) and grain leaf ratio (B) of rice at the heading time under various N reduction treatments. Vertical bars represent ± standard error of the mean where these exceed the size of the symbol. Different letters above the column indicate statistical significance at the p = 0.05 level.
Agronomy 11 00462 g003
Table 1. Description of N reduction treatments.
Treatment 1ProportionN Rate (kg ha−1)
PT 2ETPISDTotal
N0-00000
CK4:2:2:2100505050250
SR4:2:2:280404040200
BR2:2:2:250505050200
TR4:0:2:210005050200
PR4:2:0:210050050200
KR4:2:2:010050500200
1 N0, zero-N; CK, no N reduction, SR, N split reduction, BR, basal N reduction; TR, tillering N reduction; PR, promoting-spikelet N reduction; KR, keeping-spikelet N reduction. 2 PT: pre-transplanting; ET: early-tillering; PI: panicle initiation; SD: spikelet differentiation.
Table 2. Analysis-of-variance of F-values of grain yield, yield components, N uptake, shoot biomass and agronomic N use efficiency among years, varieties, and N reduction treatments.
Source of VariationdfGrain YieldPanicles per m2Spikelets per PanicleFilled Grains RateN UptakeShoot BiomassAgronomic N Use Efficiency
Year(Y)1NSNSNSNSNSNSNS
Variety(V)1NSNS**NSNSNS
N treatments (N)6*************
Y × V1NSNSNSNSNSNSNS
Y × N6NSNSNSNSNSNSNS
V × N6*************
NS, not significant at the p = 0.05 level. * Significant at the p = 0.05 level. ** Significant at the p = 0.01 level.
Table 3. Grain yield and yield components of rice subjected to various N reduction treatments.
Variety 1Treatment 2Grain Yield
(t ha−1)
Panicles per m2Spikelets per PanicleTotal Spikelets
(×103 m−2)
Filled Grain
(%)
Grain Weight
(mg)
HD-5N05.65e 3 202 d 108 e 21.2 f 93.4 a 27.6 a
CK9.90 a 277 ab 141 ab 39.1 ab 92.4 a 27.5 a
SR9.07 c 267 b 135 bc 36.0 cd91.8 ab 27.4 a
BR8.31 d 253 c 130 cd 32.9 e92.2 ab 27.4 a
TR9.48 b 270 ab 140 ab37.8 bc91.9 ab 27.3 a
PR8.84 c 276 ab 126 d 34.8 d92.1 ab 27.6 a
KR9.67 ab 278 ab 141 ab 39.5 ab90.5 c 27.1 ab
YJ-8N05.74 e 201 d 114 e 22.3 f 92.6 a 27.0 ab
CK9.97 a 284 a 145 a 41.2 a 91.1 bc26.6 ab
SR9.12 c 274 ab 138 ab 37.8 bc 90.3 c 26.7 ab
BR8.28 d 252 c 134 bc 33.8 de91.5 ab 26.8 ab
TR9.33 bc 271 ab 142 ab 38.5 b 90.5 c 26.8 ab
PR8.90 c 283 a 128 cd 36.2 cd 91.0 bc 27.0 ab
KR9.65 ab 284 a 144 a 40.9 a 89.7 d 26.3 b
1 HD-5, Huaidao 5; YJ-8, Yangfujing 8. 2 N0, zero-N; CK, no N reduction, SR, N split reduction, BR, basal N reduction; TR, tillering N reduction; PR, promoting-spikelet N reduction; KR, keeping-spikelet N reduction. 3 No shared letter indicates statistical significance at the p = 0.05 level within the same column.
Table 4. Nitrogen uptake and nitrogen use efficiency of rice subjected to various N reduction treatments.
Variety 1Treatment 2N Uptake
(kg ha−1)
IE
(kg kg−1)
RE
(%)
AE
(kg kg−1)
PE
(kg kg−1)
PFP
(kg kg−1)
HD-5N072.4f 378.1 a
CK163.6 a60.5 b 36.5 c 17.0 cd 46.5 a 39.6 c
SR145.7 cd62.2 b 36.7 c 17.1 cd 46.6 a 45.3 a
BR133.5 e62.2 b 30.6 e 13.3 e 43.5 c 41.5 b
TR155.4 ab61.0 b 41.5 a 19.1 ab 46.1 ab 47.4 a
PR138.8 de62.4 b 34.6 d 15.9 d 46.0 ab 44.2 ab
KR156.8 ab61.7 b42.2 a 20.1 a 47.7 a 48.4 a
YJ-8N074.5 f77.0 a
CK165.2 a60.3 b 36.3 c 16.9 cd 46.6 a 39.9 c
SR149.7 bc60.9 b 37.6 bc 16.9 cd 44.9 b 45.6 a
BR134.5 e61.6 b 30.0 e 12.7 e 42.4 c 41.4 b
TR152.3 bc61.3 b 38.9 b 18.0 bc 46.2 ab 46.7 a
PR140.4 de62.1 b 34.5 d 15.8 d 45.9 ab 44.5 ab
KR161.1 a59.9 b 43.3 a 19.5 a 45.1 b 48.2 a
1 HD-5, Huaidao 5; YJ-8, Yangfujing 8. 2 N0, zero-N; CK, no N reduction, SR, N split reduction, BR, basal N reduction; TR, tillering N reduction; PR, promoting-spikelet N reduction; KR, keeping-spikelet N reduction. 3 No shared letter indicates statistical significance at the p = 0.05 level within the same column.
Table 5. Crop growth rate and shoot biomass subjected to various N reduction treatments.
Variety 1Treatment 2Crop Growth Rate (g cm−2 d−1)Shoot Biomass (t ha−1)
Jointing-HeadingHeading-MaturityHeadingMaturity
HD-5N09.24d 39.38 d 6.39 d 11.36 g
CK18.83 a 15.38 a 11.75 a 19.90 a
SR17.94 b 14.64 ab 10.71 b 18.47 cd
BR16.32 c 13.64 c 9.73 c 16.96 f
TR18.09 ab 15.28 a 10.74 b 18.84 bc
PR16.76 c 14.14 bc 10.18 bc 17.67 e
KR18.58 ab 15.02 ab 11.03 ab 18.99 bc
YJ-8N09.15 d 9.38 d 6.32 d 11.29 g
CK19.14 a 15.19 a 11.84 a 19.89 a
SR18.38 ab 14.61 ab 10.62 b 18.38 cd
BR16.48 c 13.64 c 9.65 c 16.88 f
TR18.51 ab 14.77 ab 10.83 b 18.66 bc
PR16.45 c 14.70 ab 10.22 bc 18.01 de
KR18.71 a 15.31 a 11.12 ab 19.23 b
1 HD-5, Huaidao 5; YJ-8, Yangfujing 8. 2 N0, zero-N; CK, no N reduction, SR, N split reduction, BR, basal N reduction; TR, tillering N reduction; PR, promoting-spikelet N reduction; KR, keeping-spikelet N reduction. 3 No shared letter indicates statistical significance at the p = 0.05 level within the same column.
Publisher’s Note: MDPI stays neutral with regard to jurisdictional claims in published maps and institutional affiliations.

