Abstract
Rice (Oryza species) is a commercial crop worldwide. Across Africa, the potential yield and quality of rice is diminished by a lack of high performance, locally adapted varieties, and the impact of rice yellow mottle virus (RYMV). The objective of this study was to assess the performance of a diverse collection of rice germplasm for RYMV resistance and agronomic traits, and to select promising lines for breeding for Tanzanian conditions. Fifty-four rice genotypes were field evaluated in two important rice production sites (Ifakara and Mkindo) in Tanzania, which are recognized as RYMV hotspots, using a 6 × 9 alpha lattice design with two replications. There was significant (p < 0.05) genotypic variation for agronomic traits and RYMV susceptibility in the tested germplasm. Seven genotypes with moderate to high RYMV resistance were identified, including Salama M-57, SSD1, IRAT 256, Salama M-55, Mwangaza, Lunyuki, and Salama M-19, which were identified as new sources of resistance genes. Positive and significant correlations were detected between grain yield and number of panicles per plant (NPP), panicle length (PL), number of grains per panicle (NGP), percentage-filled grains (PFG), and thousand-grain weight (TGW), which are useful traits for simultaneous selection for rice yield improvement. A principal component analysis allocated five principal components, accounting for 79.88% of the total variation present in the assessed germplasm collection. Traits that contributed most to variability included NPP, number of tillers/plant (NT), PL, grain yield (GY), and days to 50% flowering (DFL). The genotypes Rangimbili, Gigante, and SARO possess complementary agronomic traits and RYMV resistance, and can be recommended for further evaluation, genetic analysis, and breeding.
1. Introduction
Rice (Oryza sativa L., 2n = 2x = 24) is an economically important crop in East, Central and West Africa [1] and globally [2]. Rice is a source of 80% of the caloric intake for nearly one billion people in Africa [3]. Africa accounts for nearly 3.0% of the global rice production. About 25% of Africa’s rice requirements have to be met with imports due to the low levels of local production, high levels of population growth, quality preferences, urbanisation and changes in lifestyle [4].
Rice is widely cultivated and commercialized in Tanzania for food security and as a cash crop, ranking second after maize in total production and consumption [5]. The crop is largely cultivated by small-scale farmers cultivating less than one-hectare per household. Rice yields in Tanzania remain low, with yields of 1.0 and 1.5 tons per hectare (t ha−1) compared to the yield potential of the crop of 5.0 t ha−1 [6,7]. The low yields are caused by biotic, abiotic, and socio-economic constraints prevalent in sub-Sahara Africa [8,9,10].
Rice yellow mottle virus (RYMV) disease is the major biotic constraint under both the rain-fed and irrigated rice production agro-ecologies in Tanzania [10,11]. Due to RYMV infection, yield losses between 20 and 100% have been recorded in susceptible rice varieties [12,13,14]. RYMV emerged in 1966 in sub-Sahara Africa (SSA) [15]. The RYMV is found in all rice production systems in Africa, affecting 23 countries including Tanzania [16,17,18]. RYMV transmission and distribution is mainly facilitated by insect vectors, irrigation water, wind, field workers, and farm animals [19]. Infected volunteer rice plants from a previous crop are ideal sources of RYMV infection to newly planted and healthy crops [10]. Several chewing insect species, notably the Chrysomelid beetles (Sesselia pusilla, Chaetocnema pulla, Trichispa sericea, Dicladispa viridicyanea) and grasshoppers (Conocephalus merumontanus) are among the key vectors that transmit RYMV from cultivated rice, wild hosts, and weeds to healthy rice crop stands [20].
The RYMV is an icosahedral virus belonging to the genus Sobemovirus. The pathogen is extremely stable and remains highly infectious under favourable environmental conditions [15]. Under controlled environment conditions, the RYMV remains infectious for 33 days but loses its pathogenicity after about 51 days [21]. Ref. [15] reported that with high ambient temperatures (>30 °C), RYMV induces systemic symptoms 4–5 days after infection, while prolonged periods of temperatures below 20 °C delay symptom appearance up to 10–12 days. There are various RYMV strains based on their geographical and ecological origins [22]. The diversity among RYMV strains in Africa was first assessed using polyclonal and monoclonal antibodies [20,23]. The RYMV diversity was subsequently characterized using the reverse transcriptase polymerase chain reaction for two primers, Prymv1 and Prymvy2, in Tanzania. This indicated the presence of three RYMV strains in the country, each belonging to a specific and restricted geographical range [24,25]. RYMV strains exhibit differences in virulence and pathogenicity, resulting in differential reactions by rice genotypes. Some RYMV-resistant rice cultivars have become susceptible when cultivated in new agro-ecologies due to the emergence of virulent strains [26].
RYMV infection and disease development is characterized by the appearance of mottling and yellowing spots [12], which coalesce and become parallel to the leaf veins about two weeks after infection [27]. Infected plants show stunted growth, reduced tillering ability, non-synchronous flowering, poor panicle exertion, reduced number of spikelets, grain sterility, and brown to dark brown discoloration of grains. Under severe infection, RYMV leads to the death of infected plants and crop failure [28,29]. RYMV infection and disease development is affected by the virulence, the virus strain, the rice genotype, the growth stage of the plants, the environment (e.g., light intensity, day length, humidity, and temperature) and their interactions. Field incidence, severity assessment, and serological analysis are the most widely used methods for RYMV diagnosis, rating, and cultivar evaluation. Visual rating of RYMV infection is relatively easy, and it is more efficient when evaluating a set of genotypes that include both resistant and susceptible controls [28].
Various control measures have been recommended for the management of RYMV [10]. These include the use of various crop protection chemicals, cultural practices, biological control agents, and host plant resistance. Chemical insecticides are widely used to suppress the population of the RYMV-transmitting vectors [30]. However, there are many vectors of RYMV, which are present at different crop growth stages, necessitating repeated applications of pesticides. Consequently, this practice is expensive and increases the cost of rice production. Small-scale farmers in Tanzania cannot afford to purchase sufficient chemical pesticides, and consequently they use sub-optimal rates, leading to poor efficacy and pesticide resistance. The prolonged use of chemicals with similar modes of action or from the same group such as belonging to organochlorines, organophosphates, and carbamates, has led to the development of pesticide-resistant pest populations due to mutation events [10]. Pesticide resistance leads to the application of increasingly higher volumes of chemicals, driving the cost of production even higher. Furthermore, these insecticides pose health hazards to the farmers, and create environmental pollution issues in the long term. RYMV can be partially managed using cultural practices such as residue burning, destroying volunteer plants, and using scheduled crop rotations to deprive the pathogen of any alternate hosts. However, these practices are time-consuming and have limited efficiency in controlling RYMV disease [31]. In addition, crop rotation is not implemented by smallholder farmers because their farms are too small to apply this effectively. Furthermore, the availability of labour is limited, impeding the practice of field sanitation [9,32]. Furthermore, the spread of RYMV by multiple agents renders these management practices relatively ineffective [10], and hence alternative and effective integrated options are required.
Host plant resistance is a cost-effective and sustainable strategy to control RYMV. High levels of RYMV resistance have the potential to increase rice productivity in RYMV endemic regions, while reducing the cost of production. Cultivars with RYMV resistance require reduced levels of crop protection chemicals and should attain significantly higher yields. Successful deployment of RYMV-resistant cultivars depends on the identification of sources of RYMV resistance genes among divergent and complementary parental lines. The RYMV1 (allele rymv1-2) and RYMV2 genes have been identified as two RYMV resistance genes in Oryza species [33,34,35]. Furthermore, resistance conferred by the RYMV3 gene has been identified in a O. glaberrima accession, Tog5307 [35].
Currently, there are no rice varieties with known RYMV resistance grown in Tanzania. The majority of introduced rice varieties and landraces that have been grown in Tanzania have succumbed to RYMV infection [12]. Most introduced cultivars and landraces that are currently in production or have been preserved in gene banks have not been systematically evaluated in RYMV resistance breeding programs in Tanzania. There is a need to evaluate the locally available genotypes and introductions with known RYMV resistance to develop agronomically superior and resistant cultivars. Sources of RYMV resistance have been identified in O. sativa varieties, such as Gigante and Bekarosaka, and O. glaberrima varieties, such as Tog5681, Tog5672, Tog5674, and Tog7291 [31,36]. These genetic resources could be valuable for breeding RYMV-resistant rice varieties for Tanzania.
Understanding the extent of genetic variation present in a germplasm collection and selection of complementary lines with economic traits and RYMV resistance is a prerequisite for rice improvement [37]. Wide phenotypic variations exist among Tanzania rice landraces and introduced genotypes [38]. The genetic diversity present in the Tanzania rice collections could be explored using morphological, biochemical, and molecular (DNA) markers. Ref. [39] used Simple sequence repeats (SSRs) markers to analyse 70 rice landraces in Tanzania. Ref. [38] characterized the genetic diversity present in 79 Tanzanian rice landraces using SSR markers. Similarly, ref. [40] assessed the genetic diversity and population structure of 54 rice genotypes using SSR markers. Morphology-based characterization has been widely used in rice as a quick, easy, and less costly approach than DNA-based marker systems [41].
There are a few recent phenotypic diversity studies on rice for agronomic traits and RYMV resistance in Tanzania. Ref. [42] characterized wild rice populations from some selected areas of Tanzania using morphological traits. However, comprehensive and up-to-date data are lacking on agro-morphological descriptions as is an assessment of RYMV resistance in the genetic resources of Tanzanian rice using diverse populations, landraces, and introduced varieties. This assessment will ensure the selection of parental genotypes with resistance to RYMV and agronomic traits for genetic enhancement and effective breeding. Therefore, the objective of this study was to assess the performance of a diverse rice germplasm collection for RYMV resistance and agronomic traits, and to select promising lines for breeding.
2. Materials and Methods
2.1. Plant Materials
The study used a panel of 54 rice genotypes, which comprised samples from farmers’ landraces and introduced collections from the Tanzania Agricultural Research Institute (TARI), Sokoine University of Agriculture (SUA) in Tanzania, AfricaRice in Benin and Côte d’Ivoire, and from smallholder farmer fields in Tanzania. The details of the germplasm used in the study are summarised in Table 1. The panel included 29 landraces that are adapted to Tanzania agro-ecologies and grown widely by small-scale farmers. The landraces are predominantly aromatic and are preferred by farmers and local markets. Six genotypes belonging to the New Rice for Africa (NERICA) types were included. The NERICA types were developed by the AfricaRice consortium from interspecific crosses between the O. glaberrima (African rice) and O. sativa (Asian rice) species. Genotype Gigante, a rice cultivar widely cultivated in West Africa, was included. The NERICA and Gigante genotypes were introduced in Tanzania in 2008 by AfricaRice, and they are usually grown under upland and lowland agro-ecologies, respectively. There were five genotypes that were introduced from the International Rice Research Institute (IRRI) in the Philippines. These genotypes are adapted and cultivated under paddy production systems. The paddy types were included in the study for their high yield potential, although these genotypes are susceptible to drought stress. Furthermore, six irrigated and seven lowland, rain-fed genotypes were included, which had been developed by TARI and SUA, respectively.

Table 1.
List of the rice genotypes used in the study and their sources.
2.2. Description of Experimental Sites
The field trials were conducted in two selected sites in Tanzania, namely Mkindo situated in the Mvomero district, and Ifakara in the Kilombero district. The sites were purposefully selected for being the major rice production agro-ecologies [43], with high levels of RYMV infection [9]. The Ifakara site (08°03′693″ S; 036°40′005″ E, 286 masl) is characterized by two cropping seasons based on the amount of rainfall received. The short crop season commences in November and ends in February, while the long rainy season starts in March and ends in May or June. The total annual rainfall received at this site is 935 mm. The monthly temperatures range between 26 °C and 32 °C. Heavy clay soils with a pH of 6.0 are dominant at the Ifakara site. The site at Mkindo is located at a latitude of 06°15.344′ S and longitude of 037°32.387′ E, with an altitude of 345 to 365 m above sea level (masl). The site has a bimodal rainfall. The short rainy season extends from October to December, while the long rainy season occurs between March and May. The average annual temperature is 24 °C with a minimum of 15 °C in June and a maximum of 32 °C in February. The dominant soil texture at the Mkindo site is clay loam with a pH of 6.2. The Mvomero and Kilombero districts are recognized hotspots for RYMV.
2.3. Experimental Design and Management
The experiments at both sites were laid out in a 6 × 9 alpha lattice design with two replications. The plot sizes were 2.4 m × 2.4 m in which plants were spaced 20 cm between rows. Seeds were directly sown at the Ifakara site at the beginning of February in 2018. Experimental units at the Mkindo site were established using seedling transplants. Seedlings were transplanted in April, 21 days after sowing, with one seedling per hill. Gap filling was done as necessary within two weeks after direct sowing or transplanting to ensure uniform crop stands. Nitrogen fertilizer was applied at a rate of 80 kg N ha−1 in the form of urea (46% N) in two instalments as a top dressing. The first and second applications were done at the tillering and booting stages, respectively. Hand weeding was carried out three times at each site to prevent weed infestation. After direct seeding or transplanting, sufficient soil moisture was maintained in each plot using supplemental irrigation at both sites.
2.4. Data Collection
Quantitative agronomic traits and RYMV resistance were recorded according to the descriptors of [44]. RYMV severity was scored on a scale of 1 to 9; where a score of 1 represented no symptoms; a score of 3 represented plants with sparse dots or streaks on green leaves, and less than 5% reduction in plant height; a score of 5 represented plants with mottling on green or pale green leaves, and 6–25% reduction in plant height and slightly delayed flowering; a score of 7 represented plants with yellow or pale yellow leaves with a 26–75% reduction in plant height and delayed flowering; while a score of 9 was assigned to plants with yellow or orange leaves, with more than 75% reduction in plant height and no flowering. Data on the following agronomic traits were collected: the days to 50% flowering (DFL) were counted from sowing to the date when half of the plants in a particular plot had flowered; the number of tillers per plant (NT) was counted at physiological maturity and recorded as the average of 10 selected and tagged plants in a row; the number of panicles per plant (NPP) was counted from ten plants at harvest and recorded as the number of fully exerted panicles bearing grains and recorded as an average per plant; plant height (PH in cm) was measured from the soil surface to the tip of the longest panicle on ten tagged plants in each plot; panicle length (PL) was measured in centimetres using a ruler from the tip of the panicle to the ciliate ring at the base on the ten selected plants per plot; number of grains per panicle (NGP) was counted using a seed counter and recorded as a mean of 10 panicles per plot; percent filled grains (PFG) was calculated as the proportion of unfilled grains to the total number of grains from 10 sampled panicles per plot; the 1000-grain weight (TWG, expressed in grams) for each genotype was counted using an Elmor seed counter (model, source) and weighed on an electric balance in grams; grain yield (GY) was weighed per plot after adjusting to 14% moisture content and converting to tons per hectare.
2.5. Data Analysis
The data were subjected to analysis of variance (ANOVA) using the restricted maximum likelihood model (REML) procedure for alpha lattice designs in GenStat 24th edition [45]. Genotype was set as a fixed factor, while location and genotype by location interaction, replication, and block were treated as random factors using the following model:
where μ is the overall mean, and Gi, Lj, GLij, Rk(j), and Bl(j,r) represent the effects of genotype, location, the genotype × location interaction, replication in location, and the incomplete block in replication, respectively. ε is the random error term. Traits means were separated by the Fischer’s Unprotected least significant difference at the 5% probability level. The correlations among traits were computed using the Pearson correlation procedure with the SPSS version 24 [46]. A correlation matrix-based principal component analysis (PCA) was performed to elucidate the genotype-trait relationships with a biplot generated in Genstat 24th edition [45].
3. Results
3.1. Analysis of Variance (ANOVA) for Grain Yield and Yield-Related Traits, and the RYMV Disease Parameter
Table 2 summarizes the results from the combined ANOVA for all the measured agronomic traits and the RYMV disease parameter. The genotype × site interaction effects were highly significant (p < 0.001) for PH, PL, NGP, PFG, TGW, RYMV, and GY. Highly significant differences were detected among the genotypes and sites for all the measured agronomic and RYMV disease reaction (RYMVD) parameters, except for DFL.
Table 2.
Mean squares and F-tests for agronomic traits and RYMVD reaction among 54 rice genotypes evaluated at two locations in Tanzania.
3.2. Mean Performance of Genotypes for Agronomic Traits and the RYMVD Parameter
The genotypes exhibited variable agronomic performance and RYMVD reactions across the two sites (Table 3). The mean DFL among the test genotypes was 85 days. Genotypes such as Cherehani, SSD1, WAB450, Mwangaza, Ringa, and Mbawambili were the earliest to reach 50% flowering, after 57, 62, 64, 69, 71, and 72 days, respectively, at the Ifakara and Mkindo sites. Genotype Mpaka wa bibi was the slowest to flower after 104 days at the Ifakara and Mkindo sites. In terms of tillering capacity, the genotypes Gigante, Rangimbili nyekundu, IR64, IR72, and Shingo ya mwali produced the most tillers per plant at both sites, while Sumbawanga had a mean of five tillers at each site. The PH ranged between 77 and 156.7 cm, with a mean of 108.7 cm. Genotypes Mwanza, TXD85, and TXD307 were the shortest genotypes with PHs of 77.8 cm, 82.6 cm, and 84.2 cm, respectively, at both sites. Genotype IRAT 256 was the tallest at 157.7 cm. NPP ranged from 4 to 10 with a mean of 7. Genotypes Gigante and Sumbawanga were recorded with the highest and lowest NPP values, respectively. The trait PL ranged from 18.7 to 25.3 cm, with a mean value of 22 cm. Genotypes IRAT 256, Serena, and Mpaka wa bibi had the longest PL values, while the shortest PLs were recorded for the genotypes Nerica 1 (19.8 cm) and Nerica 7 (20 cm). NGP ranged from 85 to 184 with a mean of 143. Genotypes Serena, Kisegese, Gigante, and Zambia had the highest NGPs of 184, 182, 179, and 178, respectively. The lowest NGPs were recorded for genotypes Mwangaza (88) and IR64 (100). PFG varied from 83.7 to 97.4% with a mean of 92.3%. Genotypes Nerica 7, IRAT 256, and Salama M-55 had the highest PFG values of 96.8, 95.9, and 95.8%, respectively. The TGW ranged from 23 to 37.2 g with a mean of 30.2 g. Heavier TGW values of 37.2, 36.5, and 35 g were recorded for the genotypes Mwangaza, Mbega, and Salama M-55, respectively. The genotype Mpaka wa bibi followed by Limota, Kalalu and IR56 had the lowest TGWs.
Table 3.
Mean values for agronomic traits and RYMVD reaction of 54 rice genotypes evaluated at two locations in Tanzania.
The RYMVD ratings ranged from 1 to 7 with a mean of 5. Genotypes Salama M-57, SSD1, IRAT 256, Lunyuki, Salama M-19, Salama M-55, and the resistant check Mwangaza exhibited highly resistant reactions to RYMVD with scores of 1. Genotypes with a RYMVD score of 3 included Nerica 1, Nerica 2, Nerica 7, IR56, IR64, IR68, Kalalu, TXD307, and TAI. Moderately resistant genotypes with RYMVD ratings of 5 included Turiani, Moshi, and Shingo ya mwali. The other genotypes, including the susceptible check SARO 5, were susceptible with RYMVD ratings between 5 and 7. The mean GY of the test genotypes was 2.5 t ha−1. The genotypes with the highest GY values were SARO (4.1 t ha−1), and Rangimbili nyekudu and Mbega (>3.7 t ha−1), while Nerica 4 (1.0 t ha−1) had the lowest GY.
3.3. Correlations among Agronomic Traits and RYMVD Reaction
The magnitude of trait correlations revealed variable pairwise associations within and between sites (Table 4 and Table 5). GY exhibited moderate and positive correlations with NPP (0.29≤ r ≤0.44, p ≤ 0.05), PL (0.28≤ r ≤0.34, p ≤ 0.05), NGP (0.28 ≤ r ≤ 0.54, p ≤ 0.05), PFG (0.34 ≤ r ≤ 0.38, p ≤ 0.05) and TGW (r = 0.43 ≤ r ≤ 0.48, p ≤ 0.05) within and across sites. The associations between GY and RYMVD were also moderate but negative (−0.33 ≤ r ≤ −0.40, p ≤ 0.05) within and between sites. There were also variable and significant associations among the secondary traits. For instance, TGW had significant and positive associations with PH (0.28 ≤ r ≤ 0.36, p ≤ 0.05), NGP (0.29 ≤ r ≤ 0.48, p ≤ 0.05) and PFG (0.31 ≤ r ≤ 0.41, p ≤ 0.05) at the two sites. RYMVD exhibited negative correlations with most traits and significantly correlated to DFL (r = −0.27, p ≤ 0.05) at Ifakara and NGP (r = −0.34, p ≤ 0.05) across the two sites.
Table 4.
Pearson correlation coefficients of phenotypic traits and rice yellow mottle virus (RYMV) reaction of 54 rice genotypes screened at Ifakara (upper diagonal) and Mkindo (lower diagonal) sites in Tanzania.
Table 5.
Pearson correlation coefficients of phenotypic traits and RYMVD reaction of 54 rice genotypes evaluated across two sites.
3.4. Principal Components Analysis (PCA)
The rotated component matrix revealed the proportion of total variance described by each principal component (PC) and their correlations with the traits (Table 6). The first five and four PCs with Eigenvalues greater than 1 explained 78.32% of the genotype variation at the Ifakara and Mkindo sites, in that order. The first PC accounted for 23.44% of genotype variance and was positively associated with NT (with a loading score of 0.87) and NPP (0.82), while NGP (−0.71) had a negative contribution. The traits with major contribution on PC2 were DFL (0.71), RYMVD (0.62), and PL (0.58).The key traits allocated on PC3 were TGW and GY. The variation on the fourth and fifth PCs was contributed by DFL, PFG, PH, and PL. At the Mkindo site, the first four PCs accounted for 70.78% of the total variation. PC1 accounted for 27.40% of the variation, which was mostly due to the positive contributions by NPP (0.81), NT (0.77), and RYMVD (0.54), whereas PFG (−0.61) was a negative contributor. In comparison, trait variation linked with PC2 was accounted for by differences in NGP (0.82), RYMVD (0.53), DFL (0.52), and PH (0.50). The variation on PC3 was largely due to TGW (0.75) and GY (0.60), while the PC4 was negatively correlated with GY (−0.52). The combined results showed that 79.88% of the total variation across sites was elucidated by the first five PCs. PC1, PC2, PC3, PC4, and PC5 accounted for 24.30%, 20.15%, 14.16%, 11.19%, and 10.08% of the variation, respectively. PC1 was mostly correlated with NPP, NT, PL, GY, and DFL. Much of the variation on PC2 was contributed by NGP, RYMVD, and DFL. The traits most strongly correlated with PC3 were TGW, GY, and PH. The fourth PC accounted for much of the variation in PFG, PH, and DFL, while PC5 was correlated to PL, NGP, and GY.
Table 6.
Rotated component matrix of phenotypic traits and RYMVD reaction on 54 rice genotypes evaluated at Ifakara and Mkindo sites, and across sites.
3.5. Principal Component Biplot Analysis
Figure 1, Figure 2 and Figure 3 depict the associations among the various traits and genotypes with respective principal components within and across locations. The two PCs of the PCA biplot explained only 41.50% of the total variation at Ifakara (Figure 1). The biplot revealed strong and positive correlations among NPP, NT, RYMVD, DFL, PL, and GY. Furthermore, the biplot showed that there were pairwise correlations between TGW and PH, and NT and NPP. Genotype E8 (Serena) was in close proximity to the vectors for DFL, PL, GY, and RYMVD. The vectors for TGW and PH were associated with genotype E43 (Sumbawanga), while genotypes E38 (IR64) and E19 (IR72) were in close proximity with the NPP and NT vectors. The PFG vectors correlated with genotypes E13 (Mwangaza) and E2 (SSD1), though they exhibited a negative association with the vector for GY.
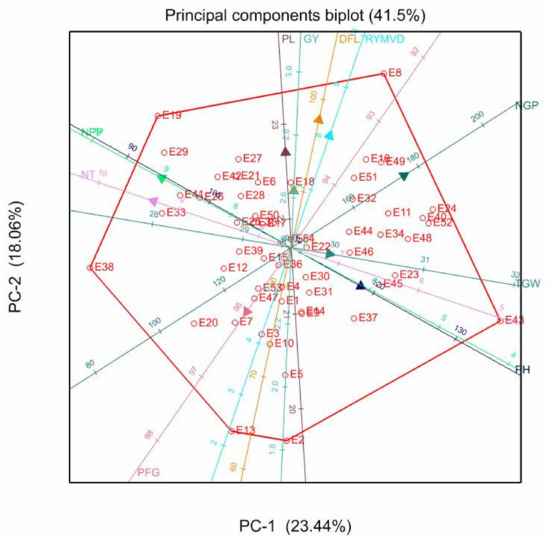
Figure 1.
Genotype-trait biplot showing the relationship of agronomic traits in 54 rice genotypes evaluated at the Ifakara site. Notes: DFL = Days to 50% flowering; NT = number of tillers/plant; NPP = number of panicle/panicle; PH = plant height; PL = panicle length; NGP = number of grains/panicle; PFG = percentage filled grains/panicle; TGW = 1000 grain weight; GY = grain yield; RYMVD = rice yellow mottle virus disease reaction; E = entry number designated on Table 3.

Figure 2.
Genotype-trait biplot showing the relationship of various traits in 54 rice genotypes evaluated at the Mkindo site. Notes: DFL = Days to 50% flowering; NT = number of tillers/plant; NPP = number of panicle/panicle; PH = plant height; PL = panicle length; NGP = number of grains/panicle; PFG = percentage filled grains/panicle; TGW = 1000 grain weight; GY = grain yield; RYMVD = rice yellow mottle virus disease reaction; E = entry number designated on Table 3.
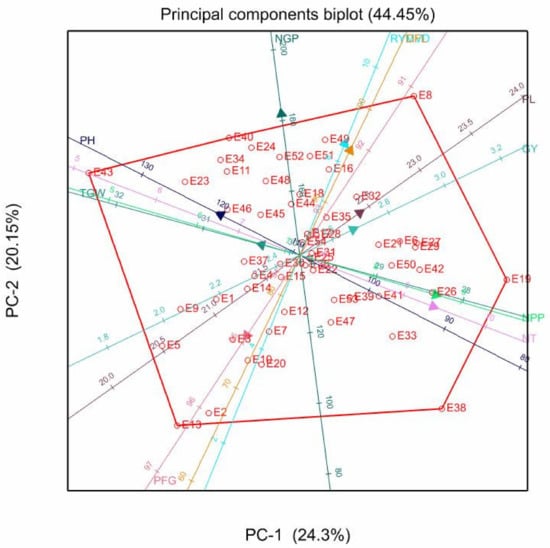
Figure 3.
Genotype-trait biplot showing the relationship of various traits in 54 rice genotypes evaluated across two locations. Notes: DFL = Days to 50% flowering; NT = number of tillers/plant; NPP = number of panicle/panicle; PH = plant height; PL = panicle length; NGP = number of grains/panicle; PFG = percentage filled grains/panicle; TGW = 1000 grain weight; GY = grain yield; RYMVD = rice yellow mottle virus disease reaction; E = entry number designated on Table 3.
The biplot dimension vectors at the Mkindo site explained 45.59% of the variation (Figure 2). The biplot showed positive correlations between NT and NPP, DFL and RYMV, and PL and GY. The vectors for PH and NGP, TGW, and PFG were also close, suggesting their positive correlation. The genotype E19 (IR72) was plotted next to the vectors for NT and NPP, indicating higher values for these traits than most other genotypes. The vectors for DFL and RYMVD were associated with genotypes E49 (Kisegese) and E51 (Sindano nyeupe), although these were not vertex genotypes. For PL and GY, the associated genotypes were E32 (Moshi) and E27 (Mwanza). In addition, E34 (Kalundi) and E40 (Afaa Mwanza) were correlated with NGP, though these genotypes were not on the polygon vertices. The traits TGW and PFG were associated with genotypes E5 (IRAT 256) and E9 (Nerica 4).
The PCA biplot based on combined data showed that 44.45% of the variation could be explained by PC1 and PC2 (Figure 3). There were positive associations among NGP, DFL, and RYMVD. Similarly, there were positive pairwise associations between PL and GY, NPP, and NT, and PH and TGW, while PFG was not positively correlated to any particular trait. The vertex genotypes included genotype E8 (Serena), which was associated with NGP, DFL, RYMVD, PL, and GY; genotype E19 (IR72), which correlated to NPP and NT; and genotype E43 (Sumbawanga) with correlation to PH and TGW. The last vertex genotype was E10 (WAB450), which had a correlation with PFG. Vertex genotypes attained higher values for the associated traits.
4. Discussion
4.1. Genotypic Variation and Mean Performance
The study assessed variation present among 54 rice genotypes grown in Tanzania using agronomic traits and RYMV parameters to identify suitable parental lines for RYMV resistance breeding. The test genotypes exhibited significant variation for yield and yield components and RYMV resistance (Table 2). This suggests that the genotypes harbour adequate genetic variation for improving agronomic performance and RYMV resistance in rice. The variation among genotypes emanates from differences in their genetic constitution and the environment [47,48]. Genetic variability among rice genotypes for yield and yield-related traits was also reported by the authors of [49,50] in India.
The rice genotypes used in this study were collected from different sources, where they were developed with different pedigrees and breeding objectives, which gave rise to significant variation. For instance, the NERICA genotypes were specifically developed for upland and drier ecologies and are derivatives of O. glaberrima and O. sativa interspecific-crosses. Other genotypes such as Supa, SARO, Gigante, TAI, Salama M-19, Salama M-55, Lunyuki, and Salama M-57 are Asian genotypes developed for lowland and wet ecologies. The genetic differences conferred variable performances and adaptations in genotypes of diverse genetic backgrounds. The landraces such as Rangimbili nyekundu and Mbega performed well (Table 3), probably due to their adaptation to the growing conditions in Tanzania. Adaptation among landraces reflects successful adaptation due to selection pressure applied by farmers and to suitable climatic factors [51].
The tested rice genotypes had significant genotype × site interactions (Table 2), showing differential performances over the two test locations. The results are in agreement to reports by the authors of [52], who found that the test environment was influential in genotype performance. Genotype × environment interaction effects become significant when genotype performance is not consistent over different locations. The observed phenotypic expression that is quantified during germplasm evaluation is partially conditioned by genetic and environmental factors that influence trait expression. The differential response over locations can provide opportunities to identify genotypes with stable and broad adaptation to different ecologies. The genotypes exhibited significant variation and differential RYMV scores in different sites, which provides an opportunity to identify the genotypes with the most stable RYMV resistance and to identify the best site for RYMV screening. According to the authors of [53,54], RYMV reactions depend on the test environment. Genotype × environment effects confound selection efforts by masking genotypic potential due to significant environmental variance. Significant genotype × environment interaction effects can reduce the correlation between genotype and phenotypic expression, limiting selection response during breeding or cultivar recommendation [55].
Genotypes such as Salama M-55, IRAT 256, Lunyuki, Salama M-19, Salama M-57, SSD1, and Mwangaza had low values for RYMV scores (Table 3) and are potential sources of new RYMV resistance genes; therefore, they were selected for subsequent breeding activities. However, breeding for high performance in stress-prone environments and in diverse rice-producing ecologies must target selection for multiple traits to increase adaptability to the erratic and harsh growing conditions. It is imperative to consider other agronomic traits to complement RYMV resistance. The genotypes with RYMV resistance did not exhibit a comparative advantage in agronomic performance or grain yield, probably due to poor yield potential. Such genotypes must be crossed with high potential and complementary genotypes with suitable genetic backgrounds. Genotypes such as Salama M-55, IRAT 256, Lunyuki, Salama M-19, Salama M-57, and Mwangaza can provide new genes for RYMV resistance while Gigante, Rangimbili nyekundu, Zambia, and SARO 5 can provide suitable agronomic traits such as high grain yield.
4.2. Traits Associations
Grain yield is a complex trait that is influenced by several interdependent secondary traits. Understanding the relationships among the secondary traits and grain yield is vital to devise appropriate selection strategies. Due to environmental variance that reduces selection efficiency [56], direct selection for grain yield may not be effective. Thus, knowledge of its relationship with secondary traits is important to guide indirect selection. The variable correlations exhibited by secondary traits with grain yield present both opportunities and challenges for indirect selection. Selection for traits such as the number of panicles per plant, panicle length, number of grains per plant, percentage filled grains, and thousand-grain weight that exhibited positive correlations with grain yield will simultaneously improve grain yield potential. The positive relationship between these traits and grain yield was previously reported in other studies. For instance, refs. [57,58] found that grain yield was positively correlated with productive tillers per plant, number of grains per panicle, and 1000-grain weight in rice in their independent studies. However, indirect selection becomes complicated when at least one of the traits positively linked to other secondary traits exhibit unfavourable associations with grain yield. There were un-favourable negative associations among the number of grains and the number of panicles per plant, and RYMVD resistance, with the number of grains per panicle, which would complicate indirect selection for grain yield. The selection of the number of panicles and grains per plant would indirectly increase grain yield but reduce negatively associated traits such as grains per panicle. Such unfavourable correlations have been identified in some traits due to linkage drag. Ref. [59] found that grain number per panicle and panicle number had a negative association that compromised grain yield. They subsequently conducted a genetic association study that revealed linkage drag among desirable traits in rice. Similarly, linkage drag attributed to a negative correlation between root capability and tillering capacity was found to limit breeding progress for drought-resistant rice [60]. Negative correlations caused by genetic linkage drag would be difficult to break unless alternative breeding techniques are used such as mutation breeding. A significant negative correlation between RYMVD and grain yield indicates that the RYMV is the main cause of yield losses, as reported by others [54]. Moreover, RYMV disease causes spikelet sterility and reduced grain weight, both leading to yield losses [61].
Assessing genetic variability using principal component analysis allows the breeder to quantify the relative importance of each trait in discriminating a set of genotypes. The high proportion of variation accounted by the first two PCs in this study (Table 6) shows that traits that are associated with these PCs will explain much of the variation in the test genotypes and offer an opportunity to select for the best genotypes. The high and positive loadings by NT, NPP, PL, and GY on PC1 and PC2 at the Ifakara and Mkindo sites indicate that these traits exhibit wide variation that enabled for discrimination between the test genotypes. These traits can be simultaneously selected for rice improvement. The findings of this study are corroborated with those reported by [62,63,64]. Similarly, ref. [65] found that the number of grains per panicle, plant height, and days to 50% flowering contributed the most to the total variation in rice. In addition, ref. [66] reported that NPP contributed highly to the total variation in rice evaluated in rain-fed lowland ecologies. Therefore, the selection of these traits should achieve rapid improvement of grain yield.
The genotype–trait biplot depicts relationships between genotypes and traits, which assists in the selection of genotypes with multiple desirable traits. This is unlike univariate analysis methods that can only compare one trait at a time [67]. Genotypes IR72, Rangimbili nyekundu, and TXD 307 were positively associated with traits NT and NPP. On the other hand, genotype Moshi associated most with PL and GY, while genotypes Serena and Afaa mwanza were highly correlated with DFL and NGP. These correlations indicated that the genotypes performed well for these traits. Conversely, genotypes Nerica 4, IRAT 256, and IR64 were not associated with a specific trait vector, showing that they performed below average for most traits. The close association of genotypes Kisegese and Sindano nyeupe with the RYMV vector and their plotting in the direction of the RYMV vector indicates that they had high RYMV scores that are linked to susceptibility. The depiction in the biplots corroborated with the analysis of variance, which showed that there was significant variation, and the genotypic means, which identified the genotypes with superior performance for particular traits. Genotypes SARO, Rangimbili, and Gigante were selected for grain yield. On the other hand, genotypes Salama M-57, SSD1, IRAT 256, Salama M-55, Mwangaza, Lunyuki, and Salama M-19 were identified as possible sources of RYMV resistance genes due to their consistently low RYMVD scores.
5. Conclusions
The study evaluated a diverse rice collection at two locations in Tanzania where RYMV is prevalent in rice crops. It provided a basis to select the best genotypes and to understand genotype and environmental influences on agronomic performances and RYMV reactions. Significant variation was detected among the assessed genotypes for selection for grain yield and improved RYMV resistance in Tanzania. The PCA identified the number of tillers, number of panicles per plant, panicle length, and grain yield as the most important traits for discriminating between the test genotypes. Genotypes Salama M-57, SSD1, IRAT 256, Salama M-55, Mwangaza, Lunyuki, and Salama M-19 were selected as new sources of RYMV resistance genes under Tanzanian conditions. Genotypes such as Rangimbili, Zambia, SARO 5, and Gigante were selected with desirable agronomic traits, high yield potential, and RYMV resistance. Further studies to assess grain quality will be required to incorporate market-preferred traits, while combining these traits with ability tests will identify breeding populations with good combining-ability effects for RYMV resistance and high grain yield potential.
Author Contributions
Each author has participated in the completion of this work. H.S., M.L., I.M., and A.I.T.S. contributed to the review of this manuscript. W.T.S. implemented the experiments, data analysis and wrote up the original draft of the manuscript. All authors have read and agreed to the published version of the manuscript.
Funding
This research was supported by the Alliance for Green Revolution in Africa (AGRA) through the African Centre for Crop Improvement (PASS030), University of KwaZulu-Natal.
Acknowledgments
The Alliance for a Green Revolution in Africa (AGRA) is gratefully acknowledged for financial support of the study through the African Centre for Crop Improvement (ACCI) at the University of KwaZulu-Natal (UKZN); the Tanzania Agricultural Research Institute is thanked for providing the screen house for population development and transport from one site to the other. Thanks are due to the Permanent Secretary, Ministry of Agriculture and the Government of Tanzania, for giving study leave to the first author.
Conflicts of Interest
The authors declare no conflict of interest.
References
- Mwalyego, F.S.; Maganga, R.M.; Luzi-Kihupi, A.; Ndunguru, A.A.; Kabungo, D.A. Evaluation and deployment of rice genotypes resistant to rice yellow mottle virus disease in the southern highlands of Tanzania. Huria J. 2017, 2, 33–45. [Google Scholar]
- Zhang, Q.J.; Zhu, T.; Xia, E.H.; Shi, C.; Liu, Y.L.; Zhang, Y.; Liu, Y.; Jiang, W.K.; Zhao, Y.J.; Mao, S.Y. Rapid diversification of five Oryza AA genomes associated with rice adaptation. Proc. Natl. Acad. Sci. USA 2014, 111, E4954–E4962. [Google Scholar] [CrossRef]
- Tao, J.; Li, Y.O. Edible insects as a means to address global malnutrition and food insecurity issues. Food Qual. Saf. 2018, 2, 17–26. [Google Scholar] [CrossRef]
- Balasubramanian, V.; Sie, M.; Hijmans, R.J.; Otsuka, K. Increasing rice production in sub-Saharan Africa: Challenges and opportunities. Adv. Agron. 2007, 94, 55–133. [Google Scholar]
- Hubert, J.; Lyimo, H.J.F.; Luzi-Kihupi, A. Geographical variation, distribution and diversity of rice yellow mottle virus phylotypes in Tanzania. Am. J. Plant Sci. 2017, 8, 1264–1284. [Google Scholar]
- Kilimo-Trust. Expanding Rice Markets in the EAC: An Opportunity for Actors in the Value Chain; Kilimo Trust: Dar es Salaam, Tanzania, 2012; 45p. [Google Scholar]
- Food and Agriculture Organization. The Rice Value Chain in Tanzania. A Report from the Southern Highlands food Systems Programme; Wilson, R.T., Lewis, I., Eds.; FAO: Dar es Salaam, Tanzania, 2015; 9p. [Google Scholar]
- Mghase, J.J.; Shiwachi, H.; Nakasone, K.; Takahashi, H. Agronomic and socio-economic constraints to high yield of upland rice in Tanzania. Afr. J. Agric. Res. 2010, 5, 150–158. [Google Scholar]
- Hubert, J.; Luzi-Kihupi, A.; Hébrard, E.; Lyimo, H.J.F. Farmers’ knowledge and perceptions of Rice yellow mottle virus in selected rice growing areas in Tanzania. Int. J. Sci. Res. 2016, 5, 549–559. [Google Scholar]
- Suvi, W.T.; Shimelis, H.; Laing, M. Breeding rice for rice yellow mottle virus resistance in Sub-Saharan Africa: A review. Acta Agric. Scand. Sect. B Soil Plant Sci. 2018, 69, 181–188. [Google Scholar] [CrossRef]
- Lamo, L.; Cho, G.; Jane, I.; Dartey, P.K.A.; James, E.; Ekobu, M.; Alibu, S.; Okanya, S.; Oloka, B.; Otim, M.; et al. Developing lowland rice germplasm with resistance to multiple biotic stresses through another culture in Uganda. Korean Soc. J. Int. Agric. 2015, 27, 415–420. [Google Scholar] [CrossRef]
- Kouassi, N.K.; N’guessan, P.; Albar, L.; Fauquet, C.; Ghesquiere, A. Distribution and characterization of rice yellow mottle virus: A threat to African farmers. Plant Dis. 2005, 89, 124–133. [Google Scholar] [CrossRef]
- Luzi-Kihupi, A.; Zakayo, J.A.; Tusekelege, H.; Mkuya, M.; Kibanda, N.J.M.; Khatib, K.J.; Maerere, A. Mutation breeding for rice improvement in Tanzania. In Induced Plant Mutations in the Genomics Era; FAO: Rome, Italy, 2009; pp. 385–387. [Google Scholar]
- Longué, R.D.S.; Zinga, I.; Semballa, S.; Barro, N.; Traoré, O. Detection and serological characterization of rice yellow mottle virus in Central African Republic. Agric. Sci. 2016, 7, 911–919. [Google Scholar]
- Bakker, W. Characterization and Ecological Aspects of Rice Yellow Mottle Virus in Kenya. Ph.D. Thesis, Wageningen Agricultural University, Wageningen, The Netherlands, 1974; 128p. [Google Scholar]
- Rossel, H.W.; Thottapilly, G.; Buddenhagen, I.W. Occurrence of rice yellow mottle virus in two important rice-growing areas of Nigeria. FAO Plant Prot. Bull. 1982, 30, 137–139. [Google Scholar]
- Hubert, J.G.; Pinel-Galzi, A.; Dibwe, D.; Cinyabuguma, E.; Kabore, A.; Fargette, D.; Silue, D.; Herbrard, E.; Sere, Y. First report of rice yellow mottle virus on rice in the Democratic Republic of Congo. Plant Dis. 2013, 97, 1664. [Google Scholar] [CrossRef]
- Longué, D.R.S.; Galzi-Pinel, A.; Semballa, S.; Zinga, I.; Fargette, D.; Traoré, O. First report of Rice yellow mottle virus in rice in the Central African Republic. Plant Dis. 2014, 98, 162. [Google Scholar] [CrossRef]
- Ochola, D.; Issaka, S.; Rakotomalala, M.; Pinel-Galzi, A.; Ndikumana, I.; Hubert, J.; Hébrard, E.; Séré, Y.; Tusiime, G.; Fargette, D. Emergence of rice yellow mottle virus in eastern Uganda: Recent and singular interplay between strains in East Africa and in Madagascar. J. Virus Res. 2015, 195, 64–72. [Google Scholar] [CrossRef]
- Kanyeka, Z.L.; Sangu, E.; Fargette, D.; Pinel-Galzi, A.; Hébrard, E. Distribution and diversity of local strains of Rice yellow mottle virus in Tanzania. Afr. J. Crop Sci. 2007, 15, 201–209. [Google Scholar]
- Sy, A.A.; Sere, Y. Manuel de Formation en Pathologie du Riz; Association pour le Developpment de la Riziculture en Afrique de L’OUEST (ADRAO): Bouake, Cote d’Ivoire, 1996. [Google Scholar]
- Traoré, O.; Pinel-Galzi, A.; Issaka, S.; Poulicard, N.; Aribi, J.; Aké, S.; Ghesquiéré, A.; Séré, Y.; Konaté, G.; Hébrard, E.; et al. The adaptation of Rice yellow mottle virus to the elF(iso)4G-mediated rice resistance. J. Virol. 2010, 408, 103–108. [Google Scholar] [CrossRef]
- N’Guessan, P.; Pinel, A.; Caruana, M.L.; Frutos, R.; Sy, A.; Ghesquière, A.; Fargette, D. Evidence of the presence of two serotypes of rice yellow mottle sobemovirus in Côte d’Ivoire. Eur. J. Plant Pathol. 2000, 106, 167–178. [Google Scholar] [CrossRef]
- Mpunami, A.; Ndikumana, I.; Hubert, J.; Pinel-Galzi, A.; Kibanda, N.; Mwalyego, F.; Tembo, P.; Kola, B.; Mkuya, M.; Kanyeka, Z.; et al. Tanzania, biodiversity hotspot of Rice yellow mottle virus. In Proceedings of the 12th International Plant Virus Epidemiology Symposium, Arusha, Tanzania, 29 January–1 February 2013. 70p. [Google Scholar]
- Longué, D.R.S.; Galzi-Pinel, A.; Zinga, I.; Semballa, S.; Fargette, D.; Baro, N.; Traoré, O. Genetic diversity and molecular epidemiology of rice yellow mottle virus in Central African Republic. Int. J. Virol. 2017, 13, 80–89. [Google Scholar] [CrossRef]
- Kam, H.; Laing, M.D.; Sere, Y.; Thiemele, D.; Ghesquiere, A.; Ahmadi, N.; Ndjiondjop, M.-N. Evaluation of a collection of rice landraces from Burkina Faso for resistance or tolerance to rice yellow mottle virus. J. Plant Pathol. 2013, 95, 485–492. [Google Scholar]
- Koudamilor, A.; Nwilene, F.E.; Togola, A.; Akogbeto, M. Insect vectors of rice yellow mottle virus. J. Insects 2015. [Google Scholar] [CrossRef][Green Version]
- Abo, M.E.; Alegbejo, M.D.; Sy, A.A.; Misari, S.M. An overview of the mode of transmission, host plants and methods of detection of rice yellow mottle virus. J. Sustain. Agric. 2000, 17, 19–36. [Google Scholar] [CrossRef]
- Sereme, D.; Ouedraogo, I.; Neya, B.J.; Zida, P.E.; Yao, N.; Sie, M. Screening improved rice varieties (Oryza spp.) for their resistance /tolerance to rice yellow mottle virus in West Africa. Int. J. Agric. Innov. Res. 2016, 5, 481–486. [Google Scholar]
- Traoré, V.S.E.; Néya, B.J.; Camara, M.; Gracen, V.; Offei, S.K.; Traoré, O. Farmers’ perception and impact of rice yellow mottle disease on rice yields in Burkina Faso. Agric. Sci. 2015, 6, 943–952. [Google Scholar] [CrossRef]
- Pidon, H.; Ghesquière, A.; Chéron, S.; Issaka, S.; Hébrard, E.; Sabot, F.; Kolade, O.; Silué, D.; Albar, L. Fine mapping of RYMV3: A new resistance gene to rice yellow mottle virus from Oryza glaberrima. Theor. Appl. Genet. 2017, 130, 807–818. [Google Scholar] [CrossRef]
- Nkuba, J.; Ndunguru, A.; Madulu, R.; Lwezaura, D.; Kajiru, G.; Babu, A.; Chalamila, B.; Ley, G. Rice value chain analysis in Tanzania: Identification of constraints, opportunities, and upgrading strategies. Afr. Crop Sci. J. 2016, 24, 73–87. [Google Scholar] [CrossRef]
- Ndjiondjop, M.N.; Albar, L.; Fargette, D.; Fauquet, C.; Ghesquiere, A. The genetic basis of high resistance to rice yellow mottle virus (RYMV) in cultivars of two cultivated rice species. Plant Dis. 1999, 83, 931–935. [Google Scholar] [CrossRef]
- Thiémélé, D.; Boisnard, A.; Ndjiondjop, M.N.; Chéron, S.; Séré, Y.; Aké, S.; Ghesquière, A.; Albar, L. Identification of a second major resistance gene to Rice yellow mottle virus, RYMV2, in the African cultivated rice species, O. glaberrima. J. Theor. Appl. Genet. 2010, 121, 169–179. [Google Scholar]
- Pinel-Galzi, A.; Dubreuil-Tranchant, C.; Hébrard, E.; Mariac, C.; Ghesquière, A.; Albar, L. Mutations in rice yellow mottle virus polyprotein P2a involved in RYMV2 gene resistance breakdown. Front. Plant Sci. 2016, 7, 1779. [Google Scholar] [CrossRef]
- Munganyinka, E.; Edema, R.; Lamo, J.; Gibson, P. The reaction of intraspecific and interspecific rice cultivars for resistance to rice yellow mottle virus disease. Eur. J. Exp. Biol. 2016, 6, 13–18. [Google Scholar]
- Xiao, X.Y.; Wang, Y.P.; Zhang, J.Y.; Li, S.G.; Rong, T.Z. SSR marker based genetic diversity fingerprinting of hybrid rice in Sichuan, China. China J. Rice Sci. 2016, 20, 1–7. [Google Scholar]
- Mausa, E.A. Genetic Diversity of Rice (Oryza sativa L.) Landraces Conserved at the National Genebank as Revealed by Simple Sequence Repeat (SSR) Dna Markers. Master’s Thesis, Degree at Sokoine University of Agriculture, Morogoro, Tanzania, 2014; p. 83. [Google Scholar]
- Bakari, M.M. Genetic Diversity of Some Rice (Oryza sativa L.) landraces Grown in Tanzania Using Simple Sequence Repeats (SSR). Master’s Thesis, Sokoine University of Agriculture, Morogoro, Tanzania, 2010; 72p. [Google Scholar]
- Suvi, W.T.; Shimelis, H.; Laing, M.; Mathew, I.; Shayanowako, A.I.T. Assessment of the genetic diversity and population structure of rice genotypes using SSR markers. Acta Agric. Scand. Sect. B Soil Plant Sci. 2020, 70, 76–86. [Google Scholar] [CrossRef]
- Aida, A.; Huseain, M.; Mohamad, A.S.; Hani, S.; Sameer, M. Assessment of genetic variation among Jordanian barely landraces (Hordeum vulgare) as revealed by molecular markers. Am. Eurasian J. Agric. Environ. Sci. 2007, 2, 68–74. [Google Scholar]
- Mangosongo, H.M.; Lyaruu, H.V.; Mneney, E.E. Agro-morphological characterization of the wild rice (Oryza longistaminata) populations from selected areas of Tanzania. Tanzan. J. Sci. 2019, 45, 9–17. [Google Scholar]
- Wilson, R.T. The rice value chain in Tanzania. Int. J. Agric. Innov. Res. 2018, 7, 237–244. [Google Scholar]
- International Rice Research Institute (Ed.) Standard Evaluation System for Rice, 5th ed.; Genetic Resources Center, IRRI: Manila, Philippines, 2002; 27p. [Google Scholar]
- Payne, R.W.; Murray, D.A.; Harding, S.A. An Introduction to the GenStat Command Language, 18th ed.; VSN International: Hemel Hempstead, UK, 2017. [Google Scholar]
- SPSS. Statistical Package for Social Scientists; SPSS for Windows Release 24.0; SPSS: Chicago, IL, USA, 2017. [Google Scholar]
- Adhikari, B.N.; Joshi, B.P.; Shrestha, J.; Bhatta, N.R. Genetic variability, heritability, genetic advance and correlation among yield and yield components of rice (Oryza sativa L.). J. Agric. Nat. Resour. 2018, 1, 149–160. [Google Scholar] [CrossRef]
- Gyawali, S.; Poudel, A.; Poudel, S. Genetic variability and association analysis in different rice genotypes in mid hill of western Nepal. Acta Sci. Agric. 2018, 2, 69–76. [Google Scholar]
- Sumanth, V.; Suresh, B.G.; Ram, B.J.; Srujana, G. Estimation of genetic variability, heritability and genetic advance for grain yield components in rice (Oryza sativa L.). J. Pharmacogn. Phytochem. 2017, 6, 1437–1439. [Google Scholar]
- Bandi, H.R.K.; Satyanarayana, P.V.; Babu, D.R.; Chamundeswari, N.; Rao, V.S.; Raju, S.K. Genetic variability estimates for yield and yield components traits and quality traits in rice (Oryza sativa L.). Int. J. Curr. Microbiol. Appl. Sci. 2018, 7, 551–559. [Google Scholar] [CrossRef]
- Mercer, K.L.; Perales, H.G. Evolutionary response of landraces to climate change in centres of crop diversity. Evol. Appl. 2010, 3, 480–493. [Google Scholar] [CrossRef] [PubMed]
- Sandhu, N.; Yadaw, R.B.; Chaudhary, B.; Prasai, H.; Iftekharuddaula, K.; Venkateshwarlu, C.; Annamalai, A.; Xangsayasane, P.; Battan, K.R.; Ram, M.; et al. Evaluating the performance of rice genotypes for improving yield and adaptability under direct seeded aerobic cultivation conditions. Front. Plant Sci. 2019, 10, 159. [Google Scholar] [CrossRef]
- Joseph, A.; Olufolaji, D.B.; Mwilene, F.E.; Onasanya, A.; Omale, M.M.; Onasanya, R.O.; Sere, Y. Effect of leaf age on rice yellow mottle virus severity chlorophyll content with mechanical inoculation and vector transmission method. Trends Appl. Sci. Res. 2011, 6, 1345–1351. [Google Scholar] [CrossRef]
- Hubert, J.; Lyimo, H.J.F.; Luzi-Kihupi, A. Pathogenic variation and occurrence of multiple resistance-breaking rice yellow mottle virus strains in Tanzania. Afr. J. Biotechnol. 2017, 24, 1331–1337. [Google Scholar]
- Bustos-Korts, D.; Romagosa, I.; Borràs-Gelonch, G.; Casas, A.M.; Slafer, G.A.; van Eeuwijk, F.A. Genotype by Environment Interaction and Adaptation. Encyclopedia of Sustainability Science and Technology; Springer Science and Business Media, LLC: Berlin/Heidelberg, Germany, 2018; pp. 29–71. [Google Scholar]
- Romagosa, I.; Fox, P.N. Genotype × Environment Interaction and Adaptation; Hayward, M.D., Bosemark, N.O., Romagosa, I., Cerezo, M., Eds.; Plant Breeding; Plant Breeding Series; Springer: Dordrecht, The Netherlands, 1993. [Google Scholar]
- Bhuvaneswari, S.; Kumar, S.; Singh, I.M.; Takhellambam, S.; Shasidhar, K.S.; Singh, R.Y.; Prakash, N. Genetic variability and association studies on grain yield components in F2 populations of black rice (Oryza sativa L.) of Manipur. Indian J. Hill Farming 2015, 28, 85–89. [Google Scholar]
- Getachew, M.; Burhan, T. Growth and yield of rice (Oryza sativa L.) as affected by time and ratio of nitrogen application at Jimma, South-West Ethiopia. Int. J. Agric. Innov. Res. 2017, 4, 175–182. [Google Scholar]
- Li, F.; Xie, J.; Zhu, X.; Wang, X.; Zhao, Y.; Ma, X.; Zhang, Z.; Rashid, M.A.R.; Zhang, Z.; Zhi, L.; et al. Genetic basis underlying correlations among growth duration and yield traits revealed by GWAS in rice (Oryza sativa L.). Front. Plant Sci. 2018, 9, 650. [Google Scholar] [CrossRef] [PubMed]
- Lou, Q.; Chen, L.; Mei, H.; Wei, H.; Feng, F.; Wang, P.; Xia, H.; Li, T.; Luo, L. Quantitative trait locus mapping of deep rooting by linkage and association analysis in rice. J. Exp. Bot. 2015, 66, 4749–4757. [Google Scholar] [CrossRef]
- Onwughalu, J.T.; Abo, M.E.; Okoro, J.K.; Onasanya, A.; Sere, Y. Rice yellow mottle virus infection and reproductive losses in rice (Oryza sativa Linn.). Trends Appl. Sci. Res. 2011, 6, 182–189. [Google Scholar] [CrossRef]
- Sahu, H.; Saxena, R.R.; Verulkar, S.B.; Kumar, V. Principal component analysis of agro-morphological traits in RIL population of rice (Oryza sativa L.) grown in a irrigated lowland water regime. Green Farming 2017, 8, 11–15. [Google Scholar]
- Yugandhar, P.R.; Kota, S.; Kiran, B.U.; Sridhar, M. Principal component analysis for agro-morphological and quality characters in germplasm of rice (Oryza sativa L.). Int. J. Adv. Biol. Res. 2018, 8, 268–273. [Google Scholar]
- Ranjith, P.; Sahu, S.; Dash, S.K.; Bastia, D.N.; Pradhan, B.D. Principal component analysis of rice varieties under bacterial leaf blight incidence. Int. J. Chem. Stud. 2019, 7, 4184–4187. [Google Scholar]
- Nachimuthu, V.V.; Robin, S.; Sudhakar, D.; Raveendran, M.; Rajeswari, S.; Manonmani, S. Evaluation of rice genetic diversity and variability in a population panel by principal component analysis. Indian J. Sci. Technol. 2014, 7, 1555–1562. [Google Scholar] [CrossRef]
- Gana, A.S.; Shaba, S.Z.; Tsado, E.K. Principal component analysis of morphological traits in thirty-nine accessions of rice (Oryza sativa L.) grown in a rainfed lowland ecology of Nigeria. J. Plant Breed. Crop Sci. 2013, 5, 120–126. [Google Scholar]
- Flores, F.; Moreno, M.T.; Cubbero, J.I. A comparison of univariate and multivariate methods to analyze G × E interaction. Field Crop Res. 1998, 56, 271–286. [Google Scholar] [CrossRef]
Publisher’s Note: MDPI stays neutral with regard to jurisdictional claims in published maps and institutional affiliations. |
© 2021 by the authors. Licensee MDPI, Basel, Switzerland. This article is an open access article distributed under the terms and conditions of the Creative Commons Attribution (CC BY) license (http://creativecommons.org/licenses/by/4.0/).