Article

Comparison of Methods to Evaluate Rice (Oryza sativa) Germplasm for Tolerance to Low Temperature at the Seedling Stage

1
Department of Crop Sciences, University of Illinois at Urbana-Champaign (UIUC), Urbana, IL 61801, USA
2
International Rice Research Institute (IRRI), Los Baños, Laguna 4031, Philippines
*
Author to whom correspondence should be addressed.
Present address: Noble Research Institute, LLC, 2510 Sam Noble Parkway, Ardmore, OK 73401, USA.
Agronomy 2021, 11(2), 385; https://doi.org/10.3390/agronomy11020385
Submission received: 22 December 2020 / Revised: 9 February 2021 / Accepted: 17 February 2021 / Published: 21 February 2021
(This article belongs to the Special Issue The Adaptation of Agriculture to Climatic Change)

Abstract

:
Low temperature stress at the seedling stage is a major constraint to rice (Oryza sativa) production. Previously developed screening protocols typically germinate seed and establish seedlings under warm constant-temperature conditions that are optimal for growth, prior to initiating a constant low-temperature challenge. We developed three controlled-environment protocols mimicking extreme cold boro (winter) seasons based on 25 years weather data from Bangladesh to test the hypothesis that by more closely replicating field conditions, greater information about cultivars could be obtained compared to standard protocols. Root and shoot growth after germination in a Petri dish at 20 °C for three weeks gave similar results as visual scores of transplanted seedlings in a standard five-week protocol. Moreover, transplanted seedlings at the end of the nine-week mimic protocols showed large differences in height and dry biomass, whereas for the standard protocols, growth during the warm pre-treatment substantially masked these genotypic differences. Thus, initial screening of large rice germplasm panels can be most efficiently accomplished with a short-duration germination test at low temperature. However, more effective differentiation of cultivars can be accomplished by measuring transplanted seedling growth from the newly-developed mimic protocols. These results will facilitate the development of improved rice cultivars.

1. Introduction

Rice (Oryza sativa) is the staple food for almost half of the global population [1]. Substantial disruption to production of basic food crops such as rice can threaten world food supplies and generate social unrest, as was seen during the food riots of 2008 [2]. As rice originated in the tropics and subtropics it is adapted to warm growing conditions. Thus, low temperatures at the seedling stage and/or reproductive stage can result in a wide range of negative effects, including poor germination, seedling mortality, leaf chlorosis, stunted growth, reduced tillering, delayed heading, and spikelet sterility [3,4].
Globally, in excess of 15 million ha of rice is damaged by low temperature at the seedling and reproductive stages [5]. Because of low temperature, nearly 7 million ha of potential rice land in South and Southeast Asia remain unplanted [5]. South and Southeast Asia is dominated by cultivars of the indica subspecies, which is of tropical origin and thus very sensitive to low temperature [6]. Thus, low temperature stress represents a major constraint to rice production. The development of rice cultivars with greater tolerance to low temperatures is essential to overcome this problem. Genetic variation for tolerance to low temperature exists within Oryza sativa, especially in the more cold-tolerant japonica subspecies [4], and within its progenitor species, Oryza rufipogon; and these could be used to increase tolerance to low temperature and thereby increase the quantity and consistency of rice production.
Bangladesh is highly dependent on rice, with 71 percent of the cropped area planted to rice, which provides 94 percent of the country’s food grain production [7]. In Bangladesh, most farmers with access to irrigation grow two rice crops per year. Large areas of rice production in Bangladesh are regularly stressed by low temperature during the winter boro crop, which is typically planted to seed beds in December. In most years, Bangladesh experiences from one to two cold waves with dense fog during January. In the northern parts of Bangladesh (Rajshahi, Dinajpur, Kurigram, Thakurgaon, Pabna, Gaibandha, Nilpamari, Naogaon, Sirajganj), minimum temperatures typically fall below 10 °C during January. Prior studies indicate that temperatures below 15 °C are usually damaging to rice seedlings [8]. The low temperatures, high winds and fog during cold wave events adversely affect rice seedlings in many areas of in Bangladesh each year. In the rice growing area of Rajshahi, the lowest 3 h average temperatures from 1990 to 2015 were 4.6 °C in January 2003 and 5.3 °C in January 2011, which occurred during especially severe cold waves (Bangladesh Meteorological Department). The 2011 cold wave damaged 15–20% of boro rice seed beds in northern Bangladesh and 80% of seed-beds in the south [9].
Prior efforts to identify genes that confer rice seedlings with tolerance to low temperature have predominantly used controlled environment chambers or cold-water tanks to stress plants with a chilling temperature for one to three weeks (often with a constant temperature), then assess the effect of the stress on plant growth. Additionally, prior studies of seedling stage cold tolerance in rice have typically used seedlings that were initially established (germinated and grown to the three-leaf stage) at higher temperatures (usually 25 °C) before applying the low temperature stress, which is a temperature transition that one would not expect to observe in typical early-season field conditions. Most of these studies used seedling stage cold tolerance screening as phenotyping methods to identify QTLs and genes for cold tolerance. For example, Andaya and Mackill [10] monitored cold tolerance based on two temperature regimes for seedling stage cold treatment at constant 9 °C for 18 days and 25/9 °C day/night for 28 days, from seedlings that were germinated and grown until the three-leaf stage at 25/20 °C day/night. Zhang et al. [11] screened cold tolerance at the early seedling stage using paper-roll tests of 10 and 13 days at constant 10 °C after seedlings were germinated at 28 °C in the dark for 2–3 days. Han et al. [12] used cold water irrigation for 10 days at 12 °C for screening cold tolerance for seedling vigor. Seedling survival percentage was monitored after treatment at 6/10 °C day/night for 7 days, from seeds germinated at a constant 25 °C [13]. Jiang et al. [14] observed seedling stage cold tolerance by treating seedlings germinated and grown until the three-leaf stage at 25 °C with a stress of 6 °C for 7 days. Suh et al. [6] screened for cold tolerance at the seedling stage after constant 10 °C for 7 days, with seedlings that were germinated and grown until three-leaf stage at 25/20 °C day/night temperature. Kim and Tai [15] monitored for cold tolerance at the seedling stage after constant 9 °C for 14 days in a controlled environment chamber. Cheng et al. [16] observed seedling stage cold tolerance after treatment of 4 °C for 7 days. Kim et al. [17] screened seedling stage cold tolerance using 18/8 °C day/night for 18 days. Zhao et al. [18] monitored cold tolerance at the seedling stage using a constant temperature of 11 °C for 5 days. Thus, most prior studies were conducted with a constant temperature stress to screen cold tolerance of rice but the critical temperature and duration of treatment varied considerably between studies. In contrast to other studies, Lv et al. [19] evaluated variable cold stress at the seedling stage in rice. Though, Lv et al. [19] started their experiments with rice seedlings raised in a heated greenhouse, they compared the stress of an unheated greenhouse that had variable temperatures of 5–12 °C to a cold shock of constant 4 °C, and observed that responses to these two treatments were not highly correlated.
To the best of our knowledge, no prior studies of seedling stage cold tolerance in rice have conducted evaluations under controlled environments that mimicked the natural within-day and weekly variations in temperature observed during previously damaging cold events in rice production fields. Moreover, the potential bias of starting seedlings under warm conditions then transferring them to cold stress, though standard practice, is a concern. The advantage of constant temperature over a short duration (e.g., one week) for screening cold tolerance is that it is an easy and time-saving method. However, it does not replicate the variation in and duration of low temperature stress that fields of rice experience during early-season cold events before progressively warmer and more conducive temperatures predominate, such as the winter boro crop in Bangladesh or the spring-summer crop in the southern U.S. Here, our objectives were to (1) determine if the standard procedure of germinating and establishing seedlings under warm (conducive) temperatures prior to cold stress results in different screening outcomes than initiating growth under low temperature stress, (2) quantify how well the standard constant-temperature protocols for screening seedling stage cold tolerance in rice correlate with protocols that mimic natural cold events that caused substantial, region-wide damage to rice crops in production fields, and (3) identify which methods are most informative and efficient for selecting rice genotypes that have superior tolerance to low temperatures at the seedling stage.

2. Materials and Methods

2.1. Plant Materials

We selected 36 rice cultivars (Table S1) to represent a wide range of responses to seedling stage cold stress, based primarily on the results of previously published studies. In particular, we considered the following selection criteria: cold tolerance/susceptibility, high elevation, country of origin, and sub-species (indica, japonica, aus). The selected cultivars originated from 13 different countries and included 18 indica, 16 japonica, one aus and one unknown sub-species. Ten out of the 36 were expected to be relatively cold susceptible and the remainder were expected to be relatively cold tolerant, though a continuum of responses was expected. Cultivars selected based on geographic data (elevation and latitude) included Bagmati Early No. 1 and Bagmati Early No. 3 (both from 1333 m in Nepal), Jumli Dhan (2400 m, Nepal), and Miragram (2162 m, Pakistan). Seeds were obtained from the United States Department of Agriculture (USDA) National Plant Germplasm System and the International Rice Research Institute (Los Baños, Laguna, Philippines).

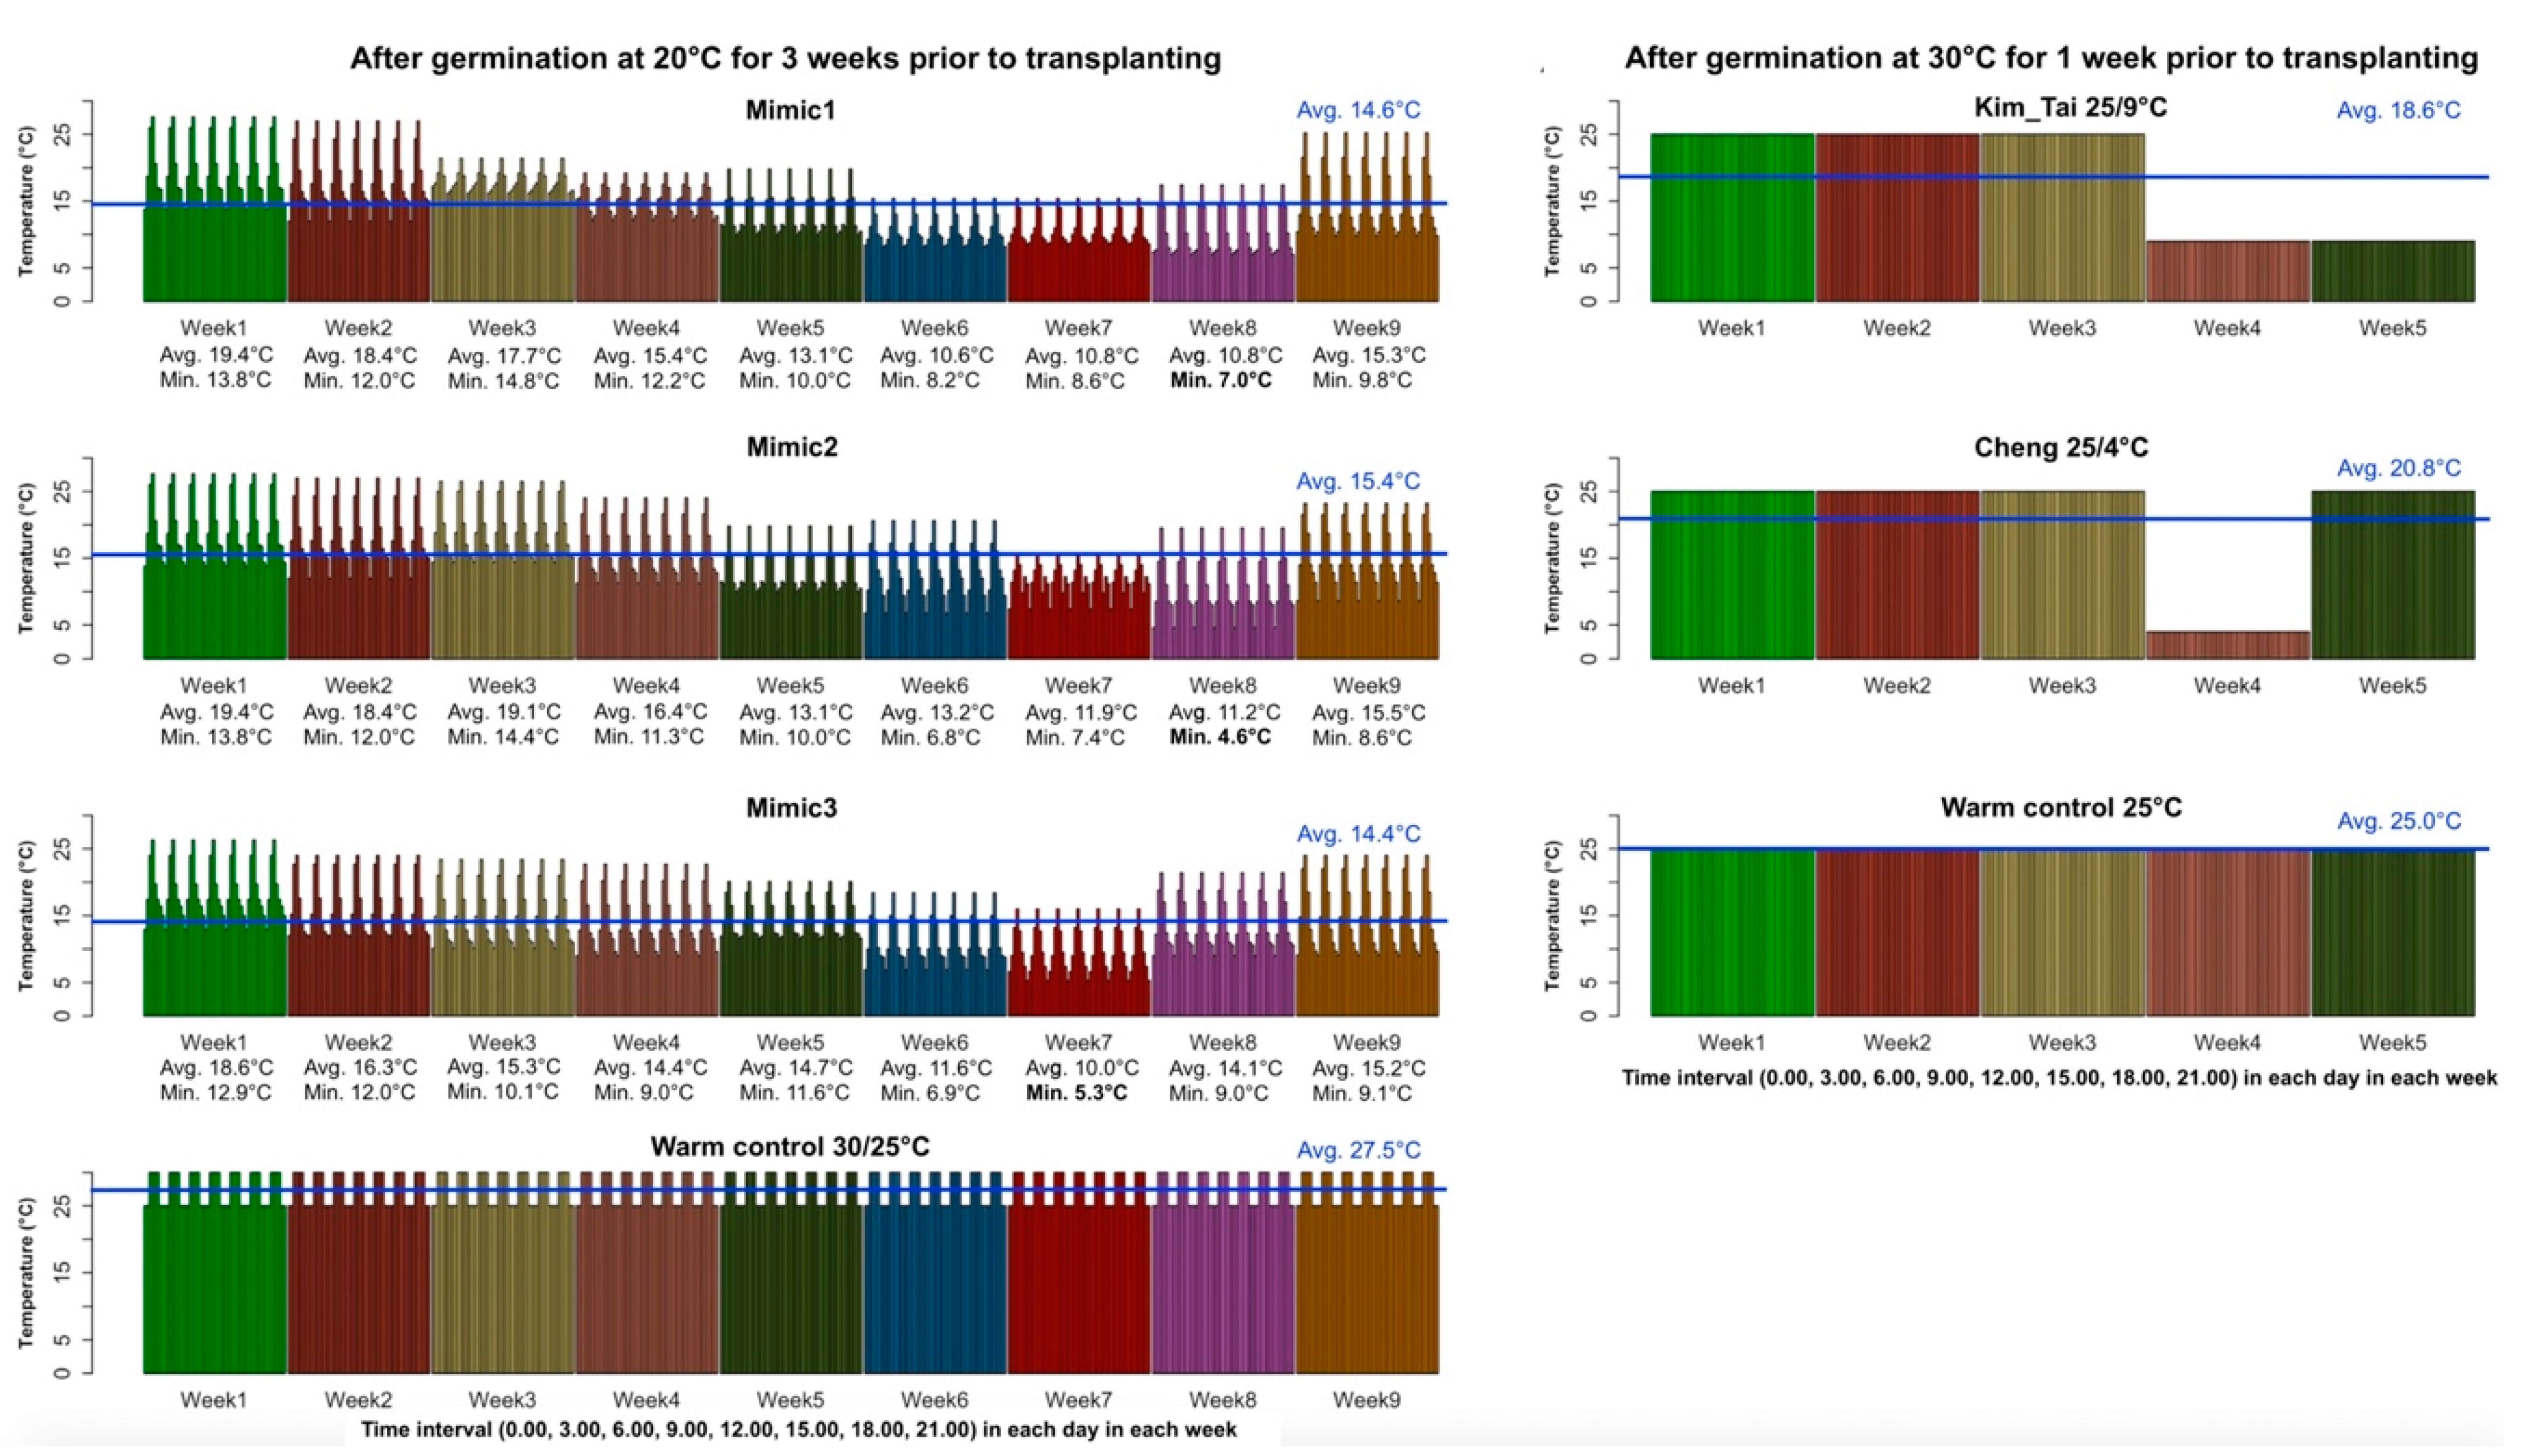
2.2. Controlled Environment Screens

Germination and seedling growth of rice accessions were evaluated with seven controlled-environment protocols (Figure 1, Tables S2–S9). We compared two previously published protocols for assessing tolerance of seedlings to low temperature (Kim and Tai [15]; Cheng et al. [16]), with three protocols that we developed to mimic the especially cold boro (winter) seasons of 2002–2003 and 2010–2011 in Rajshahi, Bangladesh, which is a rice-growing region in the northwest part of the country. Additionally, two warm control protocols (Figure 1, Tables S6 and S9) were used to provide a baseline comparison with the low temperature protocols. Each protocol had two stages: (1) germination, and (2) transplanted seedling. Data were collected at both the stages.
To break dormancy, seeds of each accession were placed in a drying oven (Equatherm Incubator, Curtin Matheson Scientific, Inc., Houston, TX, USA) at 50 °C for 7 days. After the heat treatment, seeds were dehulled, then surface-sterilized, firstly with 70% ethanol for 10 min and secondly with 6.0% sodium hypochlorite solution for 30 min, and finally, rinsed with autoclaved distilled water. For each cultivar and subsequent seedling treatment, 15 surface-sterilized seeds were placed in a sterile 100 × 25 mm Petri dish (FB0875711, Thermo Fisher Scientific, Waltham, MA, USA) on autoclaved Anchor Blue blotter paper (Anchor Paper Co., Saint Paul, MN, USA) wetted with 12 mL of autoclaved aqueous solution containing 0.2% Plant Preservative Mixture (PPM) (Plant Cell Technology, Northwest, Washington, DC, USA) + 100 mg L−1 benomyl (Methyl 1-butylcarbamoyl-2-benzimidazolecarbamate, Sigma-Aldrich Chemistry, St. Louis, MO, USA). Petri dishes were wrapped in paraffin film (Parafilm M, Bemis Company, Inc., Oshkosh, WI, USA) and cultured in controlled environment chambers with 12 h of light per day. The temperature and duration of the germination stage varied depending on the protocol. For the previously published protocols of Kim and Tai [15] and Cheng et al. [16] and the two warm controls, seed were germinated at 30 °C (±1 °C) for one week. For the three Rajshahi mimic protocols, seeds were germinated at 20 °C (±1 °C) for three weeks. At the end of the germination treatments, data were collected on germination percentage, shoot length, and root length. For each germination treatment, three Petri dishes per cultivar were evaluated.
For the seedling stage of the protocols, the five seedlings with the most growth after germination in each Petri dish were transplanted to square plastic pots that measured 5.715 × 5.715 × 6.35 cm and had side drainage holes (product #1650, Anderson Die & Manufacturing, Portland, Oregon) containing a steam-pasteurized 1:1:1 mix of field soil, peat moss, and torpedo sand. One pot of each cultivar was placed in a 28 × 54.28 × 6.2 cm plastic tray with drainage holes (1020 standard flat tray, product code 710247C, T.O. Plastics Inc., Clearwater, MN, USA); the pots were randomly ordered in the tray. For each protocol, five trays (180 pots/chamber) were grown in a controlled environment chamber (Conviron E15 or TC30, Controlled Environments Ltd., Winnipeg, MB, Canada) with 12-h of fluorescent light per day providing a photosynthetic photon flux (PPF) of 400–470 μmol m−2s−1 at canopy height, and relative humidity of 80 ± 5%. Time release fertilizer (0.625 g of Osmocote Pro 17-5-11 per pot; ICL Specialty Fertilizers—North America, Dublin, OH, USA) was applied at planting. Plants were watered daily by hand. After five weeks, the trays with drainage holes were replaced by those without drainage and the pots were flooded.
For the two previously published low temperature protocols, transplanted seedlings were grown in pots for five weeks, with the first three weeks at a constant 25 °C (i.e., warm). For the Kim and Tai [15] protocol (Figure 1, Table S7), the final two weeks were at a constant 9 °C (i.e., low temperature challenge). In contrast, for the Cheng et al. [16] protocol (Figure 1, Table S8), the low temperature challenge was one week at 4 °C, which was followed by a warm recovery week at 25 °C. The warm control protocol for these previously published screens was five weeks at a constant 25 °C.
To develop the Rajshahi mimic protocols, we obtained 25 years (1990–2015) of weather data with average temperatures in three-hour intervals (0.00, 3.00, 6.00, 9.00, 12.00, 15.00, 18.00, 21.00) from the Bangladesh Meteorological Department (BMD). In northwest Bangladesh, the boro rice crop is typically seeded in a seedbed during early December then transplanted 40–45 days later. In both 2002 and 2010, the first week of December averaged ~20 °C, hence our choice to germinate the seed for the three mimic protocols at this temperature; and preliminary experiments indicated that three weeks were needed to obtain seedlings with sufficient root and shoot growth for transplanting to pots. For the seedling stage of the mimic protocols, the plants were grown in pots for nine weeks, with each week based on historical weather data beginning the first week of December for 2002–2003 or 2010–2011 in Rajshahi. Two 2002–2003 mimic protocols were tested; one mimicked the day with the lowest average temperature each week (Mimic1, Figure 1, Table S3) and the other mimicked the day with the lowest minimum temperature each week (Mimic2, Figure 1, Table S4). The 2010–2011 mimic was based on the day with the lowest average temperature each week in that winter (Mimic3, Figure 1, Table S5). For each of the mimic protocols, temperatures within a day were changed every 3 h to reflect fluctuations in temperature over 24 h based on the historical weather data, with each day in a given week having the same program, and the program was changed weekly.
Data were also taken at the end of the seedling stage of the protocols (at the end of week 5 for the five-week protocols, and at the end of week 9 for the nine-week protocols). Visual assessments were made using IRRI’s [20] seedling cold tolerance scale (CTol; 1 = seedlings dark green, 3 = seedlings light green, 5 = seedlings yellow, 7 = seedlings brown, 9 = seedlings dead). Plant height was measured from the soil to the topmost part of the plant. Shoot dry weights (biomass) were obtained by cutting the aboveground shoots in each pot, drying them in an oven (QL 40GC Lab oven, Quincy Lab, Inc., Chicago, IL, USA) at 60 °C for 72 h, then weighing them on a balance (MS104S/03, Mettler Toledo, Columbus, OH, USA). Cold response indexes (CRI) [21] for plant height and biomass were calculated as: CRI (%) = (plant height or biomass under stress/plant height or biomass under normal conditions) × 100, where normal conditions were the warm control protocols. For the numerator, the value of each cold-stressed seedling was used. For the denominator, the average value of the cultivar’s response under the warm control treatment was used. Thus, each seedling had CRI estimates that were subsequently analyzed.

2.3. Experimental Design

The germination stage experiment was a randomized complete block design with two temperature-duration treatments and 36 rice genotypes, with 3–4 Petri dishes per combination of treatment and genotype. The seedling stage experiment was a randomized incomplete block design with subsampling. Each of the seven protocols for the seedling stage were randomly assigned to one of five controlled-environment chambers (four Conviron E15s and one LC30), with each protocol replicated 1–3 times. The two 2002–2003 mimic protocols each had three replications, the 2010–2011 mimic and the Kim and Tai [15] protocol each had two replications, and the Cheng et al. [16] protocol and the two warm control protocols each had one replication. Additionally, each main replication (chamber) contained five replicate pots per genotype arranged in randomized complete sub-blocks (trays) within the chamber.

2.4. Statistical Analysis

Analyses of the data were conducted with R statistical package [22]. Statistical analyses for the germination stage experiment and the seedling stage experiment were performed with linear mixed models using the lme4 package [23] in R. Least squares means were obtained from emmeans [24] package in R. Both random effect and fixed effect model analyses were performed for cultivar and treatment. Pearson’s pairwise correlation coefficients (r) between different treatments and traits were calculated using pairs.panels function of psych [25] package in R. Heatmaps and boxplots of cultivar responses within each treatment for CTol, plant height, biomass, height cold response index and biomass cold response index measured in the seedling stage experiment were obtained from the ComplexHeatmap [26] and ggplot2 [27] packages in R, respectively.

3. Results

3.1. Germination Stage Screening

Shoot length and especially root length were good indicators of cold tolerance during germination but the proportion of seed that germinated was not. For shoot length and root length, interactions between cultivar and treatment (cold vs. warm) were highly significant in both the fixed and random effects analyses of variance (ANOVA) and accounted for 19.7% and 25.9% of the total variance, respectively (Table 1). In contrast, for germination proportion, the cultivar:treatment interaction was non-significant and accounted for only 4% of the total variance, and the treatment main effect accounted for only 3.7% of the variance. For each of the three traits, differences among cultivars were highly significant and accounted for a large proportion of the total variance (27.1–55.1%). However, little of the variation for each of the three traits was due to temperature treatment main effects (3.4–10.0%). Within each treatment, shoot and root length were highly correlated (r = 0.85) but correlations with germination proportion were low or moderate (Figure S1). Thus, the temperature treatment did not affect in any important way the proportion of seeds that germinated, whereas for shoot length and root length there were significant difference in the responses between cultivars. For example, the ratios of cultivar means when exposed to 20 °C for 3 weeks relative to the means when exposed to 30 °C for 1 week ranged from 0.6 to 1.9 for shoot length (i.e., from about half the growth under low temperatures as compared to high temperatures, to about double), and from 0.1 to 5.6 for root length (Table S10). Similarly, the range of cultivar means for shoot length was about 1.6 times greater for the low temperature treatment than for the warm treatment; and for root length, the low temperature treatment had a 2.2-times greater range of cultivar means than the high temperature treatment (Table S10). Notably, cultivars that were known from prior studies to be among the most cold sensitive or tolerant performed as expected. For example, the highly cold sensitive, tropical-adapted indica cultivars IR 8, IR 20, IR 64, and Teqing had the least growth under low temperature, including little or no root growth. In contrast, the japonica cultivars known to be cold tolerant, such as Geumobyeo, Kitaake, Lemont, M-201, and M-202 exhibited strong shoot and root growth under low temperature.

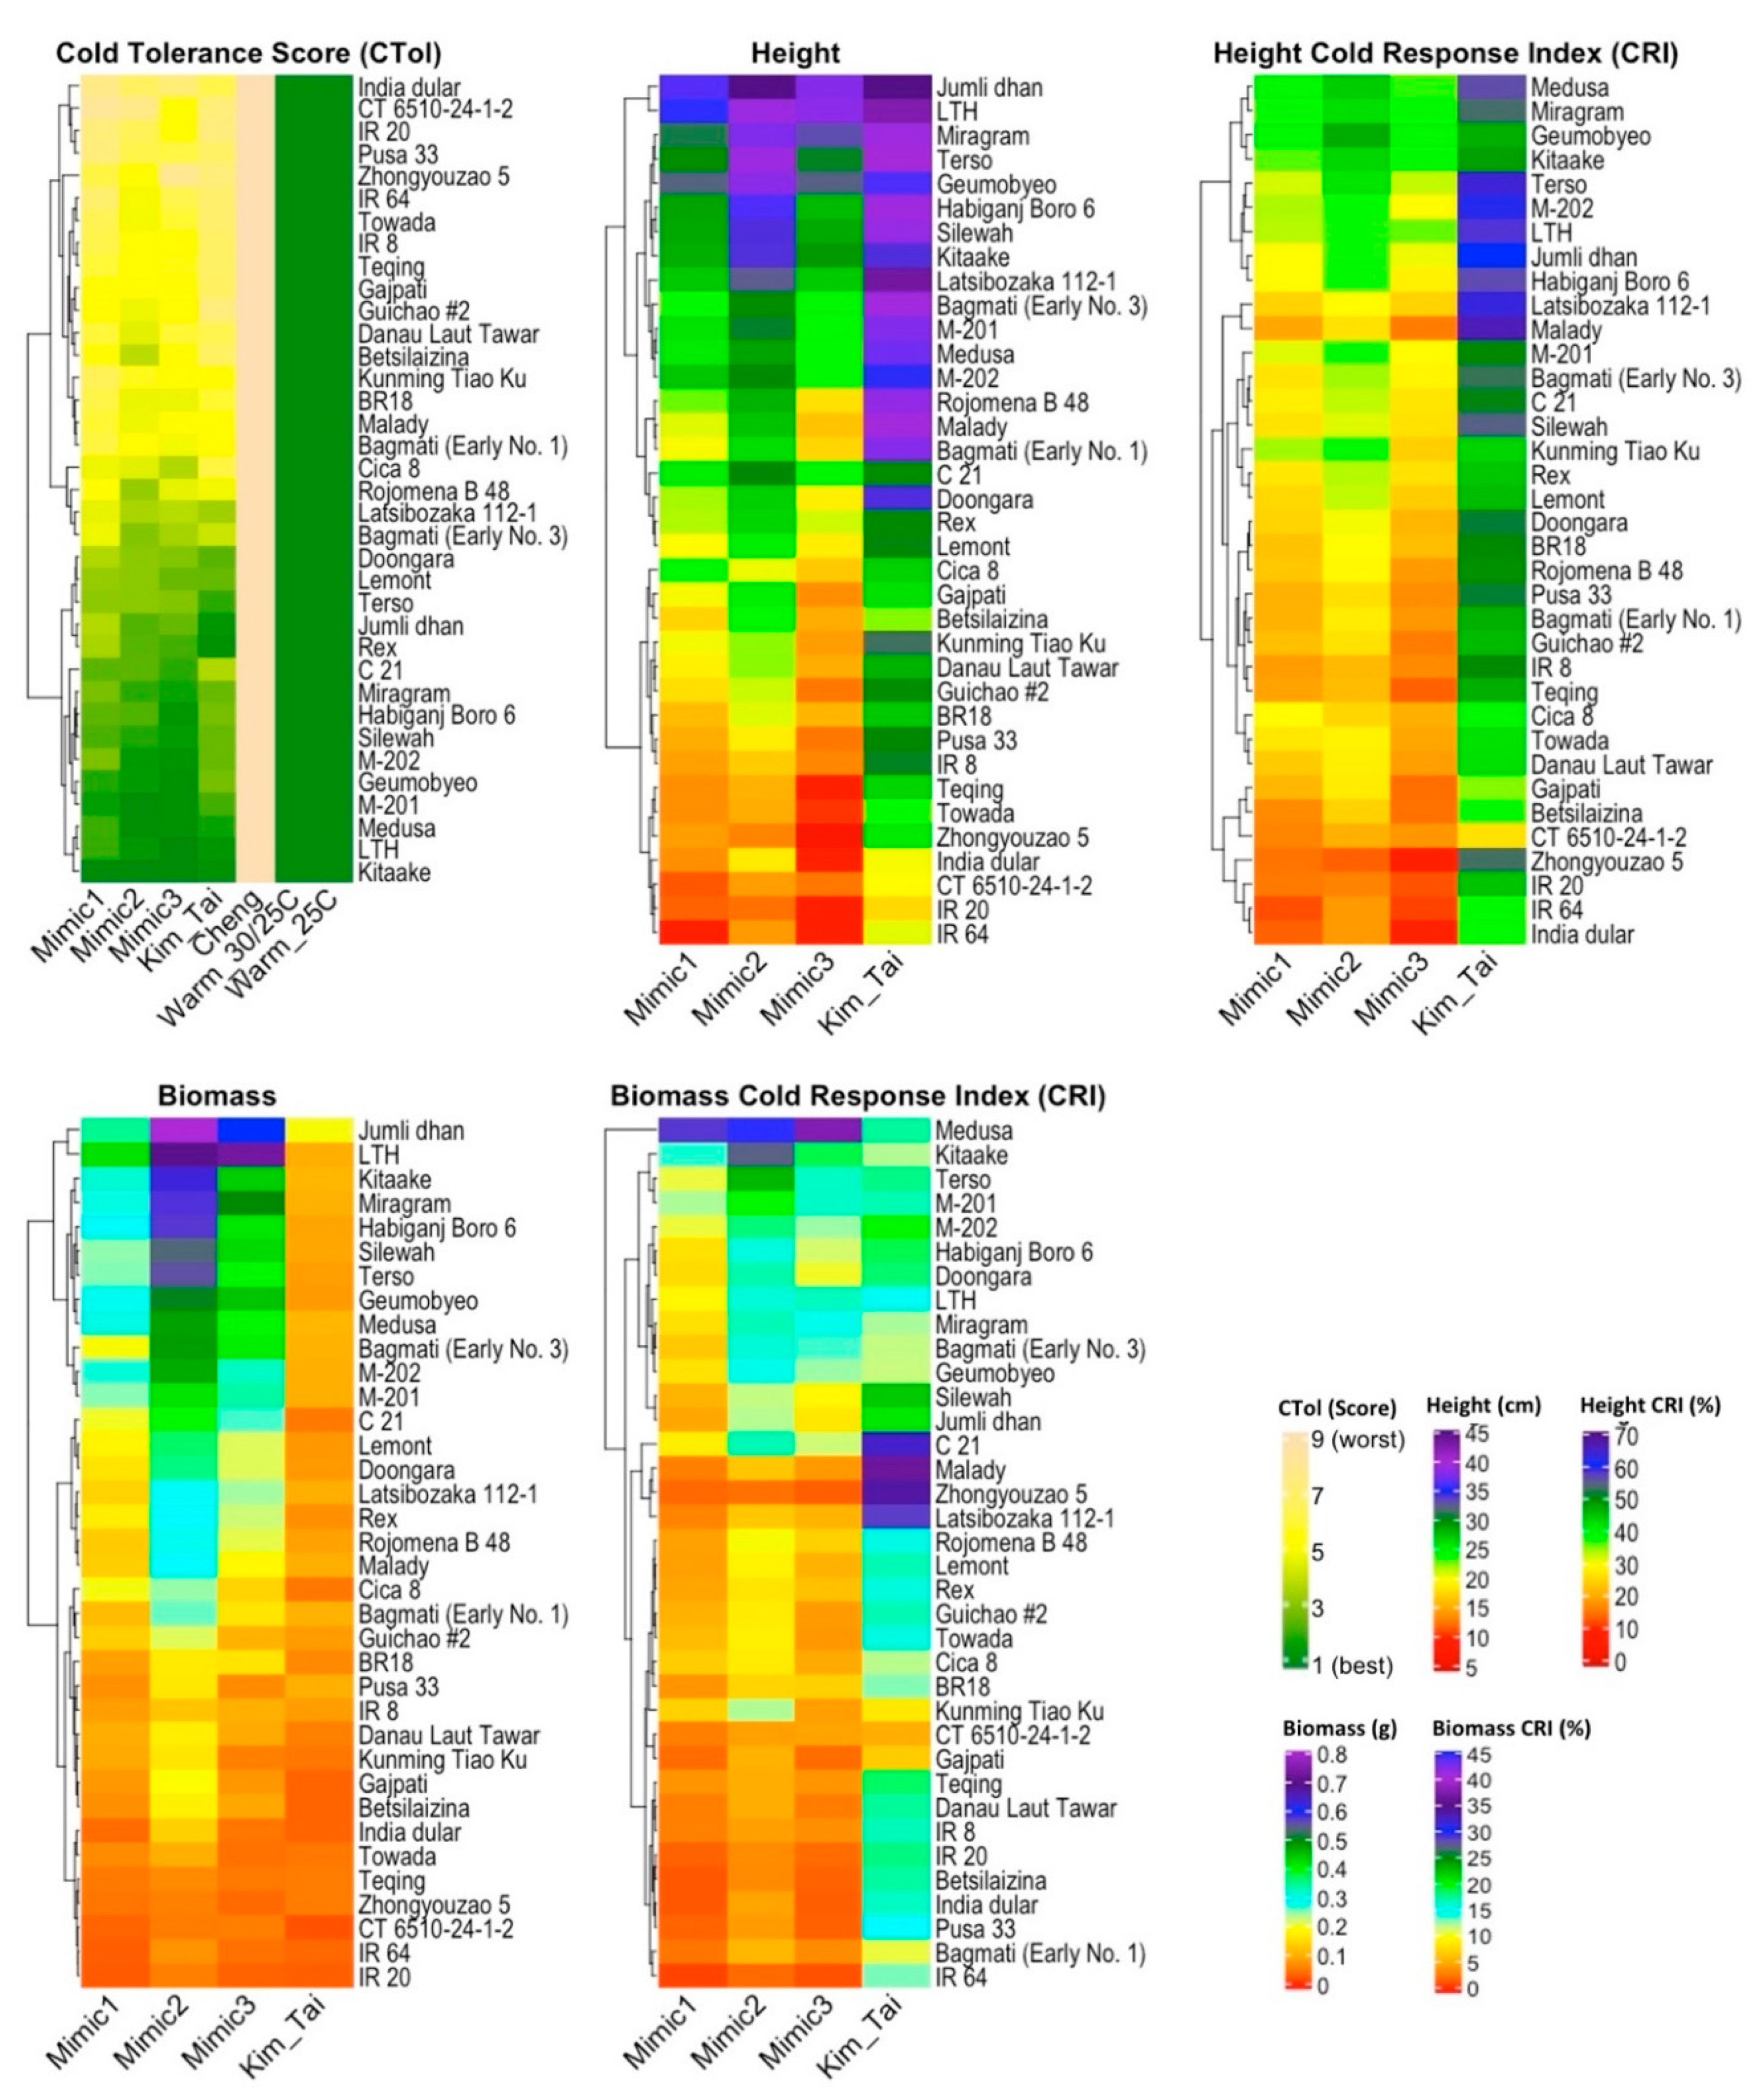
3.2. Seedling Stage Screening

All of the transplanted seedlings in the warm control treatments grew vigorously, as expected. Unexpectedly, all the plants in the Cheng et al. protocol died after the cold stress (4 °C temperature for 1 week), possibly due to higher light intensity in our experiment (and consequently greater photooxidative stress) than in the Cheng et al. [16] study, though they did not indicate the light intensity in their study. Furthermore, the parents tested by Cheng et al. protocol were absent in our experiment. Cheng et al. [16] evaluated 240 introgression lines derived from a cross between a japonica cultivar Xiushui 09 and an indica breeding line IR2061. They reported low but non-zero mean survival rates at seedling stage for the parents and introgression lines (22.1% to 42.8%). The remaining four cold stress protocols (Mimic1, Mimic2, Mimic3, and Kim and Tai) resulted in differences in growth among the cultivars that were broadly consistent with expectations based on prior studies, yet the data obtained from these protocols differed in their specific estimates and rankings.
When all seven treatments were compared, including the five cold stress treatments and the two warm control treatments, ANOVA results from the completely random models indicated that treatment was the largest source of variation, with 65.9% for cold tolerance score, 82.7% for plant height, 78.8% for biomass (Table 2). However, when the analyses were limited to only the four informative cold stress treatments (Mimic1, Mimic2, Mimic3, and Kim and Tai), the largest and highly significant source of variation for the non-CRI traits was cultivar, with 66.3% for cold tolerance score, 48.6% for plant height, and 30.3% for biomass; in contrast, treatment was nonsignificant and estimates of percent of total variation were low to moderate (2.1–19.3%). Cultivar was also a large source of variation for plant height CRI (16.9%) and biomass CRI (19.8%), but treatment was the largest source of variation for height CRI (50.2%). For the subset of the four informative cold stress treatments, interactions between cultivar and treatment or cultivar, treatment and chamber were significant but accounted for a low proportion of the total variation for cold tolerance score and plant height but a large proportion for biomass (19.2% combined). Interactions between cultivar and treatment or cultivar, treatment and chamber were zero for height CRI but large for biomass CRI (24.5% combined). Similarly, in the mixed model ANOVAs, the fixed effect interactions between cultivar and treatment were highly significant (Table 3). Thus, among the Mimic1, Mimic2, Mimic3, and Kim and Tai protocols, the ANOVAs indicated small rank shifts among cultivars for cold tolerance score, plant height, and plant height CRI but larger rank shifts for biomass and biomass CRI. Among the seven different temperature protocols, ANOVAs for the Mimic3 protocol gave the highest R2 for cold tolerance score (0.79), plant height (0.85), biomass (0.66), height CRI (0.82), and biomass CRI (0.73), indicating that it was the most informative for discerning differences among the 36 rice cultivars studied (Table S11).
When only the three mimics treatments (Mimic1, Mimic2 and Mimic3) were considered for the completely random models, the largest and most significant source of variation for all traits was cultivar, with 67.4% for cold tolerance score, 63.6% for plant height, and 42.3% for biomass, 55.9% for height CRI and 51.8% for biomass CRI (Table 2). When comparing only the mimic protocols, treatment main effects were small and non-significant for all traits, and interactions between cultivar and treatment were non-significant for all traits except cold tolerance score; however, there were small but significant interactions among the cultivar, treatment and chamber for all traits. Among the three mimic protocols, interactions between cultivar and treatment or cultivar, treatment and chamber accounted for a small proportion of the total variation combined, with 2.5% for cold tolerance score, 3.4% for plant height, 12.2% for biomass, 3.4% for height CRI, and 10.0% for biomass CRI (Table 2). Thus, the differences among the ANOVAs that compared the four informative cold treatments (including the Kim and Tai protocol) with the ANOVAs that compared only the three mimic protocols were small for cold tolerance score, plant height and biomass, but large for the height and biomass CRIs, with much greater variance attributed to cultivar for analyses of cold response indexes with only the three mimic protocols than with the four-treatment comparisons.
Each of the cultivars in the warm control protocols had an average cold tolerance score of 1.0, indicating that they were uniformly dark green and vigorous, as expected (Figure 2, Table S12). There was also no variation among the cultivars for the Cheng et al. protocol, because all the cultivars died (CTol of 9.0), indicating that 4 °C for one week following a warm pretreatment was not an effective screening method under our conditions for the cultivars tested. Therefore, the Cheng et al. protocol will not be considered further for our study. For remaining four cold treatments (Mimic1, Mimic2, Mimic3, and Kim and Tai), large differences among the cultivars were observed. Moreover, the cultivars known to be most cold sensitive like IR 8, IR 20, IR 64 performed poorly (CTol of 4.8 to 7.4), and the cultivars known to be cold tolerant like Geumobyeo, Kitaake, M-201, and M-202 performed well (CTol of 1.0 to 2.9) as expected (Figure 2, Table S12 and Figure S2). Among the four informative cold stress protocols, the cold tolerance score means (3.8–4.7) and ranges (6.2–7.1) were similar. Correlations among Mimic1, Mimic2, Mimic3, and Kim & Tai were very high (≥0.90) for cold tolerance score (Figure 3). For cold tolerance score, rankings of cultivars among the four informative cold treatments (Mimic1, Mimic2, Mimic3, and Kim and Tai) were similar (Figure 2, Figure S2). Thus, the prolonged exposure to low temperatures in the mimic protocols did not result in noticeable acclimation.
Plant heights under the control (warm) temperature protocol (30/25 °C for 9 weeks) were similar for the cold-sensitive cultivars IR 8, IR 20 and IR 64 (75.5–77.6 cm) and the cold tolerant cultivars Kitaake, M-201 and M-202 (78.5–82.6 cm) (Figure 2, Table S13). However, under the Mimic1, Mimic2, and Mimic3 protocols, which had the same 9 week duration as the warm control, the cold sensitive cultivars IR 8, IR 20 and IR 64 were shorter (9.3–17.1 cm) than the cold tolerant Kitaake, M-201 and M-202 (24.0–34.1 cm) and all entries were substantially shorter under the cold stress mimic protocols than in the warm control protocol. However, for the Kim and Tai protocol, there was a smaller difference in height between the cold-sensitive cultivars IR 8, IR 20 and IR 64 (17.9–30.5 cm) and the cold tolerant cultivars Kitaake, M-201 and M-202 (34.1–37.8 cm).
Over all 36 cultivars tested, the trends were similar, with the mean height of the 9-week warm control protocol (85.7 cm) more than three times greater than the mean heights for the three Mimic protocols (20.0–26.3 cm), and with an intermediate response from the Kim and Tai protocol (32.2 cm). Similarly, the height CRI means were relatively high for the cold tolerant cultivars such as Kitaake (36.2–43.4%), M-201 (29.5–37%), and M-202 (29.7–37.1%) for all three mimics (Table S14). In contrast, cold sensitive cultivars such as IR 8 (17.4–22.1%), IR 20 (13.0–16.7%), IR 64 (12.1–18.8%) showed relatively low height CRI means for the mimic protocols. However, for the Kim and Tai protocol, differences in the CRI among the most cold tolerant cultivars (Kitaake, M-201, M-202; 48.2%, 50.3%, 61.7% respectively) and the most cold sensitive cultivars (IR 8, IR 20, IR 64; 50.1%, 44.9%, 37.5% respectively) were less than for the mimics. Thus, with the mimic protocols, the cold sensitive cultivars were consistently much shorter than the cold tolerant entries, but for the Kim and Tai protocol there was a smaller distinction in plant height. For height, correlations between Kim and Tai and the mimic protocols were high (0.82–0.86) but correlations among just the mimic protocols were higher (0.96) (Figure 3). Moreover, for height CRI, correlations between Kim and Tai and the mimic protocols were low (0.42–0.46) (Figure 3). The heatmap and boxplots for plant height (Figure 2, Figure S3) and height CRI (Figure 2, Figure S4) also indicated that there were substantial differences between the Kim and Tai protocol and the three mimic protocols.
Of the three traits measured at the end of the seedling-stage screen, biomass provided the greatest differentiation between the standard Kim and Tai protocol and the three new mimic protocols, and between the warm control treatments and the cold-stress treatments of the same duration (Figure 2, Table S15 and Figure S5). With the mimic protocols, there was approximately an order of magnitude difference in biomass between cold-tolerant cultivars such as Kitaake, M-201, and M-202, and cold-sensitive cultivars such as IR 20, and IR 64 (Table S15). The ranges of cultivar means for biomass in each of the mimic protocols were more than double that of the Kim and Tai protocol because the former did not have a warm pre-treatment but the latter did. For biomass, correlations among the mimic protocols were very high (0.96) but correlations between Kim and Tai and the mimic protocols were substantially lower (0.70–0.78) and lowest of the three traits measured at the end of the seedling stage protocols (Figure 3). The heatmap and boxplots for biomass (Figure 2, Figure S5) also indicated that there were large differences between the Kim and Tai protocol and the three mimic protocols and large rank shifts of cultivars among the four informative cold treatments. Large inconsistencies between the Kim and Tai protocol and the three mimic protocols were also observed with the biomass CRI (Figure 2, Table S16 and Figure S6), which adjusted for differences among cultivars in biomass accumulation under warm conditions. For biomass CRI, correlations among the mimic protocols were also very high (0.96–0.97) but correlations between Kim and Tai and the mimic protocols were zero (Figure 3). For example, under Kim and Tai, the biomass CRI for IR 20, a cultivar known to be cold-sensitive, was a relatively high 18.0% and similar to that of cold tolerant M-202, which had a value of 19.9%. In contrast, under Mimic3 IR 20 had cold response index of 2.4%, whereas M-202 had a value of 12.8%, which were as expected.
Among the mimic protocols, correlations between cold tolerance scores and plant height, and between cold tolerance scores and biomass were high (0.80–0.91), but between the mimic protocols’ cold tolerance scores and the Kim and Tai protocols’ plant height or biomass, the correlations were only moderate (0.52–0.68) (Figure S7). Similarly, though the correlations between plant height and biomass among all of the four informative cold treatments were high, they were higher among the mimics (0.88–0.96) than between the mimics and Kim and Tai (0.70–0.83) (Figure S7). The correlations were consistent with the greater variation among entries for biomass in the mimic protocols than for the Kim and Tai protocol, as plants in the Kim and Tai protocol were able to accumulate substantial biomass during the warm pretreatment prior to the short duration cold stress.

3.3. Comparison of Germination Stage and Seedling Stage Screens

Root and shoot lengths of cultivars after germination at 20 °C for 3 weeks (cold germination) were highly correlated with transplanted seedling plant heights and biomass from Mimic1, Mimic2, Mimic3, and Kim and Tai protocols (Figure 4). Correlations between low temperature germination root or shoot lengths and transplanted seedling cold tolerance scores were mostly moderate for the mimic protocols but high for the Kim and Tai protocol. In contrast to low temperature germination, root and shoot lengths of cultivars after high temperature germination (30 °C for 1 week) were poorly correlated with cold tolerance scores from the mimic protocols. Similarly, correlations were only moderate when comparing root and shoot lengths after high temperature germination with plant height and biomass from the mimic protocols; however, the high temperature germination vs. low temperature seedling correlations were high for biomass from the Kim and Tai protocol.

4. Discussion

The short-duration low temperature germination protocol (20 °C for 3 weeks) was able to effectively distinguish among cold tolerant and sensitive rice cultivars by simple measures of shoot and root lengths. Similarly, Sharifi [28], Dashtmain et al. [29] and Lone et al. [30] found that coleoptile length and radicle length of rice were significantly affected by low temperature at germination stage. Cruz and Milach [31] concluded that percentage of reduction in coleoptile length during germination was a suitable trait for evaluating cold tolerance of rice. The moderate to high correlations we observed between root or shoot lengths from the cold germination protocol with the seedling stage cold tolerance scores, plant heights, and biomass from the mimic protocols and the Kim and Tai protocol, indicate that most of the information on differences among rice cultivars for low temperature tolerance obtained from the transplanted seedling protocols was also obtained with the low temperature germination protocol. Cultivars with the longest shoots and roots under low temperature germination were typically those that grew best and had the best cold tolerance scores, greatest height, and highest biomass when transplanted and grown in cold conditions. Moreover, the low temperature germination protocol took half the time, less space in expensive controlled environment chambers, and fewer resources (Petri dishes vs. pots) to conduct than the Kim and Tai protocol, and even less time than the mimic protocols. Thus, if one wishes to conduct a survey on a large rice germplasm panel for seedling stage cold tolerance, the low temperature germination protocol used in this study is recommended for an initial assessment because it is highly efficient in use of time and space, and less expensive than a seedling stage study.
Notably, under low temperature germination, some cultivars produced few or no roots; and farmers would not be able to establish such cultivars. Shoot length and root length are very important for adaptation to cold at the early stages of rice plant development. Rice seed that farmers plant during the boro season in Bangladesh (typically in seedbeds) or during early spring in the southern US (typically by direct seeding) will be at risk from low temperature stress during germination and early growth. If the farmer were to plant seeds of a cultivar that is unable to produce roots under low temperature, then low temperature events could lead to failure of the crop to establish and/or be too weak to successfully transplant from a seedbed. Thus, methodology for screening seedling stage cold tolerance of rice that starts out by germinating the seed at warm conditions will miss an important aspect of how farmers’ plantings will respond to cold conditions. One possible cultural intervention could be to cover the seedbed with clear plastic to increase temperatures during germination but this may not always be possible for the farmers due to expense and the need for careful management. Thus, for a cultivar to be most useful to the farmer who must establish rice crops when low temperature stress is common, it should be cold hardy at germination.
The transplanted seedling protocols, Mimic1, Mimic2, Mimic3, and Kim and Tai, were similarly effective in distinguishing rice cultivars using the cold tolerance score, with high correlations among all four treatments. However, because cold tolerance score is a subjective five-point scale, our ability to differentiate among the best cultivars with this measure was limited (Figure 2, Table S12). In contrast, the objective measures of biomass and plant height from the mimic protocols enabled greater differentiation among the best rice cultivars, and provided critical information on the ability of cultivars to grow under low temperatures (Figure 2, Tables S13 and S15). Biomass and height differences were less informative for the Kim and Tai protocol however, because almost all of the height and biomass growth was obtained during the pretreatment under warm conditions for three weeks prior to cold treatment. For example, the best three cultivars for biomass and height under low temperature, based on the Mimic3 protocol, were clearly LTH, Jumli dhan, and Miragram. Though these three cultivars were also among the best performing in the Kim and Tai protocol, it did not distinguish them from many others (Figure 2).
Absolute growth under low temperatures may not be the only or even the best measure of a cultivar’s tolerance to low temperature. The cultivars able to maintain under cold conditions the greatest percentage of their potential biomass accumulation under warm conditions (biomass cold response index) from Mimic3 were Medusa (37.6%), Kitaake (19.0%), and tied for third, M-201, LTH and Terso (16.4–16.6%) (Table S16). Kitaake and Medusa were among the shortest cultivars in this study under warm conditions, yet they were able to maintain the highest proportion of their potential height under low temperatures. In contrast, Jumli dhan, which had high absolute productivity under low temperature, had a moderate biomass cold response index of only 8.6%, but under warm control conditions it produced the most biomass and was the tallest cultivar in this study. Thus, Jumli dhan performed well under low temperature by being exceptionally vigorous but not especially efficient or adapted to growth under this stress, whereas Medusa, Kitaake, M-201 and LTH were very well-adapted to low temperature at the seedling stage. Such insights should be useful for breeding rice cultivars with improved tolerance to seedling stage low temperature stress and the high yield potential of modern semi-dwarf cultivars.

5. Conclusions

Though standard protocols and the subjective cold tolerance score are effective at differentiating rice cultivars with the greatest and least tolerance to seedling stage chilling stress, we found that measures of root and shoot lengths after low temperature germination at 20 °C for 3 weeks could provide essentially the same information in half the time and with less expense, and thus would be a preferred protocol for initial screening of large germplasm panels. However, to further determine which among relatively chilling tolerant rice genotypes are best, we recommend a second stage seedling screen using our Mimic3 protocol and the objective measures of biomass and plant height. In conjunction with the Mimic3 protocol, a warm control treatment is useful for identifying cultivars that maintain the greatest percentage of their potential growth under chilling stress, which we expect to be an especially useful criteria for selection and breeding.

Supplementary Materials

The following are available online at https://www.mdpi.com/2073-4395/11/2/385/s1, Figure S1: Correlations between germination proportion, shoot length and root length for 36 rice (Oryza sativa) cultivars tested with cold germination (20 °C for 3 weeks) and warm germination (30 °C for 1 week); Figure S2: Boxplots of seedling stage cold tolerance (CTola) scores for 36 rice (Oryza sativa) cultivars evaluated via four different seedling-stage low temperature treatment protocols. aCTol score; 1 = seedlings dark green, 3 = seedlings light green, 5 = seedlings yellow, 7 = seedlings brown, 9 = seedlings dead; Figure S3: Boxplots of plant height (cm) for 36 rice (Oryza sativa) cultivars evaluated via four different seedling-stage low temperature treatment protocols; Figure S4: Boxplots of height CRI (%, = cold response index = (value under stress/value under normal conditions) × 100) for 36 rice (Oryza sativa) cultivars evaluated via four different seedling-stage low temperature treatment protocols; Figure S5: Boxplots of biomass (g) for 36 rice (Oryza sativa) cultivars evaluated via four different seedling-stage low temperature treatment protocols; Figure S6: Boxplots of biomass CRI (%, = cold response index = (value under stress/value under normal conditions) × 100) for 36 rice (Oryza sativa) cultivars evaluated via four different seedling-stage low temperature treatment protocols; Figure S7: Correlations for each pairwise combination of traits for each of four low temperature treatments. CTol score: 1 = seedlings dark green, 3 = seedlings light green, 5 = seedlings yellow, 7 = seedlings brown, 9 = seedlings dead. CRI (%) = cold response index = (value under stress/value under normal conditions) × 100; Table S1: Rice (Oryza sativa) cultivars (n = 36) used to compare different protocols (Mimic1, Mimic2, Mimic3, Kim and Tai, Cheng et al. and their warm controls) for determining seedling-stage tolerance to low temperatures; Table S2: Protocols used in this study to evaluate transplanted rice seedlings for tolerance to low temperature (average temperatures for each week shown); Table S3: Mimic1 protocol to screen rice (Oryza sativa) seedlings for tolerance to low temperatures (°C), based on the lowest average temperature at 3 h intervals each week in December 2002 through January 2003 in Rajshahi, Bangladesh, in which cold caused extensive damage to the boro season rice crop; Table S4: Mimic2 protocol to screen rice (Oryza sativa) seedlings for tolerance to low temperatures (°C), based on the lowest minimum temperature at 3 h intervals each week in December 2002 through January 2003 in Rajshahi, Bangladesh, in which cold caused extensive damage to the boro season rice crop; Table S5: Mimic3 protocol to screen rice (Oryza sativa) seedlings for tolerance to low temperatures (°C), based on the lowest average temperature at 3 h intervals each week in December 2010 through January 2011 in Rajshahi, Bangladesh, in which cold caused extensive damage to the boro season rice crop; Table S6: Control temperature (°C) protocol for the Mimic1, Mimic2 and Mimic3 protocols; Table S7: Temperature (°C) for the Kim and Tai [15] protocol to screen rice (Oryza sativa) seedlings for tolerance to low temperatures; Table S8: Temperature (°C) for the Cheng et al. [16] protocol to screen rice (Oryza sativa) seedlings for tolerance to low temperatures; Table S9: Control temperature (°C) protocol for the Kim and Tai and Cheng et al. protocols; Table S10: Least squares means of germination proportion, shoot length and root length for 36 rice (Oryza sativa) cultivars tested with cold germination (20 °C for 3 weeks) and warm germination (30 °C for 1 week); Table S11: Variance accounted for by analysis of variance models for discerning differences among 36 rice (Oryza sativa) cultivars in responses to seven different temperature treatments; Table S12: Least square means of cold tolerance (CTola) scores (1–9 scale) for 36 rice (Oryza sativa) cultivars tested with seven different temperature treatment protocols; Table S13: Least square means of plant height (cm) for 36 rice (Oryza sativa) cultivars tested with seven different temperature treatment protocols; Table S14: Least square means of plant height cold response index (Plant height CRI*, %, = cold response index = (value under stress/value under normal conditions) × 100) for 36 rice (Oryza sativa) cultivars tested with four protocols for evaluating tolerance to low temperature; Table S15: Least square means of dry biomass (g) for 36 rice (Oryza sativa) cultivars tested with seven different temperature treatment protocols; Table S16: Least square means of biomass cold response index (Biomass CRI*, %, = cold response index = (value under stress/value under normal conditions) × 100) for 36 rice (Oryza sativa) cultivars tested with four protocols for evaluating tolerance to low temperature.

Author Contributions

N.S. was responsible for the data curation, analysis and writing of the original draft preparation; R.R. and E.J.S. were responsible for supervision, review and editing. All authors have read and agreed to the published version of the manuscript.

Funding

This research was funded by USDA NIFA HATCH project No. ILLU-802-914.

Institutional Review Board Statement

Not applicable.

Informed Consent Statement

Not applicable.

Data Availability Statement

Not applicable.

Acknowledgments

This work was supported by a fellowship for PhD studies to the lead author from the Lee Foundation, administered jointly by the International Rice Research Institute and the University of Illinois at Urbana-Champaign. We thank the Bangladesh Meteorological Department for providing us with weather data.

Conflicts of Interest

The authors declare no conflict of interest.

References

  1. GRiSP (Global Rice Science Partnership). Rice Almanac, 4th ed.; International Rice Research Institute: Los Baños, Philippines, 2013; p. 283. [Google Scholar]
  2. Sundaram, J.K. Lessons from the 2008 World Food Crisis. Econ. Political Wkly. 2010, 45, 35–40. [Google Scholar]
  3. Kaneda, C.; Beachell, H.M. Response of indica-japonica rice hybrids to low temperatures. SABRAO J. 1974, 6, 17–32. [Google Scholar]
  4. Mackill, D.J.; Lei, X. Genetic variation for traits related to temperate adaptation of rice cultivar. Crop Sci. 1997, 37, 1340–1346. [Google Scholar] [CrossRef]
  5. Kaw, R.N.; Khush, G.S. Combining ability for low-temperature tolerance in rice. In Rice Genetics I; International Rice Research Institute: Los Baños, Philippines, 1986; pp. 593–612. [Google Scholar]
  6. Suh, J.P.; Lee, C.K.; Lee, J.H.; Kim, J.J.; Kim, S.M.; Cho, Y.C.; Park, S.H.; Shin, J.C.; Kim, Y.G.; Jena, K.K. Identification of quantitative trait loci for seedling cold tolerance using RILs derived from a cross between japonica and tropical japonica rice cultivars. Euphytica 2012, 184, 101–108. [Google Scholar] [CrossRef]
  7. Hossain, M.; Naher, F.; Shahabuddin, Q. Food Security and Nutrition in Bangladesh: Progress and Determinants. Electron. J. Agric. Dev. Econ. 2005, 2, 103–132. [Google Scholar]
  8. Li, T.G.; Visperas, R.M.; Vergara, B.S. Correlation of cold tolerance at different growth stages in rice. Acta Bot. Sin. 1981, 23, 203–207. [Google Scholar]
  9. Bangladesh: Disaster Report; Disaster Management Bureau: Dhaka, 2011; Available online: https://www.disasterforum.org/files/Bangladesh_Disaster_Report_2011.pdf (accessed on 9 May 2019).
  10. Andaya, V.C.; Mackill, D.J. Mapping of QTLs associated with cold tolerance during the vegetative stage in rice. J. Exp. Bot. 2003, 54, 2579–2585. [Google Scholar] [CrossRef] [PubMed]
  11. Zhang, Z.H.; Li, S.; Wei, L.; Wei, C.; Zhu, Y.G. A major QTL conferring cold tolerance at the early seedling stage using recombinant inbred lines of rice (Oryza sativa L.). Plant Sci. 2005, 168, 527–534. [Google Scholar] [CrossRef]
  12. Han, L.; Qiao, Y.; Zhang, S.; Zhang, Y.; Cao, G.; Kim, J.; Lee, K.; Koh, H. Identification of Quantitative Trait Loci for Cold Response of Seedling Vigor Traits in Rice. J. Genet. Genom. 2007, 34, 239–246. [Google Scholar] [CrossRef]
  13. Lou, Q.; Chen, L.; Sun, Z.; Xing, Y.; Li, J.; Xu, X.; Mei, H.; Luo, L. A major QTL associated with cold tolerance at seedling stage in rice (Oryza sativa L.). Euphytica 2007, 158, 87–94. [Google Scholar] [CrossRef]
  14. Jiang, L.; Xun, M.; Wang, J.; Wan, J. QTL analysis of cold tolerance at seedling stage in rice (Oryza sativa L.) using recombination inbred lines. J. Cereal Sci. 2008, 48, 173–179. [Google Scholar] [CrossRef]
  15. Kim, S.I.; Tai, T.H. Evaluation of seedling cold tolerance in rice cultivars: A comparison of visual ratings and quantitative indicators of physiological changes. Euphytica 2011, 178, 437–447. [Google Scholar] [CrossRef]
  16. Cheng, L.; Wang, J.; Uzokwe, V.; Meng, L.; Wang, Y.; Sun, Y.; Zhu, L.; Xu, J.; Li, Z. Genetic Analysis of Cold Tolerance at Seedling Stage and Heat Tolerance at Anthesis in Rice (Oryza sativa L.). J. Integr. Agric. 2012, 11, 359–367. [Google Scholar] [CrossRef]
  17. Kim, S.M.; Suh, J.P.; Lee, C.K.; Lee, C.K.; Kim, Y.G.; Jena, K.K. QTL mapping and development of candidate gene-derived DNA markers associated with seedling cold tolerance in rice (Oryza sativa L.). Mol. Genet. Genom. 2014, 289, 333–343. [Google Scholar] [CrossRef] [PubMed]
  18. Zhao, J.; Zhang, S.; Dong, J.; Yang, T.; Mao, X.; Liu, Q.; Wang, X.; Liu, B. A novel functional gene associated with cold tolerance at the seedling stage in rice. Plant Biotechnol. J. 2017, 15, 1141–1148. [Google Scholar] [CrossRef] [Green Version]
  19. Lv, Y.; Guo, Z.; Li, X.; Ye, H.; Li, X.; Xiong, L. New insights into the genetic basis of natural chilling and cold shock tolerance in rice by genome-wide association analysis. Plant Cell Environ. 2016, 39, 556–570. [Google Scholar] [CrossRef] [PubMed] [Green Version]
  20. International Rice Research Institute. Standard Evaluation System for Rice; International Rice Research Institute: Los Baños, Philippines, 1996. [Google Scholar]
  21. Zhang, F.; Ma, X.-F.; Gao, Y.-M.; Hao, X.-B.; Li, Z.-K. Genome-wide response to selection and genetic basis of cold tolerance in rice (Oryza sativa L.). BMC Genet. 2014, 15, 55. [Google Scholar] [CrossRef] [PubMed] [Green Version]
  22. R Core Team. R: A Language and Environment for Statistical Computing; R Foundation for Statistical Computing: Vienna, Austria, 2018. [Google Scholar]
  23. Bates, D.; Mächler, M.; Bolker, B.; Walker, S. Fitting Linear Mixed-Effects Models Using lme4. J. Stat. Softw. 2015, 67, 1–48. [Google Scholar] [CrossRef]
  24. Lenth, R. Emmeans: Estimated Marginal Means, Aka Least-Squares Means; 2019; Available online: http://th.archive.ubuntu.com/cran/web/packages/emmeans/index.html (accessed on 20 February 2021).
  25. Revelle, W. Psych: Procedures for Psychological, Psychometric, and Personality Research; Northwestern University: Evanston, IL, USA, 2018. [Google Scholar]
  26. Gu, Z.; Eils, R.; Schlesner, M. Complex Heatmaps Reveal Patterns and Correlations in Multidimensional Genomic Data. Bioinformatics 2016, 32, 2847–2849. [Google Scholar] [CrossRef] [Green Version]
  27. Wickham, H. Ggplot2: Elegant Graphics for Data Analysis; Springer: New York, NY, USA, 2016. [Google Scholar]
  28. Sharifi, P. Evaluation on Sixty-Eight Rice Germplasms in Cold Tolerance at Germination. Rice Sci. 2010, 17, 77–81. [Google Scholar] [CrossRef]
  29. Dashtmain, F.P.; Hosseini, K.M.; Esfahani, M. Methods for rice genotypes cold tolerance evaluation at germination stage. Int. J. Agric. Crop Sci. 2013, 5, 2111–2116. [Google Scholar]
  30. Lone, J.A.; Khan, M.N.; Bhat, M.A.; Shikari, A.B.; Wani, S.H.; Sofi, N.R.; Khan, M.I.; Lone, R.A. Cold Tolerance at Germination and Seedling Stages of Rice: Methods of Evaluation and Characterization of Thirty Rice Genotypes under Stress Conditions. Int. J. Curr. Microbiol. Appl. Sci. 2018, 7, 1103–1109. [Google Scholar] [CrossRef]
  31. Da Cruz, R.P.; Milach, S.C.K. Cold tolerance at the germination stage of rice: Methods of evaluation and characterization of genotypes. Sci. Agric. 2004, 61, 1–8. [Google Scholar] [CrossRef] [Green Version]
Figure 1. Protocols used in this study to screen rice (Oryza sativa) seedlings for tolerance to low temperatures (°C). The novel Mimic1, Mimic2, Mimic3 protocols were based on the lowest average in 2002–2003, lowest minimum in 2002–2003, and lowest average in 2010–2011 temperatures at 3 h intervals each week in December through January, in Rajshahi, Bangladesh; the warm control 30/25 °C protocol for the Mimics is also shown on the left (first column). Temperatures (°C) for the Kim and Tai [15] protocol and Cheng et al. [16] protocol along with their warm control of constant 25 °C are shown on the right (second column).
Agronomy 11 00385 g001
Figure 2. Heatmaps for different low temperature treatment protocols for 36 rice (Oryza sativa) cultivars evaluated for cold tolerance score (CTol), seedling stage plant height, height CRI, biomass, and biomass CRI. CTol = seedling cold tolerance scale (1 = seedlings dark green, 3 = seedlings light green, 5 = seedlings yellow, 7 = seedlings brown, 9 = seedlings dead). CRI = cold response index = (value under stress/value under normal conditions) × 100.
Agronomy 11 00385 g002
Figure 3. Correlations among four different low temperature treatment protocols for evaluating seedling stage cold tolerance (CTol), plant height (PH), biomass (BM), height CRI (HCRI) and biomass CRI (BCRI) among 36 rice (Oryza sativa) cultivars. CTol score: 1 = seedlings dark green, 3 = seedlings light green, 5 = seedlings yellow, 7 = seedlings brown, 9 = seedlings dead. CRI (%) = cold response index = (value under stress/value under normal conditions) × 100. Asterisks indicate significant correlation at * p  <  0.05, ** p  <  0.01, *** p  <  0.001.
Agronomy 11 00385 g003
Figure 4. Correlations among germination traits and seedling stage low temperature traits for 36 rice (Oryza sativa) cultivars. CTol score: 1 = seedlings dark green, 3 = seedlings light green, 5 = seedlings yellow, 7 = seedlings brown, 9 = seedlings dead. CRI (%) = cold response index = (value under stress/value under normal conditions) × 100.
Agronomy 11 00385 g004
Table 1. Results of analyses of variance (ANOVA) using a completely random model and a fixed effects model, for 36 rice (Oryza sativa) cultivars tested with two germination treatments (cold: 20 °C for 3 weeks; warm: 30 °C for 1 week).
SourceRandom ModelFixed Model
% of Total VarianceMean Sq
Germination ProportionShoot LengthRoot LengthDfGermination ProportionShoot LengthRoot Length
Cultivar27.1 ***55.1 ***35.7 ***350.083731 ***30.8441 ***8.1656 ***
Treatment3.7 *3.4 NS10.0 **10.155715 ***23.9260 ***20.2986 ***
Cultivar:Treatment4.0 NS19.7 ***25.9 ***350.016230 NS3.7019 ***1.4950 ***
Residual65.121.828.43950.0121650.64470.2652
Asterisks indicate statistically significant differences at * p  <  0.05, ** p  <  0.01, *** p  <  0.001 and NS indicate Not Significant.
Table 2. Results of analyses of variance using a completely random model, showing percent of total variance when comparing 36 rice (Oryza sativa) cultivars in controlled environment screens for seedling stage tolerance to low temperature.
All Treatments (5 Cold and 2 Warm)Mimic1, Mimic2, Mimic3 and Kim_TaiMimic1, Mimic2 and Mimic3
SourceCTolPlant HeightBiomassCTolPlant HeightBiomassHeight CRIBiomass CRICTolPlant HeightBiomassHeight CRIBiomass CRI
Chamber0.00.00.00.00.00.00.00.00.00.00.00.00.0
Cultivar 12.3 ***7.5 ***1.5 *66.3 ***48.6 ***30.3 ***16.9 ***19.8 ***67.4 ***63.6 ***42.3 ***55.9 ***51.8 ***
Treatment65.9 **82.7 ***78.8 ***2.119.310.350.2 *12.73.35.43.76.62.5
Treatment:Chamber2.5 ***1.9 ***0.8 ***4.7 ***12.2 ***24.9 ***8.3 ***13.1 ***4.8 ***15.7 ***25.4 ***18.6 ***19.6 ***
Cultivar:Chamber0.00.00.02.10.00.010.8 ***0. 00.20.00.00.00.0
Cultivar:Treatment8.6 ***3.2 ***12.3 ***2.1 **1.9 *7.4 ***0.016.0 ***1.3 *0.10.70.00.0
Cultivar:Treatment: Chamber3.1 ***0.10.03.4 ***3.4 ***11.8 ***0.08.5 ***2.2 **3.3 ***11.5 ***3.4 ***10.0 ***
Trays within chamber0.2 *0.1 *0.00.6 *0.2 *0.20.2 *0.20.7 *0.10.30.20.2
Chamber:Treatment:Trays within chamber0.6 ***0.2 ***0.5 ***1.2 ***0.21.3 ***0.10.7 ***1.3 ***0.3 *1.3 ***0.4 *0.9 ***
Residual6.94.36.017.614.313.913.529.018.811.414.714.915.0
Total100.0100.0100.0100.0100.0100.0100.0100.0100.0100.0100.0100.0100.0
Asterisks indicate statistically significant differences at * p  <  0.05, ** p  <  0.01, *** p  <  0.001; CTol = seedling cold tolerance scale (1 = seedlings dark green, 3 = seedlings light green, 5 = seedlings yellow, 7 = seedlings brown, 9 = seedlings dead); CRI (%) = cold response index = (value under stress/value under normal conditions) × 100.
Table 3. Results for fixed effects from mixed model analyses of variance comparing 36 rice (Oryza sativa) cultivars in controlled environment screens for seedling stage tolerance to low temperature.
SourceAll Treatments (5 Cold and 2 Warm-Controls)Mimic1, Mimic2, Mimic3 and Kim_Tai (Best 4 Cold Treatments)
CTolPlant HeightBiomass CTolPlant HeightBiomassHeight CRIBiomass CRI
NuDfMean sqMean sqMean sqNuDfMean sqMean sqMean sqMean sqMean sq
Cultivar3517.03 ***2361.35 ***2.35 ***3562.43 ***1179.03 ***0.14 ***1081.05 ***403.81 ***
Treatment620.29 *1672.18 ***7.65 ***32.27 NS75.99 NS0.013 NS469.53 **70.70 NS
Cultivar:Treatment2102.74 ***160.19 ***0.95 ***1051.58 **29.31 ***0.015 ***103.84 ***82.15 ***
Asterisks indicate statistically significant differences at * p  <  0.05, ** p  <  0.01, *** p  <  0.001 and NS indicate Not Significant; CTol = seedling cold tolerance scale (1 = seedlings dark green, 3 = seedlings light green, 5 = seedlings yellow, 7 = seedlings brown, 9 = seedlings dead); CRI (%) = cold response index = (value under stress/value under normal conditions) × 100.
Publisher’s Note: MDPI stays neutral with regard to jurisdictional claims in published maps and institutional affiliations.

