Article

Optimal Agronomics Increase Grain Yield and Grain Yield Stability of Ultra-Early Wheat Seeding Systems

1
Department of Agricultural, Food, and Nutritional Science, 410 Agriculture/Forestry Centre, University of Alberta, Edmonton, AB T6G 2P5, Canada
2
Lethbridge Research and Development Centre, Agriculture and Agri-Food Canada, 5403 1st Avenue South, Lethbridge, AB T1J 4B1, Canada
*
Author to whom correspondence should be addressed.
Agronomy 2021, 11(2), 240; https://doi.org/10.3390/agronomy11020240
Submission received: 1 December 2020 / Revised: 16 January 2021 / Accepted: 20 January 2021 / Published: 28 January 2021

Abstract

:
Ultra-early seeding of spring wheat (Triticum aestivum L.) on the northern Great Plains can increase grain yield and grain yield stability compared to current spring wheat planting systems. Field trials were conducted in western Canada from 2015 to 2018 to evaluate the impact of optimal agronomic management on grain yield, quality, and stability in ultra-early wheat seeding systems. Four planting times initiated by soil temperature triggers were evaluated. The earliest planting was triggered when soils reached 0–2.5 °C at a 5 cm depth, with the subsequent three plantings completed at 2.5 °C intervals up to soil temperatures of 10 °C. Two spring wheat lines were seeded at each planting date at two seeding depths (2.5 and 5 cm), and two seeding rates (200 and 400 seeds m−2). The greatest grain yield and stability occurred from combinations of the earliest seeding dates, high seeding rate, and shallow seeding depth; wheat line did not influence grain yield. Grain protein content was greater at later seeding dates; however, the greater grain yield at earlier seeding dates resulted in more protein production per unit area. Despite extreme ambient air temperatures below 0 °C after planting, plant survival was not reduced at the earliest seeding dates. Planting wheat as soon as feasible after soil temperatures reach 0 °C, and prior to soils reaching 7.5–10 °C, at an optimal seeding rate and shallow seeding depth increased grain yield and stability compared to current seeding practices. Adopting ultra-early wheat seeding systems on the northern Great Plains will lead to additional grain yield benefits as climate change continues to increase annual average growing season temperatures.

1. Introduction

Canada is a key global producer of high-quality spring wheat (Triticum aestivum L.), and in 2018 was the world’s third largest exporter (19.7 MT) and sixth largest producer (31.8 MT) of wheat [1]. Spring wheat production in western Canada has increased from an annual average of 14.3 MT (1961–1970) to 19.8 MT (2008–2017), while the annual area seeded to spring wheat decreased by 31% over the same period [2]. The average annual grain yield increase over this period, from 1.5 MT to 3.0 MT per million hectares, is attributed to improved wheat genetics and agronomic management, increased and more efficient fertilizer use, and adoption of technology and mechanization [3]. A short frost-free period is commonly referenced as a grain yield-limiting factor on the northern Great Plains; however, increases in the average frost-free period from 1961 to 2018 are rarely referenced as contributing to wheat grain yield increase [4,5,6,7]. Ultra-early wheat seeding systems based on soil temperature triggers as described in Collier et al. [8] can produce greater grain yield by capturing the benefits of longer frost-free periods: early season growing degree-day accumulation, increased vegetative growth periods, early season precipitation, increased day-length at anthesis and reduced average temperatures at grain fill.
Iqbal et al. [9] reported one of the primary limiting factors of wheat grain yield on the northern Great Plains was the short frost-free period that limits the length of the growing season. Lanning et al. [10] investigated the yield of “Thatcher” wheat from six locations in Montana, USA, over 56 seasons and reported a grain yield increase of 23.5 kg ha−1 year−1 and an average planting window shift of 0.24 days year−1 earlier. The grain yield increase of Thatcher was attributed to earlier planting and longer growing seasons. Cutforth et al. [11] calculated the average frost-free period in western Canada to be 114 days in 2000, an increase of 28 days from the average frost-free period of 96 days in 1940. This increase was a result of both earlier final spring frosts and later first fall frosts. The shift to earlier final spring frosts has been accompanied by a corresponding increase in average growing season temperature. This can decrease wheat grain yield due to increased daily temperature maximums and fewer precipitation events during grain fill [10,12,13,14]. Studies investigating wheat and small grain cereals seeding dates reported the greatest yield resulted from the earliest seeding dates [15,16,17,18,19]. However, these studies initiated plantings based on an arbitrary calendar date, meaning the planting times within individual seasons were not standardized to account for variability between growing seasons, an issue accounted for by moving to soil temperature-triggered seeding in the study conducted by Collier et al. [8]. Multiple studies have identified earlier seeding as an important method to avoid grain yield reduction caused by increased growing season temperatures [8,14,20,21]. Specifically, Kouadio et al. [20] reported the least yield loss due to increased temperatures during grain fill occurred in earlier-seeded wheat.
Collier et al. [8] investigated ultra-early wheat seeding on the northern Great Plains using conventional and cold-tolerant spring wheat lines and seeding times based on soil temperature triggers of 0 °C through 10 °C. That study reported ultra-early seeding maintained grain yield, and that ultra-early seeding was not dependent on the concurrent development of cold tolerant spring wheat genetics. The latest planting time in the study, based on a 10 °C soil temperature trigger, resulted in the lowest yield at locations south of 51° N latitude, but was not different from the early seeding dates at sites north of 51° N latitude. The greatest growing system stability, based on high grain yield and low variability in grain yield, was observed from plantings at 2 °C and 4 °C soil temperatures. Studies conducted in the Australian grain belt evaluating early seeding have reported grain yield increases as a result of better establishment, deeper rooting, increased access to soil moisture, sustained vegetative growth periods and reduced heat during flowering and grain fill [22,23]. Successful establishment of wheat in an ultra-early seeding system on the northern Great Plains may have the potential to increase yield compared to current practices, and may provide long term benefits by avoiding grain yield loss due to reduced precipitation and increased temperatures during grain fill, impacts commonly predicted as a result of climate change.
The present study objective was to evaluate the responses of grain yield and grain quality to manipulations in agronomic management practices in an ultra-early wheat seeding system in the western Canadian region of the northern Great Plains. Four plantings based on soil temperature triggers initiated at 0–2.5 °C were evaluated in combination with cold-tolerant spring wheat genetics, sowing density and depth manipulations, to determine if ultra-early seeding systems coupled with optimized agronomic practices could provide a grain yield advantage over current seeding practices.

2. Materials and Methods

2.1. Site Description, Experimental Design, and Determination of Planting Time Using Soil Temperature Triggers

This study was conducted at five sites in western Canada over 4 years from 2015–2018, generating 13 total site-years (Figure 1, Table 1). The treatment structure consisted of a factorial randomized complete block arrangement of 32 total treatments with four replicates. Treatmentcombinations consisted of four planting times, two wheat lines, two planting rates, and two planting depths. The planting times were based on soil temperature triggers of 0–2.5, 5, 7.5 and 10 °C as measured with an OmegaTM TPD42 soil temperature probe (Omega Environmental, St-Eustache, QC, Canada) at 5 cm depth at 10:00 AM each day prior to seeding. If soil conditions made seeding impossible at the first soil temperature trigger (0–2.5 °C) each seeding date was adjusted so that there was a 2.5 °C temperature difference between each remaining seeding date. Sites located in southern Alberta and Saskatchewan were generally able to seed at 0–2.5 °C soil temperatures. In some cases, sites in central and northern Alberta were unable to seed at the earliest soil temperature trigger due to excess moisture and saturated soils; in these cases, seeding occurred as early as equipment could access field sites.
The wheat lines used were two experimental lines selected for spring growth habit and improved cold tolerance as previously described in Collier et al. [8]. These lines, “LQ1299A” and “LQ1315A”, were developed by intercrossing two previously identified cold tolerant spring wheat lines derived from a cross between “Norstar” Canada Western Red Winter (CWRW) wheat and “Bergen”, a Dark Northern Spring (DNS) wheat grown in North Dakota (Table 2) [24].
Two sowing densities were used to represent sub-optimal (200 seeds m−2) and optimal (400 seeds m−2) wheat seeding rates. Germination tests were performed and used to standardize treatments at 200 and 400 viable seeds m−2, respectively. Seeding depths of 2.5 and 5 cm were used to approximate the upper and lower ranges of standard wheat seeding depths in western Canada.

2.2. Seeding Operations, Nutrient Management, and Pest Management

Seeding equipment varied between sites but remained similar to the drill designed and built by Agriculture and Agri-Food Canada Lethbridge, which utilized ConservaPakTM knife openers (8) (Model CP129, Vale Industries, Indian Head, SK, Canada) spaced 24 cm apart, a ValmarTM air product delivery system (Valmar Air Inc., Elie, MB, Canada), a RavenTM hydraulic seed calibration and product control system (Raven Industries Inc. Sioux Falls, SD, USA) and MorrisTM seed cups (Morris Industries Ltd. Saskatoon, SK, Canada). Macronutrient fertilizer (N, P, K, S) was applied based on soil test recommendations and yield goals appropriate to each site (Western Ag Labs PRS® soil test system, Saskatoon, SK, Canada). If required, applied fertilizer forms were: urea nitrogen (46-0-0-0), monoammonium phosphate (11-52-0-0) (Koch Fertilizer, LLC. Wichita, KS, USA), potassium chloride (0-0-60) (The Mosaic Company, Tampa, FL, USA), and ammonium sulphate (21-0-0-24) (Yara Canada, Regina, SK, Canada). Fertilizer granules were incorporated as a band below and to the side of the seed row at seeding. All seed was treated with a fungicide seed treatment to control common seedling diseases (Raxil PRO—Tebuconazole [(RS)-1-p-chlorophenyl-4,4-dimethyl-3-(1H-1,2,4-triazol-1-ylmethyl)pentan-3-ol] 3.0 g L−1 + prothioconazole [(RS)-2-[2-(1-chlorocyclopropyl)-3-(2-chlorophenyl)-2-hydroxypropyl]-2,4-dihydro-1,2,4-triazole-3-thione] 15.4 g L−1 + metalaxyl [metyl N-(methocyacetyl)-N-2,6-xylyl-dl-alanite] 6.2 g L−1 [Bayer CropScience Canada Inc., Calgary, AB, Canada]). Plots were uniformly seeded directly into the previous crop stubble at target seeding rates across the desired length plus 50 cm on either end. The front and back of each two to four-meter-wide plot was then trimmed or rototilled to provide the desired plot length (6 m to 8 m depending on trial location). The preceding crop at all sites was either canola (Brassica napus L.), chem-fallow, or barley silage (Hordeum vulgare L.); no trials were seeded into wheat stubble. Seeding depth was adjusted as needed for each plot using appropriate spacers to accurately provide the two seeding depths evaluated.
Weed control was achieved using in-crop herbicide applications performed at BBCH 12–22, generally in late-May. To address growth stage variation within replications due to planting date variation, herbicide products with restrictive crop staging, residual properties or auxin type active ingredients were not used. Herbicide selection was limited to herbicides or combinations of herbicides from the Weed Science Society of America (WSSA) groups 2, 6, and 27 [26]. All post-emergent herbicide applications were made using motorized sprayers calibrated to deliver a carrier volume of 45 L ha−1 at 275 kPa pressure.

2.3. Data Collection

Days to emergence was determined when 50% of the plants in a plot had emerged. Crop anthesis was recorded in days from planting date when 50% of the heads in a plot first extruded anthers, and maturity was assessed at physiological maturity, when kernel moisture content in the lower third of a head contained less than 40% moisture content. The period from emergence to maturity was broken down into segments from emergence to anthesis, anthesis to maturity and emergence to maturity, all measured and reported in days. This removed the influence of longer planting to emergence periods experienced by the early seeded treatments and avoided potentially false conclusions regarding the effects of ultra-early planting on the length of vegetative and reproductive growth periods of wheat. Leaf area index (LAI) at the Lethbridge, Alberta sites was recorded using an AccuPAR LP 80 Ceptometer (Decagon Devices, Pullman, WA, USA) placed between rows with measurements recorded above and below the canopy at solar noon [27,28]. The LAI measurements were performed four times from June 1 to July 1 to capture leaf area prior to and during the summer solstice. Growing degree-days base 0 °C (GDD B0) at the Lethbridge, Alberta sites for each season (2015–2018) were recorded and calculated using the Government of Alberta, Alberta Climate Information System (ACIS) [29]. Plant count determination was completed at BBCH 20 to BBCH 49, and calculated from viable plants in two, one-meter long areas of the second and third rows, and the second and third last rows of each plot. The lengths of row used for plant counts were marked and used later in the growing season to count the number of heads m−2. Heads plant−1 was calculated using the number of heads divided by the plant count for each staked section of row. Plant height was recorded from two, randomly selected but representative areas of each plot, measuring the height of five main spikes, excluding awns.
Each plot was harvested in its entirety with a Wintersteiger Nurserymaster Elite (Wintersteiger AG Salt Lake City, UT, USA) or similar plot combine equipped with a straight cut header, pickup reel and crop lifters. Grain yield for each plot was weighed after samples were dried and corrected to 14% grain moisture content and was used to calculate total grain yield per ha (Mg ha−1). A 2 kg subsample of grain was retained to determine seed mass (from 500 kernels) and grain bulk density (kg hL−1). Near infrared reflectance spectroscopy technology was used to determine whole grain protein concentration from the same subsample (Foss Decater GrainSpec, Foss Food Technology Inc., Eden Prairie, MN, USA) [30].

2.4. Statistical Analyses

The MIXED procedure of SAS (Version 9.4, Cary, NC, USA) was used to perform an analysis of variance (ANOVA), and any outlier observations detected by tests for normality using PROC UNIVARIATE were removed before completing a combined analysis across years and environments (site-years). The combined ANOVA was completed using site-year, replication, soil temperature at seeding, wheat line, seeding rate and seeding depth as variables in the CLASS statement [31,32]. Error variances were heterogenous among environments, and corrected Akaike’s information criterion (AICc) regarding model fit indicated that modelling residual variance heterogeneity resulted in improved fit. Variance heterogeneity was modelled using the RANDOM statement in PROC MIXED with the group option set to environment and the Satterthwaite approximation for degrees of freedom. Environment and the interactions associated with environment were considered random effects, while treatment effects were considered fixed and significant when p ≤ 0.05 [33]. Contrast statements were used in the MIXED procedure to determine linear and quadratic relationships of planting date and response variables as well as differences in LAI between groupings of planting dates and seeding rates.
The effect of planting date on yield was evaluated using an analysis of covariance (ANCOVA) as described by Yang and Juskiw [34]. The use of ANCOVA reduced the error mean square, accounted for missing data, and increased the precision of the resulting regression analysis. Planting date was used as a covariate and classification variable by generating a second column of data identical to the planting date to be used as the covariate. Type I sums of squares was specified with the METHOD statement in PROC MIXED [34]. Direct regression variables (covariates) s and s × s represented linear and quadratic responses to planting date and were part of the MODEL statement. Environment or group interactions with s and s × s are used to evaluate linear and quadratic responses that are heterogeneous compared to planting date. A significant, negative linear regression was observed and used to represent grain yield decline with delayed planting.
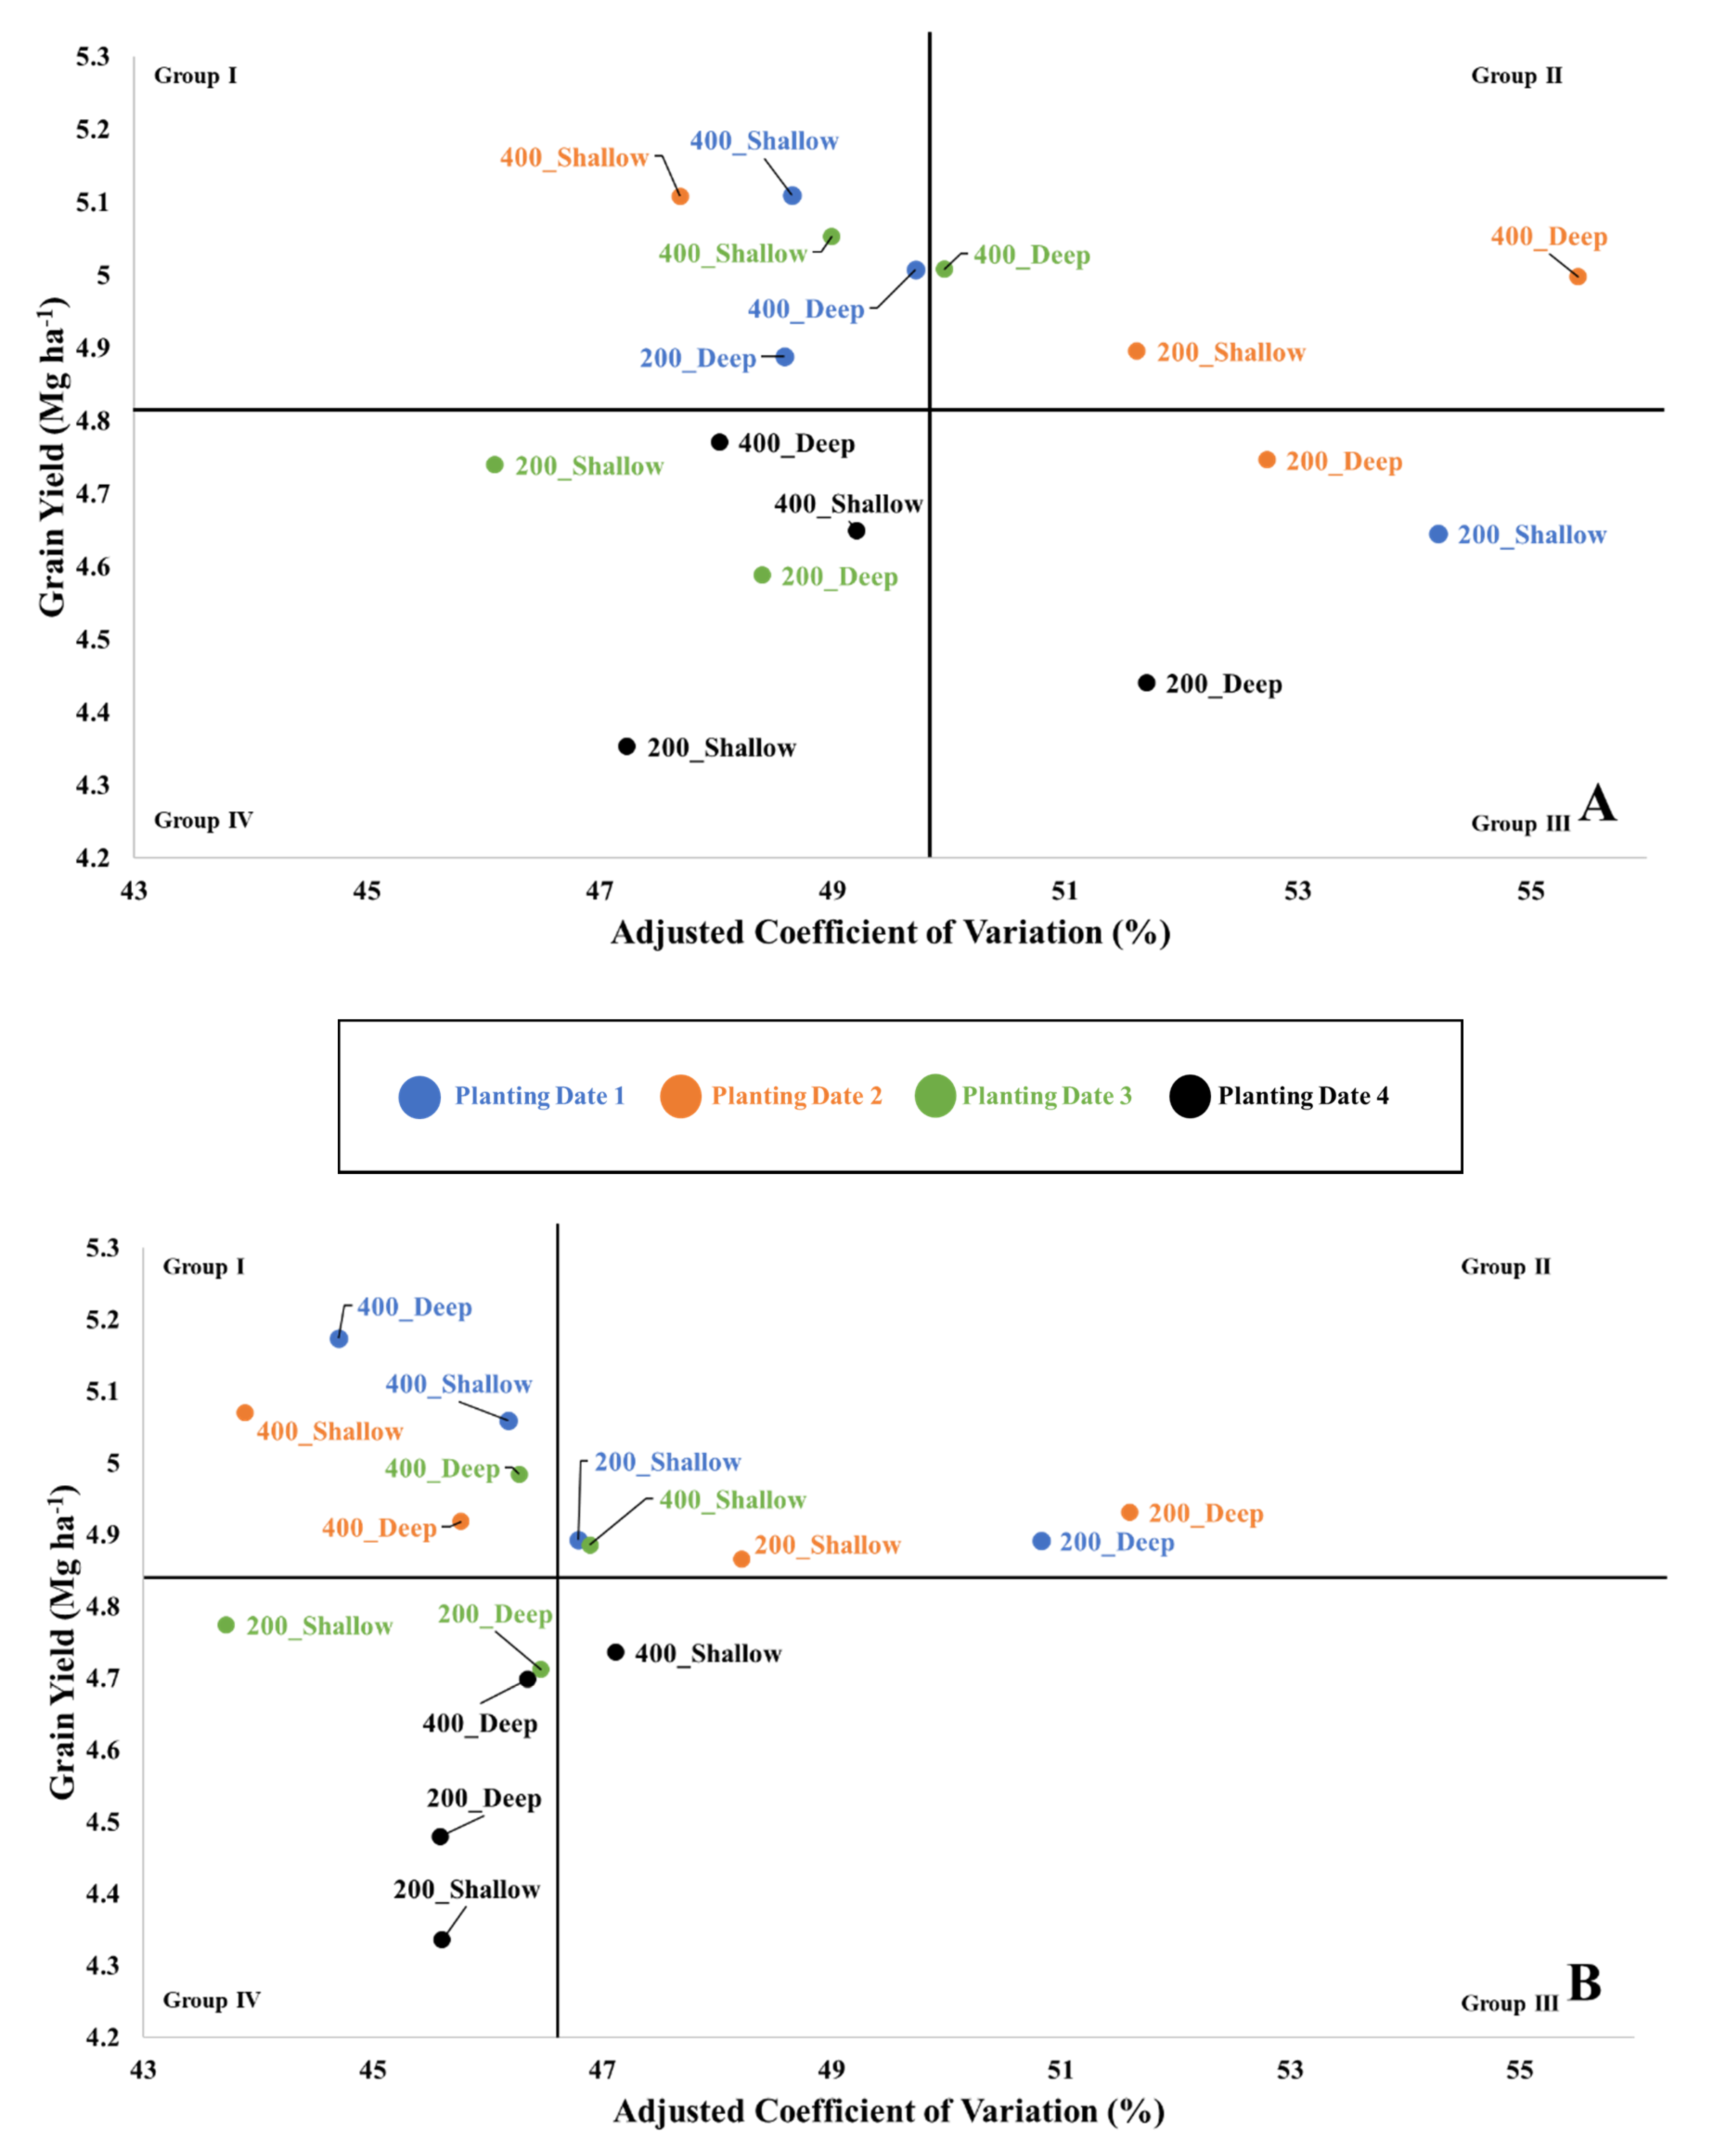
A biplot grouping methodology originally described by Francis and Kannenberg [35] was modified and used to explore system stability and the variability of wheat yield. The methodology proposed by Döring and Reckling [36] was used to generate an adjusted coefficient of variation (aCV) for use in place of the standard coefficient of variation (CV) described by Francis and Kannenberg [35]. The subsequent use of aCV in the place of CV on biplot horizontal axes accounts for the impact of yield data conforming to Taylor’s Power Law where the CV value is dependent on the yield and will tend to decrease relative to yield increases [37,38]. The aCV and means across years and replications were estimated for each treatment combination. Means were then plotted on the vertical axis against the aCV on the horizontal axis and used to categorize the data into four groups/quadrants: (Group I) high mean grain yield and low variability, (Group II) high mean grain yield and high variability, (Group III) low mean grain yield and high variability, and (Group IV) low mean grain yield and low variability.

3. Results

3.1. Environmental Conditions

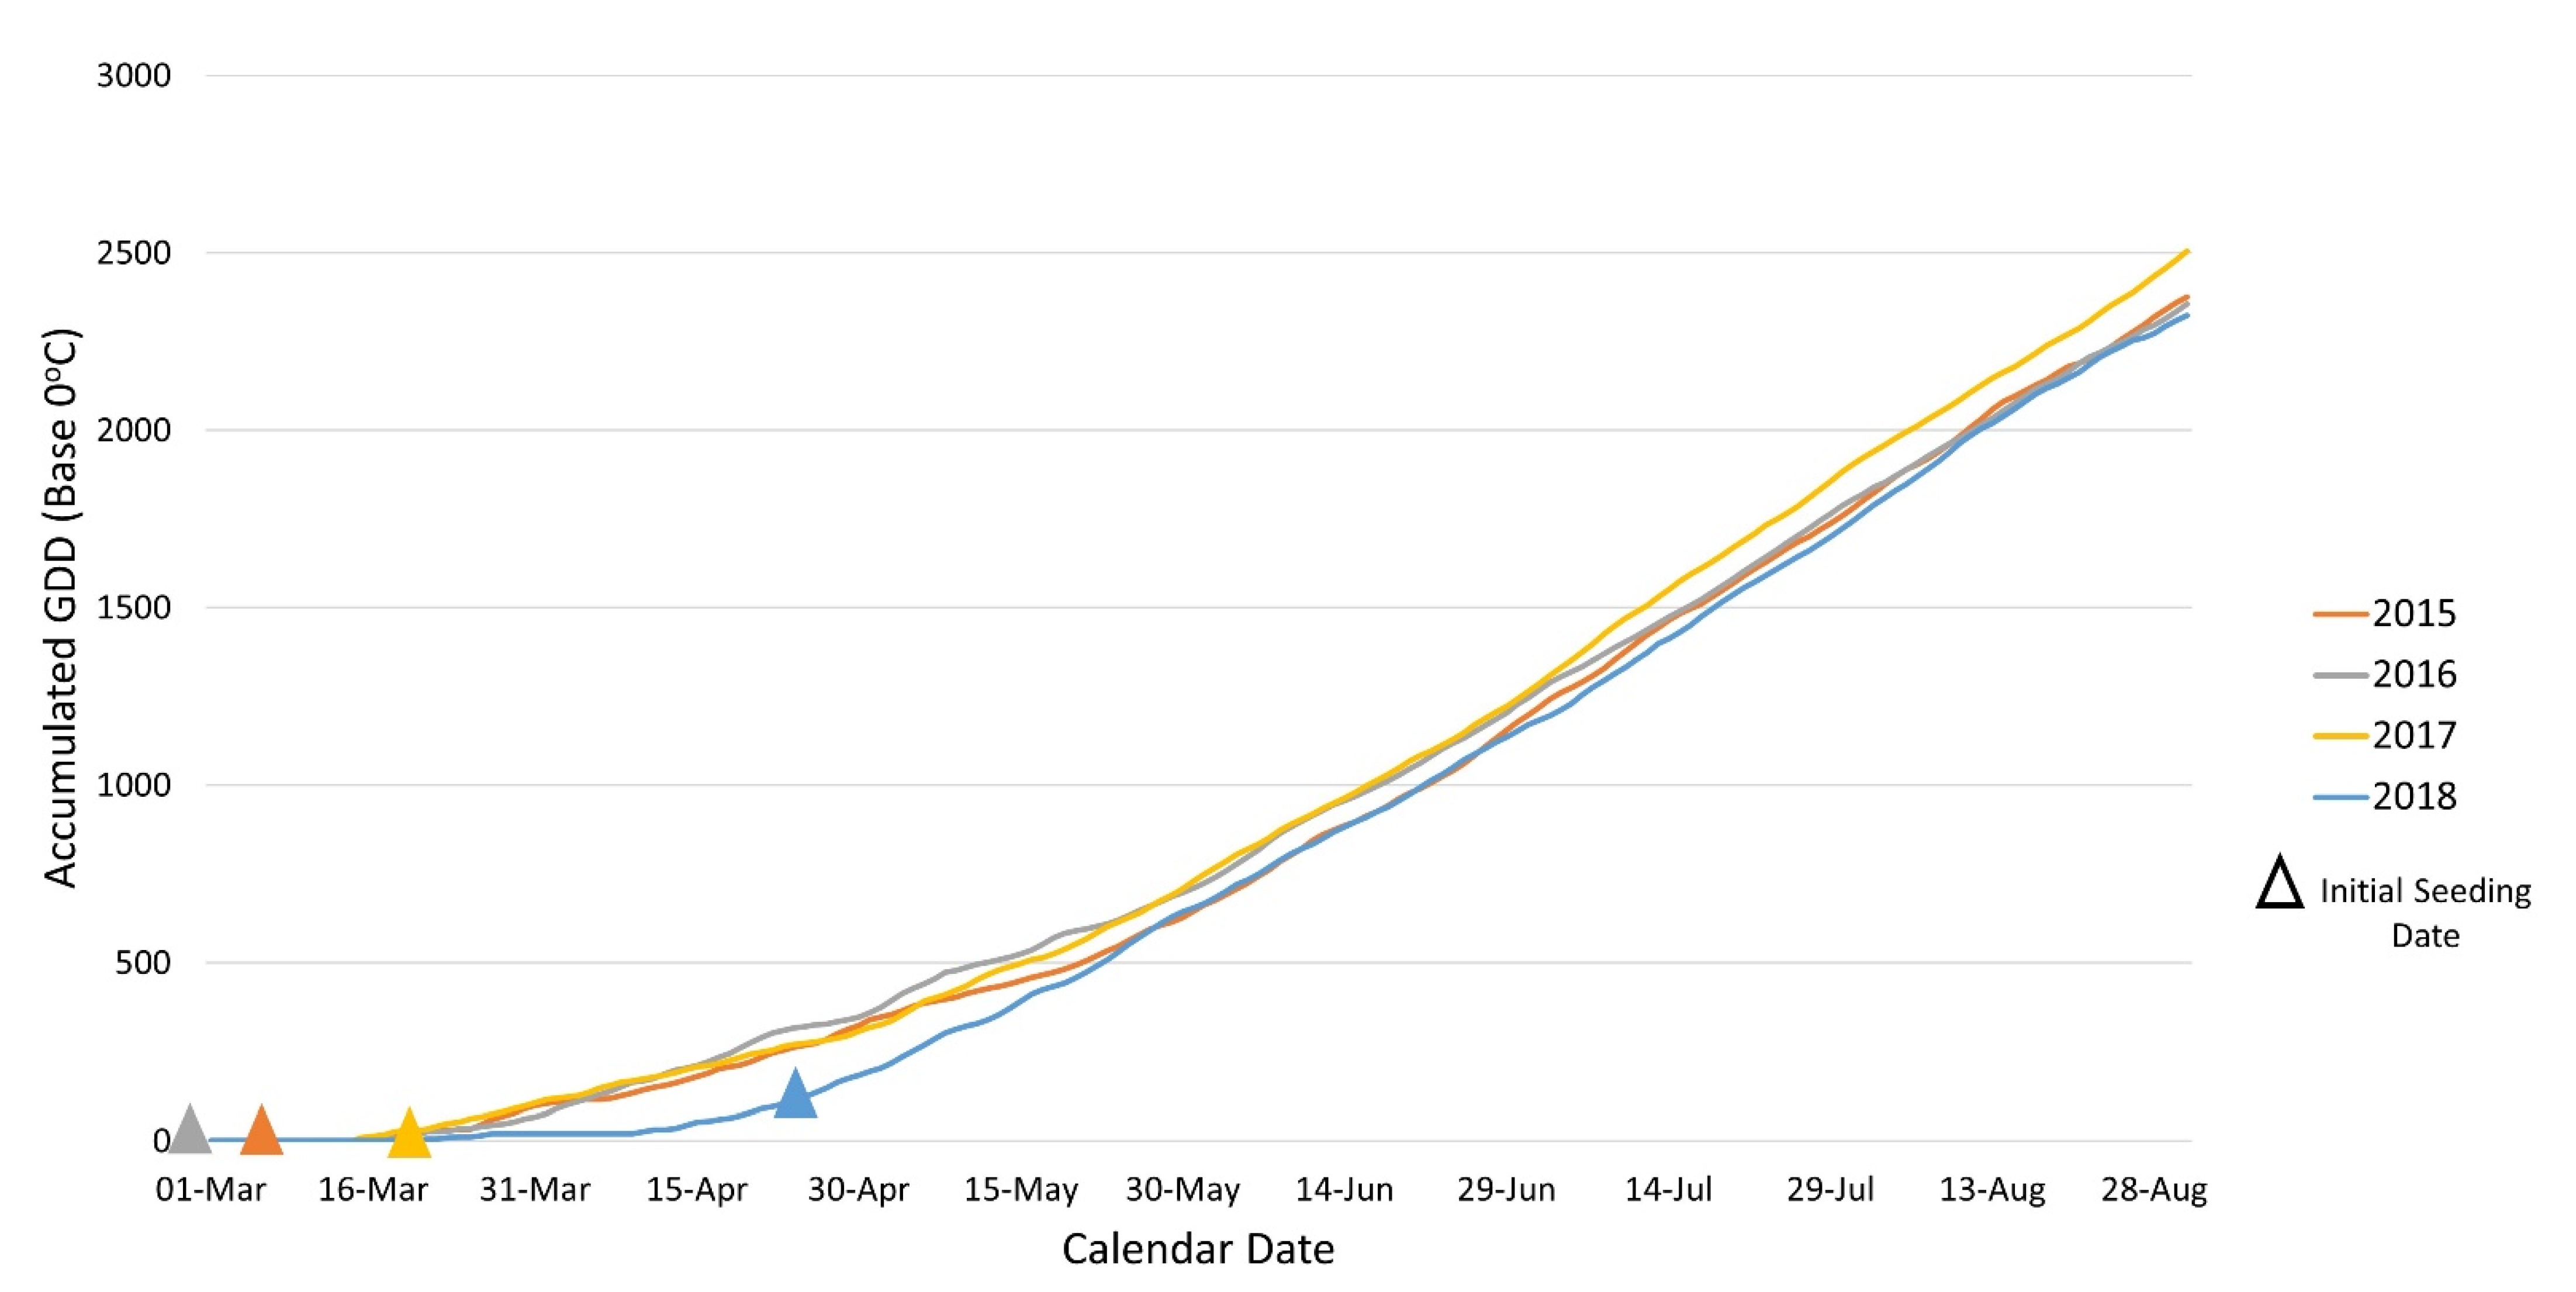
Environmental conditions varied between locations, and years at each location. The earliest planting was in 2016 in Lethbridge, when the initial soil temperature trigger was observed and planting occurred on 16 February. In the same year, the first seeding date at the Dawson Creek location was not until 21 April, a differential of 64 days. This difference in initial seeding date was due to geographic location and variation in weather and winter thaw patterns between sites (Figure 1). The following year the initial planting at Lethbridge was not triggered until 20 March, 32 days later than the year before. The date of initial soil temperature trigger satisfaction and first planting is listed in Table 1 for each location and year. In general, the initial planting date occurred prior to the accumulation of 5% of seasonal GDD B0. GDD B0 accumulation at the Lethbridge, Alberta was zero at initial planting in 2015 and 2016, 1.1% in 2017, and 4.4% in 2018 (Figure 2).
Precipitation events over the course of the study also varied between years and locations. Accumulated precipitation in 2015 was below average at all trial locations. Precipitation in 2016 exceeded the 30-year average for all trial locations except Lethbridge, Alberta which was 11% below the 30-year average. In 2017 and 2018, all sites received below average precipitation (Table 1).
All sites recorded ambient air temperatures below 0° C after seeding, with the exception of Edmonton, Alberta in 2017. Eight of 13 sites recorded air temperatures below −5.0 °C after the initial seeding date; the most severe observations were −10.2 °C at Lethbridge, Alberta in 2016 and −9.8 °C in Scott, Saskatchewan in 2016. Several locations recorded air temperatures below 0 °C for multiple nights after initial planting. Eleven of 13 sites recorded more than ten nights with air temperatures below 0 °C. In 2015 and 2016, Lethbridge, Alberta recorded 37 and 36 nights, respectively, ambient air temperatures below 0 °C after initial planting. In 2016 and 2017, Scott, Saskatchewan recorded 21 and 27 nights, respectively, ambient air temperatures below 0 °C after initial planting (Table 1).

3.2. Grain Yield, Grain Quality and Yield Components

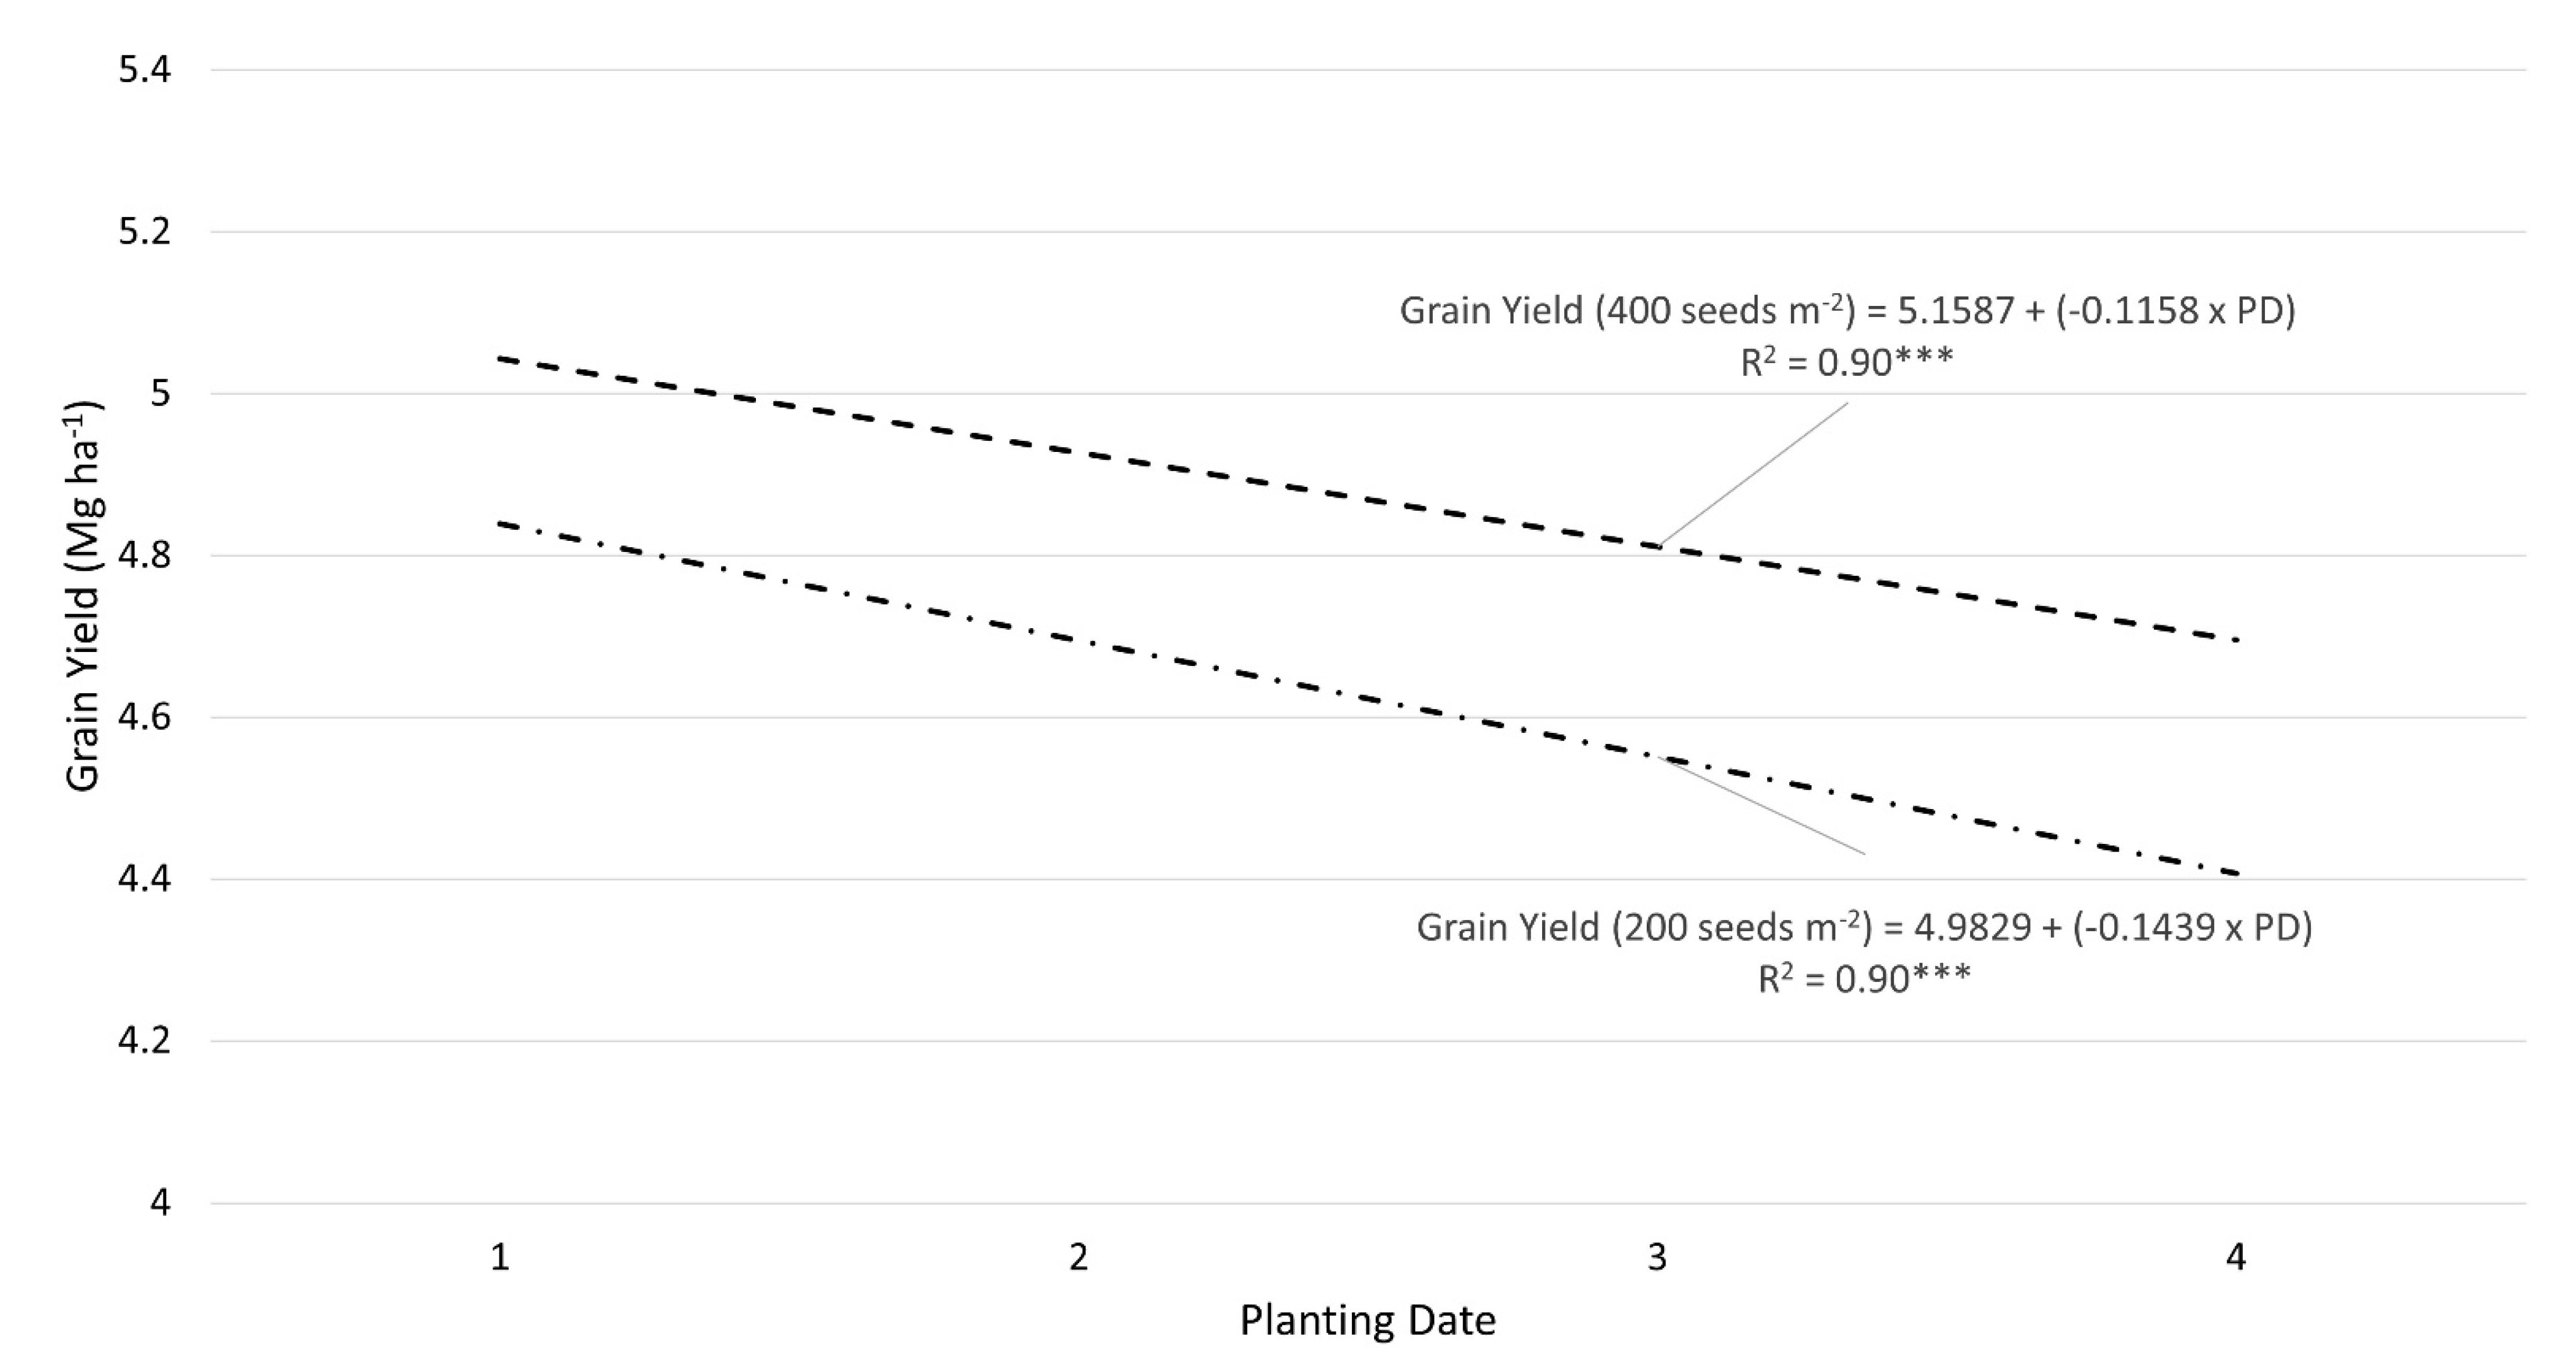
Grain yield was greatest at the earliest planting dates. The latest planting date, corresponding to a soil temperature trigger of 10 °C, resulted in reduced grain yield relative to each of the three earlier planting dates (Table 3). Grain yield from the earliest to the latest seeding date decreased linearly by 0.38 Mg ha−1 (Table 3). The optimum seeding rate of 400 seeds m−2 resulted in greater grain yield than the 200 seeds m−2 seeding rate (Table 3). Grain yield reduction from the earliest to latest seeding date was greater at the sub-optimal seeding rate of 200 seeds m−2 than at the optimal seeding rate of 400 seeds m−2 (Figure 3). The optimum seeding rate resulted in a 0.26 Mg ha−1 greater grain yield than the sub-optimal seeding rate. Seeding depth and wheat line did not significantly affect grain yield.
Delayed planting resulted in a linear increase in grain protein concentration, which corresponded to a concurrent linear decrease in grain yield (Table 3, Figure 3). Similarly, increased seeding rates resulted in reduced grain protein concentration, but greater overall grain yield (Table 3). Grain protein concentration increased by 0.3% from the earliest to latest planting date, and by 0.1% from the optimum to low seeding rates. There was also a minor difference in grain protein concentration between wheat lines, as “LQ1299A” had a 0.1% higher grain protein concentration than “LQ1315A”. Seeding depth did not alter grain protein concentration (Table 3).
Thousand kernel weight and grain test weight were most affected by seeding rate. The optimum seeding rate resulted in a 0.5 kg hL−1 increase in test weight and a corresponding 0.3 g decrease in thousand kernel weight (Table 3). Planting date and seeding depth had no effect on test weight, however, thousand kernel weight increased linearly from the earliest to latest plantings and increased at the deeper seeding depth (Table 3). “LQ1315A” exhibited a greater seed test weight than “LQ1299A”.
Plant height was not affected by any treatment with the exception of wheat line; “LQ1315A” was one cm taller than “LQ1299A”. Initial plant counts were lower for the last two planting dates relative to the second planting date. Plant counts for the first planting date were similar to the other planting dates, and the combination of wheat line “LQ1315A”, the lower planting rate, and the deeper planting depth resulted in lower plant counts. Tillering (heads plant−1) was not affected by planting date or seed depth but did increase with suboptimal sowing density. Conversely, heads m−2 decreased with delayed seeding. The last two planting dates had fewer heads m−2 than the first two planting dates (Table 3). Lower planting rates and deeper planting also led to reduced numbers of heads m−2 (Table 3). The only significant interactions for grain yield, grain quality, and yield component parameters was observed in the wheat line x seeding rate interaction for plant height and heads plant−1. At the higher planting rate “LQ1315A” was slightly shorter and produced relatively fewer heads plant−1 than at the lower planting rate.

3.3. Crop Development

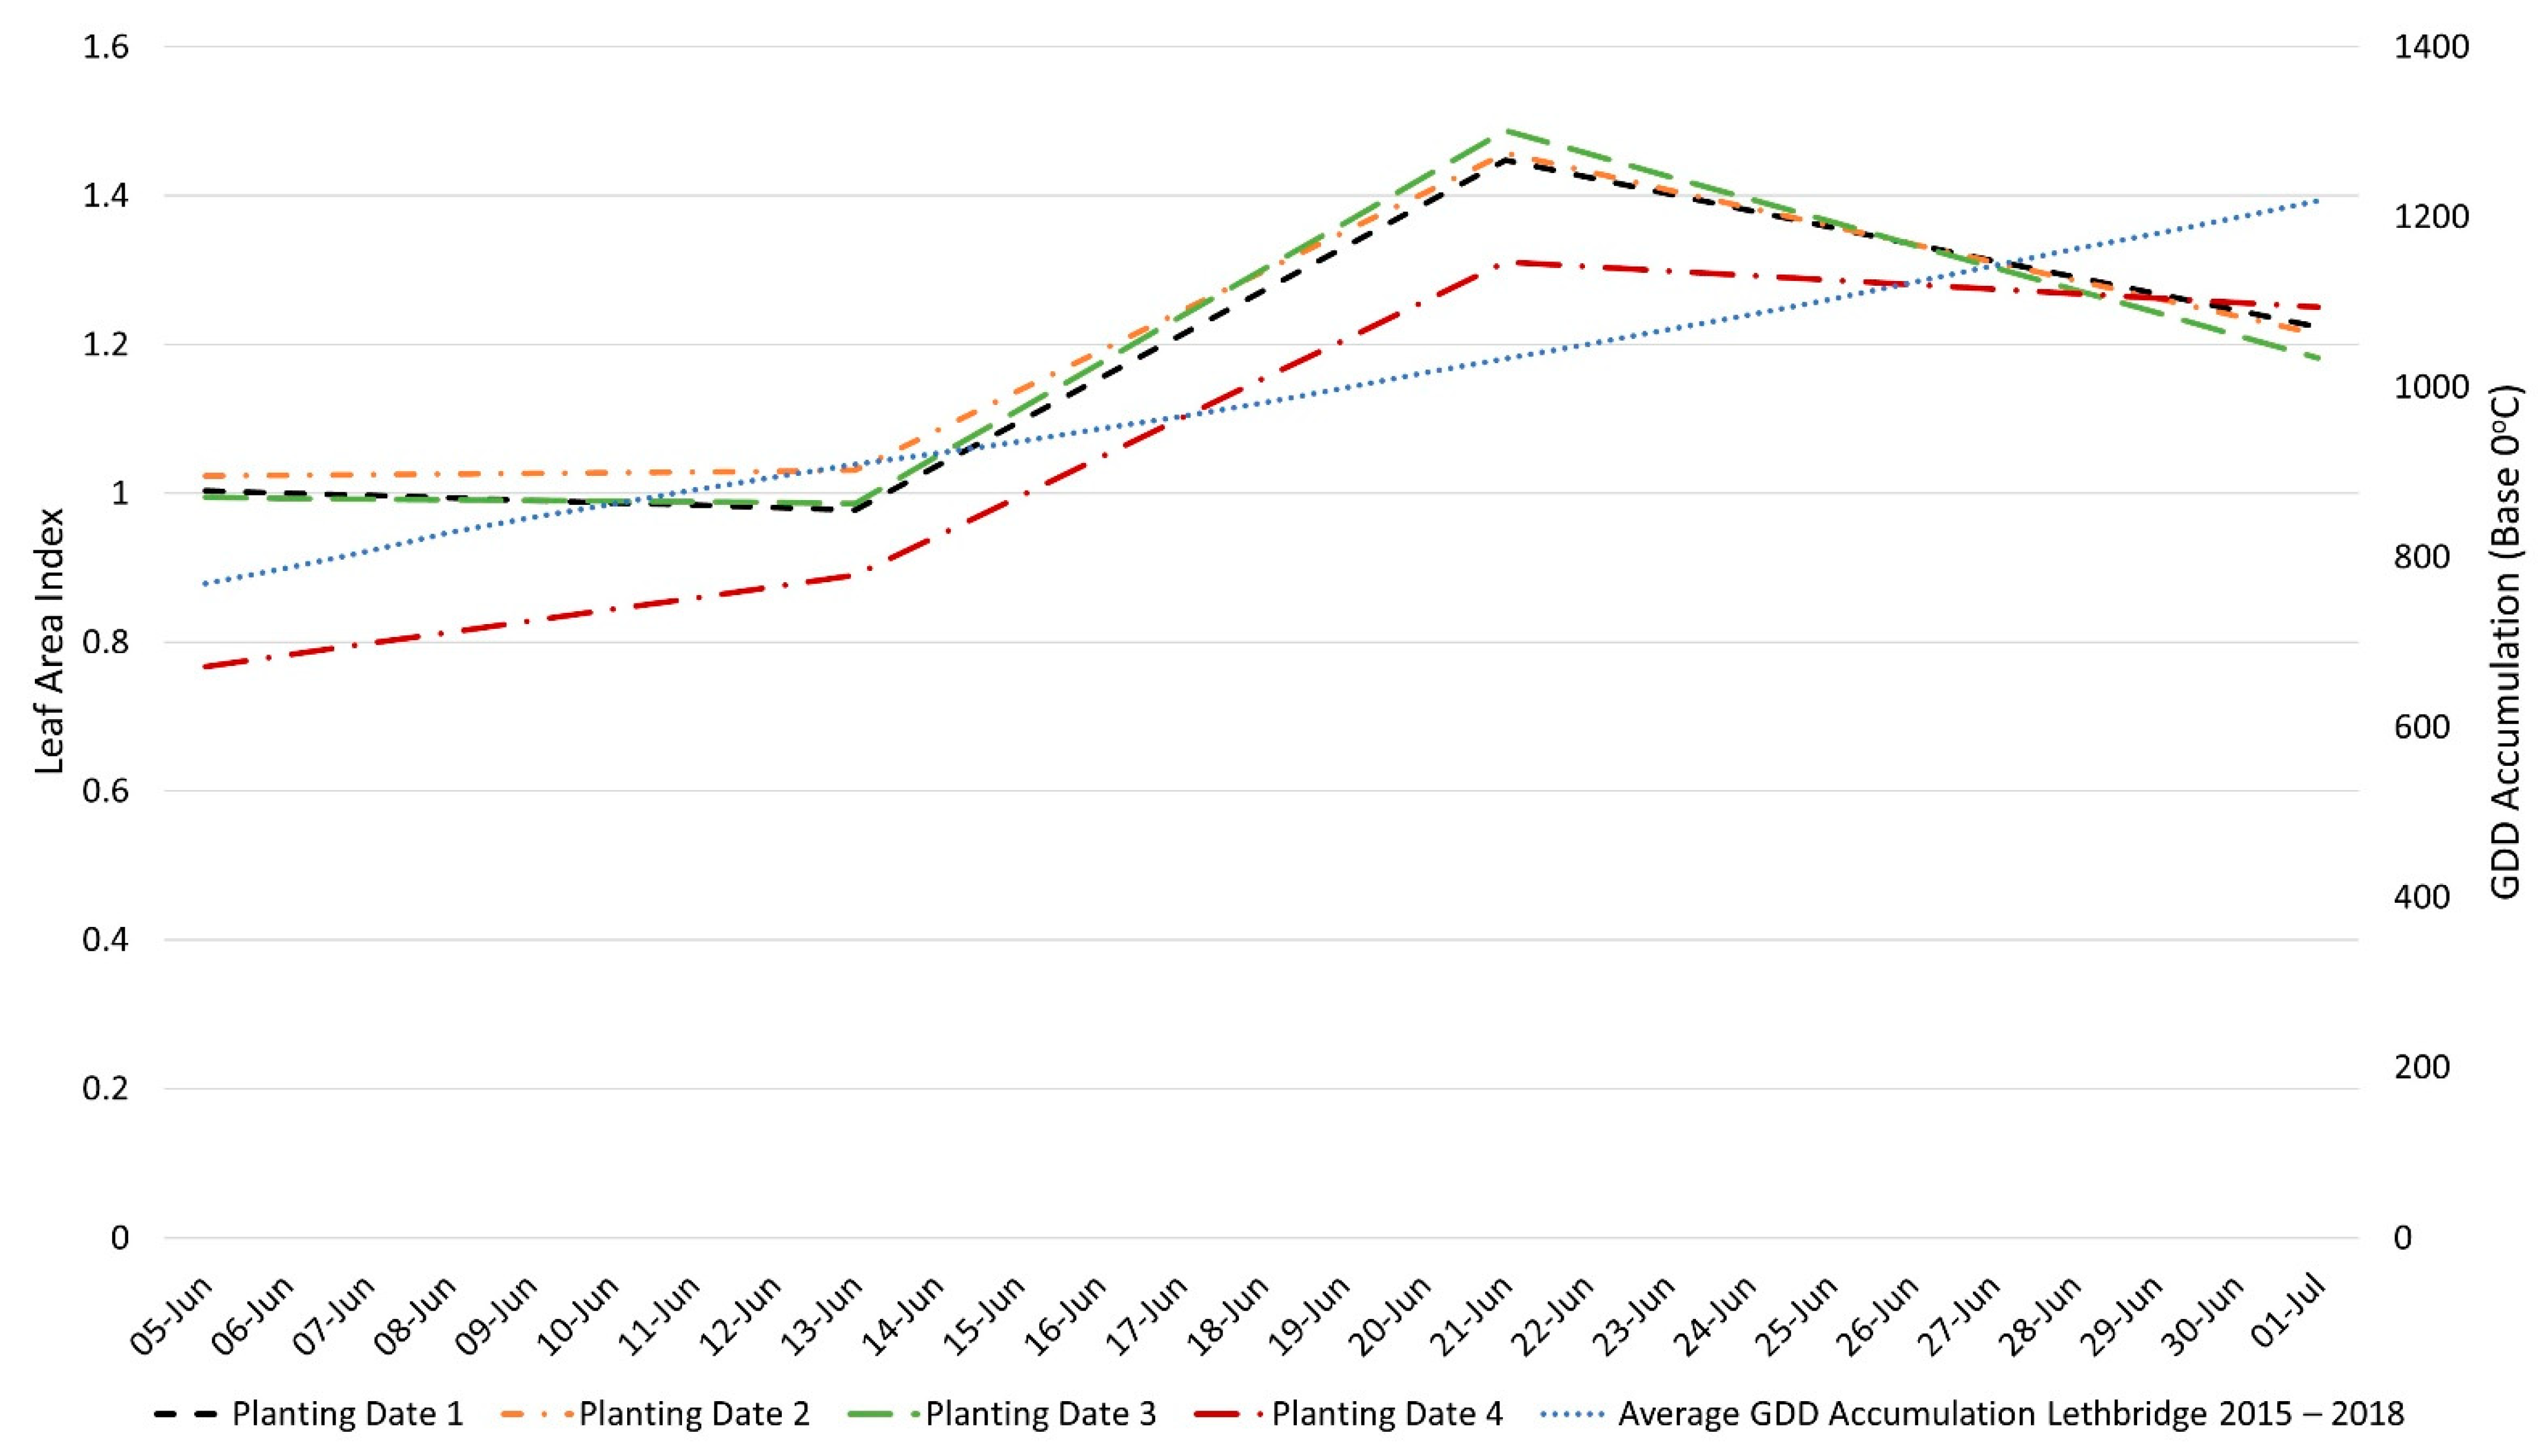
Earlier plantings emerged slowly, which increased the total length of time for these treatments to reach anthesis and to reach maturity. A similar effect was observed by Collier et al. [8] where the earliest plantings into cool soils took longer to emerge. As such, the growth period was broken down into segments from emergence to anthesis, anthesis to maturity and emergence to maturity to remove any confounding impacts of slow emergence on growth period lengths (Table 4). The earliest planting required 124.7 days from planting to reach maturity while the latest planting only required 104.7 days. The 20-day differential is an artifact of the earliest planting requiring 14.0 more days to emerge than the latest planted treatment, and 6.6 days longer to progress from emergence to maturity. The longer interval from emergence to anthesis and from anthesis to maturity for the earlier planted treatments included vegetative growth periods up to three days longer, and grain fill periods up four days longer than the latest planted treatments. Based on the four-year average GDD B0 accumulation at the Lethbridge, Alberta site during the course of this study the extra length of the vegetative and grain-filling periods would allow the utilization of up to an additional 140 GDD B0 for the earliest planting date relative to the latest planting date (Figure 4). In all cases, maturity was reached sequentially based on planting date; however, the time differential to maturation between the earliest and latest planted treatments narrowed to within a day or two.
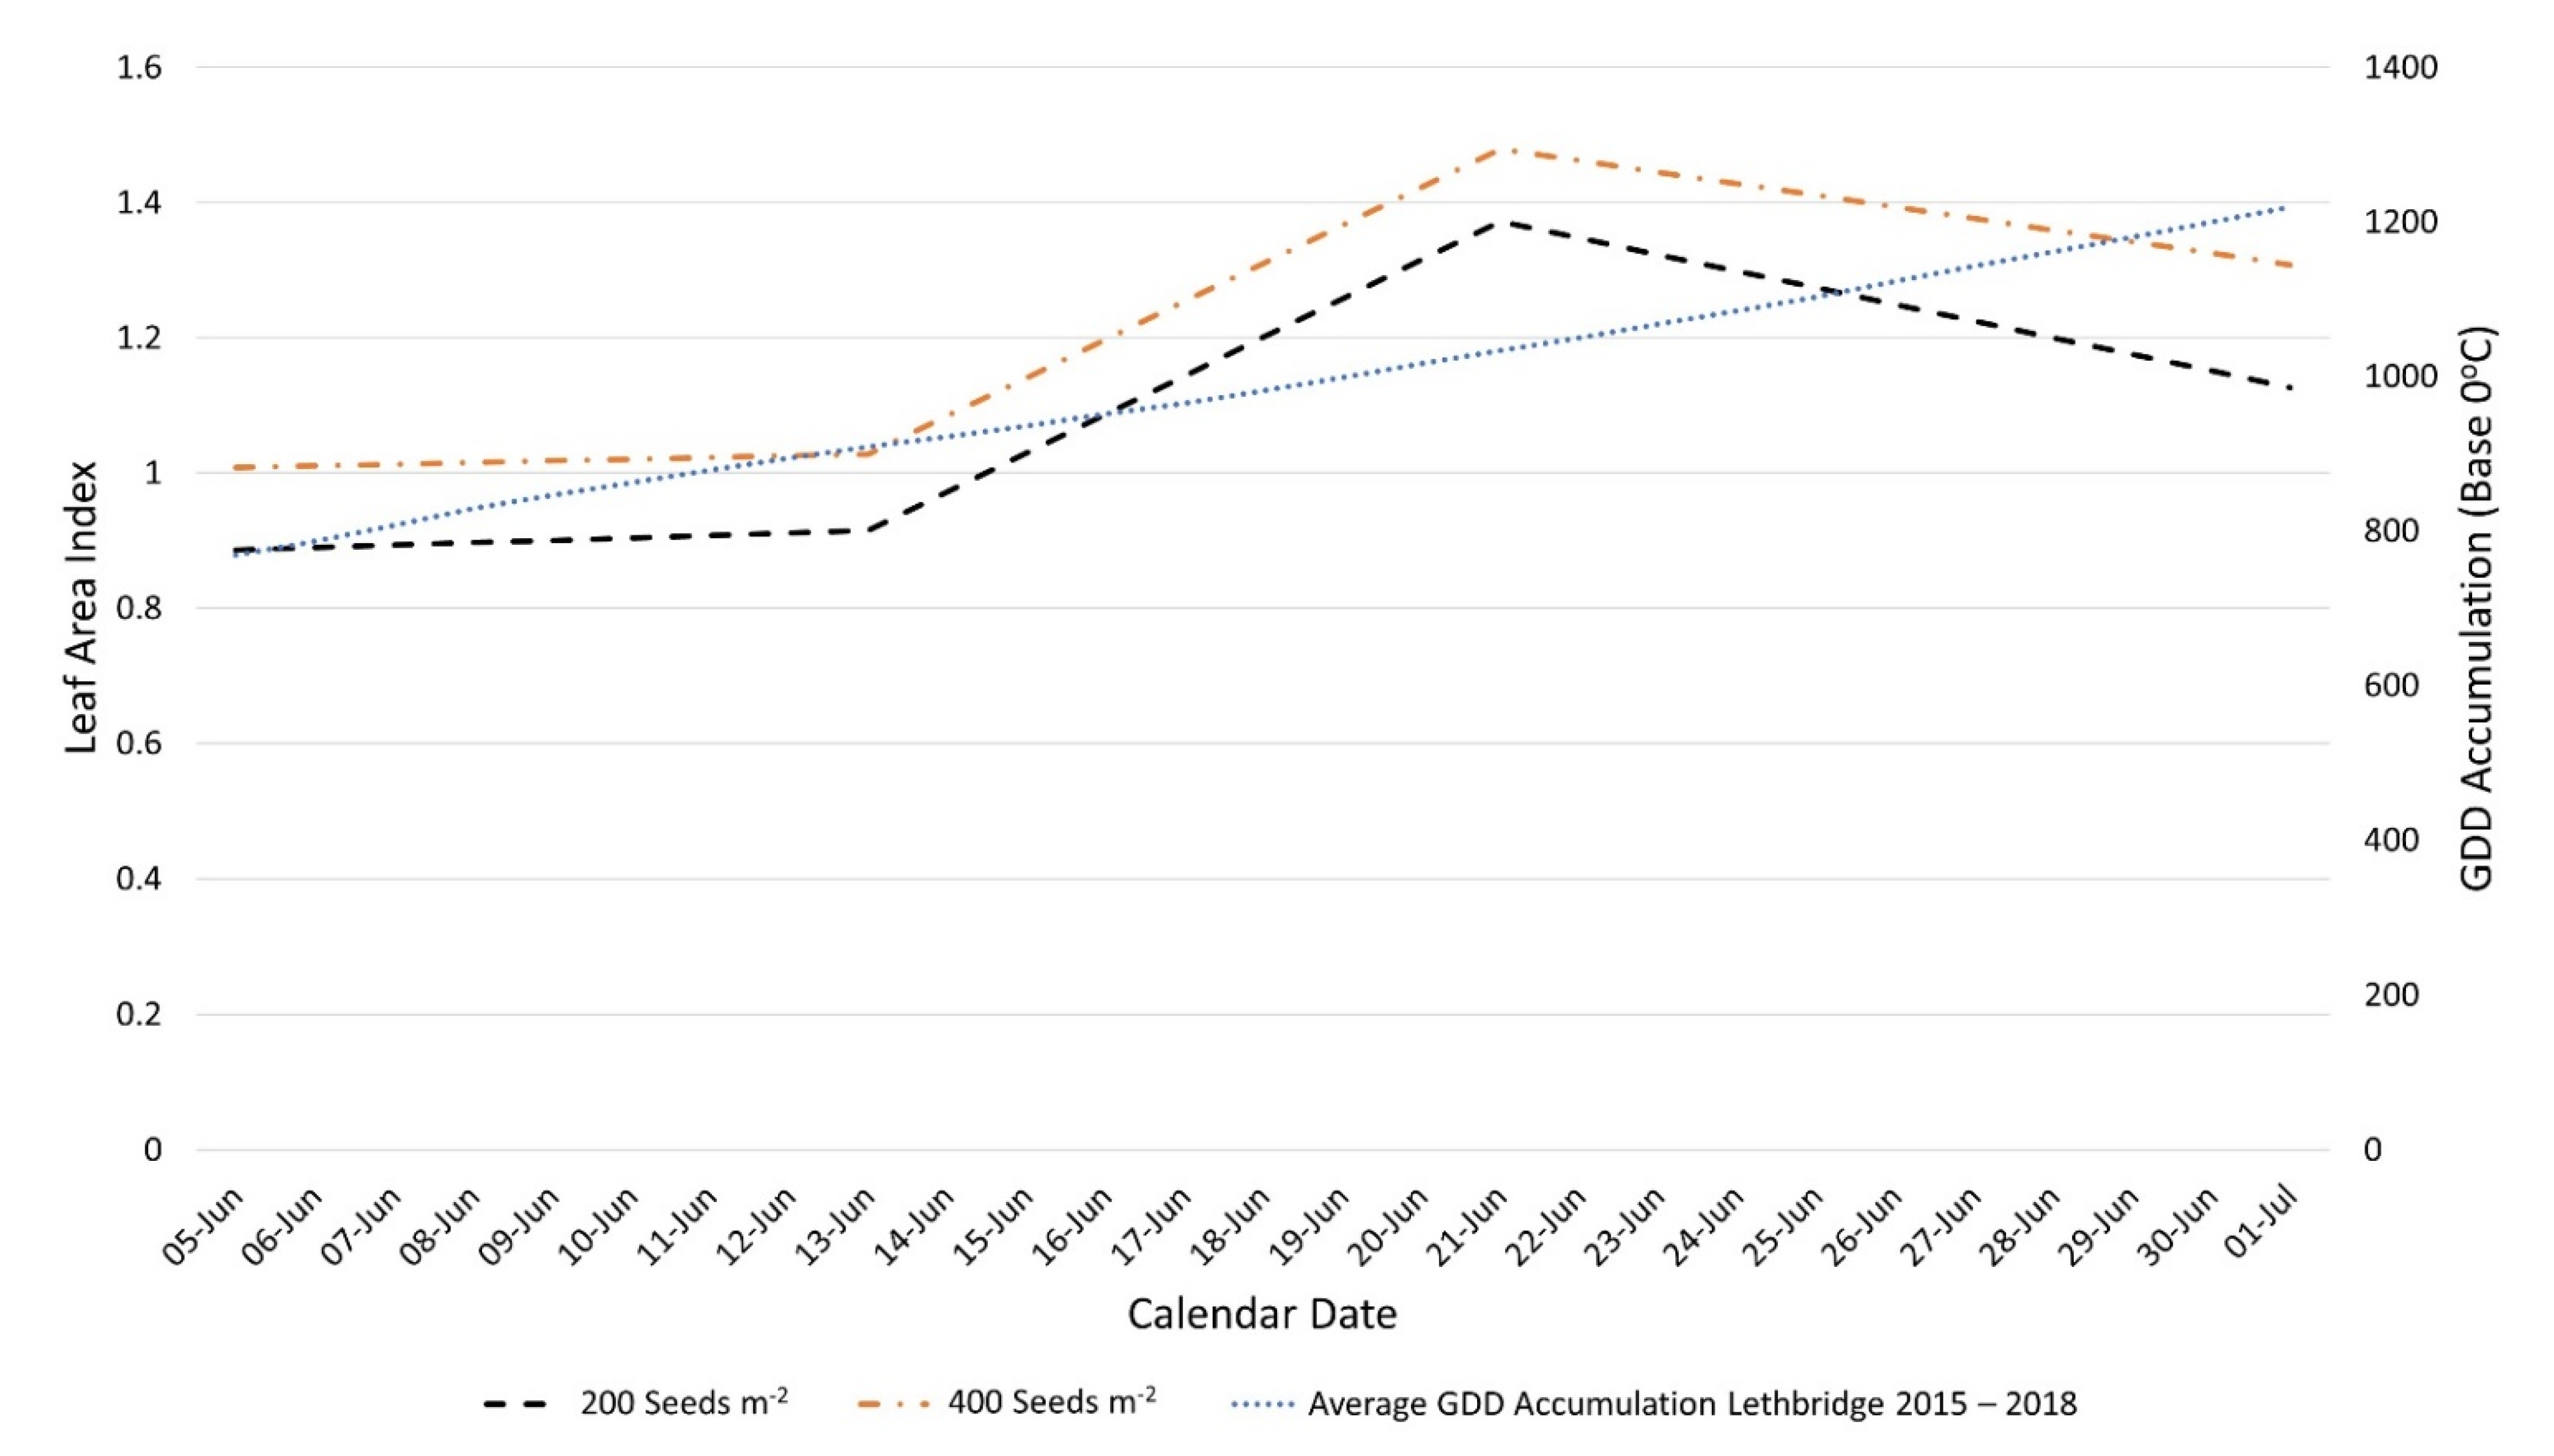
The LAI measurements were initially greater for plantings triggered by 0–2.5 °C, 5 °C, and 7.5 °C soil temperatures than the 10 °C triggered planting (Figure 4). The differential in LAI between planting times decreased and was not significantly different at the second to fourth ratings. Similarly, LAI was greater at the optimum seeding rate for the first two LAI evaluations with no difference at the third and fourth ratings (Figure 5). Thus, prior to the summer solstice on June 21, the treatments seeded at 10 °C soil temperatures and those seeded at the sub-optimal seeding rate were able to achieve LAI values similar to the earlier planting dates and optimal seeding rate treatments; however, 42–45% of the total growing season GDD B0 had already accumulated by this date (Figure 4 and Figure 5).
The optimum seeding rate shortened days to emergence, and subsequent days to maturity were decreased by one day at the optimum seeding rate. A corresponding increase in the length of the emergence to anthesis period and a one day decrease in the length of the anthesis to maturity period at the optimum seeding rates resulted in no significant difference in the emergence to maturity period based on seeding rate. Deeper seeding depths increased days to emergence, anthesis and maturity, but did not have any effect on the length of the growth periods. Similarly, the wheat lines differed in the speed with which they emerged and reached anthesis, but this did not have an effect on the vegetative, reproductive, or total growth periods represented by the emergence to anthesis, anthesis to maturity, and emergence to maturity growth segments.

3.4. Grain Yield Stability

To visualize the stability of an ultra-early wheat seeding system, including optimized agronomics, we employed a version of the Francis and Kannenberg [35] biplot grouping method modified to include aCV values to remove dependence of system stability on grain yield (Figure 6) [36]. All combinations of seeding rate, seeding depth, and planting time are captured by sixteen points on each biplot based on the mean grain yield and aCV for each wheat line across years and replications. Data was categorized into four quadrants: (Group I) high mean grain yield and low variability, (Group II) high mean grain yield and high variability, (Group III) low mean grain yield and high variability, and (Group IV) low mean grain yield and low variability.
The modified Francis and Kannenberg [35] biplots in Figure 6 illustrate all data points associated with the latest planting time (based on a soil temperature planting trigger of 10 °C) are located in Groups III and IV, indicating a low mean grain yield. Group I, which is defined by the greatest grain yield and least variability in grain yield, contains ten points in total (31% of all possible treatment combinations). Of these points, 50% represent the earliest planting date (0–2.5 °C soil temperature trigger), while the second and third planting dates (5 °C and 7.5 °C soil temperature triggers) are represented by 30% and 20% of the data points in Group I, respectively. The optimum seeding rate is represented by 90% of the points in Group I. Both seeding depths are equally represented in Group I; however, the average aCV of data points associated with shallow seeding is lower than the average aCV of treatments associated with deep seeding. There are 12 data points in the least stable groups, Groups II and III (38% of all possible treatment combinations). Of the data points in Groups II and III, 17% are from the latest planting date, 50% from the deep seeding depth, and 67% are from the low seeding rate. The lowest yielding groups, Groups III and IV, contain 14 data points (44% of all possible treatment combinations). Of the data points in Groups III and IV, 57% are from the latest seeding date, 50% from the deep seeding depth, and 71% are from the low seeding rate. The greatest grain yield stability indicated in Figure 6 comes from combinations including the optimum seeding rate, early planting, and to a lesser extent, shallow seeding depth.

4. Discussion

4.1. Soil Temperature Based Planting

The large variation in environmental conditions observed in this study is typical on the northern Great Plains and justifies a management system based on soil temperature to initiate planting rather than one dependent on arbitrary calendar date [8,39]. Shen et al. [39] defined the onset of the growing season in Alberta, Canada as the first day of the year when five consecutive days record an average mean ambient air temperature of 5 °C, and the end of the growing season as the first day in the fall when the mean ambient air temperature is below 5 °C. No long-term trends for the start of the growing season, the length of the growing season, or the end of the growing season in Alberta were identified, though an increase in the frost-free period due to earlier final spring frosts and later first fall frosts from 1901 to 2002 was reported [39]. Thus, producers may generally begin seeding earlier; however, when seeding can safely begin occurs at a different time each year. Using soil temperature triggers to initiate seeding can standardize the start of seeding with environmental conditions from year to year more effectively than relying on an arbitrary calendar date. Soil temperature-based planting can also standardize planting across substantial distances within regions. Sites south of 51° N latitude can often access fields to begin planting earlier than planting is actually initiated, as producers tend to wait for certain calendar dates or a long-term forecast that indicates air temperatures below 0 °C are unlikely. The temperature buffering capacity of soils that have reached 0 °C or higher has shown to provide adequate protection from freezing temperatures for the sowing of spring wheat, thus providing a reliable indicator for safely initiating seeding on the northern Great Plains [8]. Sites on the northern Great Plains north of 51° N latitude tended to take longer to reach soil temperatures of 0 °C. However, once the darker soils north of 51° N latitude reached 0 °C, they tended to warm to 10 °C in fewer days than the lighter brown soils located south of 51° N latitude (Figure 1). Thus, the time elapsed between triggering the first and last planting based on soil temperature was greater at southern trial locations than at northern trial locations. This can be attributed to later snow cover ablation, greater water holding capacity, and greater solar energy absorption by the darker grey wooded luvisols, orthic black chernozems, and orthic dark brown chernozems primarily found north of 51° N latitude compared to the dark brown and brown chernozem soils primarily found south of 51° N latitude (Figure 1) [8,40]. The short window to benefit from ultra-early seeding in the more northern areas of the northern Great Plains region necessitates a simple, low cost, reliable system of confirming when planting can safely begin.

4.2. Grain Yield Response to Ultra-Early Wheat Seeding Systems

Our previous study. [8] compared three cold tolerant wheat lines, including the two wheat lines used in the present study, “LQ1299A”, and “LQ1315A”, to a Canada Western Red Spring (CWRS) wheat variety “Stettler” [41]. That study reported no detrimental grain yield effect of ultra-early seeding and no difference in growing system stability between conventional or cold tolerant wheat genetics in an ultra-early seeding system. Ultra-early seeding may not allow enough time for cold tolerant lines to fully acclimate to cold conditions, thus reducing their potential benefit to the system [42]. The present study builds on the results of Collier et al. [8] by incorporating agronomic management variables into ultra-early seeding systems. Increased grain yield and growing system stability was realized by using optimized agronomics. Combinations of the earliest planting dates, higher planting rate and, to a lesser extent, a shallow planting depth resulted in the greatest grain yield and greatest system stability (Figure 6). The greater grain yield from earlier planting is a result of multiple factors including plant survival equivalent or superior to later planted treatments, combined with an increased number of heads m−2 at the earlier plantings, and longer vegetative growth and grain fill periods. Shifting seeding earlier resulted in plants that were more physiologically advanced earlier in the growing season. The presence of greater leaf area earlier in the growing season for ultra-early seeded treatments and treatments planted at the optimum seeding rate improved their ability to utilize growing degree days accumulated prior to the summer solstice (Figure 4 and Figure 5). At the Lethbridge, Alberta site from 2015–2018, 42–45% of the total growing season GDD B0 accumulated prior to the summer solstice. Earlier seeded plants could more effectively utilize solar radiation during the long daylight hours leading up to the summer solstice, due to increased vegetative and root biomass accumulation and increased transpiration efficiency under the relatively cooler conditions, similar to the results reported by Porker et al. [43]. Additionally, these plants progressed to reproductive growth and grain fill earlier in the season than the later seeded plants, enabling more complete tiller viability and a greater proportion of grain fill to occur in early- and mid-July during days with more daylight hours (Table 4). Earlier initiation of grain fill avoided heat stress and drought which commonly occur in late-July and August on the northern Great Plains [44]. Increased temperatures during grain-filling and, reduced or more sporadic precipitation during the growing season, are identified as main factors in predicted reductions in wheat grain yield on the northern Great Plains by 2050 [10,12,13,14].
Similar avoidance strategies have been studied in the Mediterranean climates of Australia and the United States Pacific Northwest where wheat grain yield is limited due to heat and soil moisture availability [43,45]. Adoption of winter growth habit wheat cultivars and adjusting seeding to earlier dates in both regions was associated with significant grain yield benefit attributed to longer vegetative growth phases, increased root development and depth, increased transpiration efficiency, subsoil moisture availability and avoidance of heat stress at grain fill [45,46]. The implementation of a similar ultra-early seeding system for spring wheat on the northern Great Plains in response to increases in growing season temperature and reductions in growing season precipitation can serve as a mechanism to reduce future yield loss. The results of the present study indicate there is also an immediate benefit to grain yield and growing system stability by moving to an ultra-early seeding system (Figure 6). Earlier seeding can be easily implemented on the northern Great Plains to take advantage of early season soil moisture, increase early season LAI and utilization of GDD accumulated prior to the summer solstice, and avoid late season heat stress. This study indicates planting spring wheat as soon as soil temperatures exceed 0 °C can increase grain yield by as much as 6.8% over wheat planted at 10 °C soil temperatures. The negative linear association we observed between wheat grain yield and planting date suggests a soil temperature increase of 2.5 °C may cause a 0.13 Mg ha−1 decrease in realized grain yield. Moreover, the magnitude of decrease may increase with time as increasing growing season temperatures negatively impact wheat production on the northern Great Plains.
A calendar date of May 1 corresponds to traditional spring wheat planting at Lethbridge, Alberta. Recorded soil temperatures from the ACIS station at the Lethbridge Research and Development Centre, Agriculture and Agri-food Canada on May 1 in 2015, 2016, and 2017 (2018 data not available) were used to generate a three-year average PD value to insert in the linear regression equations for grain yield developed in this study (Figure 3) [29]. By delaying planting to May 1, an average of 14.1% of the total GDD B0 accumulation for the growing season would have elapsed prior to planting, accounting for 339 GDD B0. Grain yield from a planting date of May 1 at a planting rate of 200 seeds m−2 is predicted to be 4.20 Mg ha−1, a decrease of 0.63 Mg ha−1, or 15%, relative to the grain yield expected from planting at 0–2.5 °C at 200 seeds m−2. At a planting rate of 400 seeds m−2 and planting date of May 1, the predicted grain yield is 4.53 Mg ha−1, a decrease of 0.51 Mg ha−1, or 11%, relative to the grain yield expected from planting at 0–2.5 °C and 400 seeds m−2. Using an average wheat grain value of $246.00 Mg−1 (September 2015 to December 2019 average southern Alberta price for CWRS wheat, 13.5% protein content) [47] seeding ultra-early at 0–2.5 °C soil temperatures and planting at the optimum seeding rate of 400 seeds m−2 would result in a gross economic benefit to the grower of $206.64 ha−1 relative to delaying seeding to May 1 and using a lower planting density of 200 seeds m−2. Current crop insurance standards in western Canada dictate that field crops must be planted by a set date to be viable and thus, be compensable in the event of crop failure. This date sets a de facto limit on how late into the growing season crops can be sown successfully. This study reports a significant yield penalty for delayed planting of wheat; in addition to providing increased yield and economic benefit to the grower, an ultra-early wheat growing system provides a basis for insurance providers to incentivize earlier planting.

4.3. Agronomic Management of Ultra-Early Wheat Seeding Systems

A modern and innovative cropping system is composed of interwoven G × E × M interactions where G is genotype, E is environment and M is crop management [3]. In the hypothesized ultra-early wheat seeding system, the requirement for a specific cold tolerant genotype was not apparent in the Collier et al. [8] study. Thus, in its current state, ultra-early wheat systems tend to be optimized through management factors. This is not to say genetics be overlooked, but the reality is that wheat lines selected and bred in the northern latitudes of North America likely evolved by expressing tolerance to abiotic pressure related to cold soils (E). Improvements over conventional genetics may be needed if planting spring wheat in late-fall or early-winter was adopted as opposed to late-winter or early-spring planting, which would necessitate the consideration for a “flex wheat” that would possess traits tailored to an ultra-early seeding system.
Crop management strategies for reducing the impact of environment on ultra-early wheat seeding systems should reduce abiotic and/or biotic stresses and increase grain yield and growing system stability, thereby moving the growing system closer to achieving potential yield [48]. A systems-based approach focused on managing G × E × M interactions has been shown to improve grain yield and resiliency. Kirkegaard and Hunt [49] implemented a systems-based management approach accounting for wheat genetics, agronomic management and environmental variation in a wheat cropping system and demonstrated the ability to increase growing system stability and yield potential by three times. In this approach, the total yield benefit was greater than the sum of the individual components indicating a synergistic effect of successful G × E × M management. Growing systems designed to capitalize on G × E ×M interactions can maintain current yield potential in the presence of adverse environmental effects, and result in increased grain yield and increased growing system sustainability providing an avenue for future intensification [50,51,52]. In the proposed management of ultra-early wheat growing systems, the use of high performing spring wheat cultivars already available to growers combined with optimal seeding rates and shallow seeding depths further enhance grain yield and stability of yield over time. These enhancements are derived from system exploitation that leads to greater plant stands, increased crop uniformity from reduced tillering and more main stems across the field, capture of early-season GDD accumulation and extended vegetative and grain-fill periods [50]. Additional management strategies to limit negative effects of abiotic stress early in the growing season can be stacked onto these components. For example, previous studies have reported on the beneficial effects of fungicidal and dual fungicidal/insecticidal seed treatments to reduce abiotic stress, disease and insect pressure, and increase plant stand and grain yield in cereals [53,54,55]. This study included a fungicidal seed treatment to reduce seed and soil borne diseases as confounding effects. Cold wet soils at planting, extended periods from planting to emergence, and observed reduced emergence from deeper seeded treatments suggest effective seed treatments should be considered an integral part of abiotic and biotic stress management for optimized ultra-early wheat seeding systems.
Optimizing the planting rate increased grain yield and grain yield stability in ultra-early seeding. The optimum planting rate used in this study (400 seeds m−2) increased grain yield by 5.5% over the lower planting rate, and was the variable most strongly tied to increased system stability (Table 3, Figure 6). The optimum planting rate increased the number of plants and leaf area per unit area despite having a greater mortality than the low planting rate treatments. The ability to withstand mortality and maintain a suitable plant stand is an important yield stabilizing characteristic of using optimum planting rates in an ultra-early wheat seeding system. Increased grain yield from both the optimum planting rate and earlier planting resulted in minor decreases in grain protein concentration, however, the increase in grain yield resulted in greater total protein production per unit area.
Reduced survival for plants seeded at a 5 cm depth compared to those seeded at 2.5 cm was indicated by a significant decrease in initial plant counts and heads m−2 (Table 3). This may be attributed to a combination of delayed emergence and reduced vigor, resulting from stressful growing conditions and extensive use of seed carbohydrate reserves. Semi-dwarf hexaploid wheats such as “LQ1299A” and “LQ1315A” tend to have reduced coleoptile length relative to conventional height wheats [56,57]. Reduced coleoptile length, combined with reduced vigor at emergence due to deeper seeding, may account for reduced plant survival. While no grain yield penalty was observed for planting at a 5 cm depth, the reduction in plant stand and minor observed increase in aCV at 5 cm depth versus 2.5 cm depth indicate overall yield potential may be negatively impacted by deep seeding. This impact may be more prominent when abiotic or biotic stresses result in increased mortality during the growing season. This recommendation differs from that of Cann et al. [45] primarily due to the availability of soil moisture after spring snow melt on the northern Great Plains.

4.4. Producer Level Implementation

Producer implementation of ultra-early wheat seeding on the northern Great Plains requires relatively minor adjustments to current management practices. Collier et al. [8] reported maximum wheat grain yield was realized when planting occurred prior to soils reaching 3.9 °C. The results of the present study corroborate this conclusion and indicate the ideal seeding window is between soil temperatures of 0 and 7.5 °C. Producers in the southern region of the northern Great Plains have the opportunity to adopt ultra-early seeding across larger regions as slower warming of the soil and less snow cover allow more area to be sown prior to reaching 7.5 °C soil temperatures. In the northern areas of the northern Great Plains producers may have to select fields based on drainage and accessibility in the early spring in order to successfully implement ultra-early seeding where it is best suited to their farm. Significant management and equipment adjustments are not required; however, consideration may be given to equipment that limits compaction, residual herbicide systems that can be applied in the fall as ultra-early seeding will preclude a spring pre-seed herbicide application, and fertilizer applications in the fall that can reduce downtime during spring planting. Producers should use optimum seeding rates of not less than 400 seeds m−2, and higher if seed quality is sub-optimal or variety specific optimum seeding rate data is available. A shallow seeding depth of 2.5 cm decreased time to emergence and increased plant stand. Combined with ample spring moisture at ultra-early seeding times, shallow seeding can help maintain growing system stability.

5. Conclusions

Wheat grain yield and growing system stability can be increased by moving wheat planting earlier in the year on the northern Great Plains. Ideal planting time can be determined using a soil temperature trigger-based seeding system, and seeding can begin as soon as is feasible after 0 °C soil temperatures are reached. Ultra-early wheat seeding systems can be optimized by using seeding rates of 400 seeds m−2 or higher, which increases grain yield and decreases grain yield variability, thus increasing overall growing system stability. Seeding depth did not have a direct effect on grain yield, however shallow seeding resulted in increased plant populations and maintained growing system stability. A delay in wheat plantings i.e., soil temperatures ≥7.5 °C to 10 °C will introduce greater yield instability and inferior yield attainment well below potential. For example, through the duration of this study, if planting wheat on May 1 in Lethbridge, Alberta when the average soil temperature was 13.6 °C as opposed to planting based on a soil temperature trigger of 0–2.5 °C, a grower would experience an annual loss in gross revenue of approximately $206 ha−1.
Future adoption of ultra-early seeding may be necessary due to climate driven increases in average growing season temperature and either decreases in, or changes to, precipitation patterns. Similar environmental factors constraining grain yield are currently faced in Australia and the United States Pacific Northwest where similar early-sowing approaches are being evaluated to improve G × E × M synergies. Future work in western Canada will evaluate weed management and fertility programs for ultra-early wheat seeding systems, as well as evaluate multiple classes of conventional western Canadian wheat and durum wheat for adaptation to ultra-early seeding systems.

Author Contributions

G.R.S.C., Senior Author. Used project for partial fulfilment of PhD thesis requirements at the University of Alberta. Analyzed data and prepared manuscript. Participated in meetings and presented findings at conferences, field days and grower meetings. B.L.B., Principal Investigator/Corresponding Author. Developed and conceptualized the hypotheses and field experiments. Identified and recruited Collaborators, PhD student, and led workshops to finalize proposal. Participated in meetings and presented findings at conferences, field days and grower meetings. Developed budget for all activities and co-supervises G.R.S.C., R.J.G., Co-Investigator. Developed cold-tolerant lines used for field experiments. Reviewed and edited manuscript. D.M.S., Co-Investigator responsible for the field experimentation at the Edmonton sites. Co-Supervisor of G.R.S.C. Reviewed and edited manuscript and mentored manuscript preparation and statistical analyses. All authors have read and agreed to the published version of the manuscript.

Funding

Funding for this study was provided by the Agricultural Funding Consortium with funds provided by the Alberta Wheat Commission, the Western Grains Research Foundation and Alberta Innovates BioSolutions, grant number 2014F172R.

Institutional Review Board Statement

Not applicable.

Informed Consent Statement

Not applicable.

Data Availability Statement

The data are not currently stored in a public repository; however, the data may be made available upon a request to the corresponding author.

Acknowledgments

The authors wish to acknowledge the staff at Agriculture and Agri-Food Canada at Lethbridge (Ryan Dyck, Steve Simmill, Warren Taylor, Daniell Seltenrich, Adam Fast, and Kaitlyn Van Staalduine); Agriculture and Agri-Food Canada at Scott (Cindy Gampe and Arlen Kapiniak); the staff at the University of Alberta (Klaus Strenzke, Muhammad Iqbal, Fabiana Dias, Joseph Moss, Tom Keady, Katherine Chabot, and Russell Puk); the British Columbia Grain Producers Association; and many supporters at each trial location. Thanks to Craig Stevenson, and Rong-Cai Yang for statistical analyses support and Erin Collier for manuscript editing.

Conflicts of Interest

The authors declare no conflict of interest.

Abbreviations

ACIS, Alberta Climate Information System; aCV, Adjusted Coefficient of Variation; CV, Coefficient of Variation; CWRS, Canada Western Red Spring; CWRW, Canada Western Red Winter; CWSP, Canada Western Special Purpose; DNS, Dark Northern Spring; LAI, Leaf Area Index; PD, Planting Date; SD, Seeding Depth; SED, Standard Error of the Difference; SR, Seeding Rate; WL, Wheat Line.

References

  1. FAOSTAT. Food and Agricultural Organization Statistical Databases; FAO: Rome, Italy, 2020; Available online: http://www.fao.org/faostat/en/#data (accessed on 2 May 2020).
  2. Statistics Canada 2020. Table 32-10-0359-01 Estimated areas, yield, production, average farm price and total farm value of principal field crops, in metric and imperial units. Available online: https://www150.statcan.gc.ca/t1/tbl1/en/tv.action?pid=3210035901 (accessed on 2 May 2020).
  3. Beres, B.L.; Hatfield, J.L.; Kirkegaard, J.A.; Eigenbrode, S.D.; Pan, W.L.; Lollato, R.P.; Hunt, J.R.; Strydhorst, S.; Porker, K.; Lyon, D.; et al. Toward a better understanding of genotype × environment × management interactions—A global wheat initiative agronomic research strategy. Front. Plant Sci. 2020, 11, 828. [Google Scholar] [CrossRef] [PubMed]
  4. Drury, C.F.; Reynolds, W.; Tan, C.S.; McLaughlin, N.B.; Yang, X.M.; Calder, W.; Oloya, T.O.; Yang, J.Y. Impacts of 49–51 years of fertilization and crop rotation on growing season nitrous oxide emissions, nitrogen uptake and corn yields. Can. J. Soil Sci. 2014, 94, 421–433. [Google Scholar] [CrossRef] [Green Version]
  5. He, W.; Yang, J.Y.; Qian, B.; Drury, C.F.; Hoogenboom, G.; He, P.; Lapen, D.; Zhou, W. Climate change impacts on crop yield, soil water balance and nitrate leaching in the semiarid and humid regions of Canada. PLoS ONE 2018, 13, e0207370. [Google Scholar] [CrossRef] [PubMed]
  6. Iqbal, M.; Moakhar, N.P.; Strenzke, K.; Haile, T.; Pozniak, C.; Hucl, P.; Spaner, D. Genetic improvement in grain yield and other traits of wheat grown in western Canada. Crop. Sci. 2016, 56, 613–624. [Google Scholar] [CrossRef]
  7. Thomas, J.B.; Graf, R. Rates of yield gain of hard red spring wheat in western Canada. Can. J. Plant Sci. 2014, 94, 1–13. [Google Scholar] [CrossRef]
  8. Collier, G.R.S.; Spaner, D.M.; Graf, R.J.; Beres, B.L. The integration of spring and winter wheat genetics with agronomy for ultra-early planting into cold soils. Front. Plant Sci. 2020, 11, 89. [Google Scholar] [CrossRef] [Green Version]
  9. Iqbal, M.; Navabi, A.; Salmon, D.F.; Yang, R.-C.; Spaner, D. Simultaneous selection for early maturity, increased grain yield and elevated grain protein content in spring wheat. Plant Breed. 2007, 126, 244–250. [Google Scholar] [CrossRef]
  10. Lanning, S.P.; Kephart, K.; Carlson, G.R.; Eckhoff, J.E.; Stougaard, R.N.; Wichman, D.M.; Martin, J.M.; Talbert, L.E. Climatic change and agronomic performance of hard red spring wheat from 1950 to 2007. Crop. Sci. 2010, 50, 835–841. [Google Scholar] [CrossRef]
  11. Cutforth, H.; O’Brien, E.; Tuchelt, J.; Rickwood, R. Long-term changes in the frost-free season on the Canadian prairies. Can. J. Plant Sci. 2004, 84, 1085–1091. [Google Scholar] [CrossRef]
  12. Asseng, S.; Martre, P.; Maiorano, A.; Rötter, R.P.; O’Leary, G.J.; Fitzgerald, G.; Girousse, C.; Motzo, R.; Giunta, F.; Babar, M.A.; et al. Climate change impact and adaptation for wheat protein. Glob. Chang. Biol. 2019, 25, 155–173. [Google Scholar] [CrossRef] [Green Version]
  13. Asseng, S.; Jamieson, P.; Kimball, B.; Pinter, P.; Sayre, K.; Bowden, J.; Howden, M. Simulated wheat growth affected by rising temperature, increased water deficit and elevated atmospheric CO2. Field Crop. Res. 2004, 85, 85–102. [Google Scholar] [CrossRef]
  14. He, Y.; Wang, H.; Qian, B.; McConkey, B.; Depauw, R. How early can the seeding dates of spring wheat be under current and future climate in Saskatchewan, Canada? PLoS ONE 2012, 7, e45153. [Google Scholar] [CrossRef] [PubMed] [Green Version]
  15. Briggs, K.G.; Ayten-Fisu, A. The effects of seeding rate, seeding date and location on grain yield, maturity, protein percentage and protein yield of some spring wheats in central Alberta. Can. J. Plant Sci. 1979, 59, 1139–1145. [Google Scholar] [CrossRef]
  16. Lanning, S.P.; Hucl, P.; Pumphrey, M.; Carter, A.H.; Lamb, P.F.; Carlson, G.R.; Wichman, D.M.; Kephart, K.D.; Spaner, D.; Martin, J.M.; et al. Agronomic performance of spring wheat as related to planting date and photoperiod response. Crop. Sci. 2012, 52, 1633–1639. [Google Scholar] [CrossRef]
  17. Larter, E.N.; Kaltsikes, P.J.; McGinnis, R.C. Effect of date and rate of seeding on the performance of triticale in comparison to wheat 1. Crop. Sci. 1971, 11, 593–595. [Google Scholar] [CrossRef]
  18. McKenzie, R.H.; Middleton, A.B.; Dunn, R.; Sadasivaiah, R.S.; Beres, B.; Bremer, E. Response of irrigated soft white spring wheat to seeding date, seeding rate and fertilization. Can. J. Plant Sci. 2008, 88, 291–298. [Google Scholar] [CrossRef]
  19. McKenzie, R.H.; Bremer, E.; Middleton, A.B.; Pfiffner, P.G.; Woods, S.A. Optimum seeding date and rate for irrigated cereal and oilseed crops in southern Alberta. Can. J. Plant Sci. 2011, 91, 293–303. [Google Scholar] [CrossRef]
  20. Kouadio, A.L.; Newlands, N.; Potgieter, A.; McLean, G.; Hill, H. Exploring the potential impacts of climate variability on spring wheat yield with the APSIM decision support tool. Agric. Sci. 2015, 6, 686–698. [Google Scholar] [CrossRef] [Green Version]
  21. Qian, B.; Zhang, X.; Smith, W.; Grant, B.; Jing, Q.; Cannon, A.J.; Neilsen, D.; McConkey, B.; Li, G.; Bonsal, B.; et al. Climate change impacts on Canadian yields of spring wheat, canola and maize for global warming levels of 1.5 °C, 2.0 °C, 2.5 °C and 3.0 °C. Environ. Res. Lett. 2019, 14, 074005. [Google Scholar] [CrossRef]
  22. Hunt, J.R.; Hayman, P.T.; Richards, R.A.; Passioura, J.B. Opportunities to reduce heat damage in rain-fed wheat crops based on plant breeding and agronomic management. Field Crop. Res. 2018, 224, 126–138. [Google Scholar] [CrossRef]
  23. Kirkegaard, J.; Lilley, J.M.; Hunt, J.R.; Sprague, S.J.; Ytting, N.K.; Rasmussen, I.S.; Graham, J.M. Effect of defoliation by grazing or shoot removal on the root growth of field-grown wheat (Triticum aestivum L.). Crop. Pasture Sci. 2015, 66, 249–259. [Google Scholar] [CrossRef]
  24. Grant, M.N. Registration of Norstar wheat 1 (Reg. No. 626). Crop. Sci. 1980, 20, 552. [Google Scholar] [CrossRef]
  25. Larsen, R.J.A. Winter-hardy spring wheat breeding: Analysis of winter x spring wheat germplasm and the development of selection tools. 2012. Available online: http://atrium.lib.uoguelph.ca/xmlui/handle/10214/3975 (accessed on 4 May 2020).
  26. Shaner, D.L. (Ed.) Herbicide Handbook, 10th ed.; Weed Science Society of America: Lawrence, KS, USA, 2014. [Google Scholar]
  27. Gower, S.T.; Kucharik, C.J.; Norman, J.M. Direct and indirect estimation of leaf area index, fAPAR, and net primary production of terrestrial ecosystems. Remote Sens. Environ. 1999, 70, 29–51. [Google Scholar] [CrossRef]
  28. Jonckheere, I.; Fleck, S.; Nackaerts, K.; Muys, B.; Coppin, P.; Weiss, M.; Baret, F. Review of methods for in situ leaf area index determination. Agric. For. Meteorol. 2004, 121, 19–35. [Google Scholar] [CrossRef]
  29. ACIS 2020. Alberta Climate Information Service. Alberta Agriculture and Forestry. Available online: https://acis.alberta.ca (accessed on 12 November 2020).
  30. Irvine, R.B.; Lafond, G.P.; May, W.; Kutcher, H.R.; Clayton, G.W.; Harker, K.N.; Turkington, T.K.; Beres, B.L. Stubble options for winter wheat in the black soil zone of western Canada. Can. J. Plant Sci. 2013, 93, 261–270. [Google Scholar] [CrossRef] [Green Version]
  31. SAS Institute. SAS/STAT 9.2 User’s Guide, 2nd ed.; SAS Institute Inc.: Cary, NC, USA, 2009. [Google Scholar]
  32. Littell, R.C.; Milliken, G.A.; Stroup, W.W.; Wolfinger, R.D. SAS Systems for Mixed Models, 2nd ed.; SAS Institute Inc.: Cary, NC, USA, 2006; p. 813. [Google Scholar]
  33. Steel, R.G.D.; Torrie, J.H.; Dickey, D.A. Principles and Procedures of Statistics: A Biometrical Approach; McGraw-Hill: New York, NY, USA, 1997; 666p. [Google Scholar]
  34. Yang, R.-C.; Juskiw, P. Analysis of covariance in agronomy and crop research. Can. J. Plant Sci. 2011, 91, 621–641. [Google Scholar] [CrossRef]
  35. Francis, T.R.; Kannenberg, L.W. Yield stability studies in short-season maize. I. A descriptive method for grouping genotypes. Can. J. Plant Sci. 1978, 58, 1029–1034. [Google Scholar] [CrossRef]
  36. Döring, T.F.; Reckling, M. Detecting global trends of cereal yield stability by adjusting the coefficient of variation. Eur. J. Agron. 2018, 99, 30–36. [Google Scholar] [CrossRef]
  37. Taylor, L.R. Aggregation, variance and the mean. Nat. Cell Biol. 1961, 189, 732–735. [Google Scholar] [CrossRef]
  38. Döring, T.F.; Knapp, S.; Cohen, J.E. Taylor’s power law and the stability of crop yields. Field Crop. Res. 2015, 183, 294–302. [Google Scholar] [CrossRef]
  39. Shen, S.S.P.; Yin, H.; Cannon, K.; Howard, A.; Chetner, S.; Karl, T.R. Temporal and spatial changes of the agroclimate in Alberta, Canada, from 1901 to 2002. J. Appl. Meteorol. 2005, 44, 1090–1105. [Google Scholar] [CrossRef] [Green Version]
  40. Zhao, L.; Gray, D.M.; Toth, B. Influence of soil texture on snowmelt infiltration into frozen soils. Can. J. Soil Sci. 2002, 82, 75–83. [Google Scholar] [CrossRef]
  41. Depauw, R.M.; Knox, R.E.; Clarke, F.; Clarke, J.M.; McCaig, T.N. Stettler hard red spring wheat. Can. J. Plant Sci. 2009, 89, 945–951. [Google Scholar] [CrossRef]
  42. Fowler, D.B. Cold acclimation threshold induction temperatures in cereals. Crop. Sci. 2008, 48, 1147–1154. [Google Scholar] [CrossRef]
  43. Porker, K.; Straight, M.; Hunt, J.R. Evaluation of G × E × M Interactions to increase harvest index and yield of early sown wheat. Front. Plant Sci. 2020, 11, 994. [Google Scholar] [CrossRef]
  44. Farooq, M.; Bramley, H.; Palta, J.A.; Siddique, K.H.M. Heat stress in wheat during reproductive and grin-filling phases. Crit. Rev. Plant Sci. 2011, 30, 491–507. [Google Scholar] [CrossRef]
  45. Cann, D.J.; Schillinger, W.F.; Hunt, J.R.; Porker, K.D.; Harris, F.A.J. Agroecological advantages of early-sown winter wheat in semi-arid environments: A comparative case study from southern Australia and Pacific Northwest United States. Front. Plant Sci. 2020, 11, 568. [Google Scholar] [CrossRef]
  46. Hunt, J.; Lilley, J.M.; Trevaskis, B.; Flohr, B.M.; Peake, A.; Fletcher, A.; Zwart, A.B.; Gobbett, D.L.; Kirkegaard, J.A. Early sowing systems can boost Australian wheat yields despite recent climate change. Nat. Clim. Chang. 2019, 9, 244–247. [Google Scholar] [CrossRef]
  47. Alberta Wheat Commission 2020. Alberta Wheat Commission Price and Data Quotes—Price History. Available online: https://www.pdqinfo.ca/history (accessed on 29 December 2020).
  48. Fischer, R. Definitions and determination of crop yield, yield gaps, and of rates of change. Field Crop. Res. 2015, 182, 9–18. [Google Scholar] [CrossRef]
  49. Kirkegaard, J.; Hunt, J.R. Increasing productivity by matching farming system management and genotype in water-limited environments. J. Exp. Bot. 2010, 61, 4129–4143. [Google Scholar] [CrossRef] [Green Version]
  50. Beres, B.L.; Rahmani, E.; Clarke, J.M.; Grassini, P.; Pozniak, C.J.; Geddes, C.M.; Porker, K.D.; May, W.E.; Ransom, J.K. A systematic review of durum wheat: Enhancing production systems by exploring genotype, environment, and management (G × E × M) synergies. Front. Plant Sci. 2020, 11, 568657. [Google Scholar] [CrossRef] [PubMed]
  51. Cassman, K.G.; Grassini, P. A global perspective on sustainable intensification research. Nat. Sustain. 2020, 3, 262–268. [Google Scholar] [CrossRef] [Green Version]
  52. Fischer, R.A.; Connor, D. Issues for cropping and agricultural science in the next 20 years. Field Crop. Res. 2018, 222, 121–142. [Google Scholar] [CrossRef]
  53. Beres, B.L.; Turkington, T.K.; Kutcher, H.R.; Irvine, B.; Johnson, E.N.; O’Donovan, J.T.; Harker, K.N.; Holzapfel, C.B.; Mohr, R.; Peng, G.; et al. Winter wheat cropping system response to seed treatments, seed size, and sowing density. Agron. J. 2016, 108, 1101–1111. [Google Scholar] [CrossRef] [Green Version]
  54. Ford, K.A.; Casida, J.E.; Chandran, D.; Gulevich, A.G.; Okrent, R.A.; Durkin, K.A.; Sarpong, R.; Bunnelle, E.M.; Wildermuth, M.C. Neonicotinoid insecticides induce salicylate-associated plant defense responses. Proc. Natl. Acad. Sci. USA 2010, 107, 17527–17532. [Google Scholar] [CrossRef] [Green Version]
  55. Turkington, T.K.; Beres, B.L.; Kutcher, H.R.; Irvine, B.; Johnson, E.N.; O’Donovan, J.T.; Harker, K.N.; Holzapfel, C.B.; Mohr, R.; Peng, G.; et al. Winter wheat yields are increased by seed treatment and fall-applied fungicide. Agron. J. 2016, 108, 1379–1389. [Google Scholar] [CrossRef]
  56. Pandey, M.; Singh, A.K.; DePauw, R.M.; Bokore, F.E.; Ellouze, W.; Knox, R.E.; Cuthbert, R.D. Coleoptile length, gibberellin sensitivity, and plant height variation of durum wheat in Canada. Can. J. Plant Sci. 2015, 95, 1259–1264. [Google Scholar]
  57. Ellis, M.H.; Rebetzke, G.J.; Chandler, P.; Bonnett, D.; Spielmeyer, W.; Richards, R. The effect of different height reducing genes on the early growth of wheat. Funct. Plant Biol. 2004, 31, 583–589. [Google Scholar] [CrossRef]
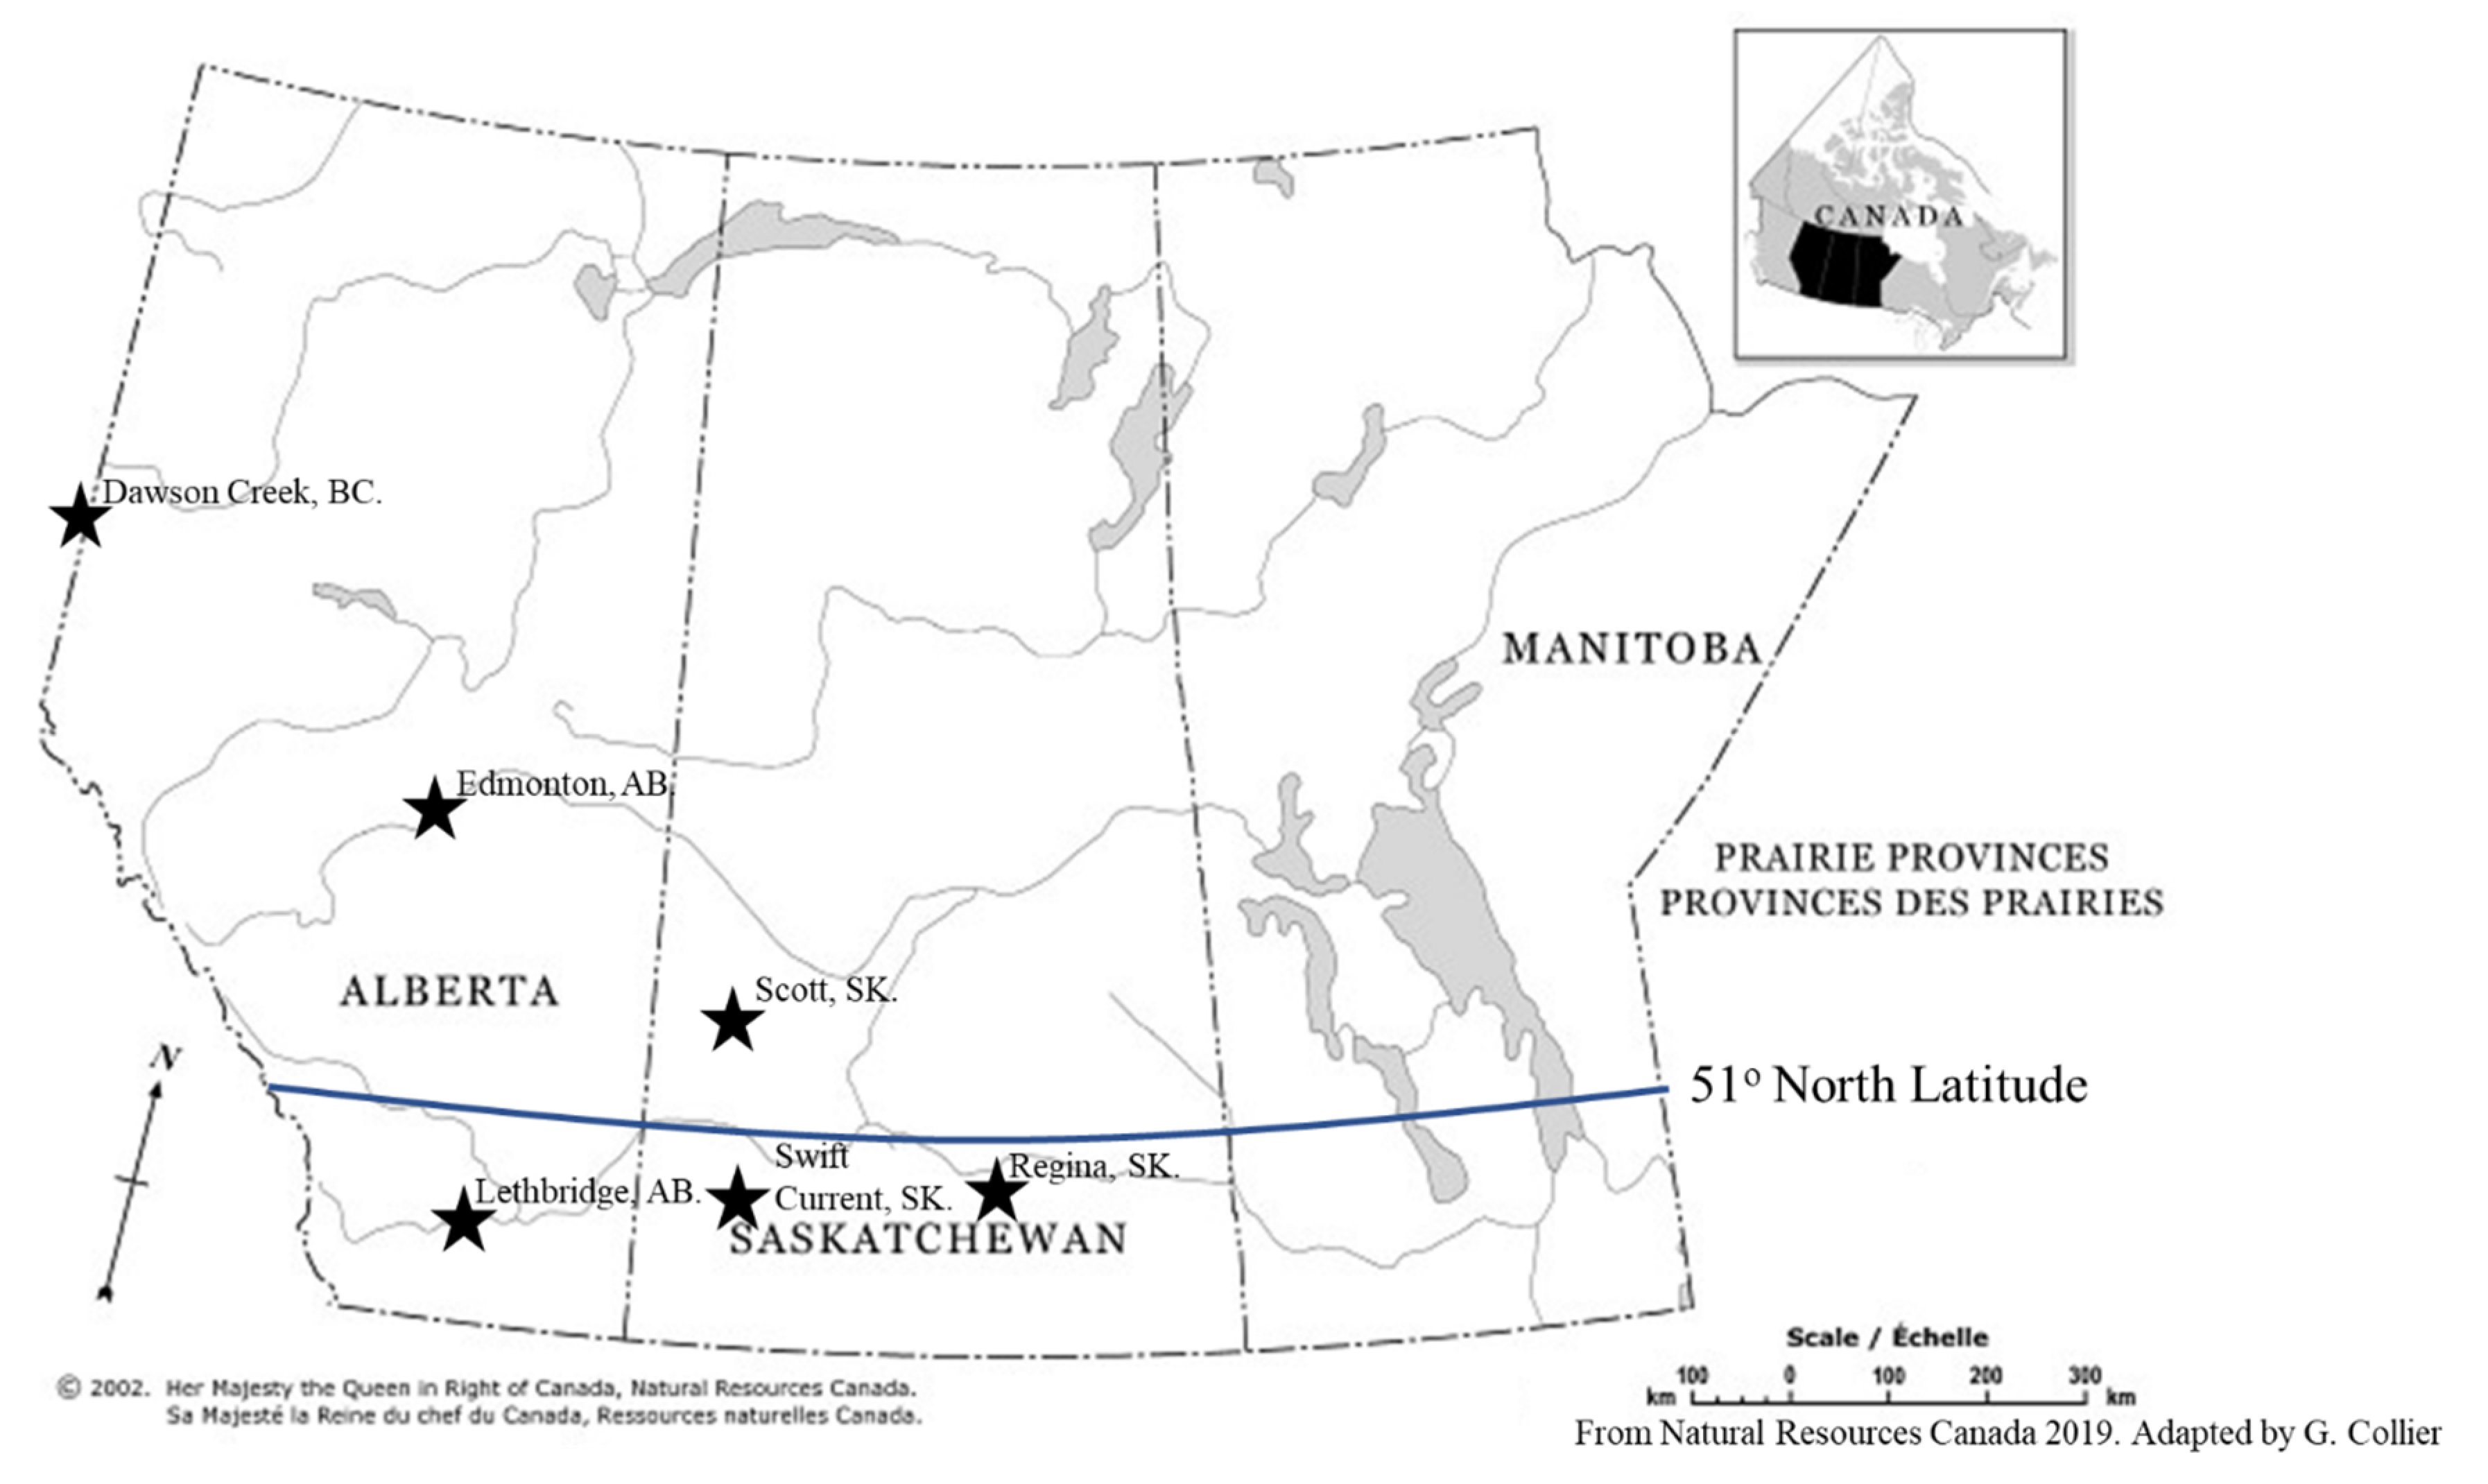
Figure 1. Geographical distribution of test locations for the assessment of planting date, rate, depth and wheat line on ultra-early wheat seeding systems on the northern Great Plains. (The Atlas of Canada—Natural Resources Canada. http://ftp.geogratis.gc.ca/pub/nrcan_rncan/raster/atlas_6_ed/reference/bilingual/prairies_out.jpg). Adapted from Collier et al. [8].
Agronomy 11 00240 g001
Figure 2. Growing degree day (base 0 °C) (GDD B0) accumulation at the Lethbridge, Alberta sites, 2015–2018. The position of each triangle indicates the initial seeding date in each year in relation to GDD B0 accumulation for the growing season (March 1 to September 1).
Agronomy 11 00240 g002
Figure 3. Wheat grain yield as a function of planting date (PD) at 13 environments on the northern Great Plains. PD 1 corresponds to a soil temperature of 0–2.5 °C, with each successive PD equal to a 2.5 °C increase in soil temperature. The lines represent linear regressions for grain yield when planted at 200 seeds m−2 or 400 seeds m−2. (***) Significant at p < 0.001.
Agronomy 11 00240 g003
Figure 4. Average leaf area index (LAI) values from 5 June to 1 July at Lethbridge, Alberta sites 2015–2018 for each planting date, overlaid with 2015–2018 average GDD B0 accumulation during the same time period. Planting dates 1–3 had significantly greater LAI than planting date 4 on June 5 (p < 0.05). No significant differences in LAI between planting times was present 13 June to 1 July.
Agronomy 11 00240 g004
Figure 5. Average leaf area index (LAI) values from 5 June to 1 July at Lethbridge, Alberta sites 2015–2018 for each seeding rate, overlaid with 2015–2018 average GDD B0 accumulation during the same time period. The optimum seeding rate (400 seeds m−2) had significantly greater LAI than the 200 seeds m−2 seeding rate on 5 June and 13 June (p < 0.05). No significant differences in LAI between seeding rates was present 21 June to 1 July.
Agronomy 11 00240 g005
Figure 6. Biplots summarizing grain yield means vs. adjusted coefficient of variation (aCV) for each wheat line; “LQ1299A” (A), and “LQ1315A” (B). Abbreviations are as follows: (I) The first number represents the seeding rate (400—400 seeds m−2, 200—200 seeds m−2). (II) The second word represents the sowing depth (Shallow—2.5 cm, Deep—5 cm). (III) Colours represent the planting date as indicated in the legend above (Planting Date 1–4, 1 equaling 0–2.5 °C soil temperature). Grouping categories are divided by a vertical line representing the mean aCV and a horizontal line representing the mean grain yield: Group I: high mean, low variability; Group II: high mean, high variability; Group III: low mean, high variability; Group IV: low mean, low variability.
Agronomy 11 00240 g006
Table 1. Agroecological data, precipitation, post-seeding air temperature extremes and cumulative freezing events recorded at each location x year.
LocationLatitude/LongitudeAgroecological RegionSoil ZoneAverage Yearly Precipitation * (mm)YearActual Precipitation (mm)Earliest Seeding Date **Number of Days with Air Temperature below 0 °C after Initial Seeding DateLowest Air Temperature Recorded after Seeding (°C)
Dawson Creek, BC55°48′ N 120°14′ WParklandGrey Wooded453201532516 April 12−5.0
201654221 April 11−6.1
Edmonton, AB53°33′ N 113°29′ WParklandBlack44620152999 April 12−4.2
201651029 March 11−3.6
20174165 May 02.3
Lethbridge, AB49°41′ N 112°50′ WWestern PrairiesDark Brown38020152516 March 37−6.7
201633816 February 36−10.2
201724920 March 17−7.6
201828423 April 2−1.2
Regina, SK50°26′ N 104°35′ WWestern PrairiesDark Brown397201534721 April 11−5.0
Scott, SK52°21′ N 108°49′ WWestern PrairiesDark Brown36620164152 April 21−9.8
201730031 March 27−9.4
Swift Current, SK50°18′ N 107°46′ WWestern PrairiesBrown357201530410 April 23−6.4
* 1981–2010 average yearly precipitation accumulation. ** Based on 0–2.5 °C soil temperature trigger date. Initial planting at Dawson Creek, BC in 2015 and 2016, and Edmonton, AB in 2015 occurred after soil temperatures reached 2.5 °C, but prior to soils reaching 4 °C. Planting delays were due to inaccessibility of trial sites early in the season. In these cases, each successive planting date was delayed so that a differential of 2.5 °C in soil temperature between each planting date was maintained.
Table 2. Classification of cold tolerant lines, and parent lines.
LineParental LinesParental Lines Canadian wheat ClassificationExperimental DesignationReference
“LQ1299A” ƗNorstar/BergenCWRW Ŧ/DNS βCold Tolerant ¥Larsen 2012
“LQ1315A” ƗNorstar/BergenCWRW/DNSCold TolerantLarsen 2012
¥ Cold tolerant lines were selected from 92 double haploid lines from a Norstar/Bergen cross initially completed at AAFC Lethbridge. Cold tolerant lines were selected based on spring growth habit, demonstrated cold tolerance using LT50 tests, and yield and quality parameters [8,25]. Ŧ Canada Western Red Winter. β Dark Northern Spring. Ɨ Undetermined Classification.
Table 3. Least square means for grain yield, grain quality, and select agronomic parameters affected by ultra-early planting.
Yield
(Mg ha−1)
Protein (%)Test Weight (kg hL−1)Thousand Kernel Weight (g)Height (cm)Plants m−2 ¥Heads m−2 ¥Heads plant−1 ¥
Planting Date (PD) Ŧ
1 (Earliest)4.9511.977.234.1782003902.2
24.9312.077.434.0782143832.0
34.8412.177.534.2771983612.0
4 (Latest)4.5712.277.334.5781923602.1
F-Test****NS*NS****NS
SED0.100.07 0.2 89
LSD0.050.200.1 0.4 1517
Linear***** * NS***
QuadraticNSNS NS NSNS
Wheat Line (WL)
“LQ1299A”4.8112.177.034.2772073742.0
“LQ1315A”4.8312.077.734.2781953732.1
F-TestNS******NS******NS***
SED 0.040.06 0.33 0.04
LSD0.05 0.070.1 0.57 0.08
Seeding Rate (SR)
200 seeds m−24.6912.177.134.3771663492.3
400 seeds m−24.9512.077.634.0782373981.8
F-Test***********NS*********
SED0.040.040.060.1 340.04
LSD0.050.080.070.10.2 790.08
Seeding Depth (SD)
2.5 cm4.8212.177.334.0782083832.1
5.0 cm4.8212.077.434.3771953642.1
F-TestNSNSNS**NS******NS
SED 0.1 34
LSD0.05 0.2 79
WL × SRNSNSNSNS*NSNS**
(***) Significant at p < 0.001. (**) Significant at p < 0.01. (*) Significant at p < 0.05. (NS) Not Significant. (SED) Standard error of the difference. (LSD0.05) Least Significant Difference at p < 0.05. (Ŧ) Planting date as determined by soil temperature triggers. Planting Date (PD) 1 corresponds to a soil temperature of 0–2.5 °C, or as soon after this trigger soil temperature as the site could be planted. Each successive PD corresponds to a 2.5 °C increase in soil temperature from the previous PD. Only interactions with significant effects have been reported. ¥ Data not included from four location × years, Regina, Swift Current, Edmonton 2015, and Lethbridge 2016.
Table 4. Least square mean values for crop physiological development stage, duration, and related period lengths for ultra-early planted wheat.
Days to EmergenceDays to AnthesisDays to MaturityEmergence to Anthesis (Days)Anthesis to Maturity (Days)Emergence to Maturity (Days)
Planting Date Ŧ
1 (Earliest)25.482.8124.758.043.3102.2
218.976.4117.758.242.2101.4
314.570.2110.955.541.298.1
4 (Latest)11.466.1104.755.039.095.6
F-Test******************
SED1.61.61.60.70.81.1
LSD0.053.23.13.11.31.62.3
Linear******************
QuadraticNSNSNSNSNSNS
Wheat Line (WL)
“LQ1299A”17.373.7114.456.641.499.4
“LQ1315A”17.874.0114.656.841.599.2
F-Test***NSNSNSNS
SED0.10.1
LSD0.050.30.3
Seeding Rate (SR)
200 seeds m−218.374.0115.256.341.999.1
400 seeds m−216.973.7113.957.041.099.5
F-Test***NS*******NS
SED0.1 0.20.20.2
LSD0.050.3 0.40.40.5
Seeding Depth (SD)
2.5 cm17.073.5114.256.841.599.5
5.0 cm18.174.2114.856.641.499.1
F-Test********NSNSNS
SED0.10.10.2
LSD0.050.30.30.4
PD × SD**NSNSNSNSNS
PD × SR**NSNSNSNS*
WL × SRNS*NSNSNSNS
PD × WL × SRNS*NSNS*NS
(***) Significant at p < 0.001. (**) Significant at p < 0.01. (*) Significant at p < 0.05. (NS) Not Significant. (SED) Standard error of the difference. (LSD0.05) Least Significant Difference at p < 0.05. (Ŧ) Planting date as determined by soil temperature triggers. Planting Date (PD) 1 corresponds to a soil temperature of 0–2.5 °C, each successive PD corresponds to a 2.5 °C increase in soil temperature from the previous PD. Only interactions with significant effects have been reported. Data not reported for all environments.
Publisher’s Note: MDPI stays neutral with regard to jurisdictional claims in published maps and institutional affiliations.