Article

Multicolor Fluorescence Imaging for the Early Detection of Salt Stress in Arabidopsis

College of Mechanical and Electrical Engineering, Fujian Agriculture and Forestry University, Fuzhou 310002, China
*
Authors to whom correspondence should be addressed.
Agronomy 2021, 11(12), 2577; https://doi.org/10.3390/agronomy11122577
Submission received: 24 September 2021 / Revised: 6 December 2021 / Accepted: 13 December 2021 / Published: 18 December 2021
(This article belongs to the Section Agricultural Biosystem and Biological Engineering)

Abstract

:
Salt stress is one of the abiotic factors that causes adverse effects in plants and there is an urgent need to detect salt stress in plants as early as possible. Multicolor fluorescence imaging, as a powerful tool in plant phenotyping, can provide information about primary and secondary metabolism in plants to detect the responses of the plants exposed to stress in the early stage. The purpose of this study was to evaluate the potential of multicolor fluorescence imaging’s application in the early detection of salt stress in plants. In this study, the measurements were conducted on Arabidopsis and the multicolor fluorescence images were acquired at 440, 520, 690, and 740 nm with a self-developed imaging system consisting of a UV light-emitting diode (LED) panel for an excitation at 365 nm, a charge coupled device (CCD) camera, interference filters, and a computer. We developed a classification method using the imaging analysis of multicolor fluorescence based on principal component analysis (PCA) and a support vector machine (SVM). The results showed that the four principal fluorescence feature combinations were the ideal indicators as the inputs of the SVM model, and the classification accuracies of the control and salt-stress treatment at 5 days and 9 days were 92.65% and 98.53%, respectively. The results indicated that multicolor fluorescence imaging combined with PCA and SVM could act as a tool for early detection in salt-stressed plants.

1. Introduction

Salinity has become one of the most challenging problems in plant development and crop productivity worldwide [1,2]. Salt stress affects plant growth in various ways, such as through osmotic effects, ion toxicity, and nutrition disorder [3,4], which greatly inhibits agricultural production. Thus, in order to accelerate the process of breeding and the cultivation of salt-resistant crops, it is essential to monitor the growth status of plants. At present, the evaluation of plant growth performance is often conducted via the analysis of the physiological, biochemical, and molecular responses of plants to environmental stress [5,6,7]. However, these methods of analyses are prone to being affected by environmental and genetic factors, and are sometimes destructive for plants. Therefore, the development of noninvasive, fast, and efficient technologies for detecting plant growth status to promote the selection of useful plant traits has become a research focus in recent years [8,9].
Spectral imaging technologies are powerful non-destructive tools that have been widely applied in evaluating the performance of plants exposed to abiotic stresses, such as salinity, water, and heat [10,11,12,13,14]. These imaging technologies include red–green–blue (RGB) imaging, thermal imaging, hyperspectral imaging, and kinetic chlorophyll fluorescence imaging. RGB imaging technology has been used to assess the effect of soil and water salinity on date palm growth, which provided supports for the application of RGB imaging in monitoring salinity-stressed plants [15]. Thermal infrared imaging technology can be utilized to analyze the responses of plants to water stress via characterizing the change of canopy and leaf temperature in plants [16,17]. Combining hyperspectral imaging and machine learning allowed for the estimation of the salinity tolerance of 13 okra genotypes by investigating fresh weight, SPAD, and transpiration rate [18]. The photoinhibition and reduction of plants exposed to heat and salinity stress was revealed by using kinetic chlorophyll fluorescence imaging [19].
The studies listed above indicated that spectral imaging technologies can be used to analyze plant phenotype changes responding to abiotic stresses and provide useful information for the detection of the plants exposed to abiotic stresses [15,16,17,18,19]. However, the early responses of plants to stress are often manifested in physiological and biochemical microscopic changes, so RGB imaging is limited in early detection as it only can recognize the visible changes observed by human inspection. Although hyperspectral imaging, thermal infrared imaging, and kinetic chlorophyll fluorescence imaging could reveal the microscopic performance of plants to stress, they also have limitations, such as requiring an expensive and complex device, being subject to the impact of environmental temperature, and requiring dark adaptation.
Multicolor fluorescence with the excitation of UV light and its emission spectrum is usually characterized by four bands near 440 nm (blue; F440), 520 nm (green; F520), 690 nm (red; F690), and 740 nm (far-red; F740) [20]. The blue and green fluorescence are often grouped as blue–green fluorescence (BGF) emitted by secondary metabolites bound to cell walls. Additionally, red, and far-red fluorescence are treated as chlorophyll fluorescence (ChlF) emitted by chlorophyll a in the chloroplasts of green mesophyll cells [21]. Multicolor fluorescence imaging can evaluate the physiologic state of plants before the symptoms induced by different environmental stress factors become evident [22], which has an advantage in the early stress detection of plants. Thus, multicolor fluorescence imaging has been applied to evaluate the physiological state of plants in many studies. Multicolor fluorescence imaging technology has been used for the early detection of pathogens in plants such as zucchini, melon, and Nicotiana benthamiana, demonstrating the potential of multicolor fluorescence imaging in revealing stress-associated signatures [23,24]. The combination of kinetic chlorophyll fluorescence and multicolor fluorescence imaging has been successfully applied in the early detection of drought stress responses in Arabidopsis [25]. Based on a multicolor fluorescence system coupled with a dynamic fluorescence index (DFI), the fluorescence index has been utilized in predicting the water stress status of cabbage seedlings [26]. In addition, multicolor fluorescence imaging technology has been employed in the study of plant nutrients, as reviewed by Tremblay et al. [27]. However, there are still limited studies applying multicolor fluorescence imaging technology as a tool to analyze the plant response to salt stress.
Hence, the main objective of this work was to explore the possible application of multicolor fluorescence imaging technology for evaluation of the early detection of salt stress in plants. In this work, light-emitting diode (LED)-induced multicolor fluorescence was detected by a charge coupled device (CCD) sensor through different light filters with four bands (440, 520, 690, and 740 nm) to acquire multicolor fluorescence images. Based on this, multiple fluorescence parameters were extracted to assess the effects of salt stress, and data dimension reduction was conducted through principal component analysis (PCA) to reduce the number of features and select the best features. Then, the best features and an optimized support vector machine (SVM) model were integrated to construct the early detection model for salt stress. The results showed that multicolor fluorescence imaging has great potential in the early detection of salt stress in plants.

2. Materials and Methods

2.1. Plant Material and Growth Conditions

Arabidopsis Columbia (Col-0) was used to establish the cultivation and salt treatment in the experiment. Similar to the procedure in [28], seeds were sown in Petri dishes in half-strength Murashige and Skoog salts (1/2 MS; Sigma), 1.5% (w/v) sucrose (Sigma), and 0.8% (w/v) agar. At the four-leaf stage (day 15 after sowing), plants were transplanted to pots (70 × 70 mm and 50 × 50 mm top and bottom, respectively, and 54 mm height, with holes in the bottom) filled with a mixture of nutrient soil and vermiculite (3:1, v/v). Arabidopsis plants were cultivated in a climate-controlled growth chamber (F731, Hipoint, Taiwan, China) at 22 °C, 65% RH, 8/16 h light/dark, under an optimal light intensity of 120 μ mol m−2·s−1 [29].

2.2. Salt-Stress Treatment

In this experiment, the Arabidopsis plants were irrigated with NaCl solution with a concentration of 100 mM. The experimental treatment began 28 days after sowing (day 28), when the plants were irrigated with NaCl solution for 9 days, while watered plants served as the controls. In the experiment, the control and salt-treated plants were used for non-destructive multicolor fluorescence imaging at day 1, 3, 5, 7, and 9 after treatment.

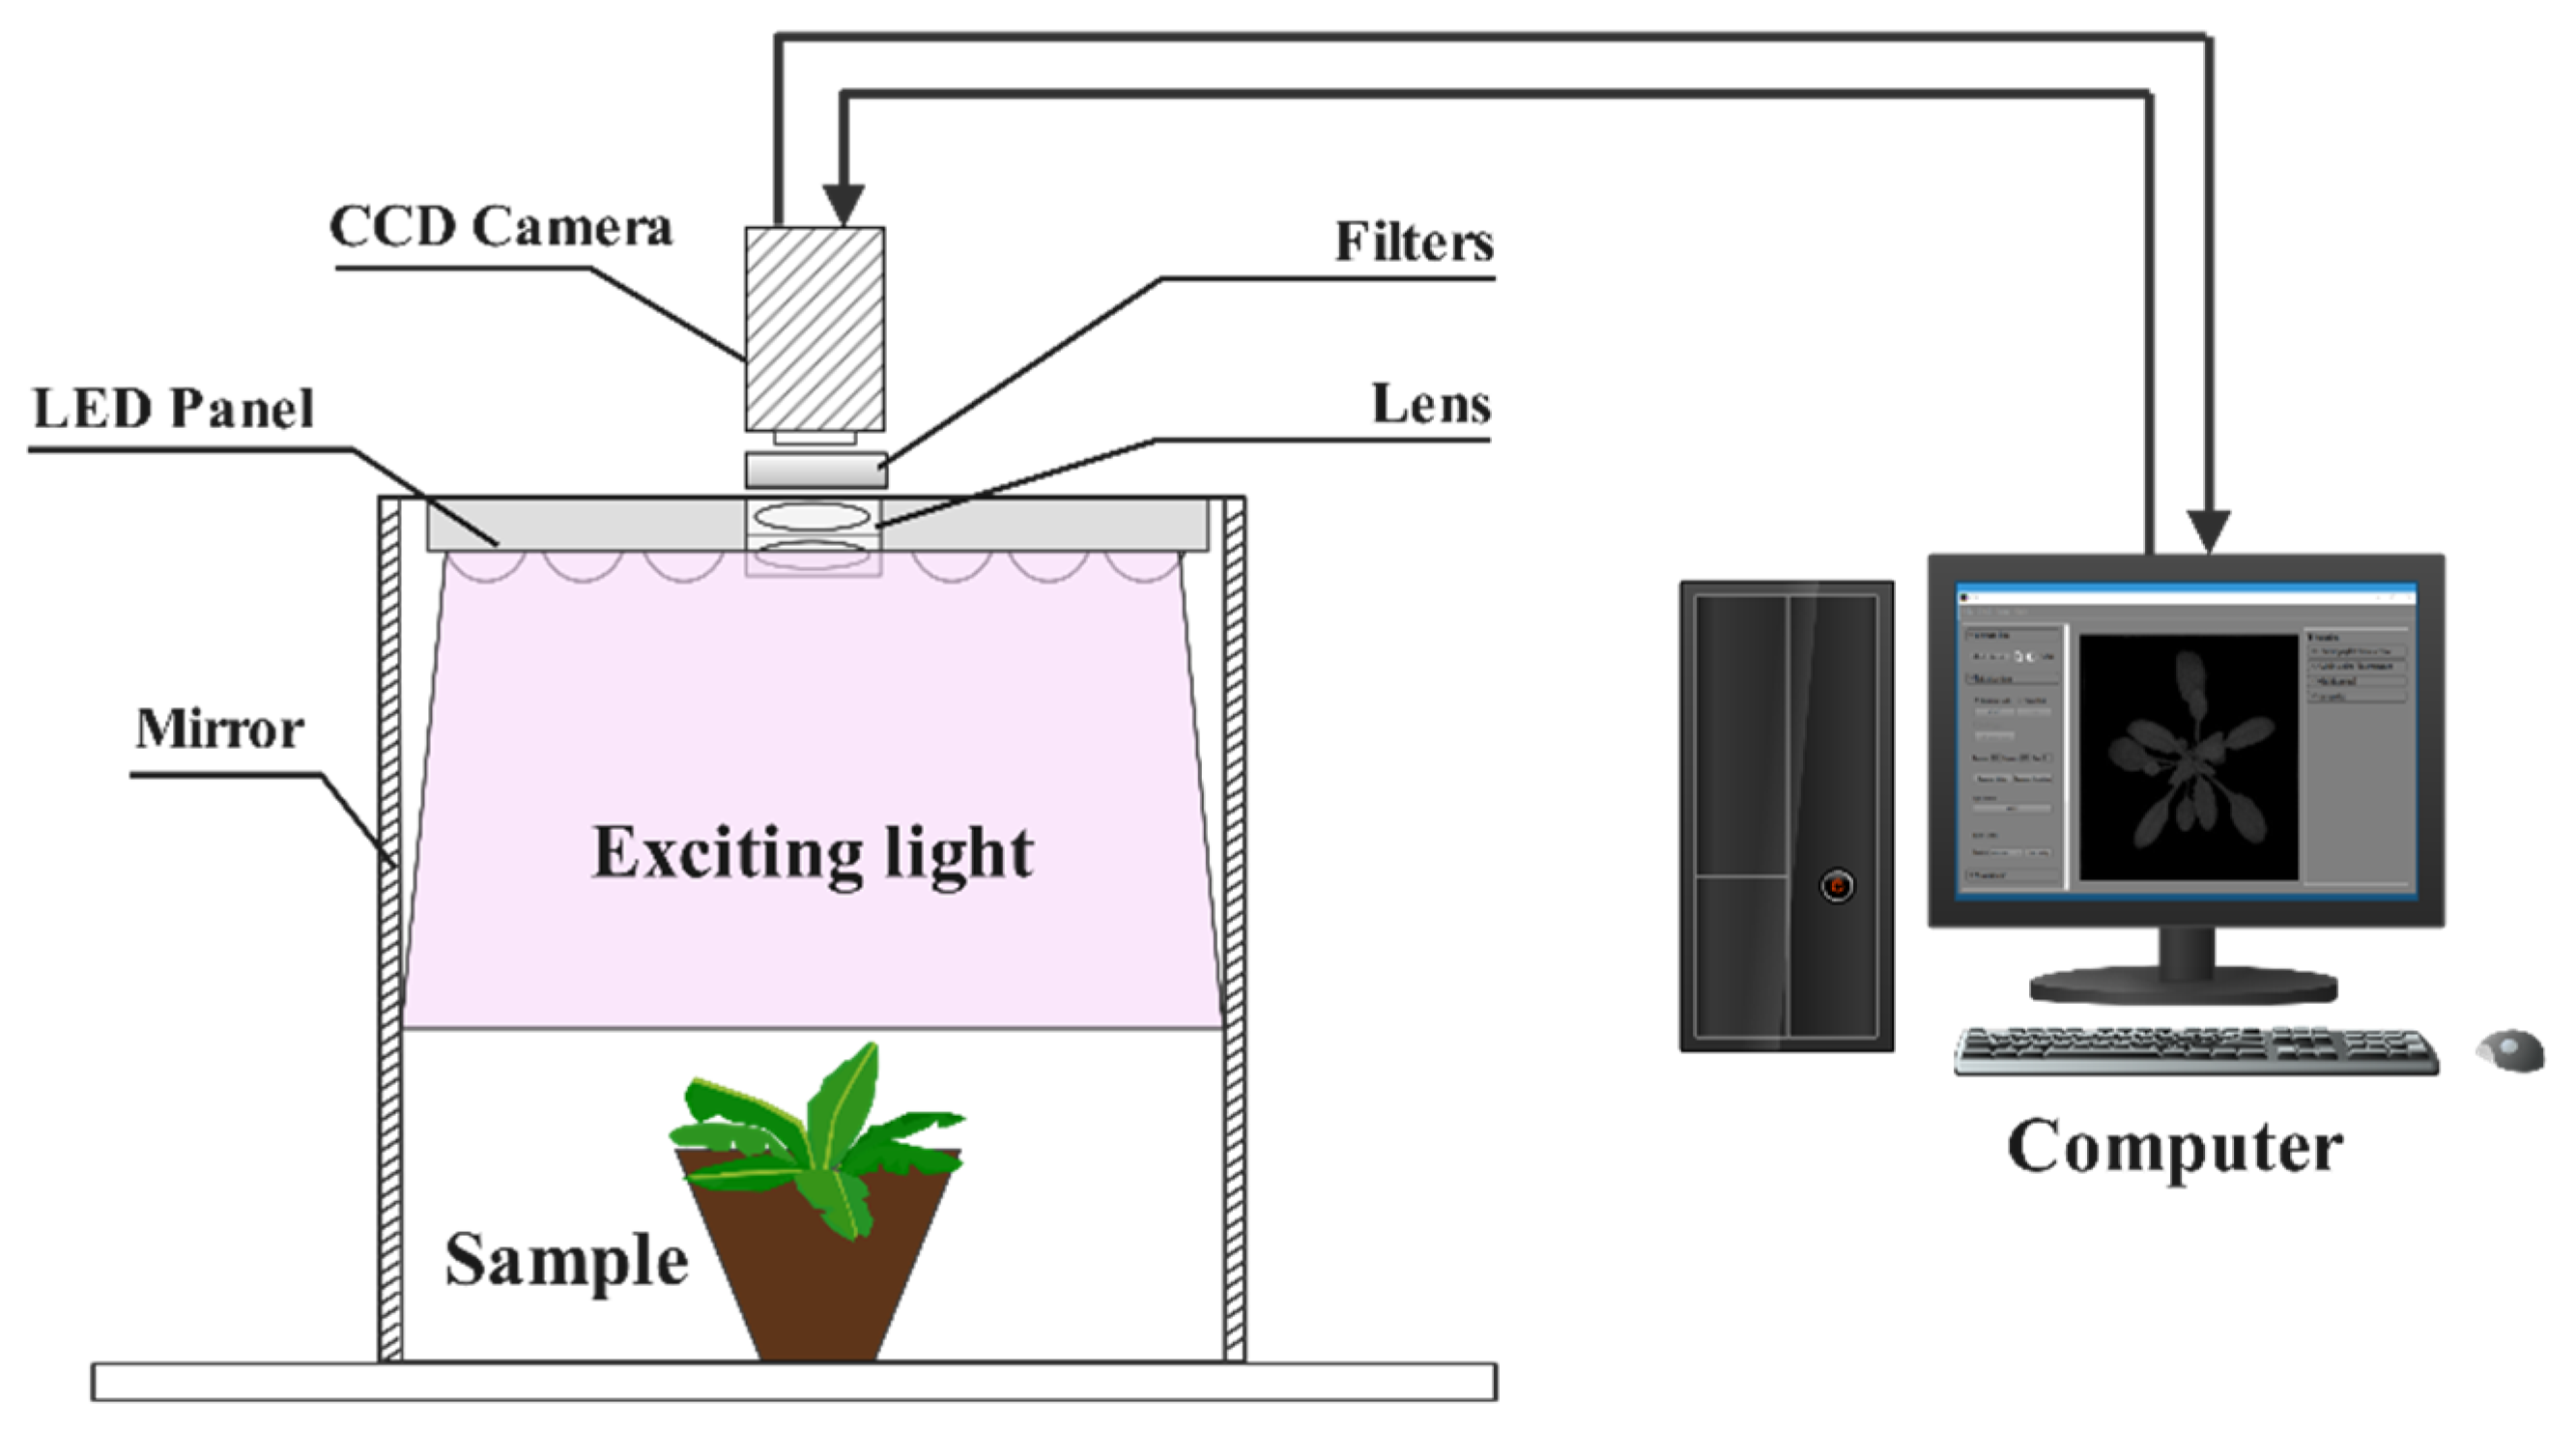
2.3. Multicolor Fluorescence Imaging (MFI) System

The schematic representation of the self-developed MFI system is shown in Figure 1. The system consists of a LED panel, a monochrome CCD camera (MV-CA005-20GM, Hikvision, Hangzhou, China), band-pass filters, and a computer. The LED panel containing 48 × 3W LEDs provided an excitation light at 365 nm to measure the fluorescence signals emitted by plants. In order to reduce the influence of the heterogeneous intensity field of LED, four mirrors were installed at four sides of the dark box. The monochrome CCD camera had a spatial resolution of 1024 pixels × 1280 pixels. The focal length of the camera lens was 12 mm with a standard view (H0514-MP2, Computar, Tokyo, Japan). Multicolor fluorescence imaging was implemented by using band-pass filters (half-band width of 15 nm) placed in front of the lens in the respective bands (440, 520, 690, and 740 nm). The images were captured by the CCD camera controlled by a software developed by our group using the C++ programming language based on the platform Visual Studio 2018 (Microsoft, Redmond, WA, USA). During the process of multicolor fluorescence image acquisition, the sample was placed on flat surface and the distance between the lens and the sample was approximately 25 cm.

2.4. Determination of Leaf Area

In order to observe the effect of salt stress on plant morphology features, the RGB images were acquired at day 1, 3, 5, 7, and 9 after salt stress using an RGB camera (Nikon D5600, Tokyo, Japan) and the projected leaf area of the plants was calculated from the total pixels.

2.5. Image Processing and Statistical Analysis

There were no fluorescence signals in the non-plant region, where it was dark compared to the plant region in the multicolor fluorescence images. Hence, we set a threshold to segment the plant region from the image, in which an image can be grouped into two classes representing the plant and the background, respectively. Based on the four basic multicolor fluorescence images F440, F520, F690, and F740, we calculated the individual fluorescence intensity from the corresponding plant region. Additionally, the fluorescence ratios could be calculated, including F440/F520, F440/F690, F440/F740, F520/F690, F520/F740, and F690/F740. After image processing, an analysis of variance (ANOVA) was employed to evaluate the differences in four basic multicolor fluorescence parameters between the control and salt-stressed plants. In this study, we obtained 10 fluorescence parameters, including 4 basic parameters and 6 fluorescence ratios, and Pearson’s correlation analysis was utilized for the linear correlation among these parameters and to check whether all parameters had potential as an input for the detection model of salt stress to obtain better results. Imaging processing and the calculation of fluorescence intensity were carried out using MATLAB 2016b (Mathworks, Natick, MA, USA). ANOVA and Pearson’s correlation analysis were conducted on IBM SPSS Statistics 26 (IBM Corporation, Armonk, New York, NY, USA).

2.6. Construction of a Classification Model Based on PCA and SVM

In this paper, to further select ideal principal features in limited sample data to differentiate the salt-stressed plants from the controls, PCA was performed to reduce the dimensionality of such datasets, increasing interpretability and at the same time minimizing information loss [30]. After the application of PCA, the principal components were uncorrelated variables that successively maximized variance and then the ideal principal component features were determined. An SVM is a versatile and configurable model that could be treated as a classification problem, which has a better performance than other traditional machine learning algorithms [31,32]. Therefore, it is a great alternative to classify the salt-stressed plants from the controls based on the model that combines PCA and SVM. In this study, four principal component combinations characterizing the plant response to salt stress were extracted from all multicolor fluorescence parameters, and these combinations were preprocessed together to form sample data. The two classifications, with the labeling “1” for the control plants and “2” for the salt-stressed ones, were conducted by an SVM classifier. For the classification scheme, the data set consisted of multicolor fluorescence data of 168 pots (84 controls and 84 salt-stress treatments) for 5 days, from which 100 pots (50 controls and 50 salt-stress treatments) for 5 days were taken as the training set, and the remaining 68 pots (34 controls and 34 salt-stress treatments) per day were used as the testing set with 10 repetitions using 10-fold cross-validation. In this study, PCA for feature selection and SVM for classification were performed in MATLAB 2016b (Mathworks, United States) and Python 3.6 (Python Software Foundation, Wilmington, DE, USA).

3. Results and Discussion

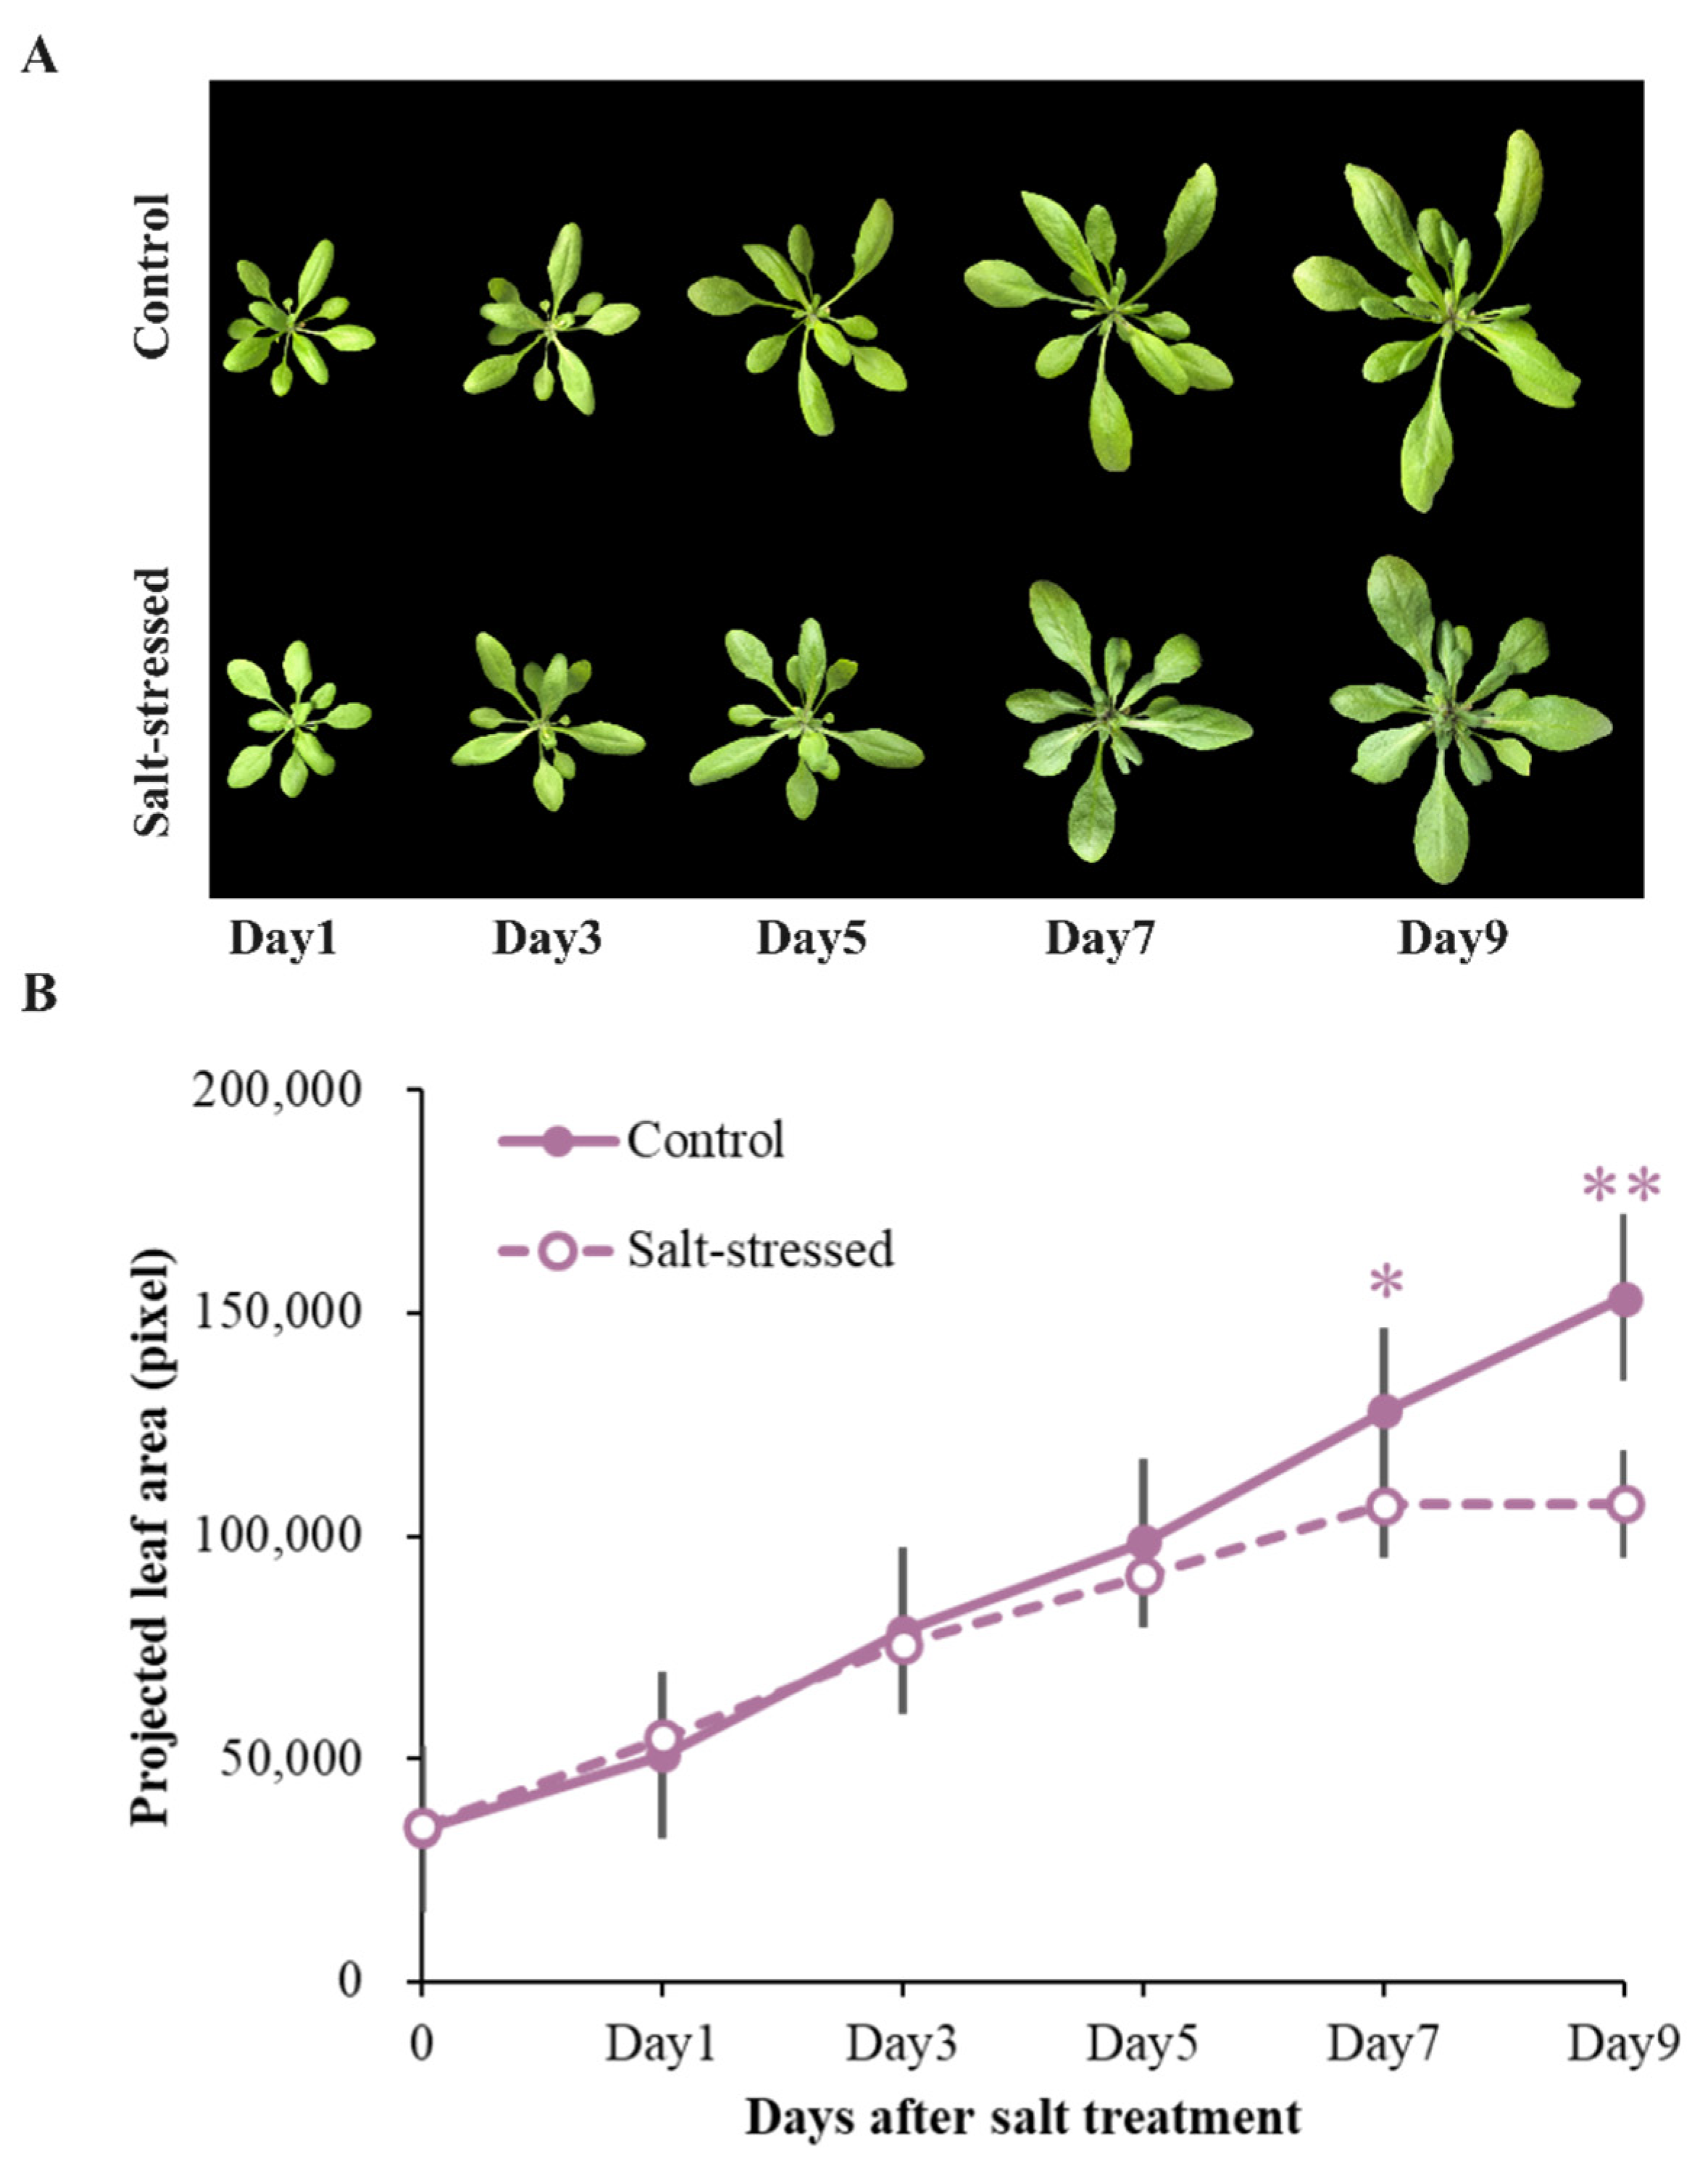
3.1. Salt Stress Affected Growth over Time

The RGB images of Arabidopsis Columbia (Col-0) under control and salt stress treatment at day 1, 3, 5, 7, and 9 after exposure to the salt stress are presented in Figure 2A. From the RGB images, it can be observed that the slender leaves of the plant under salt stress treatment changed in roundness over time and the salt stress caused a significant decrease in the projected leaf area after salt stress treatment for 7 days (Figure 2B). However, the color of the plants exposed to salt stress did not show significant changes over time from the RGB images, which was consistent with an earlier report [33]. These results showed that early salt-induced changes had limited effects on the structural traits of the plants from RGB images over time. However, early salt-induced changes ignored by RGB images could be revealed using multicolor fluorescence imaging in this study.

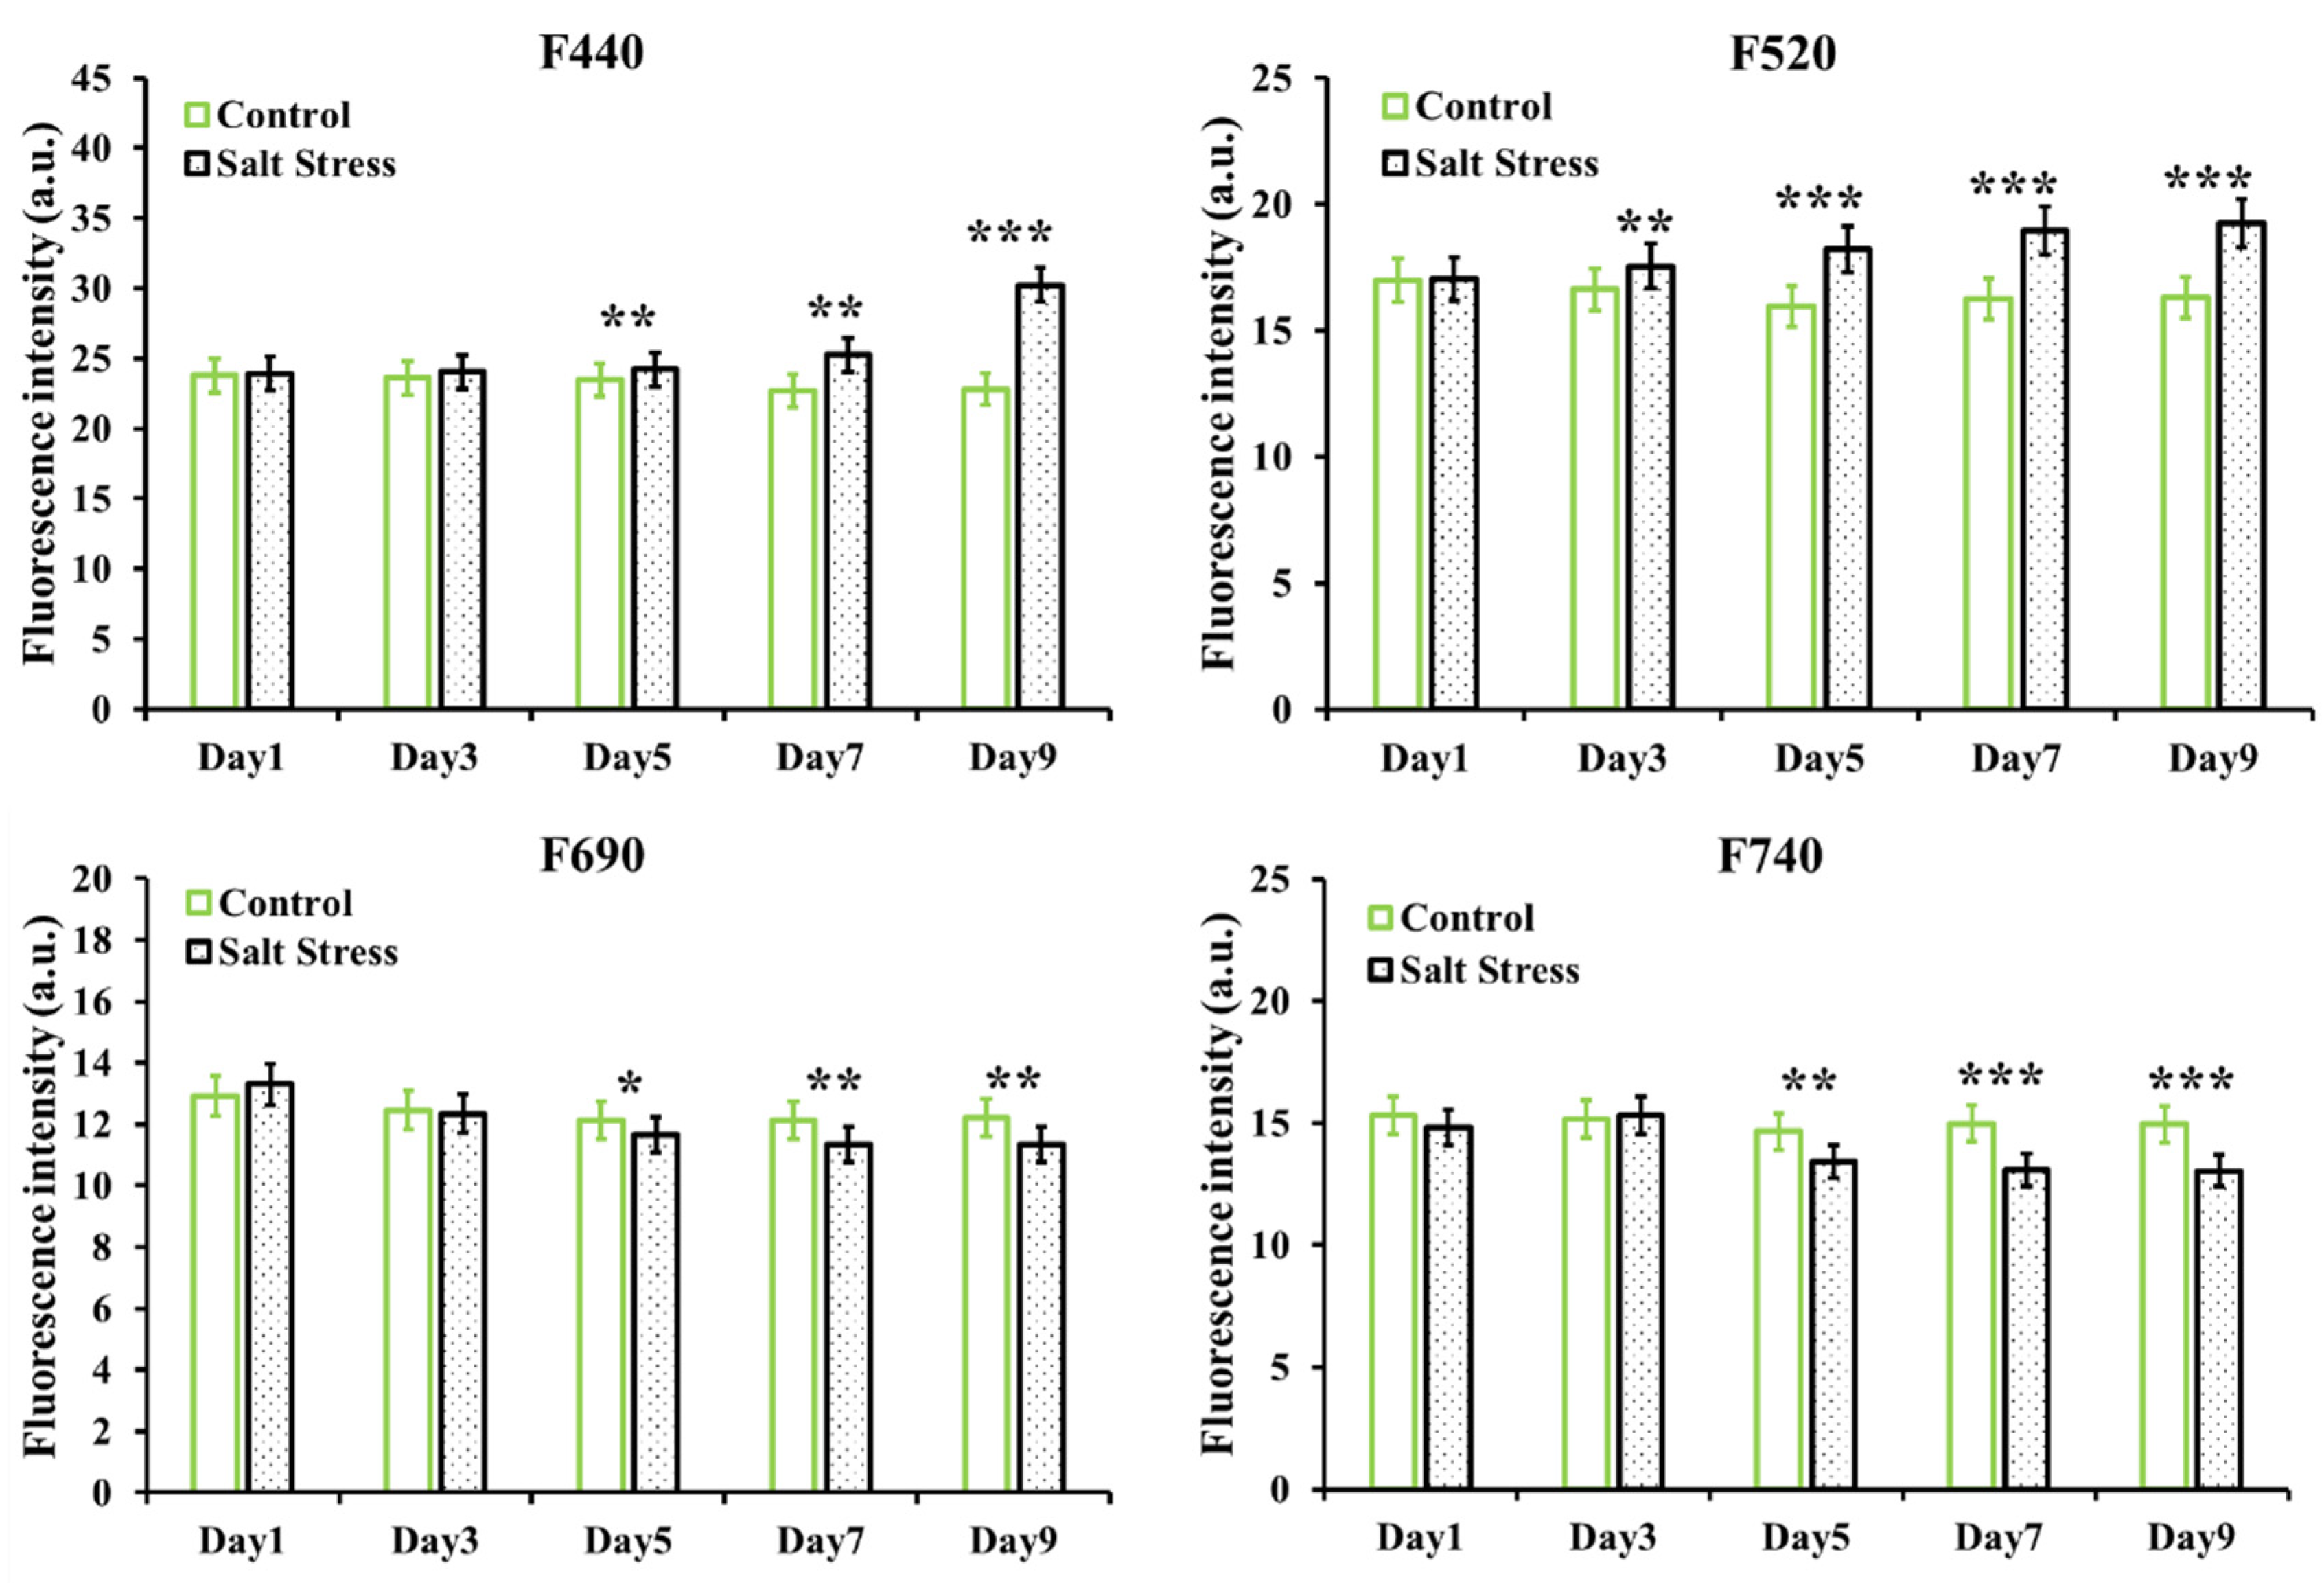
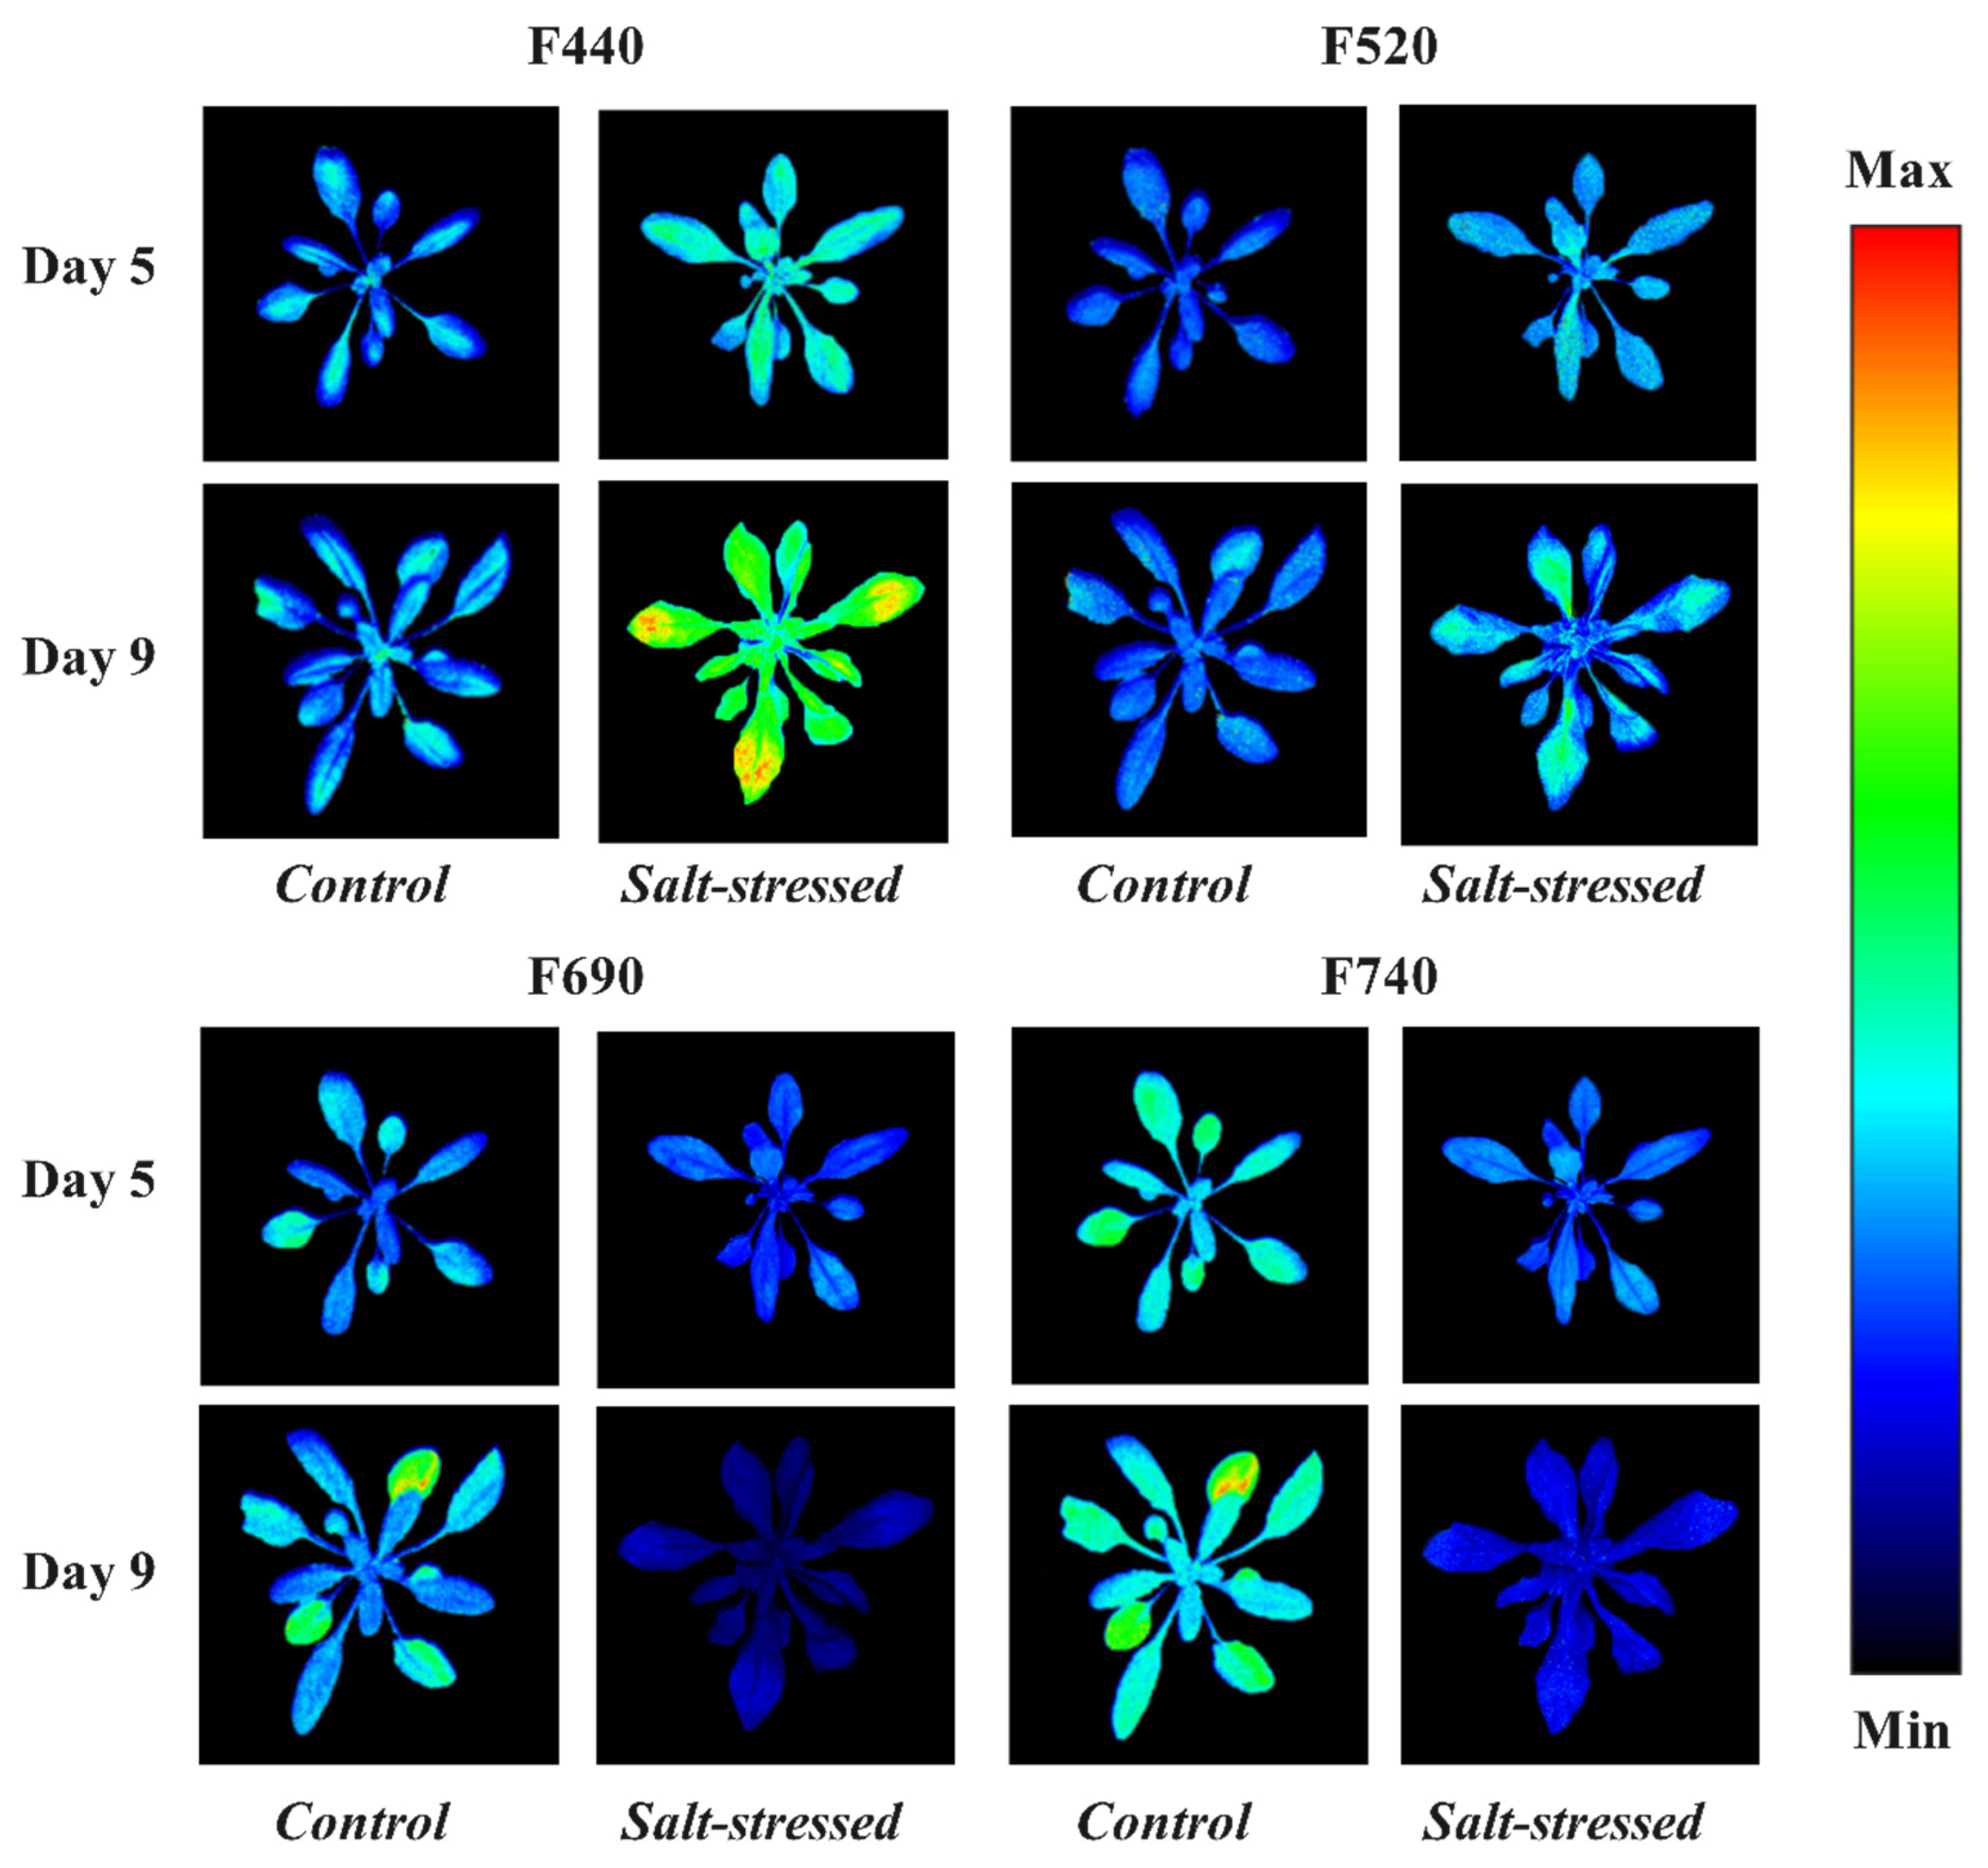
3.2. Effect of Salt Stress on Basic Fluorescence Parameters of Arabidopsis Leaves

From the multicolor fluorescence images in the 440 nm, 520 nm, 690 nm, and 740 nm regions, four basic multicolor fluorescence parameters were derived (F440, F520, F690, and F740), and these multicolor fluorescence parameters and pseudo-color images are shown in Figure 3 and Figure 4. Differences in the four parameters between the control and salt-stressed plants were observed at day 1, 3, 5, 7, and 9 after treatments by using ANOVA analysis (Figure 3). It was found that the values of F440 and F520 for the control were relatively consistent during plant growth, while the salt-stressed plants showed statistically significant increases in F440 and F520 starting from day 5 and day 3 after salt-stress treatment, respectively. However, the values of F690 and F740 decreased after salt-stress treatment, and the difference of these values under the control and salt-stress treatment condition was obvious from day 5 after salt-stress treatment. These differences caused by salt tress became more significant between the control and salt-stressed plants from day 3 after salt stress treatment.
To visualize the effect of salt stress on Arabidopsis plants, the representative pseudo-color images of control and salt-stressed plants at day 5 and 9 after treatments are shown in Figure 4. When viewing the blue and green fluorescence images, it could be found that the fluorescence intensity of F440 and F520 increased considerably and salt stress could cause the spatial heterogeneities within the leaf level, specifically at the edge of leaves. However, the decreased signals of F690 and F740 appeared in the entire canopy from the red and far-red fluorescence images.
Often, F440 and F520 are treated as blue–green fluorescence (BGF), which could be primarily emitted from several phenolic compounds located in the cell walls of the epidermis or vacuoles of leaves [34,35]. According to the study by Lang et al., the blue fluorescence emission is often caused by several phenolic substance such as chlorogenic acid, caffeic acid, coumarins (aesculetin, scopoletin), and stilbenes (t-stilbene, rhaponticin), while the green fluorescence emission is derived from substances such as alkaloid berberine and the flavonoid quercetin [36]. Based on the previous study, salt stress could contribute to the significant accumulation of cinnamic acids and ferulic acid in salt-stressed plants over time, which could lead to the increase of F440 [37]. Yastreb et al. showed that the plants under salt stress could enhance the level of flavonoids and form a protective system against salt stress [38]. Thus, the increase of flavonoid content could be one of the reasons to explain the increase of F520. Additionally, a previous study reported that the exposure of Arabidopsis to salt stress resulted in a decline in chlorophyll content [29], which also could be a result of the increase of F460 and F520 since the reabsorption of blue–green fluorescence is reduced [39]. The chlorophyll-fluorescence emission spectra usually exhibits two emission maxima around 690 nm and 740 nm, which are termed F690 and F740 [40,41]. The decrease of F690 is partially caused by the in vivo chlorophyll (overlapping of absorption and fluorescence emission bands of chlorophyll a forms) [42,43]. The far-red chlorophyll fluorescence band F740 is not affected by this re-absorption process [44] and the decline of F740 with increasing chlorophyll loss as well as the breakdown of chlorophyll in salt-stressed plants over time.

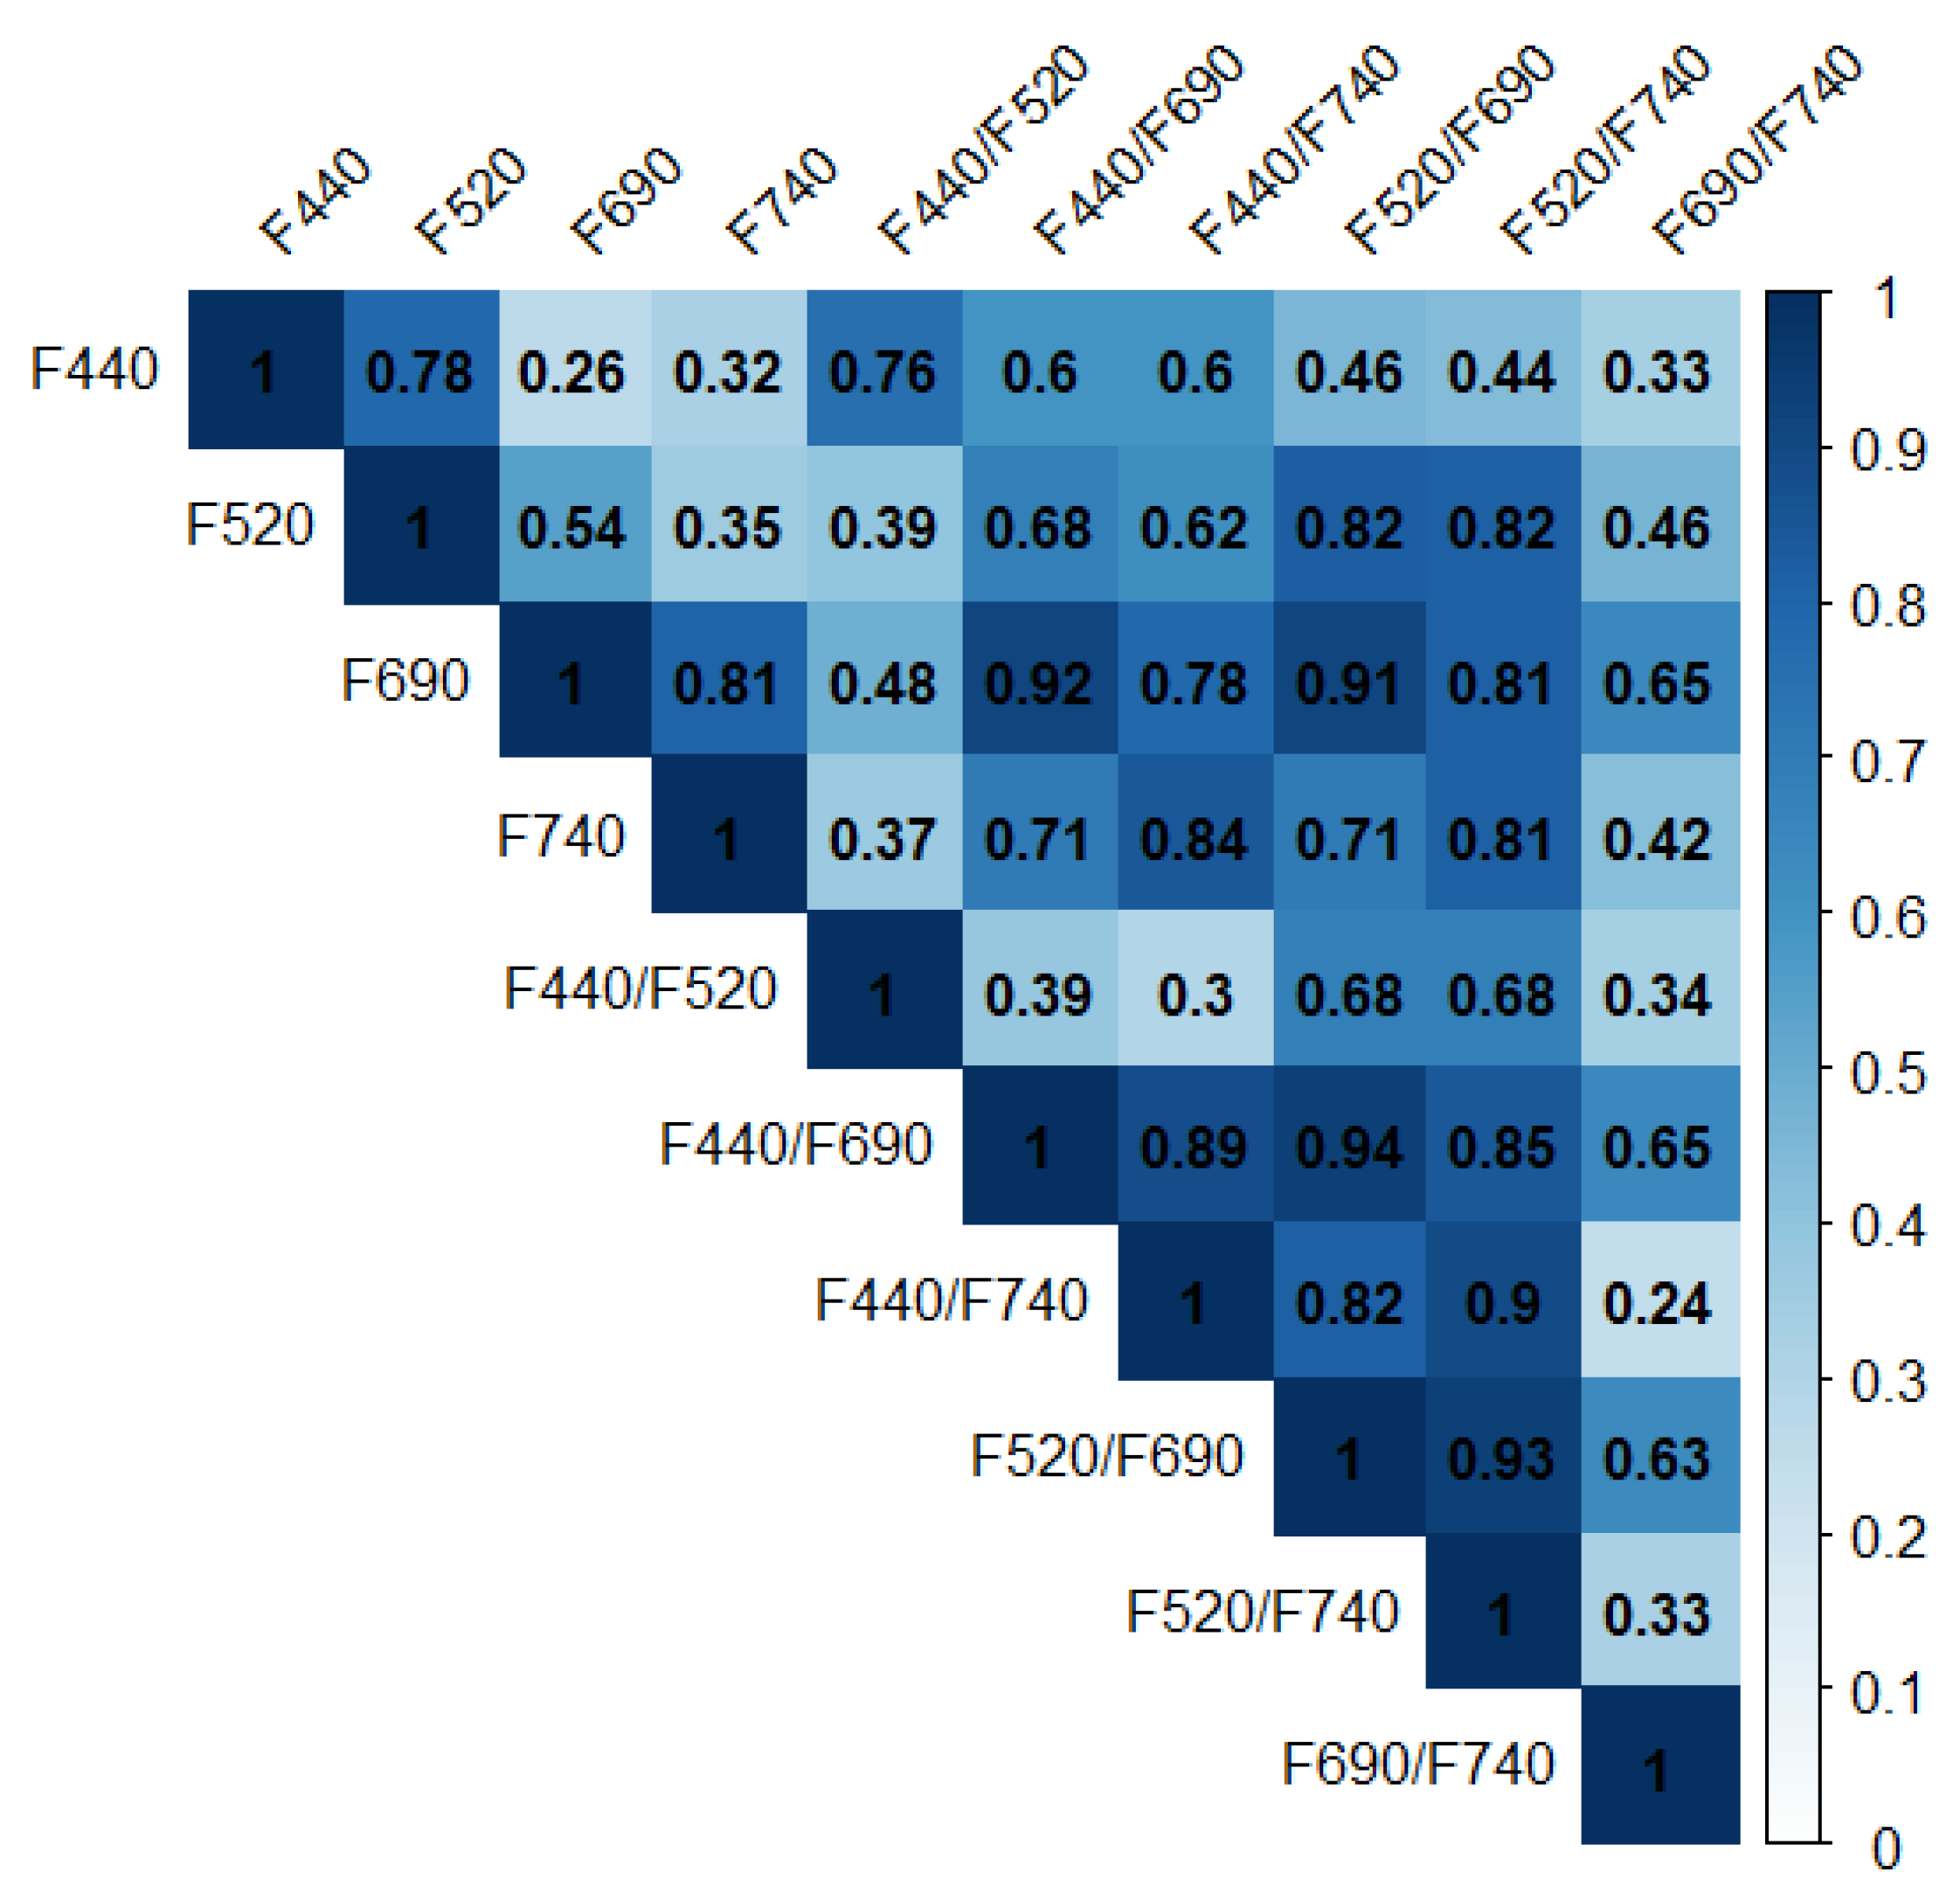
3.3. Correlation Analysis for Multicolor Fluorescence Parameters

From the effect of salt stress on basic multicolor fluorescence parameters, the consistent trends of F440 with F520 and F690 with F740 were observed, which indicated that a high correlation occurred between them. Thus, Pearson’s correlation analysis on these multicolor fluorescence parameters was conducted and the correlation detection matrix diagram of multicolor fluorescence parameters is shown in Figure 5. It can be observed that there were different degrees of correlation among the fluorescence parameters, indicating that these fluorescence parameters contain different types of information, but also have repeatability. Correlation analysis indicated that the extremely high correlation coefficients exceeding 0.85 appeared among F440/F690, F440/F740, F520/F690, and F520/F740. The high correlation coefficients exceeding 0.7 appeared in the feature values including F440 with F520, F690 with F740, F690 with F440/F740 and F520/F740, and F740 with F440/F690 and F520/F690. Although these parameters were related to class label, there was redundancy. Hence, a data dimension was needed to reduce the redundant information and construct the optimized detection model for salt stress.

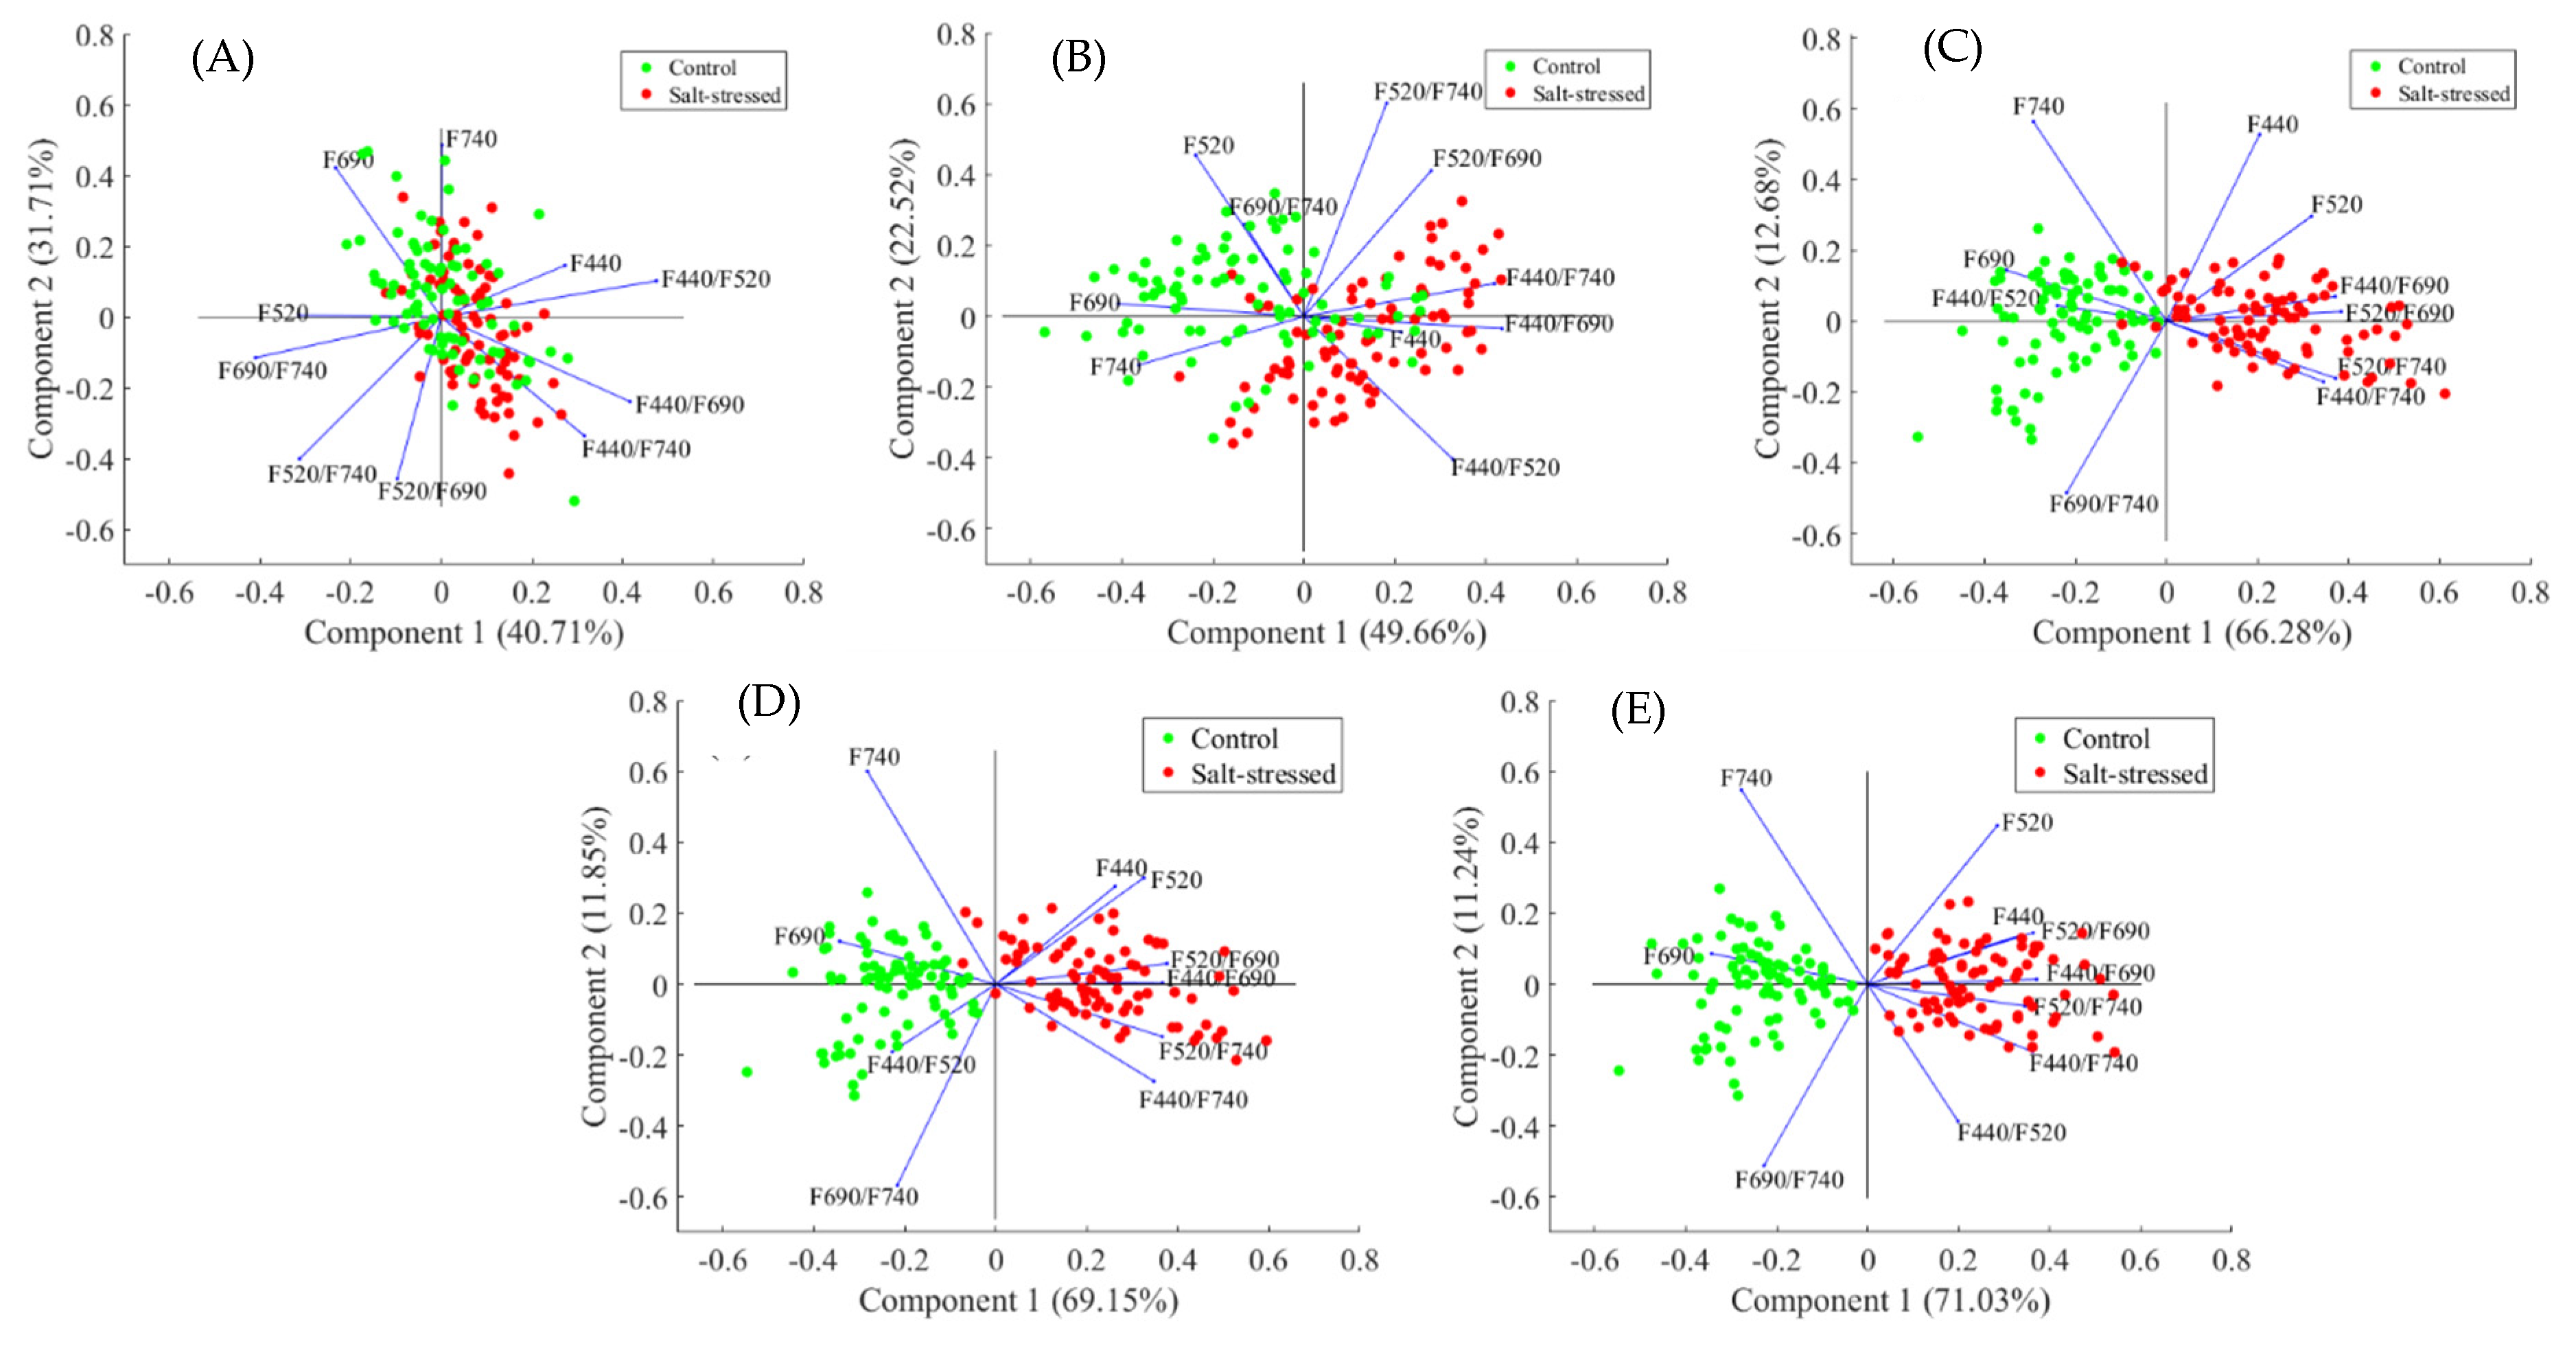
3.4. Principal Component Analysis of Effect of Salt Stress in Arabidopsis

The feature information contained from the high correlation feature values was also highly similar to the data represented in Figure 5, and thus there was a need to reduce the redundant information and simultaneously decrease the dimension of data for constructing an optimal classification model. Therefore, principal component analysis (PCA) was used to reduce the dimensionality of the preprocessed multi-dimension data, and its first several components can express most of the contributions of the original data. In this study, principal component analysis (PCA) with these fluorescence parameters obtained from fluorescence images of the control and salt-stressed plants was performed at day 1, 3, 5, 7, and 9, respectively. It was found that the first two components could explain over 70% of the total variances in the vector graph at day 1, 3, 5, 7, and 9, respectively (Figure 6), and their contribution rate increased from 72% to 82% over the treatment time. Additionally, principal component analysis showed that the control and salt-stressed samples were gathered in whole at day 1 after treatment, while they were gradually clustered into two groups from day 5 after treatment and the control samples were grouped on the left side and the salt-stressed samples were clustered on the right side with higher values of PC1 based on an overall analysis (Figure 6). However, the clustering ability for the control and the salt-stressed plants based on the PC2 score was not as good as that based on PC1. This demonstrated that the distribution of salt-stressed plants was strongly related to the increased value of the PC1 score.
In order to further understand changes of the functional and structural information of secondary metabolism in salt-stressed plants, the effects of each multicolor parameter on the first several principal components were also taken into consideration. According to PCA at day 1, 3, 5, 7, and 9, respectively, the contribution rate of the first four components could obtain 99%, which could explain most of the variance in the original data, so the relative “contribution” of each multicolor parameter to the formation of the four components was then used for further analysis. The component matrix details the factor loadings onto the four components. The loading matrix of the variables onto the components at day 1, 3, 5, 7, and 9 are shown in Supplementary Table S1. The names addressed to each component were based on an understanding of the content of the variables. PC1 was the most dominant pattern in the four principal components and its contribution rate increased from 40.71% at day 1 to 71.03% at day 9, whereas each of the remaining three principal components was varied between 11.24–31.77% (PC2), 10.40–21.5% (PC3), and 5.78–12.45% (PC4) of the variance.
From the data represented in Supplementary Table S1, it can be observed that the parameters for the formation of the four principal components differentially responded to salt stress at day 1 and day 3 after treatment. However, with the extension of treatment time, there were some common fluorescence parameters with high positive values in the first four components, such as F440/F690, F440/F740, F520/F690, F520/F740 in PC1, F740 in PC2, and F440/F520 in PC3. It was indicated that these parameters were more sensitive indicators of gradients or changes in fluorescence emission over the leaf surface and presented a relatively high contribution for the detection of salt stress compared to other parameters. The significant changes of the fluorescence ratios, including F440/F690, F440/F740, F520/F690, and F520/F740, were a result of the decline of the red and far-red fluorescence and the increase of the blue–green fluorescence. Although there was no doubt that the sensitivity of the different multicolor parameters to salt stress varied in its degree, the first four components extracted from these fluorescence parameters based on PCA could explain approximately 99% of the variance in these parameters. Additionally, the highest coefficient with a positive value in each principal component was different, which indicated that principal component analysis was an appropriate approach to fuse multidimensional data and preserve valid information to the maximum extent possible. After principal component analysis, it could be found that the contribution rate in PC1 increased with the decline of the contribution rate in the remaining three principal components, but they still accounted for a significant proportion. Therefore, the four principal component combinations could be considered as the input for SVM model to detect salt stress in plants.

3.5. Classification Model for Salt Stress Detection

Multicolor fluorescence imaging could visualize the changes in plant with salt-stress treatment and provide information about the primary and secondary metabolism of plants. The changes of fluorescence parameters could be used to detect the growth status of plants combining machine learning. Therefore, the classification models at different salt-stressed levels were constructed with the SVM classifier using the four fluorescence feature combinations selected by PCA, and the results are summarized in Table 1. It was found that at day 1 and day 3 after treatment, the overall accuracies were 60.29% and 73.53%, respectively, while the accuracy of the classification model was 98.53% at day 9 after treatment. This implied that the degree of difference caused by salt stress varied in different stress times and growth stages.
The results of the classification showed that the detection accuracy of the SVM model was low at day 1 and 3 after salt-stress treatment, which was due to the fact that the earlier changes caused by salt stress in the metabolite were not significant [32]. With the elongation of stress time, however, these differences also became more significant and the overall accuracy obtained was 90% starting from day 5, when few visual symptoms were observed from the RGB images. This revealed that the salt stress could be detected using multicolor fluorescence imaging at the early stage, and the SVM classifier with PCA selection showed a good performance for classifying healthy and salt-stressed plants.

4. Conclusions

In this study, the fluorescence images of normal growing and salt-stressed plants were acquired using multicolor fluorescence imaging, from which the difference of the growth status of plants could be significantly visualized after 5 days of salt-stress treatment. The results from PCA showed that the control and salt-stressed plants can be potentially distinguished by basic multicolor fluorescence parameters and their ratio values. The four fluorescence feature combinations selected by PCA were used as inputs to establish a SVM classifier with an overall accuracy of 92% for salt-stressed plants after salt treatment for 5 days. Additionally, the classification accuracy gradually increased to 98% at day 9 after salt-stress treatment, which demonstrated that multicolor fluorescence imaging has the potential to be used as a diagnostic tool to assess salt stress in plants. This study provides a reference for detecting salt-stressed plants by multicolor fluorescence imaging and its application in other salt-stressed crops. Further development of the technique would be desirable in order to facilitate its applicability in accessing plant stress and relative breeding programs.

Supplementary Materials

The following are available online at https://www.mdpi.com/article/10.3390/agronomy11122577/s1, Table S1: Factor loading matrix of the four principal components.

Author Contributions

Y.T. and L.X. designed and performed the experiment. Y.T. and L.X. wrote the manuscript, and H.W. and D.Y. provided suggestions on the results and discussion section. M.W., B.Y. and C.I. helped to revise the manuscript. Y.T. and L.X. contributed equally to this work. All authors have read and agreed to the published version of the manuscript.

Funding

This work was supported by the High Peak Plateau Subject Project of Fujian Province (712018014), the Interdisciplinary Integration Promoting the Development of Smart Agriculture of Fujian Agriculture and Forestry University (000/71202103B), and the Excellent Master thesis Funding Fund of Fujian Agriculture and Forestry University (1122YS01004).

Institutional Review Board Statement

Not applicable.

Informed Consent Statement

Not applicable.

Data Availability Statement

Not applicable.

Conflicts of Interest

The authors declare no conflict of interest.

References

  1. Gupta, B.; Huang, B. Mechanism of Salinity Tolerance in Plants: Physiological, Biochemical, and Molecular Characterization. Int. J. Genom. 2014, 2014, e701596. [Google Scholar] [CrossRef]
  2. Iqbal, N.; Umar, S.; Khan, N.A.; Khan, M.I.R. A New Perspective of Phytohormones in Salinity Tolerance: Regulation of Proline Metabolism. Environ. Exp. Bot. 2014, 100, 34–42. [Google Scholar] [CrossRef]
  3. Yuan, Y.; Shu, S.; Li, S.; He, L.; Li, H.; Du, N.; Sun, J.; Guo, S. Effects of Exogenous Putrescine on Chlorophyll Fluorescence Imaging and Heat Dissipation Capacity in Cucumber (Cucumis Sativus L.) under Salt Stress. J. Plant Growth Regul. 2014, 33, 798–808. [Google Scholar] [CrossRef]
  4. Läuchli, A.; Grattan, S.R. Plant Growth and Development under Salinity Stress. In Advances in Molecular Breeding Toward Drought and Salt Tolerant Crops; Jenks, M.A., Hasegawa, P.M., Jain, S.M., Eds.; Springer: Dordrecht, The Netherlands, 2007; pp. 1–32. ISBN 978-1-4020-5578-2. [Google Scholar]
  5. Negrão, S.; Schmöckel, S.M.; Tester, M. Evaluating Physiological Responses of Plants to Salinity Stress. Ann. Bot. 2017, 119, 1–11. [Google Scholar] [CrossRef] [Green Version]
  6. Osakabe, Y.; Osakabe, K.; Shinozaki, K.; Tran, L.-S. Response of Plants to Water Stress. Front. Plant Sci. 2014, 5, 86. [Google Scholar] [CrossRef] [Green Version]
  7. Hasanuzzaman, M.; Nahar, K.; Alam, M.M.; Roychowdhury, R.; Fujita, M. Physiological, Biochemical, and Molecular Mechanisms of Heat Stress Tolerance in Plants. Int. J. Mol. Sci. 2013, 14, 9643–9684. [Google Scholar] [CrossRef]
  8. Li, L.; Zhang, Q.; Huang, D. A Review of Imaging Techniques for Plant Phenotyping. Sensors 2014, 14, 20078–20111. [Google Scholar] [CrossRef]
  9. Payne, W.Z.; Kurouski, D. Raman Spectroscopy Enables Phenotyping and Assessment of Nutrition Values of Plants: A Review. Plant Methods 2021, 17, 78. [Google Scholar] [CrossRef]
  10. Alvarez, J.; Martinez, E.; Diezma, B. Application of Hyperspectral Imaging in the Assessment of Drought and Salt Stress in Magneto-Primed Triticale Seeds. Plants 2021, 10, 835. [Google Scholar] [CrossRef]
  11. Chan, C.; Nelson, P.R.; Hayes, D.J.; Zhang, Y.-J.; Hall, B. Predicting Water Stress in Wild Blueberry Fields Using Airborne Visible and Near Infrared Imaging Spectroscopy. Remote Sens. 2021, 13, 1425. [Google Scholar] [CrossRef]
  12. Park, E.; Kim, Y.-S.; Omari, M.K.; Suh, H.-K.; Faqeerzada, M.A.; Kim, M.S.; Baek, I.; Cho, B.-K. High-Throughput Phenotyping Approach for the Evaluation of Heat Stress in Korean Ginseng (Panax Ginseng Meyer) Using a Hyperspectral Reflectance Image. Sensors 2021, 21, 5634. [Google Scholar] [CrossRef]
  13. Krishna, G.; Sahoo, R.N.; Singh, P.; Patra, H.; Bajpai, V.; Das, B.; Kumar, S.; Dhandapani, R.; Vishwakarma, C.; Pal, M.; et al. Application of Thermal Imaging and Hyperspectral Remote Sensing for Crop Water Deficit Stress Monitoring. Geocarto Int. 2021, 36, 481–498. [Google Scholar] [CrossRef]
  14. Zhou, J.; Chen, H.; Zhou, J.; Fu, X.; Ye, H.; Nguyen, H.T. Development of An Automated Phenotyping Platform for Quantifying Soybean Dynamic Responses to Salinity Stress in Greenhouse Environment. Comput. Electron. Agric. 2018, 151, 319–330. [Google Scholar] [CrossRef]
  15. Al-Rahbi, S.; Al-Mulla, Y.A.; Jayasuriya, H.; Choudri, B. Analysis of True-Color Images from Unmanned Aerial Vehicle to Assess Salinity Stress on Date Palm. JARS 2019, 13, 034514. [Google Scholar] [CrossRef]
  16. Struthers, R.; Ivanova, A.; Tits, L.; Swennen, R.; Coppin, P. Thermal Infrared Imaging of The Temporal Variability in Stomatal Conductance for Fruit Trees. Int. J. Appl. Earth Obs. Geoinf. 2015, 39, 9–17. [Google Scholar] [CrossRef]
  17. Lee, A.Y.; Kim, S.Y.; Hong, S.J.; Han, Y.; Choi, Y.; Kim, M.; Yun, S.K.; Kim, G. Phenotypic Analysis of Fruit Crops Water Stress Using Infrared Thermal Imaging. J. Biosyst. Eng. 2019, 44, 87–94. [Google Scholar] [CrossRef]
  18. Feng, X.; Zhan, Y.; Wang, Q.; Yang, X.; Yu, C.; Wang, H.; Tang, Z.; Jiang, D.; Peng, C.; He, Y. Hyperspectral Imaging Combined with Machine Learning as A Tool to Obtain High-Throughput Plant Salt-Stress Phenotyping. Plant J. 2020, 101, 1448–1461. [Google Scholar] [CrossRef]
  19. Simko, I.; Hayes, R.J.; Furbank, R.T. Non-Destructive Phenotyping of Lettuce Plants in Early Stages of Development with Optical Sensors. Front. Plant Sci. 2016, 7, 1985. [Google Scholar] [CrossRef] [PubMed] [Green Version]
  20. Buschmann, C.; Langsdorf, G.; Lichtenthaler, H.K. Imaging of the Blue, Green, and Red Fluorescence Emission of Plants: An Overview. Photosynthetica 2000, 38, 483–491. [Google Scholar] [CrossRef]
  21. Buschmann, C.; Lichtenthaler, H.K. Principles and Characteristics of Multi-Colour Fluorescence Imaging of Plants. J. Plant Physiol. 1998, 152, 297–314. [Google Scholar] [CrossRef]
  22. Cerovic, Z.G.; Samson, G.; Morales, F.; Tremblay, N.; Moya, I. Ultraviolet-Induced Fluorescence for Plant Monitoring: Present State and Prospects. Agronomie 1999, 19, 543–578. [Google Scholar] [CrossRef] [Green Version]
  23. Pérez-Bueno, M.L.; Pineda, M.; Cabeza, F.M.; Barón, M. Multicolor Fluorescence Imaging as a Candidate for Disease Detection in Plant Phenotyping. Front. Plant Sci. 2016, 7, 1790. [Google Scholar] [CrossRef] [Green Version]
  24. Pineda, M.; Pérez-Bueno, M.L.; Paredes, V.; Barón, M.; Pineda, M.; Pérez-Bueno, M.L.; Paredes, V.; Barón, M. Use of Multicolour Fluorescence Imaging for Diagnosis of Bacterial and Fungal Infection on Zucchini by Implementing Machine Learning. Funct. Plant Biol. 2017, 44, 563–572. [Google Scholar] [CrossRef] [Green Version]
  25. Yao, J.; Sun, D.; Cen, H.; Xu, H.; Weng, H.; Yuan, F.; He, Y. Phenotyping of Arabidopsis Drought Stress Response Using Kinetic Chlorophyll Fluorescence and Multicolor Fluorescence Imaging. Front. Plant Sci. 2018, 9, 603. [Google Scholar] [CrossRef]
  26. Hsiao, S.C.; Chen, S.; Yang, I.C.; Chen, C.T.; Tsai, C.-Y.; Chuang, Y.K.; Wang, F.J.; Chen, Y.L.; Lin, T.S.; Lo, Y.M. Evaluation of Plant Seedling Water Stress Using Dynamic Fluorescence Index with Blue LED-Based Fluorescence Imaging. Comput. Electron. Agric. 2010, 72, 127–133. [Google Scholar] [CrossRef]
  27. Tremblay, N.; Wang, Z.; Cerovic, Z.G. Sensing Crop Nitrogen Status with Fluorescence Indicators. A Review. Agron. Sustain. Dev. 2012, 32, 451–464. [Google Scholar] [CrossRef] [Green Version]
  28. Yuan, F.; Yang, H.; Xue, Y.; Kong, D.; Ye, R.; Li, C.; Zhang, J.; Theprungsirikul, L.; Shrift, T.; Krichilsky, B.; et al. OSCA1 Mediates Osmotic-Stress-Evoked Ca2+ Increases Vital for Osmosensing in Arabidopsis. Nature 2014, 514, 367–371. [Google Scholar] [CrossRef] [PubMed]
  29. Stepien, P.; Johnson, G.N. Contrasting Responses of Photosynthesis to Salt Stress in the Glycophyte Arabidopsis and the Halophyte Thellungiella: Role of the Plastid Terminal Oxidase as an Alternative Electron Sink. Plant Physiol. 2009, 149, 1154–1165. [Google Scholar] [CrossRef] [Green Version]
  30. Jolliffe, I.T.; Cadima, J. Principal Component Analysis: A Review and Recent Developments. Philos. Trans. R. Soc. A Math. Phys. Eng. Sci. 2016, 374, 20150202. [Google Scholar] [CrossRef] [PubMed]
  31. Álvarez-Alvarado, J.M.; Ríos-Moreno, J.G.; Obregón-Biosca, S.A.; Ronquillo-Lomelí, G.; Ventura-Ramos, E.; Trejo-Perea, M. Hybrid Techniques to Predict Solar Radiation Using Support Vector Machine and Search Optimization Algorithms: A Review. Appl. Sci. 2021, 11, 1044. [Google Scholar] [CrossRef]
  32. Zhang, Y.; Xiao, D.; Liu, Y. Automatic Identification Algorithm of the Rice Tiller Period Based on PCA and SVM. IEEE Access 2021, 9, 86843–86854. [Google Scholar] [CrossRef]
  33. Awlia, M.; Nigro, A.; Fajkus, J.; Schmoeckel, S.M.; Negrão, S.; Santelia, D.; Trtílek, M.; Tester, M.; Julkowska, M.M.; Panzarová, K. High-Throughput Non-Destructive Phenotyping of Traits That Contribute to Salinity Tolerance in Arabidopsis Thaliana. Front. Plant Sci. 2016, 7, 1414. [Google Scholar] [CrossRef] [PubMed] [Green Version]
  34. Stober, F.; Lang, M.; Lichtenthaler, H.K. Blue, Green, and Red Fluorescence Emission Signatures of Green, Etiolated, and White Leaves. Remote Sens. Environ. 1994, 47, 65–71. [Google Scholar] [CrossRef]
  35. Stober, F.; Lichtenthaler, H.K. Studies on the Localization and Spectral Characteristics of the Fluorescence Emission of Differently Pigmented Wheat Leaves. Bot. Acta 1993, 106, 365–370. [Google Scholar] [CrossRef]
  36. Lang, M.; Stober, F.; Lichtenthaler, H.K. Fluorescence Emission Spectra of Plant Leaves and Plant Constituents. Radiat. Environ. Biophys. 1991, 30, 333–347. [Google Scholar] [CrossRef]
  37. Wu, D.; Cui, M.; Hao, Y.; Liu, L.; Zhou, Y.; Wang, W.; Xue, A.; Chingin, K.; Luo, L. In Situ Study of Metabolic Response of Arabidopsis Thaliana Leaves to Salt Stress by Neutral Desorption-Extractive Electrospray Ionization Mass Spectrometry. J. Agric. Food Chem. 2019, 67, 12945–12952. [Google Scholar] [CrossRef]
  38. Yastreb, T.O.; Kolupaev, Y.E.; Lugovaya, A.A.; Dmitriev, A.P. Content of osmolytes and flavonoids under salt stress in Arabidopsis thaliana plants defective in jasmonate signaling. Prikl. Biokhim. Mikrobiol. 2016, 52, 223–229. [Google Scholar] [CrossRef]
  39. Lichtenthaler, H.K.; Miehé, J.A. Fluorescence Imaging as a Diagnostic Tool for Plant Stress. Trends Plant Sci. 1997, 2, 316–320. [Google Scholar] [CrossRef]
  40. Hák, R.; Lichtenthaler, H.K.; Rinderle, U. Decrease of the Chlorophyll Fluorescence Ratio F690/F730 during Greening and Development of Leaves. Radiat. Environ. Biophys. 1990, 29, 329–336. [Google Scholar] [CrossRef] [PubMed]
  41. Lichtenthaler, H.K. Multi-Colour Fluorescence Imaging of Photosynthetic Activityand Plant Stress. Photosynthetica 2021, 59, 364–380. [Google Scholar] [CrossRef]
  42. Lichtenthaler, H.K.; Rinderle, U. The Role of Chlorophyll Fluorescence in the Detection of Stress Conditions in Plants. CRC Crit. Rev. Anal. Chem. 1988, 19, S29–S85. [Google Scholar] [CrossRef]
  43. Solti, Á. F690-F740 Is More Suitable than F690/F740 for Mapping the Regeneration of Cd-Induced Chlorosis in Poplar Leaves by Fluorescence Imaging. Acta Biol. Szeged. 2008, 52, 191–194. [Google Scholar]
  44. Lichtenthaler, H.K.; Langsdorf, G.; Buschmann, C. Multicolor Fluorescence Images and Fluorescence Ratio Images of Green Apples at Harvest and during Storage. Isr. J. Plant Sci. 2012, 60, 97–106. [Google Scholar] [CrossRef]
Figure 1. Schematic representation of MFI system used in this study.
Agronomy 11 02577 g001
Figure 2. (A) RGB images of Arabidopsis in control and salt-stress treatment at day1, 3, 5, 7, and 9, respectively. (B) Projected leaf area over time in control and salt-stressed conditions. Error bars represent standard error. The significant differences between control and salt treatment are indicated with * and ** for p-values below 0.05 and 0.01, respectively.
Agronomy 11 02577 g002
Figure 3. Natural variation in basic multicolor fluorescence parameters including F440, F520, F690, and F740 of Arabidopsis under salt-stress treatment. Error bars represent standard error. Significant differences between control and salt-stress treatment are indicated with *, **, and *** for p-values below 0.05, 0.01, and 0.001, respectively.
Agronomy 11 02577 g003
Figure 4. Pseudo-color images of F440, F520, F690, and F740 parameters of Arabidopsis under control and salt-stress treatment. Representative images for F440 and F520 at day 5 and day 9 and that of F690 and F740 at day 5 and day 9 after salt-stress treatment. The color code depicted at the right of the images ranges from black (minimum value) to red (maximum value).
Agronomy 11 02577 g004
Figure 5. Pearson’s correlation coefficient heat map of multicolor fluorescence parameters.
Agronomy 11 02577 g005
Figure 6. Principal component analysis of variability of multicolor parameters in control and salt-stressed plants at day 1 (A), day 3 (B), day 5 (C), day 7 (D), and day 9 (E), respectively. The vectors orientation and length represent the correlation among the variables and the contribution for eaxplaining the principal components 1 and 2.
Agronomy 11 02577 g006
Table 1. Support vector machine (SVM) classification results of control and salt-stressed plants based on multicolor fluorescence feature combinations selected by principal component analysis (PCA).
Salt-Stressed TimeTraining Sample NumberTesting Sample NumberAccuracy (%)
ControlSalt-StressedOverall
Day 15006858.8261.7660.29
Day 36870.5976.4773.53
Day 56894.1291.1892.65
Day 76897.0694.1295.59
Day 96810097.0698.53
Publisher’s Note: MDPI stays neutral with regard to jurisdictional claims in published maps and institutional affiliations.

