Article

A Quantitative Review of Irrigation Development in the Yazoo–Mississippi Delta from 1991 to 2020

by
Tsz Him Lo
1,* and
H. C. (Lyle) Pringle III
2
1
National Center for Alluvial Aquifer Research, Mississippi State University, Stoneville, MS 38776, USA
2
Delta Research and Extension Center, Mississippi State University, Stoneville, MS 38776, USA
*
Author to whom correspondence should be addressed.
Agronomy 2021, 11(12), 2548; https://doi.org/10.3390/agronomy11122548
Submission received: 31 October 2021 / Revised: 2 December 2021 / Accepted: 10 December 2021 / Published: 15 December 2021

Abstract

:
The Yazoo–Mississippi Delta is one of the regions within the Lower Mississippi River Basin where substantial irrigation development and consequent groundwater depletion have occurred over the past three decades. To describe this irrigation development, a study was conducted to analyze existing geospatial datasets and to synthesize the results with those of past government surveys. The effort produced a quantitative review characterizing three aspects of irrigation development from 1991 to 2020. First, the expansion of irrigated area was tracked in terms of absolute area and in terms of fraction relative to total land or cropland area. Second, trends in irrigated land cover were traced in terms of irrigated crop mix, irrigated fractions of main crops, and comparisons with non-irrigated land. Third, changes in irrigation systems were examined in terms of water sources, energy sources, and application methods. Original findings of this study for the end of 2020 included moderate positive spatial autocorrelation in the density of irrigated areas; a higher irrigated crop preference for soybean and rice over cotton and corn in highly hydric soils; and 91% and 3% of permitted areas studied being respectively under groundwater withdrawal permits exclusively and under surface water diversion permits exclusively. By compiling such information, this paper can serve as a convenient reference on the recent history and status of irrigation development in the Yazoo–Mississippi Delta.

1. Introduction

The Yazoo–Mississippi Delta (locally and hereafter referred to as “the Delta”) is the portion of the Mississippi River valley that lies within northwestern Mississippi, USA. This alluvial plain is bounded by the Mississippi River in the west and by loess bluffs in the east. Once a swampy region, it was gradually cleared, drained, leveed, and converted to agriculture [1]. Although annual precipitation is abundant, rainfall deficits occur frequently during the warmer months [2]. Irrigation, therefore, can protect crops from drought stress and thus can increase yields. Likewise, the ability to refill ponds during dry times allows catfish ponds to be stocked year round and aquatic habitat to be created on demand for wildlife conservation. Given these benefits, significant and increasing amounts of surface water and groundwater resources have been developed to support these agricultural and environmental activities [3].
Widespread pumping from the shallow alluvial aquifer has advanced the Delta economy but has also created a water quantity challenge [4]. The existence of low-permeability layers in the vadose zone at many locations across the Delta causes direct local groundwater recharge to be slower than expected based on rainfall [5]. Groundwater levels have declined [6], and stream baseflow has been reduced [7]. In response, governmental, university, and private stakeholders have been working to understand and address the problem. This special issue of Agronomy is one of the many endeavors in that vein.
Given the well-established connection between irrigation withdrawals and water availability in the Delta [8], the overall goal of the present paper is to document quantitatively the irrigation development in the Delta from 1991 to 2020. This paper should not be misinterpreted as an authoritative report on water withdrawal permits in the Delta. Instead, the specific objectives are to identify and discuss the spatial patterns and/or temporal trends in (1) irrigated area, (2) irrigated land cover, and (3) irrigation systems. This information will serve as important context for the rest of the special issue focusing on farmer perceptions and adoption of irrigation best management practices in the Lower Mississippi River Basin (LMRB), of which the Delta is a part.
Besides the global significance of the Delta as an agricultural exporter, the Delta is of international interest as a less common example of a humid region that has experienced rapid irrigation development and considerable groundwater decline. Relevant background from this paper will facilitate the understanding and application of Delta irrigation research for the benefit of other humid regions around the world. Furthermore, specific patterns and trends of irrigation development in the Delta can be compared and contrasted with those in other regions. A previous study had reviewed the temporal trends in irrigated area and irrigated crop choice from 1969 to 2017 for the aggregate of 44 LMRB counties/parishes [9], some of which are located in the Delta. However, the present paper makes a distinct contribution to the literature by its narrower spatiotemporal scope but finer spatial and interpretative detail; its coverage of water sources, energy sources, and application methods (all closely related to the topic of the special issue); and its original geospatial analysis for the end of 2020 with datasets on water resources permitting, land cover, and soil hydric ratings.

2. Materials and Methods

2.1. Data Sources

2.1.1. Government Surveys

This study relied on two government surveys administered by the United States Department of Agriculture’s (USDA) National Agricultural Statistics Service (NASS). The agency collected responses from individual farms and then aggregated the results for reporting. For both surveys, relevant values that were withheld by NASS were estimated based on other NASS-provided values to the best of the authors’ abilities.
One survey was the Farm and Ranch Irrigation Survey (FRIS; renamed as the Irrigation and Water Management Survey in 2018) [10]. During the study period, it was conducted in 1994, 1998, 2003, 2008, 2013, and 2018. From FRIS, this study obtained state-level information on irrigation systems—their water sources, energy sources, and application methods. Because the vast majority of irrigation in the state of Mississippi occurred within the Delta (a locally known fact that was verified by this study), the statewide information was assumed to be generally representative for the Delta. The FRIS data on energy sources included irrigated open areas regardless of water source in 1994 and 1998 but focused exclusively on groundwater irrigated open areas in 2003, 2008, 2013, and 2018.
The other survey was the Census of Agriculture (COA) [11]. During the study period, it was conducted in 1992, 1997, 2002, 2007, 2012, and 2017. From COA, this study obtained county-level information on irrigated area and irrigated land cover, particularly for the main Delta crops of soybean (Glycine max L.), cotton (Gossypium hirsutum L.), corn (Zea mays L.), and rice (Oryza sativa L.).

2.1.2. Geospatial Datasets

This study relied on five geospatial datasets, four of which were downloaded via the Internet. The Major Land Resource Area (MLRA) dataset [12] from the USDA’s Natural Resources Conservation Service (NRCS) assisted with the delineation of the Delta. County borders [13] from the Mississippi Automated Resource Information System and the State Soil Geographic dataset [14] from NRCS facilitated the investigation of spatial patterns within the Delta. The Cropland Data Layer dataset [15] from NASS provided annual land cover classifications.
To depict in greater detail the extent of irrigation development in the Delta at the end of the study period, an exported copy of the water resources permitting dataset from the Yazoo Mississippi Joint Water Management District (YMD) was used. Freshwater in the state of Mississippi is a property of the state. Entities must secure a groundwater permit for withdrawing from a well with a surface casing diameter of at least 0.15 m and a surface water permit for diverting water bodies that are not “wholly landlocked and privately owned” [16]. Such a permit is issued by the Mississippi Department of Environmental Quality but is processed by YMD if it is being requested for irrigation, aquaculture, or wildlife in the Delta. This study received a polygon shapefile representing permit boundaries and a spreadsheet listing the water source (i.e., groundwater or surface water), stated purpose, issue date, and expiration date of permits.

2.2. Processing and Analysis

The local definition of the Delta is the topographically mild area east of the Mississippi River and between Memphis, Tennessee, USA and Vicksburg, Mississippi, USA. In this study, the exact boundaries of the Delta were derived by clipping the MLRA 131A “Southern Mississippi River Alluvium” polygon to the Mississippi counties between DeSoto County to the north and Warren County to the south. Thus, the 19,146 km2 Delta contained the entirety of ten counties—Bolivar, Coahoma, Humphreys, Issaquena, Leflore, Quitman, Sharkey, Sunflower, Tunica, and Washington—and parts of nine counties—Carroll, DeSoto, Grenada, Holmes, Panola, Tallahatchie, Tate, Warren, and Yazoo (Figure 1a). The first list is hereafter referred to as “full-Delta counties”, whereas the second list is hereafter referred to as “part-Delta counties”. The collection of all 19 aforementioned counties is hereafter denoted as “all-Delta counties”.
A total of 216 soil associations were found inside the Delta. To consolidate for regional analysis, the soil associations were classified into one of three hydric classes based on their “hydclprs” attribute—the hydric percentage of that soil association. A third of the Delta was grouped into the low hydric class (hydclprs < 60), a sixth was grouped into the medium hydric class (60 ≤ hydclprs < 80), and a half was grouped into the high hydric class (80 ≤ hydclprs ≤ 100). Land in the low hydric class was primarily distributed along the Tallahatchie-Yazoo River, the Mississippi River, the loess bluffs, and Deer Creek (Figure 1b). Medium-textured and topographically high soils of the Commerce, Dubbs, and Dundee series were typical. Primarily along the Big Sunflower River and its tributaries, the medium hydric class consisted primarily of medium-fine textured soils such as those of the Forestdale series. The high hydric class was generally far from major streams and was dominated by clayey, low-lying soils such as those of the Sharkey and Alligator series.
Likewise, the land cover classification system of the Cropland Data Layer was simplified into eight basic land cover types (Table 1). The simplified 2017 layer was used to categorize permitted land into cropland (soybean, cotton, corn, rice, or other crops) and non-cropland (grass/trees, water, built surfaces). This allowed a fairer comparison with 2017 COA in terms of irrigated cropland and also avoided the land cover impact of widespread, extended flooding in the South Delta from 2019 to 2020. On the other hand, the simplified 2016–2020 layers were used to assess on permitted land the irrigated crop mix and the irrigated fraction of main crops. Averaging across 5 years reduced the influence of interannual variability and enabled a more representative portrayal of the situation at the end of the study period.
The exported copy of the permit dataset contained 25,773 permits. After filtering out those that were missing a stated purpose or were associated with a note indicating “never drilled”, “not used”, “replaced”, or “standby”, 22,876 permits remained to represent permitted land at the end of 2020 for the geospatial analysis of this study and were hereafter referred to as “studied permits”.
The aforementioned processing steps were performed in QGIS 3.12.1. For standardization, all datasets were projected to the Mississippi Transverse Mercator coordinate system (European Petroleum Survey Group (EPSG) code 3814) and were rasterized on the same 0.1 km × 0.1 km grid. These rasters were then converted to 2-D numerical matrices for spatial overlay analysis using Python 3.9.6 and its numpy 1.21.1 package [17]. For spatial autocorrelation analysis though, R 4.0.0 and its spdep [18] and gstat [19] packages were used. The density of irrigated areas was calculated at grid sizes of 0.8 km, 1.6 km, 3.2 km, 6.4 km, and 12.8 km based on the raster of studied permits at the end of 2020. Both the global (i.e., raster-wide) and local (i.e., cell-by-cell) versions of Moran’s I test for spatial autocorrelation were conducted on the density raster of each grid size while using queen neighborhoods and the Bonferroni multiple comparison correction. Microsoft Excel 365 was used to calculate summaries and to prepare graphs.

3. Results and Discussion

3.1. Irrigated Area

3.1.1. Growth Rate

The study period was characterized by substantial growth in crop irrigation. While harvested cropland area was relatively stable, the irrigated fraction of harvested cropland doubled between 1992 and 2017 for both full-Delta and all-Delta counties—from 0.34 to 0.68 and from 0.30 to 0.61, respectively (Figure 2a). Thus, the area of irrigated harvested cropland also doubled between 1992 and 2017 (Figure 3). The overall growth rate in irrigated fraction of harvested cropland was 0.013 y−1, which translated to 113 km2 y−1 in full-Delta counties and 142 km2 y−1 in all-Delta counties in terms of irrigated harvested cropland area. The slowest growth occurred between 1997 and 2002, with a rate about half that of the overall rate. The fastest growth occurred between 2007 and 2012, with a rate about one and a half times that of the overall rate. Both 5-year intervals were relatively dry from June to August [20], but the latter coincided with heightened public attention on Delta water resources. Relevant events between 2007 and 2012 included the beginning of a requirement to implement water conservation practices for permit compliance, the informal formation of the Delta Sustainable Water Resources Task Force, and the consideration of mandatory flow metering [21].
The growth rate varied among counties and tended to be slightly faster in full-Delta counties than in part-Delta counties. In terms of irrigated fraction of harvested cropland among full-Delta counties, the growth rate ranged from 0.008 y−1 in Sunflower County to 0.018 y−1 in Sharkey County; among part-Delta counties, the growth rate ranged from 0.001 y−1 in Grenada County to 0.013 y−1 in Warren County (Figure 2a). In terms of irrigated harvested cropland among full-Delta counties, the growth rate ranged from 3 km2 y−1 in Issaquena County to 23 km2 y−1 in Washington County; among part-Delta counties, the growth rate ranged from 0 km2 y−1 in Grenada County to 9 km2 y−1 in Tallahatchie County (Figure 3). Whereas the aforementioned counties—because of their extreme growth rates—rose or fell into a different rank grouping than the one to which they initially belonged, most other counties—because of their intermediate growth rates—tended to stay within the same rank grouping across years. Issaquena County stood out as one with distinctly and consistently the smallest irrigated area among full-Delta counties, whether in absolute terms (Figure 3), relative to county area (Figure 2b), or relative to harvested cropland area (Figure 2a).
As an aside, this data confirmed that an overwhelming fraction of Mississippi irrigation occurred in the Delta (Figure 3). Full-Delta counties accounted for 49% of Mississippi harvested cropland but 81% of irrigated harvested cropland. All-Delta counties accounted for 68% of Mississippi harvested cropland but 97% of irrigated harvested cropland. Thus, statewide surveys of irrigated cropland such as FRIS should be highly indicative of Delta conditions.

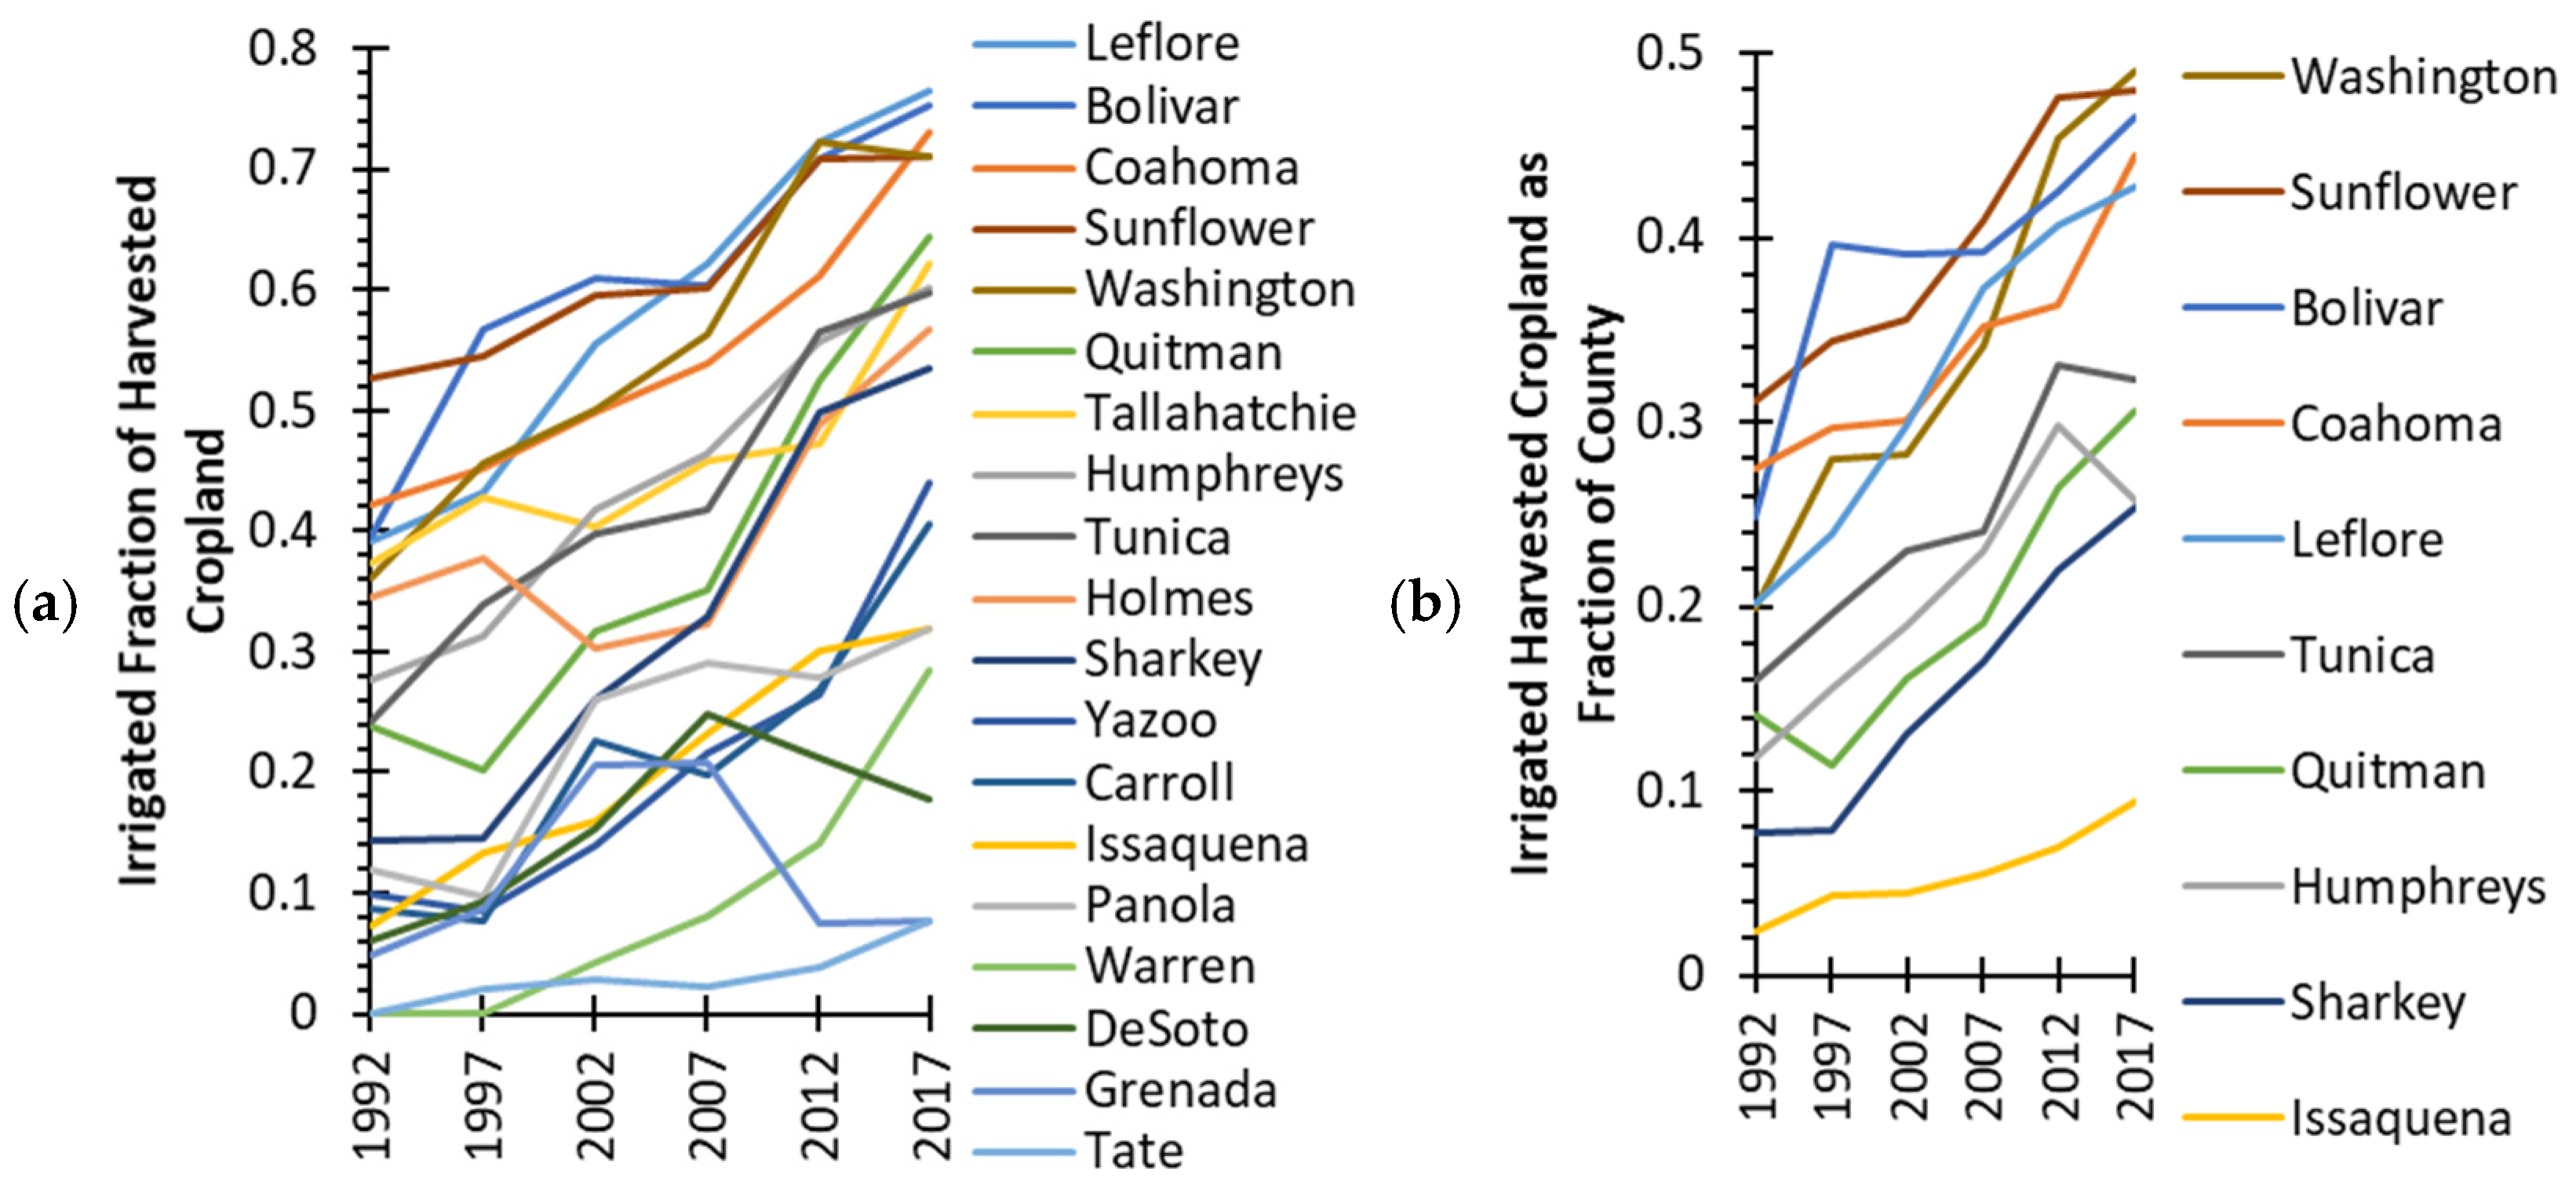
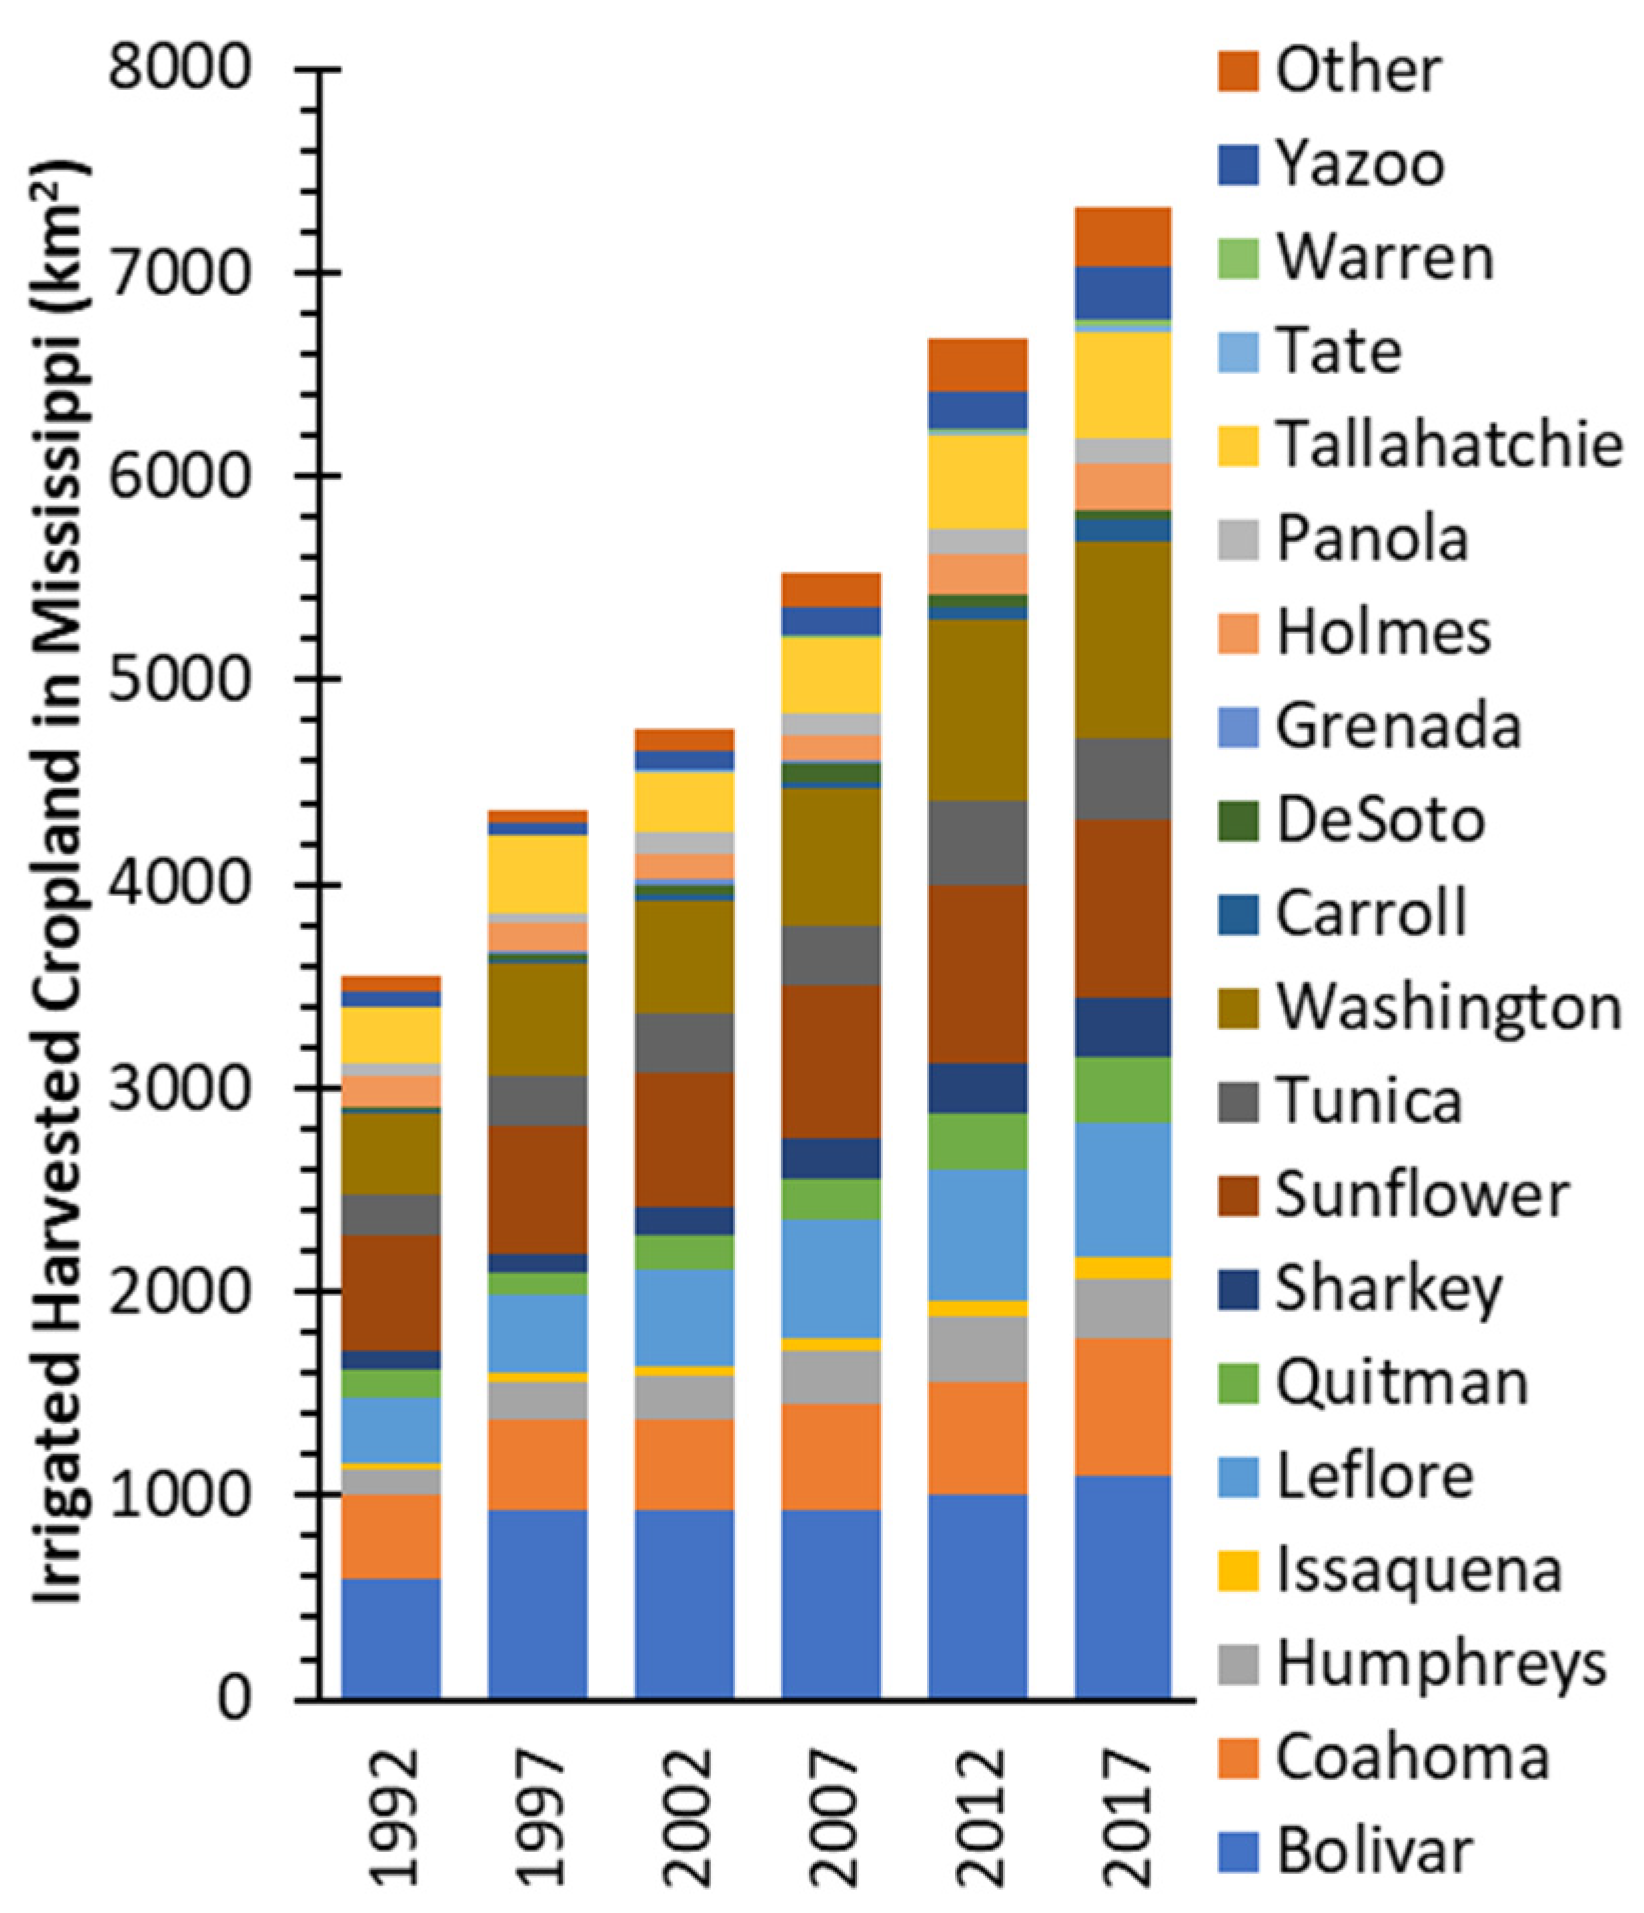
3.1.2. End-of-Period Snapshot

A total of 22,876 water withdrawal permits meeting study criteria were assumed to be active at the end of 2020. These studied permits covered 8391 km2 out of the 19,146 km2 Delta, which is equivalent to a Delta-wide fraction of 0.44. The corresponding fraction in six full-Delta counties and in Tallahatchie County was higher than the Delta-wide value (Figure 4). Focusing on cropland, studied permits covered 7922 km2 out of the 12,861 km2 of Delta cropland, which is equivalent to a Delta-wide fraction of 0.62. The corresponding fraction in four full-Delta counties and in Holmes County was higher than the Delta-wide value (Figure 4). Studied permits covered less than 0.01 of Grenada and Warren Counties whether in terms of their Delta area or their Delta cropland. Full-Delta counties comprised 85% of the Delta area that was covered by studied permits and also 85% of the Delta cropland that was covered by studied permits.
For full-Delta counties, the studied permits as a fraction of cropland (0.64) according to the geospatial analysis were 0.04 lower than the irrigated fraction of harvested cropland (0.68) according to the 2017 COA. This result occurred despite irrigation expansion between 2017 and 2020, which would be reflected in the geospatial analysis but not in the COA. Specifically, the larger difference between the denominators—non-fallow cropland (10,451 km2) according to the geospatial analysis versus harvested cropland (8370 km2) according to the 2017 COA—eclipsed the smaller difference between the numerators—cropland under studied permits (6711 km2) according to the geospatial analysis versus irrigated harvested cropland (5686 km2) according to the 2017 COA. Other than the respective uncertainties of the two methods, another source of discrepancies might be a disproportionately greater prevalence of crop failure in non-irrigated cropland than in irrigated cropland (e.g., because of differences in flood risk). If this phenomenon were present, the irrigated fraction would have been higher among harvested cropland than among all non-fallow cropland, which could contribute to the COA value exceeding that of the geospatial analysis by 0.09, 0.10, and 0.12 in Leflore, Quitman, and Coahoma Counties, respectively. On the opposite extreme, the COA value was 0.09 lower than that of the geospatial analysis in Issaquena County, where perhaps a significant proportion of permitted cropland was just not irrigated in 2017—given relatively high rainfall from June to August that year [20].
Whether as a fraction of Delta area or of Delta cropland, the coverage of studied permits was highest in the medium hydric class and lowest in the low hydric class (Figure 4). The coverage difference between the medium and high hydric classes was reduced from 0.09 to 0.02 when expressed in terms of cropland rather than all land because cropland comprised a larger proportion of the medium hydric class than of the high hydric class. This finding suggests minimal preference for irrigating the former over the latter at the end of the study period. On the other hand, the coverage of studied permits over Delta cropland was 0.09 higher in the high hydric class than the low hydric class, while cropland proportion was similar. A preference for irrigating the high hydric class over the low hydric class may be attributed to the former’s higher ponding suitability [22] (a desirable characteristic for rice production) and lower available water capacity and to the latter’s smaller irrigation response wherever crops are naturally subirrigated by shallow water tables near water bodies.

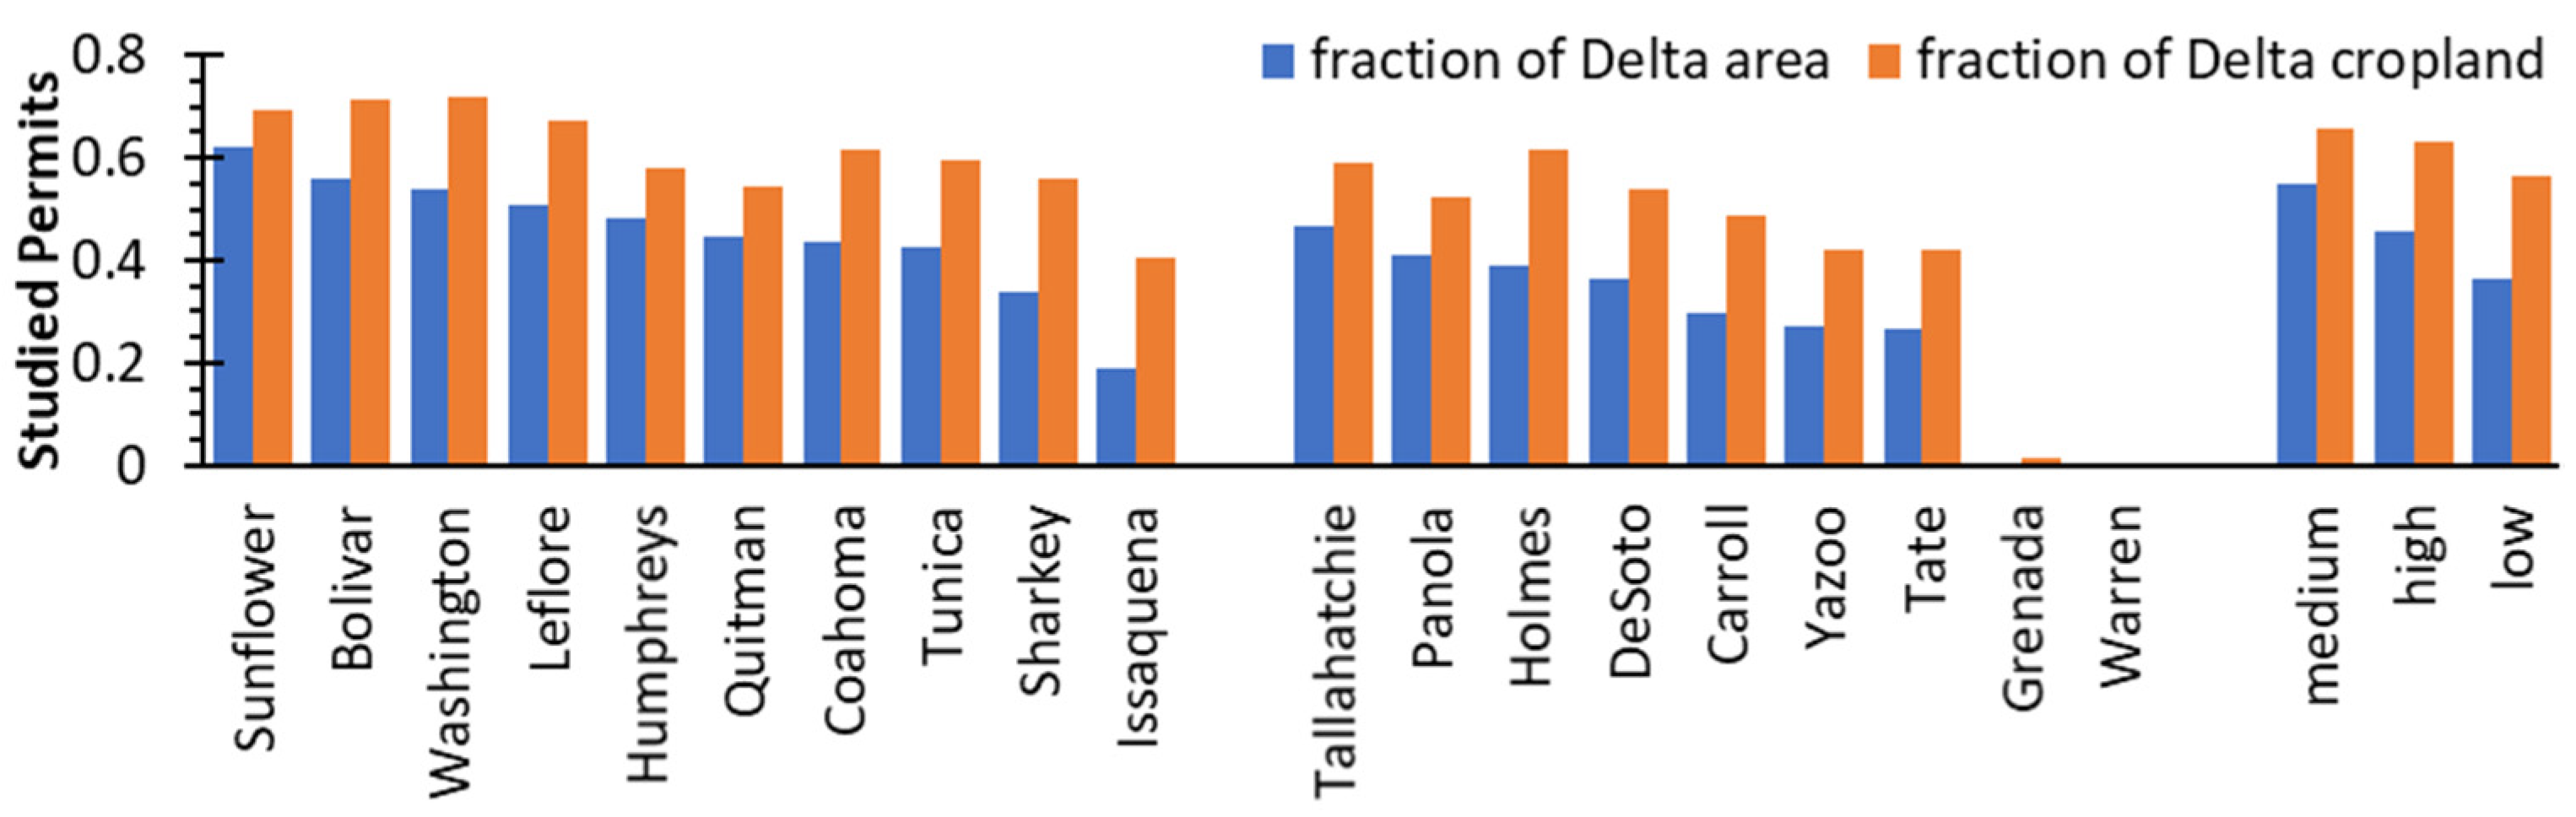
3.1.3. Spatial Autocorrelation

Bolivar, Coahoma, Leflore, Sunflower, and Washington Counties occupied top ranks throughout Figure 2a,b and Figure 3. Because these five counties are also adjoining, the density of irrigated areas (Figure 5a) was suspected to be more similar among nearby locations than among distant locations. Based on the studied permits at the end of the study period, global Moran’s I ranged from 0.61 to 0.72 for five grid sizes between 0.8 km and 12.8 km, with p-values all below 1 × 10⁻¹⁵. Furthermore, estimating each density value as the arithmetic mean of its immediate neighbors reduced root mean square error from 0.30 to 0.18 relative to estimating each density value as the overall mean across the 1.6 km raster. Such improvement corresponds to a Nash–Sutcliffe efficiency of 0.63. The statistical results above suggest moderate positive spatial autocorrelation in the density of irrigated areas at the end of 2020 for the Delta.
Local Moran’s I highlighted several zones of strong positive autocorrelation within the Delta (Figure 5b). The largest “hot zone” of high density (in red) extended from central to southeastern Bolivar County. To its south and to its east were two other “hot zones” of high density (also in red)—southeastern Washington County and from east-central Sunflower County to northwestern Leflore County, respectively. The largest “cold zone” of low density (in blue) was located in the southern tip of the Delta and included Delta National Forest, Panther Swamp National Wildlife Refuge, and multiple state wildlife management areas. Land along the Mississippi River on the western edge of the Delta and state wildlife management areas in the east-central Delta were prominent “cold zones” of low density as well (also in blue).
Spatial autocorrelation in the density of irrigated areas was also investigated using a semivariogram. The empirical semivariogram for the 1.6 km density raster was well-described by an exponential semivariogram model with a nugget of 0.039, a sill of 0.096, and a scale parameter of 34 km. According to this model, the variance among locations infinitesimally close together was 59% smaller than the variance among locations infinitely far apart. Relative to its magnitude at a separation distance of zero, the effect of positive spatial autocorrelation weakened to 50% and 5% at separation distances of 23 km and 103 km, respectively.
Findings of positive spatial autocorrelation in the density of irrigated areas at the end of the study period are consistent with the expectation of positive spatial autocorrelation in favorable conditions for irrigation development. Adjacent locations tend to be similar in attributes such as flood risk, water availability, prevalence of contiguous arable parcels, opportunity cost of avoiding alternate land uses, and transportation costs to/from crop delivery points. Furthermore, landowners in the proximity of more widespread irrigation development may be more likely than landowners elsewhere to develop irrigation—whether for psychosocial reasons (e.g., desire to keep in pace with neighbors), financial reasons (e.g., need to satisfy expectations by tenants and bankers, availability of government financial assistance), technical reasons (e.g., access to expertise and professional services during and after irrigation development), and/or others. These and other factors led to spatial differences in the growth rate and current extent of irrigation development across the Delta.

3.2. Irrigated Land Cover

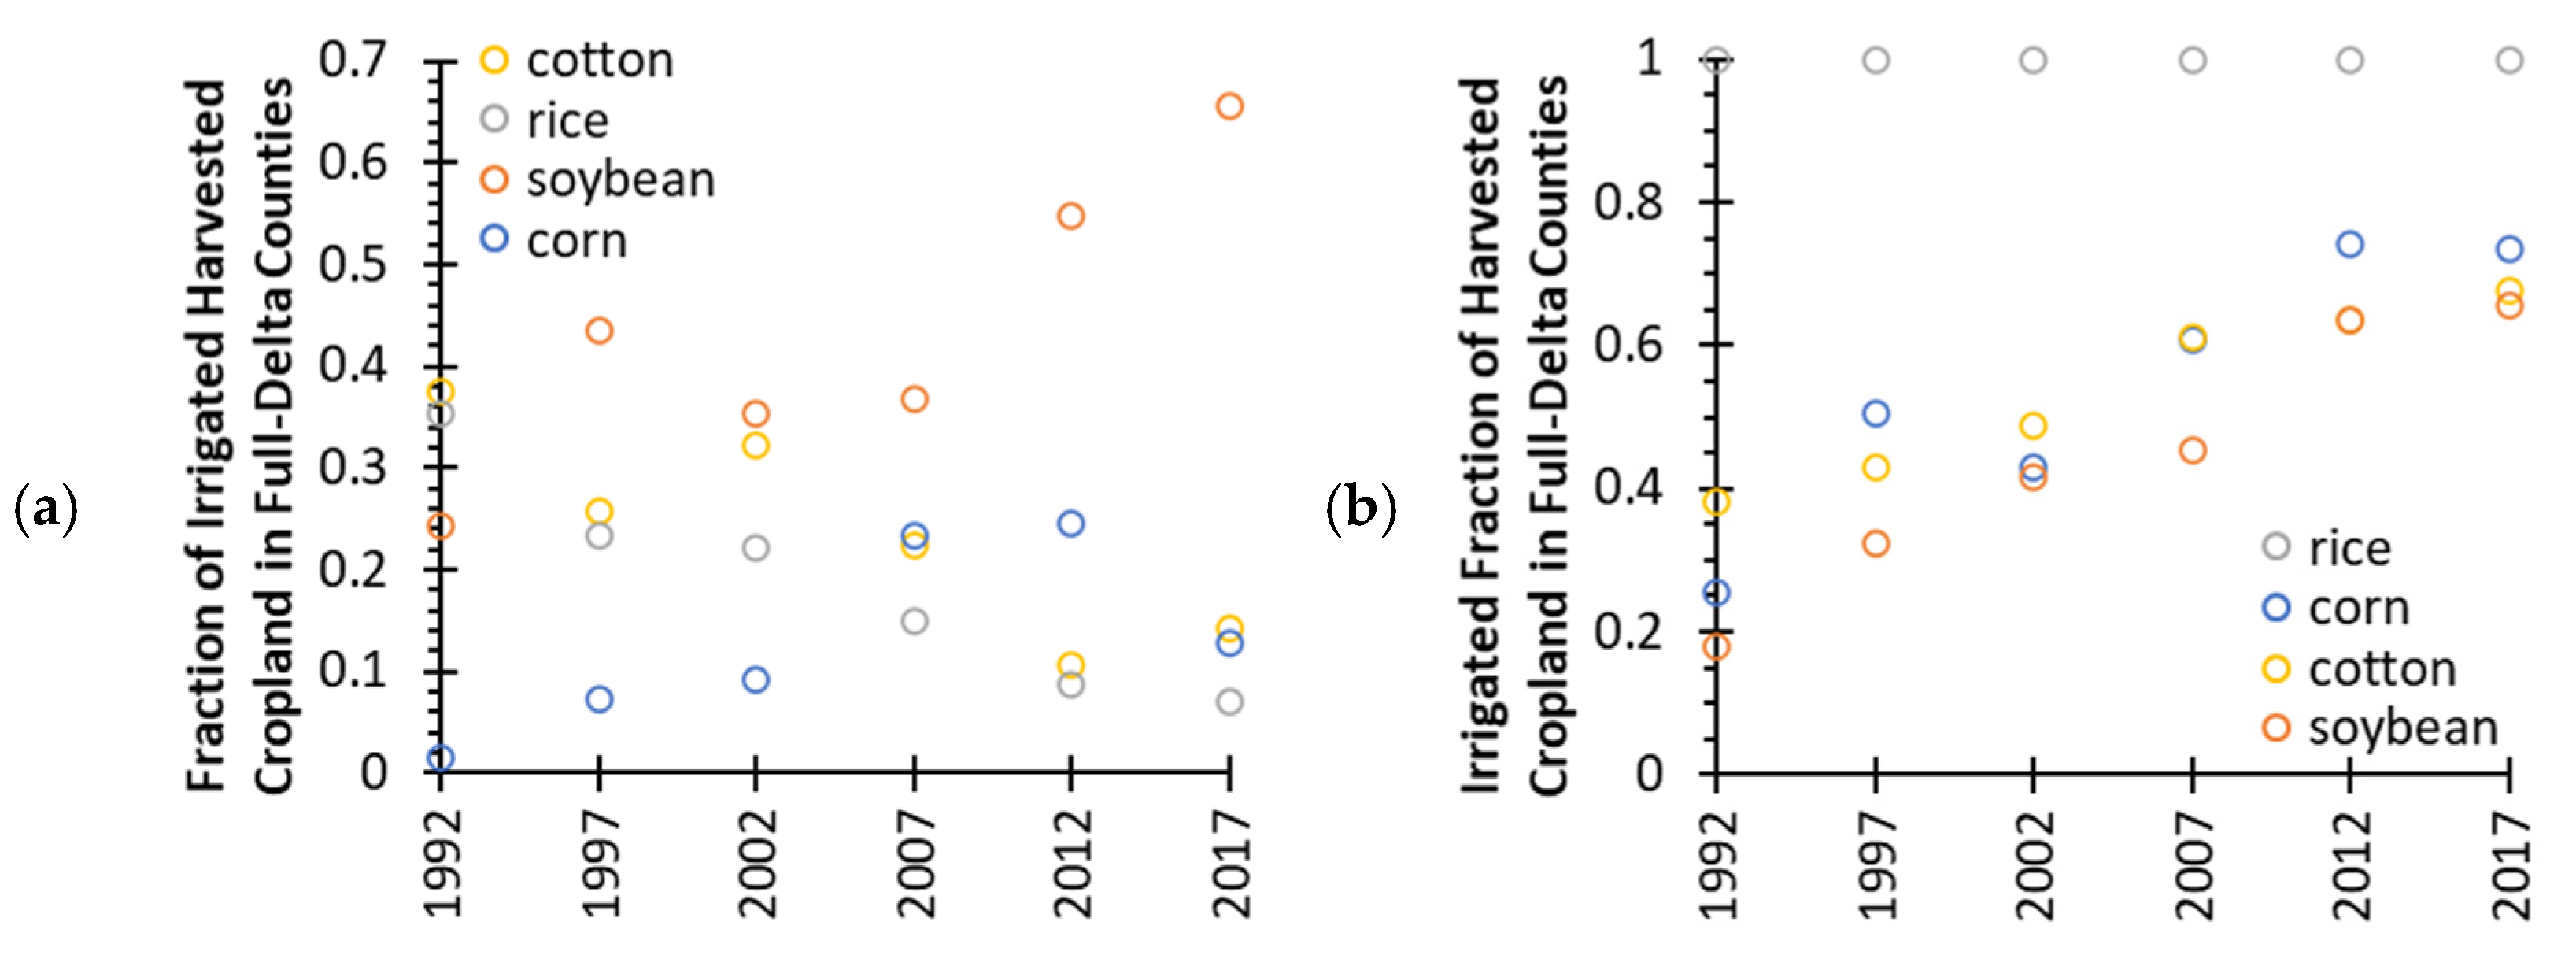
3.2.1. Temporal Trends in Full-Delta Counties

For all six COAs during the study period, at least 0.97 of irrigated harvested cropland in full-Delta counties produced soybean, cotton, corn, or rice. This finding confirms that these four were the main irrigated crops of the Delta over the past three decades and justifies the focus on them in this section.
The study period was characterized by substantial changes in irrigated crop mix (Figure 6a). Towards the beginning, cotton, rice, and soybean were grown on similar fractions of full-Delta irrigated harvested cropland. However, the soybean fraction increased by 0.014 y−1 whereas the cotton and rice fractions decreased by 0.010 y−1 and 0.011 y−1, respectively. The cotton fraction remained higher than the rice fraction in each COA, but both had shrunk to a third or less of their initial values. In contrast, soybean became the dominant crop, occupying about three fifths of irrigated harvested cropland. While the corn fraction experienced a smaller rate of change in absolute terms (0.007 y−1), the relative change was dramatic. The corn fraction started at a mere 0.02 in 1992 but soared more than tenfold to 0.25 in 2012. Despite fluctuations in market conditions, the corn fraction exceeded the cotton and rice fractions in two and three out of the three COAs in the second half of the study period, marking the transformation of corn into a major irrigated crop in the Delta.
As expected with the doubling of the irrigated fraction of harvested cropland during the study period, the three main row crops also experienced a rise in the irrigated fraction of their harvested areas (Figure 6b). In 1992, the irrigated fraction of harvested cotton area was higher than that of harvested corn area and of harvested soybean area. However, the irrigated fraction of harvested cotton area underwent a slower increase (0.013 y−1) than the other two irrigated fractions (both 0.019 y−1). This difference may reflect partly a slight shift in general attitudes among Delta farmers—from prioritizing the irrigation of “King Cotton” to pursuing the typically larger irrigation responses of soybean and corn. Throughout the study period, none of the COAs reported a non-zero value for the harvested area of non-irrigated rice. This observation supports the local knowledge that—perhaps except under extraordinary circumstances—rice has been strictly an irrigated crop in the Delta [2].

3.2.2. End-of-Period Snapshot

Pooling together all hydric classes, the 2016–2020 geospatial analysis painted a similar picture of irrigated land cover as the 2017 COA. In terms of the irrigated crop mix, the geospatial analysis found that at least 0.99 of all cropland under studied permits was growing soybean, cotton, corn, or rice. The soybean fraction of all cropland under studied permits was twice the sum of the corresponding cotton and corn fractions (Figure 7a). In contrast, rice was the least prevalent irrigated crop among the four, averaging 0.07 of all cropland under studied permits. As for the fraction of each crop under studied permits, the four main crops from most irrigated to least irrigated were rice, corn, cotton, and soybean. All of these observations from the geospatial analysis were consistent with those from the COA (Figure 6).
The geospatial analysis revealed a clear effect of soil hydric class on the irrigated crop mix. The only commonality across every hydric class was that soybean was the most common irrigated crop (Figure 7a). As hydric rating increased, the soybean and rice fractions of all cropland under studied permits increased, being 0.34 and 0.09 higher, respectively, in the high hydric class than in the low hydric class. In relative terms, the prevalence of soybean and rice in the high hydric class was almost two and seven times that in the low hydric class. This finding affirms the local knowledge that rice tended to be grown on highly clayey soils in the Delta and that soybean was considered to be well-adapted to those soils also [2]. As for cotton and corn, their fractions of all cropland under studied permits increased as hydric rating decreased, being 0.26 and 0.17 higher, respectively, in the low hydric class than in the high hydric class. In relative terms, the prevalence of cotton and corn in the low hydric class was almost six and three times that in the high hydric class. This finding attests to the local knowledge that lighter soils were preferred for cotton and corn production in the Delta. The medium hydric class, in agreement with its intermediate status, witnessed an irrigated crop mix in between that of the low and high hydric classes.
In contrast to the differential impact of hydric class on the prevalence of each crop under studied permits, irrigated fractions were not subjected to a dramatic crop × hydric class interaction. The largest difference among hydric classes was the fraction of soybean under studied permits, which was 0.14 lower in the low hydric class than in the high hydric class (Figure 7b). This finding is attributed to a Delta preference for soybean on marginal cropland (i.e., less likely to experience irrigation development and be covered by a studied permit) owing to the local view of soybean as a versatile, low-maintenance crop. For the other three main crops, the difference among hydric classes ranged between 0.05 and 0.07 (Figure 7b), with the irrigated fraction being generally highest for the medium hydric class—as expected with its most extensive irrigation development (Figure 4). Because irrigation had become relatively widespread on cropland of all hydric classes by the end of the study period (Figure 4), the fraction of soybean, cotton, and corn under studied permits may be predominantly influenced by overall progress in irrigation development rather than by intentional targeting of a specific crop on a specific hydric class for irrigation development. However, in the case of rice, the reporting of rice outside the coverage of studied permits is attributed to the combination of limitations in geospatial analysis, in permitting participation, in database completeness, and in classification accuracy. The present finding that 0.15 of Delta rice in 2016–2020 was not covered by studied permits is slightly larger than the literature finding that 0.10 of Bolivar County rice in 2010 was grown on unpermitted land [23].

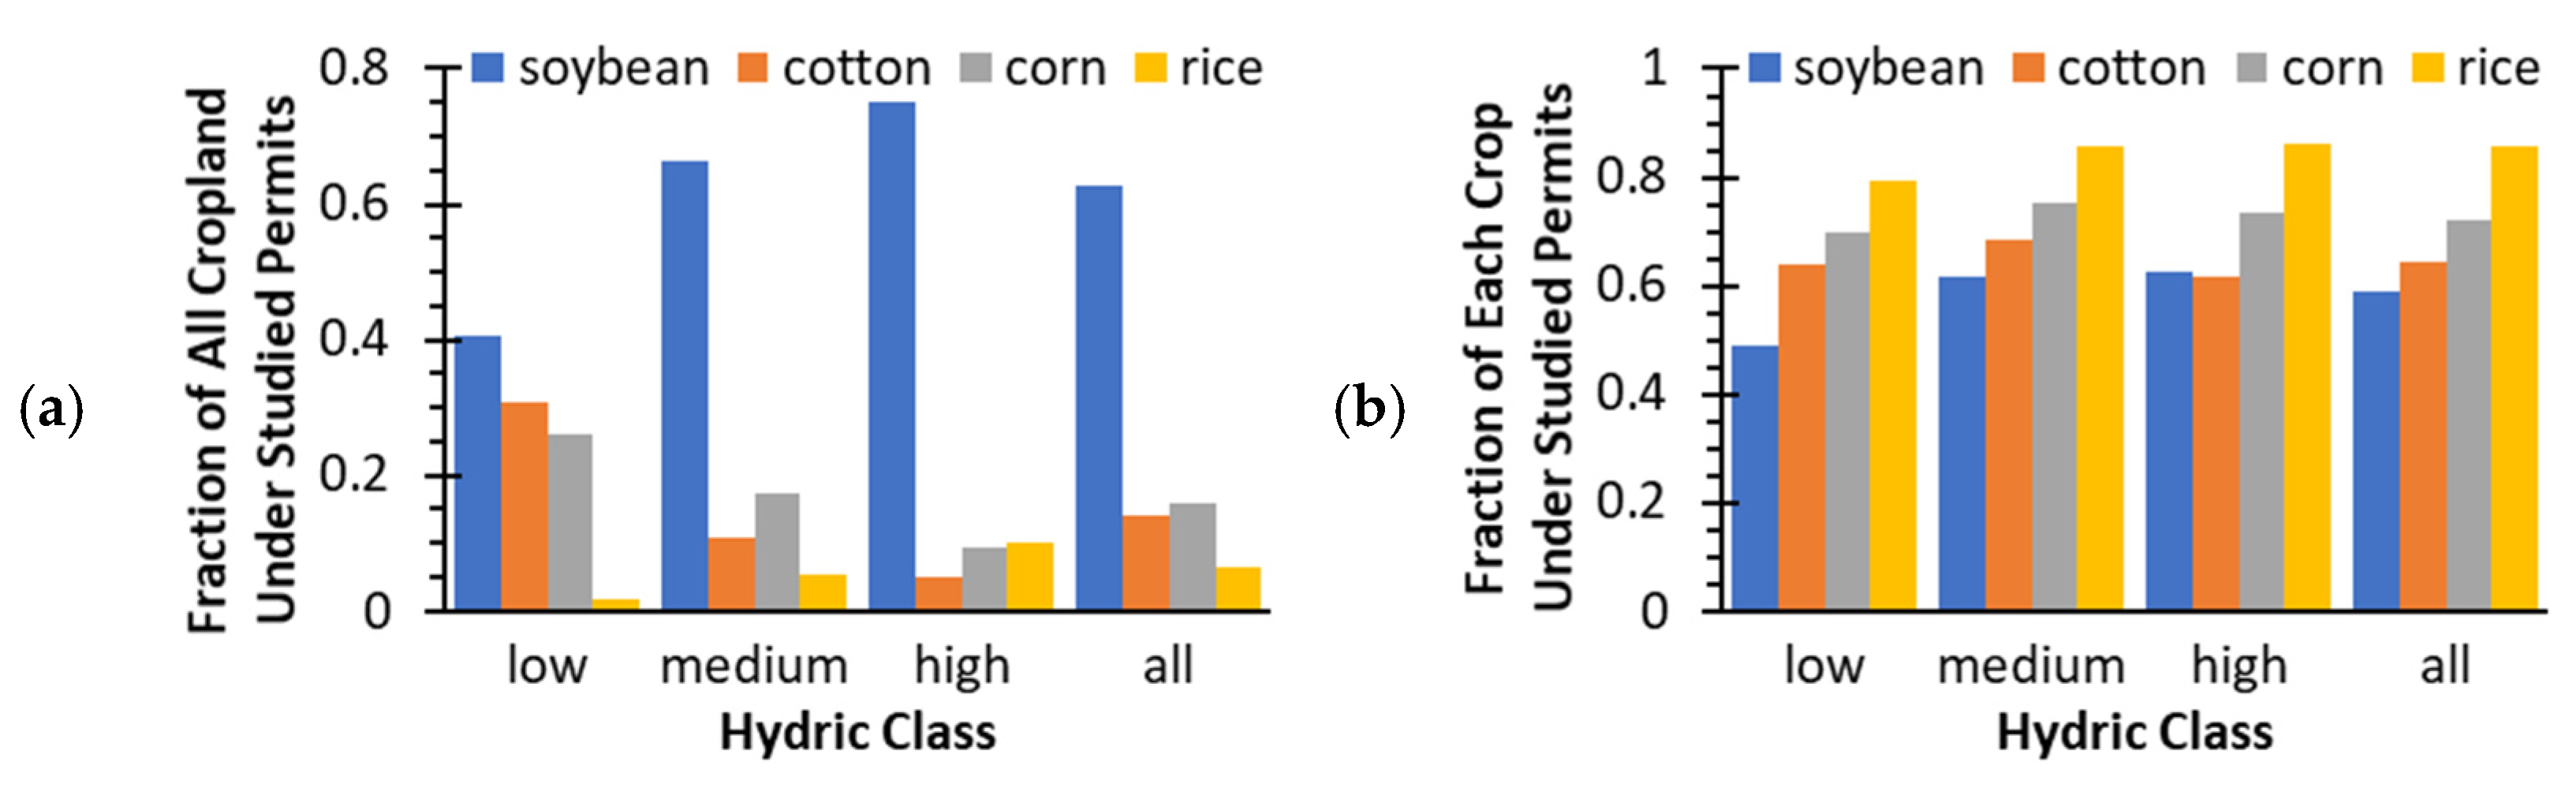
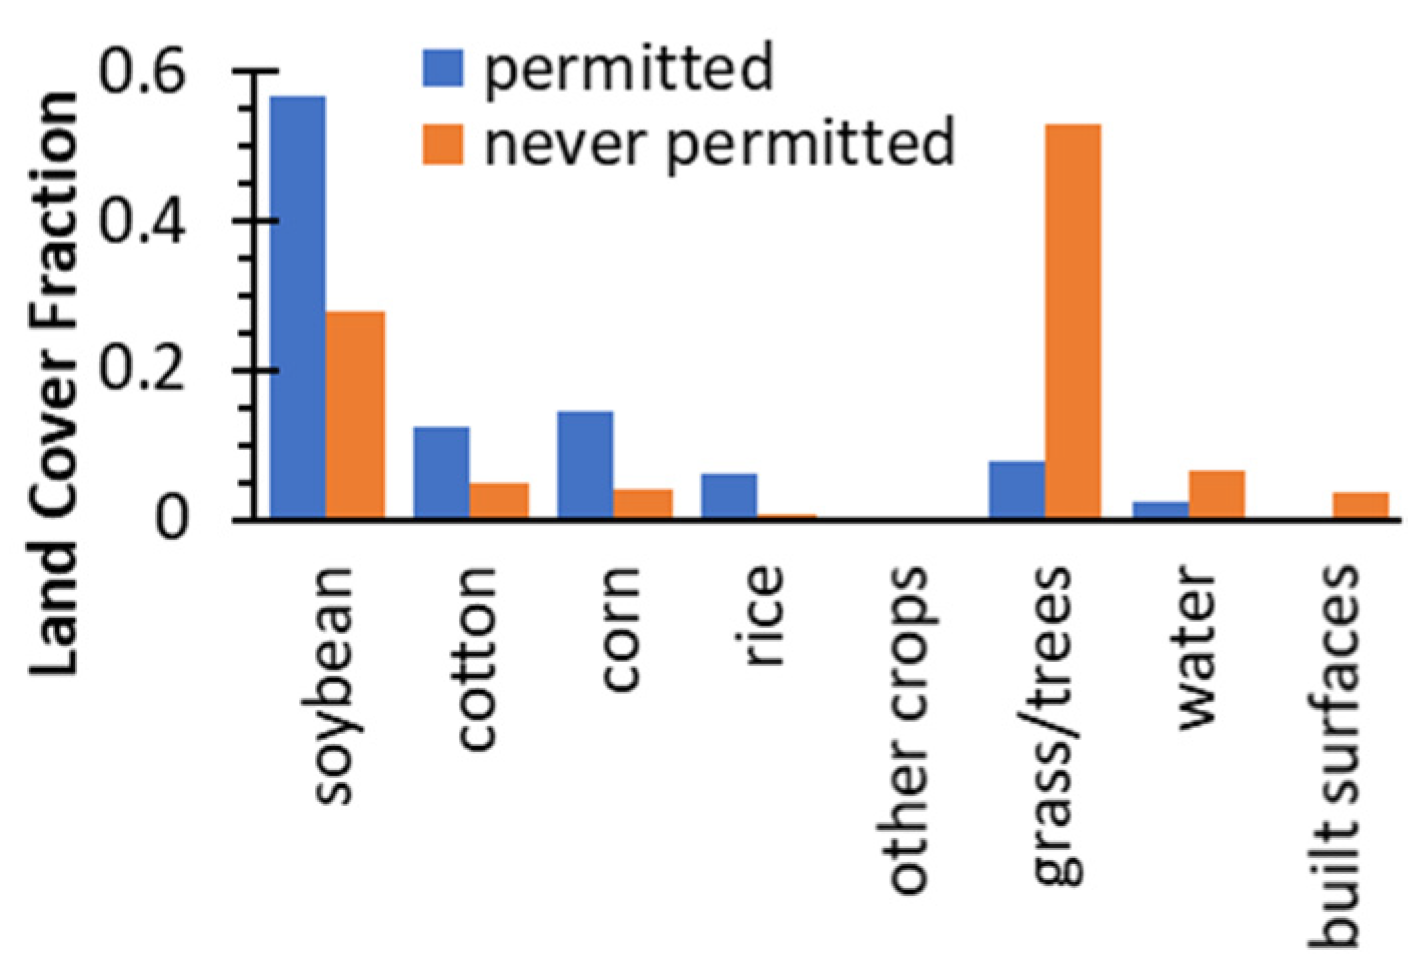
3.2.3. Comparison against Never-Permitted Land

Water withdrawal permits were issued not only for crop irrigation. Classifying studied permits at the end of 2020 by their stated purposes, 0.87 was crops only, 0.04 was aquaculture only, 0.03 was wildlife only, 0.05 was irrigation plus wildlife, and the remainder (less than 0.01) were other combinations of the three main categories. Similarly, the geospatial analysis found that the 2016–2020 land cover distribution under studied permits was 0.90 crops, 0.08 grass/trees, 0.02 water, and less than 0.01 built surfaces (Figure 8). Some of the 634 km2 of grass/trees under studied permits were likely ponded for wildlife habitat, whereas some of the 170 km2 of water under studied permits were likely ponded for catfish production.
For comparison, the geospatial analysis found that the 2016–2020 land cover distribution on never-permitted land of the Delta was 0.37 crops, 0.53 grass/trees, 0.07 water, and 0.03 built surfaces (Figure 8). Because over half of the Delta has never been permitted as of the end of 2020, never-permitted land contained the vast majority of the grass/trees, water, and built surfaces in the Delta. Much of the grass/trees in the Delta are part of riverbank or low-lying wetlands that have become prized for recreational and conservation purposes on private properties and public reserves [24]. The profit and utility of preserving these areas (e.g., gained from hunting-related business activities, personal enjoyment, and societal satisfaction) may exceed the net benefit of converting them to irrigated agriculture, especially where flood risk is high. Government regulations (e.g., Clean Water Act Section 404, “Swampbuster”), incentives (e.g., Conservation Reserve Program, Wetlands Reserve Program/Easements), and ownership (c.f. Section 3.1.3) may also discourage the clearing and farming of these areas. As suggested by the steady extent of Delta cropland throughout the study period according to the COA, such areas with grass/trees—constituting roughly half of never-permitted land—are likely to remain excluded from irrigated agriculture unless circumstances change drastically.
At the same time, about a third of never-permitted land was cropped, totaling 3841 km2 ha in 2016–2020 and comprising a third of all Delta cropland. In agreement with the geospatial analysis, the 2017 COA reported that 32% and 39% of harvested cropland was non-irrigated in full-Delta counties and in all-Delta counties, respectively. A noteworthy constraint to irrigation development on currently non-irrigated cropland includes the lack of access to necessary capital by low-income and historically disadvantaged farmers, which has been documented in the Delta [25]. Apart from demographic-specific hurdles, the geophysical features of some parcels may cause the total cost of irrigation development (i.e., including all accompanying expenses such as precision land-forming and drainage improvement) to be prohibitively high relative to the expected revenue boost, so the investment is not equally attractive everywhere. Such unattractive parcels would be expected to comprise a significant portion of currently non-irrigated cropland in the Delta after multiple decades of irrigation development. Nevertheless, this study indicates that cropland availability does not appear to be a bottleneck for the near future of irrigation development in the Delta.

3.3. Irrigation Systems

3.3.1. Water Sources

Groundwater was the most common water source for Delta irrigation throughout the study period. Statewide FRIS showed that the fraction of irrigated open area using some groundwater stayed around 0.96 (Figure 9). The survey also considered two other water sources—on-farm surface water and off-farm water. The fraction of irrigated open area using some on-farm surface water increased from 0.04 in 1994 to 0.08 in 2018, whereas the fraction of irrigated open area using some off-farm water was less than 0.01 for all six FRISs during the study period. Strangely, the sum of the “groundwater only”, “some on-farm surface water”, and “some off-farm water” fractions decreased progressively below 1. The shortfall was about 0.12 in 1994, 1998, and 2003. Then, it jumped to 0.17 in 2008 and 0.24 in 2013 and 2018. For the later two FRISs, this shortfall was about 1618 km2. Survey non-response or other errors may be partially at fault, but some of the shortfall may be contributed by the development of surface water sources that might not be best described by either “on-farm surface water” or “off-farm water”. Thus, the decline in the “groundwater only” fraction from 0.84 in 1994, 1998, and 2003 to 0.69 in 2013 and 2018 was not fully compensated by changes in these other two water source categories.
The alternate surface water sources likely included tailwater recovery, on-farm storage, and stream diversion [26], all of which witnessed an explosion of interest during the years when the shortfall grew. As documented in the aerial imagery analysis by Brock et al. [27], water quality concerns led to a wave of government financial assistance that spurred the construction of tailwater recovery and on-farm storage systems in the Central Delta particularly between 2010 and 2016. Likewise, Quintana-Ashwell et al. [28] documented how the adoption of these systems coincided with the abrupt rise in NRCS contract expenditures particularly in the first half of the 2010s. Each new system capturing at least some runoff originating outside the farm would need a new surface water permit to apply the impounded water as irrigation [16]. Additionally, the high energy prices (see “Energy Sources” section) and the intense water sustainability emphasis of this era may have influenced the expansion of pumping from streams on adjacent lands, which usually requires less energy to lift water and would also involve new surface water permits. In the Delta, the development of these alternate surface water sources typically reduces reliance on rather than replaces completely the pumping of groundwater, which explains the stable fraction of irrigated open areas using some groundwater (Figure 9).
The above hypothesis concerning alternate surface water sources is also corroborated by the issue years of surface water permits. Among the 968 studied surface water permits that were issued between 1992 and 2020, the five top issue years were 2011, 2013, 2012, 2014 (tied with 2012), and 2010 (Figure 9). The count averaged 77 per year in 2010–2014 as compared with 24 per year in the other years. At the end of 2020, the surface water permits numbered 2098 and covered 731 km2, which are equivalent to 0.09 of all studied permits and of the total area covered by studied permits. However, 456 km2 or 0.62 of this surface water permitting coverage was overlapped with groundwater permitting coverage. As mentioned earlier, this analysis does not include any system capturing runoff exclusively from its owner’s private property and thus would underestimate the number and area of sites where alternate surface water sources have been developed.

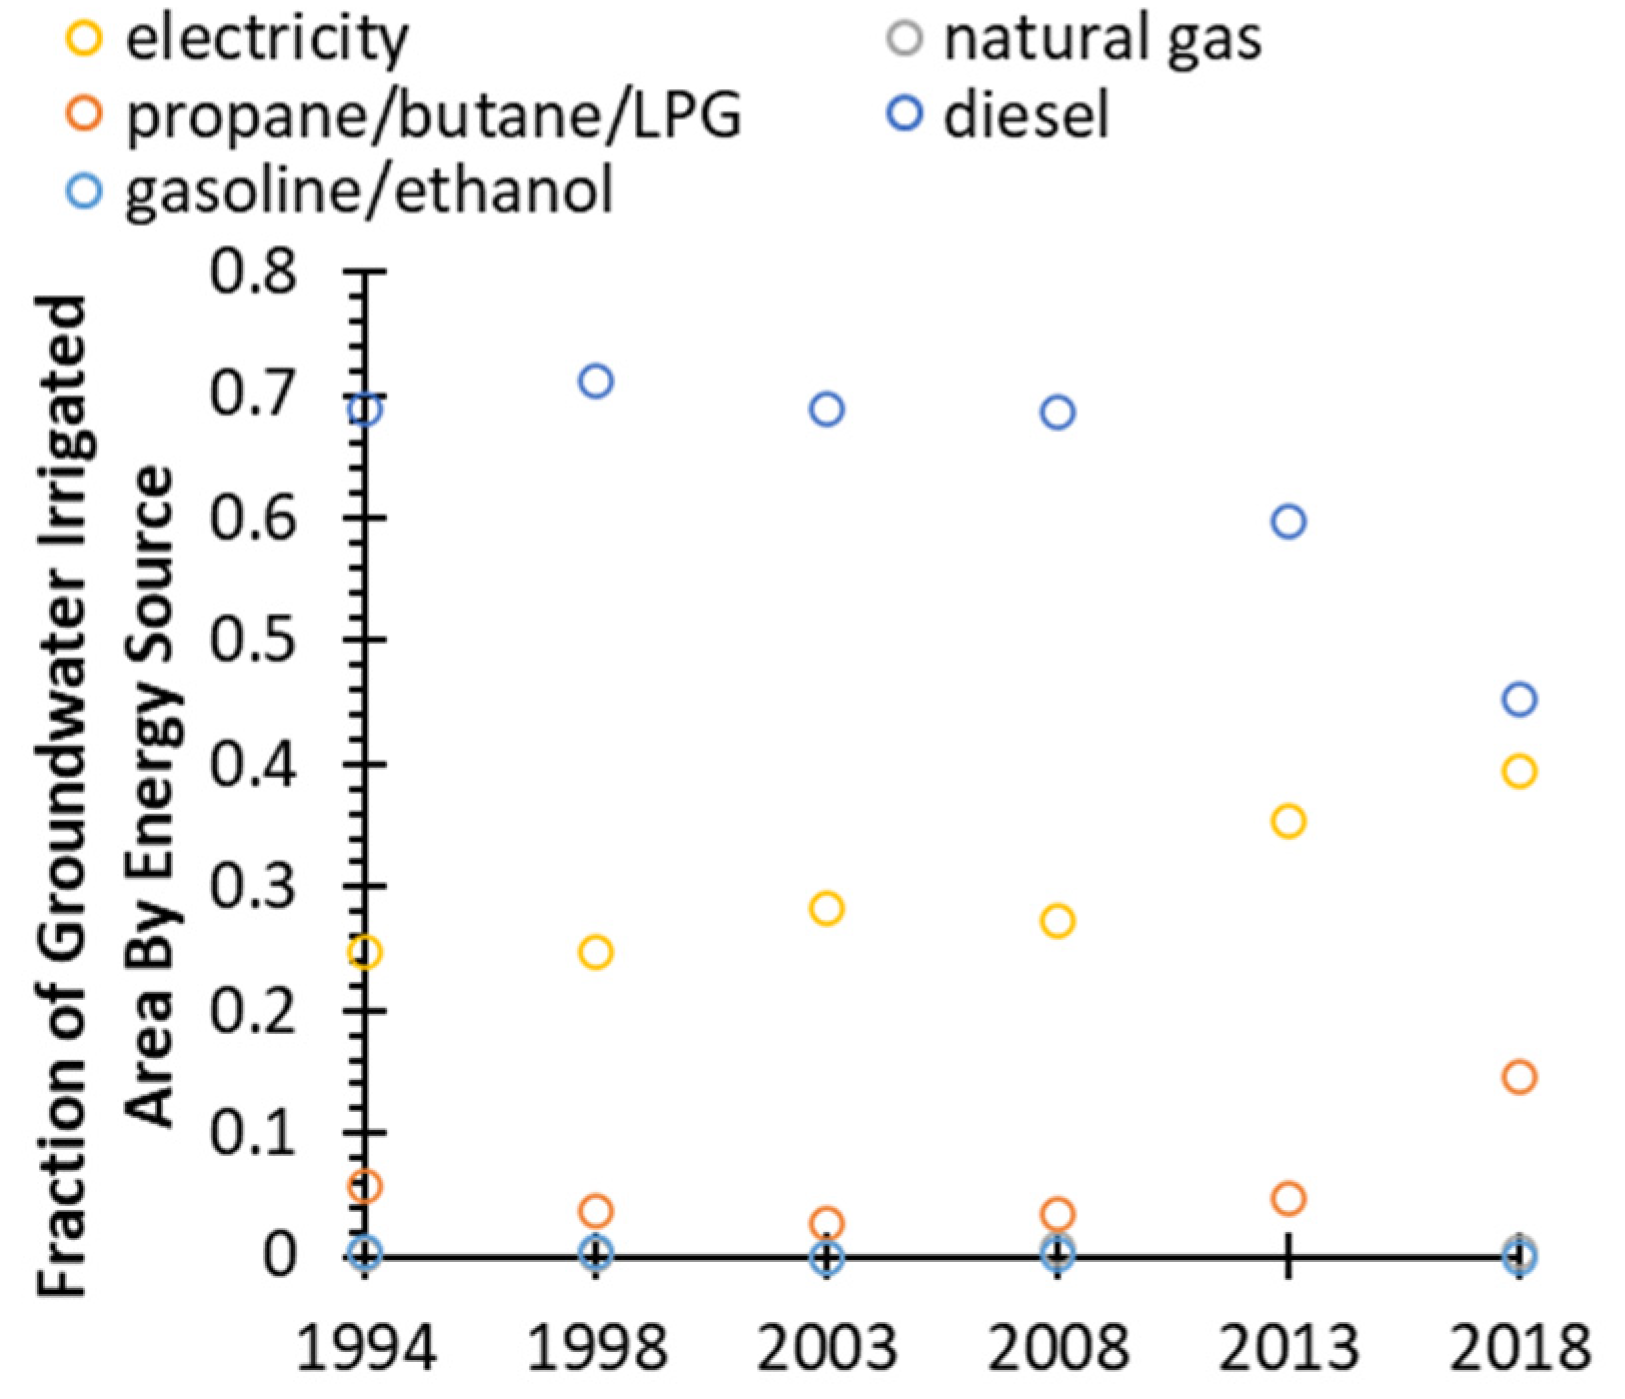
3.3.2. Energy Sources

Diesel, electricity, and propane/butane/liquefied petroleum gas (LPG) were the three major energy sources for Delta irrigation and accounted for over 0.95 of irrigated area statewide during the study period (Figure 10). Natural gas and gasoline/ethanol—the two other energy source categories on the FRIS—were uncommon.
The study period could be divided into two phases for describing the trends in energy sources. For the first two decades, the area proportion of the three major energy sources remained relatively stable. Diesel, electricity, and propane/butane/LPG accounted for 0.68, 0.26, and 0.04 of irrigated area on average. However, significant changes occurred during the third decade. The fraction of irrigated area pumping with diesel dropped 0.023 y−1 while the fraction with electricity and propane/butane/LPG increased 0.013 y−1 and 0.011 y−1. If the trajectory continued, electricity would be expected to overtake diesel as the leading energy source for Mississippi irrigation by the next FRIS.
The shift away from diesel may be attributed to changes in prices. The price of diesel rose quickly during the mid−2000s and became about four times higher in 2012 than in 2002 [29]. In sharp contrast, the price of electricity increased merely by a third between 2002 and 2012 [30]. Pumping plants that were located near a power line would have had a strong financial incentive to use electricity instead of diesel. Additionally, electric pumping plants are also more readily compatible with remote monitoring and control technologies, which became increasingly popular in the 2010s and may have further incentivized the switch to electricity particularly for technologically inclined farmers. For those far from a power line, however, propane/butane/LPG was an attractive alternative to diesel. The ratio between the 2013–2017 price and the 1998–2002 price was 2.9 for diesel [29] but 1.8 for propane [31]. Additionally, concurrent changes in government emission rules increased the initial cost of diesel engines relative to propane engines [32], further driving the conversion from diesel to propane/butane/LPG.

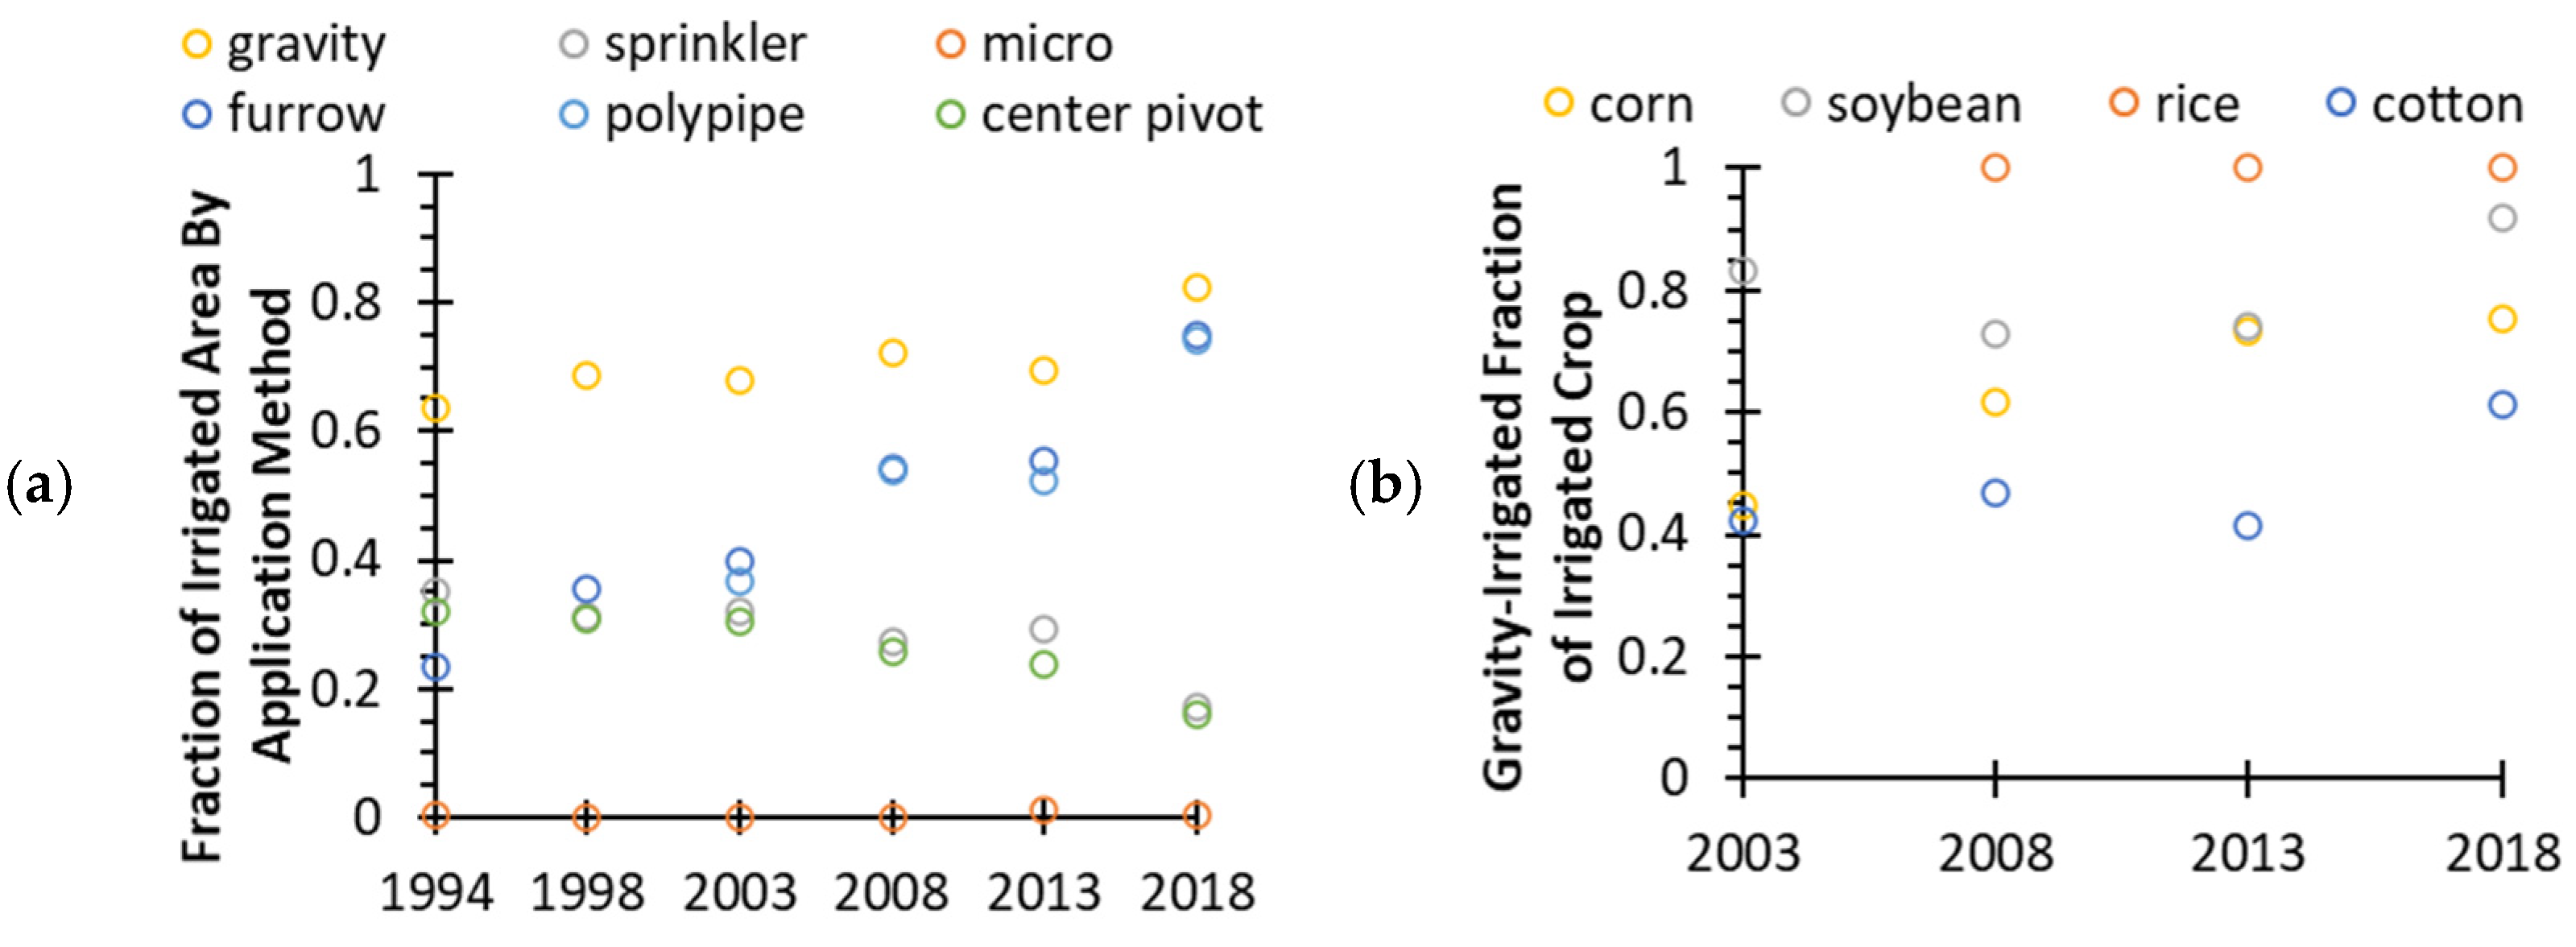
3.3.3. Application Methods

Throughout the study period, gravity irrigation was the dominant irrigation method in the Delta. Gravity irrigation’s share of statewide irrigated area remained steady around 0.68 from 1994 to 2013 (Figure 11a). However, there was an underlying gradual shift from flood application to furrow application. Between 1994 and 2013, the fraction of furrow-irrigated area increased by 0.082 y−1. This trend may be attributed primarily to the adoption of recyclable lay-flat polyethylene tubing (locally and hereafter referred to as “polypipe”). Before the emergence of polypipe in the 1990s, furrow irrigation typically required the use of gated hard pipe [33], which was labor-intensive to install/uninstall each season and inconvenient for in-season chemical application using ground vehicles. Furrow irrigation became more attractive when polypipe could be set up and removed mechanically, could be driven over, and could apply water in a relatively uniform manner without levees. Contemporary research also demonstrated that heavy rainfall following flood irrigation could reduce the yield of flat-planted row crops [34], which may have further encouraged the transition to furrow irrigation between raised beds. Then between 2013 and 2018, the fraction of irrigated area receiving gravity irrigation and specifically polypipe irrigation increased sharply to 0.82 and 0.74, respectively. This illustrated polypipe’s dramatic transformation from a new innovation to the preferred application method for Delta farmers over the 30-year period.
Almost all of the statewide irrigated area not receiving gravity irrigation received sprinkler irrigation, 92% of which was irrigated by center pivots. From 1994 to 2013, pivot-irrigated area expanded with the overall expansion in irrigated area. However, the decrease in sprinkler-irrigated area fraction between 2013 and 2018 (Figure 11a) involved a net decrease of 660 km2 in pivot-irrigated area, equivalent to 38% of the pivot-irrigated area in 2013. This suggests that not only were newly developed areas choosing furrow irrigation over pivot irrigation, but also existing irrigated areas were switching from pivot irrigation to furrow irrigation. The epicenter of this change would have been the Delta because other parts of Mississippi often encountered barriers to gravity irrigation such as steep slopes and water supply limitations (in volume or in flow rate).
Beyond the local perception that center pivots could not keep up with the peak irrigation demand of soybean and corn [2,35], real disadvantages of center pivots under typical Delta circumstances contributed to their falling out of favor. First, many center pivots in the Delta were installed on fields that had not been land-formed, so these pivot-irrigated fields were more vulnerable than land-formed, furrow-irrigated fields to surface drainage problems amidst the gentle terrain and seasonally high rainfall of the Delta. Besides yield losses from flooding and waterlogging [36], the low spots can cause pivot towers to get stuck [35]. However, once precision land-forming had been performed (sometimes with government financial assistance), the cost of converting from center pivot irrigation to furrow irrigation was substantially reduced, with much of the additional investment being underground (i.e., pipelines) and thus more protected from theft and weather than center pivots. Second, the abundant water supply during the study period incentivized irrigating the entirety of each land parcel, which would require sometimes expensive corner attachments for center pivot irrigation but is immediately straightforward for furrow irrigation after the completion of precision land-forming [35]. Finally, center pivots in the Delta incur a noticeably higher energy cost per unit of pumped volume than furrow systems because groundwater levels are commonly less than 20 m below the land surface [6]. Therefore, the Delta’s transition from center pivot irrigation to furrow irrigation—albeit contrary to national trends—is well-explained by technical and socioeconomic factors.
Micro-irrigation’s share of statewide irrigated area never reached 0.02 for any of the six FRISs and exhibited no clear trend (Figure 11a). While surface and subsurface drip irrigation is conducive to irrigating the entirety of a land parcel regardless of its shape, these systems tend to be relatively expensive and complex to install, operate, and maintain [37]. High iron and manganese concentrations in the Delta groundwater [5] would particularly increase pre-treatment requirements. For the Delta’s main crops during the study period, there was simply no urgent water shortage or yield quality concern that necessitated embracing the challenges of micro-irrigation, so adoption of this technology remained low.
The four FRISs that reported application method by crop type (2003, 2008, 2013, 2018) revealed interactions between application methods and crop type. For soybean, the irrigated area fraction receiving gravity irrigation was consistently above the overall average and above 0.70 (Figure 11b). Although the exact share decreased 0.10 from 2003 to 2008 but increased 0.18 from 2013 to 2018, it is safe to claim that gravity irrigation was popular for Delta soybean production. For cotton, the irrigated area fraction receiving gravity irrigation was consistently below the overall average. The gravity-irrigated share exceeded 0.50 only in the 2018 FRIS after an increase of 0.20 since the 2013 FRIS. This trend suggests that center pivot irrigation had been slightly more popular for Delta cotton production until the overall decline in center pivot irrigation. This may be attributed to the general co-location of cotton and center pivots on lighter soils and to cotton’s greater sensitivity to overirrigation [38,39], which is easier to avoid with center pivots because of smaller water depths per application. For corn, the fraction of irrigated corn receiving gravity irrigation increased 0.028 y−1 from 2003 to 2013, while the overall fraction of irrigated land receiving gravity irrigation stayed stable. This suggests that Delta farmers became increasingly comfortable with gravity irrigation for corn production over those 10 years. For rice, virtually all Mississippi rice was gravity-irrigated. Only 2003 reported non-zero area (exact value was withheld by NASS) for pressurized-irrigated rice. This highlights that gravity irrigation was the intentionally preferred application method for Delta rice during the study period.

4. Conclusions

The combination of government surveys and geospatial analysis complemented each other well for depicting irrigation development in the Delta from 1991 to 2020. According to the surveys, the study period was found to have experienced a doubling of irrigated area amidst steady cropland area. The irrigated crop mix shifted towards corn and especially soybean at the expense of cotton and rice. Groundwater remained the primary water source across the Delta, but alternate surface water sources were adopted to reduce groundwater pumping. Electricity and propane/butane/LPG became more prevalent energy sources at the expense of diesel. Furrow irrigation grew with the popularity of polypipe and precision land-forming and was preferred over sprinkler irrigation and especially micro-irrigation. On the other hand, the geospatial analysis contributed original findings about the end of the study period. The density of irrigated area displayed moderate spatial autocorrelation at grid sizes at least between 0.8 km and 12.8 km. Soybean, cotton, corn, and rice were two times, one sixth, one third, and seven times as prevalent, respectively, in irrigated soils of high hydric rating as in irrigated soils of low hydric rating. The years 2010–2014 were top issue years for surface water diversion permits, whose coverage area was 9% that of groundwater withdrawal permits but was overlapped with the latter by 62%. Noting that these observations were heavily dependent on dynamic variables such as technological advances and especially government policy and market conditions, the past may not indicate the future, so follow-up studies at routine intervals would be appropriate.

Author Contributions

H.C.P.III contributed to study conceptualization, data interpretation, and manuscript revision; T.H.L. conducted the study and prepared the manuscript. All authors have read and agreed to the published version of the manuscript.

Funding

This study was sponsored by the Agricultural Research Service, United States Department of Agriculture, under Cooperative Agreement Number 58–6001−7–001.

Institutional Review Board Statement

Not applicable.

Informed Consent Statement

Not applicable.

Acknowledgments

This publication is a contribution of the National Center for Alluvial Aquifer Research and the Mississippi Agricultural and Forestry Experiment Station. The authors are grateful for the leadership and encouragement of director Jason Krutz and the logistical coordination of project manager Keri Lewis, both of the Mississippi Water Resources Research Institute at Mississippi State University, without which this study would not have been undertaken and completed. The authors especially appreciate the staff of the Yazoo Mississippi Delta Joint Water Management District and of the National Agricultural Statistics Service for collecting, compiling, and sharing their invaluable data, without which this study could not have been even possible. The authors also thank the anonymous ad-hoc reviewers and the publisher’s production team for their constructive comments and edits on this manuscript.

Conflicts of Interest

The authors declare no conflict of interest.

References

  1. Galloway, G.E., Jr. Ex Post Evaluation of Regional Water Resources Development: The Case of the Yazoo-Mississippi Delta; IWR-80-D1; United States Army Corps of Engineers: Belvoir, VA, USA, 1980. [Google Scholar]
  2. Snipes, C.E.; Nichols, S.P.; Poston, D.H.; Walker, T.W.; Evans, L.P.; Robinson, H.R. Current Agricultural Practices of the Mississippi Delta; Bulletin 1143; Mississippi Agricultural & Forestry Experiment Station: Starkville, MS, USA, 2005. [Google Scholar]
  3. Yazoo Mississippi Delta Joint Water Management District. Water Management Plan; Yazoo Mississippi Delta Joint Water Management District: Stoneville, MS, USA, 2006. [Google Scholar]
  4. Massey, J.H.; Stiles, C.M.; Epting, J.W.; Powers, R.S.; Kelly, D.B.; Bowling, T.H.; Janes, C.L.; Pennington, D.A. Long-term measurements of agronomic crop irrigation made in the Mississippi delta portion of the lower Mississippi River Valley. Irrig. Sci. 2017, 35, 297–313. [Google Scholar] [CrossRef]
  5. Arthur, J.K. Hydrogeology, Model Description, and Flow Analysis of the Mississippi River Alluvial Aquifer in Northwestern Mississippi; Water-Resources Investigation Report 2001–4035; United States Geological Survey: Pearl, MS, USA, 2001. [Google Scholar]
  6. USGS Groundwater Watch: Mississippi River Valley Alluvial Aquifer. Available online: https://groundwaterwatch.usgs.gov/netmapT2L1.asp?ncd=MRA (accessed on 24 September 2021).
  7. Killian, C.D.; Asquith, W.H.; Barlow, J.R.B.; Bent, G.C.; Kress, W.H.; Barlow, P.M.; Schmitz, D.W. Characterizing groundwater and surface-water interaction using hydrograph-separation techniques and groundwater-level data throughout the Mississippi Delta, USA. Hydrogeol. J. 2019, 21, 2167–2179. [Google Scholar] [CrossRef] [Green Version]
  8. Haugh, C.J.; Killian, C.D.; Barlow, J.R.B. Simulation of Water-Management Scenarios for the Mississippi Delta; Scientific Investigations Report 2019–5116; United States Geological Survey: Reston, VA, USA, 2020. [Google Scholar]
  9. Yasarer, L.M.W.; Taylor, J.M.; Rigby, J.R.; Locke, M.A. Trends in land use, irrigation, and streamflow alteration in the Mississippi River Alluvial Plain. Frontiers Environ. Sci. 2020, 8, 66. [Google Scholar] [CrossRef]
  10. Census of Irrigation. Available online: https://www.nass.usda.gov/Surveys/Guide_to_NASS_Surveys/Farm_and_Ranch_Irrigation/index.php (accessed on 25 June 2021).
  11. Census of Agriculture. Available online: https://www.nass.usda.gov/AgCensus/ (accessed on 11 September 2021).
  12. Major Land Resource Area (MLRA) Geographic Database, Version 4.2. Available online: https://www.nrcs.usda.gov/wps/portal/nrcs/detail/soils/survey/?cid=nrcs142p2_053624 (accessed on 20 July 2021).
  13. County Boundaries for Mississippi (2015). Available online: https://www.maris.state.ms.us/HTML/DATA/data_Boundaries/CountyBorders.html (accessed on 12 July 2021).
  14. State Soil Geographic (STATSGO) Data Set. Available online: https://www.maris.state.ms.us/HTML/DATA/data_Geoscience/StatewideSoils.html (accessed on 12 July 2021).
  15. CropScape—Cropland Data Layer. Available online: https://nassgeodata.gmu.edu/CropScape/ (accessed on 12 July 2021).
  16. Mississippi Commission Environmental Quality Surface Water Groundwater Use and Protection Regulations. Available online: https://www.mdeq.ms.gov/wp-content/uploads/2017/06/11-Miss.-Admin.-Code-Pt.-7-Ch.-1.pdf (accessed on 5 October 2021).
  17. Harris, C.R.; Millman, K.J.; van der Walt, S.J.; Gommers, R.; Virtanen, P.; Cournapeau, D.; Wieser, E.; Taylor, J.; Berg, S.; Smith, N.J.; et al. Array programming with NumPy. Nature 2020, 585, 357–362. [Google Scholar] [CrossRef]
  18. Bivand, R.S.; Wong, D.W.S. Comparing implementations of global and local indicators of spatial association. Test 2018, 27, 716–748. [Google Scholar] [CrossRef]
  19. Gräler, B.; Pebesma, E.; Heuvelink, G. Spatio-Temporal Interpolation using gstat. R J. 2016, 8, 204–218. [Google Scholar] [CrossRef]
  20. Climate Data Online. Available online: https://www.ncdc.noaa.gov/cdo-web/ (accessed on 30 October 2021).
  21. Mabry, S.; Mississippi Department of Environmental Quality, Jackson, MS, USA. Personal communication, 2021.
  22. SoilWeb: An Online Soil Survey Browser. Available online: https://casoilresource.lawr.ucdavis.edu/gmap/ (accessed on 27 September 2021).
  23. Yazoo Mississippi Delta Joint Water Management District. 2011 Annual Report. Yazoo Mississippi Delta Joint Water Management; District: Stoneville, MS, USA, 2012. [Google Scholar]
  24. Stanturf, J.A.; Gardiner, E.S.; Hamel, P.B.; Devall, M.S.; Leininger, T.D.; Warren, M.E. Restoring bottomland hardwood ecosystems in the Lower Mississippi Alluvial Valley. J. For. 2000, 98, 10–16. [Google Scholar] [CrossRef]
  25. Grim, V. The High Cost of Water: African American Farmers and the Politics of Irrigation in the Rural South, 1980–2000. Agric. Hist. 2002, 76, 338–353. [Google Scholar] [CrossRef]
  26. Reba, M.L.; Massey, J.H. Surface irrigation in the Lower Mississippi River Basin: Trends and innovations. Trans. ASABE 2020, 63, 1305–1314. [Google Scholar] [CrossRef]
  27. Brock, M.L. Analysis of Surface Water for Irrigation in the Big Sunflower River Watershed. Master’s Thesis, Mississippi State University, Starkville, MS, USA, 2021. Available online: https://scholarsjunction.msstate.edu/td/5086/ (accessed on 14 September 2021).
  28. Quintana-Ashwell, N.; Gholson, D.M.; Krutz, L.J.; Henry, C.G.; Cooke, T. Adoption of Water-Conserving Irrigation Practices among Row-crop Growers in Mississippi, USA. Agronomy 2020, 10, 1083. [Google Scholar] [CrossRef]
  29. Los Angeles, CA Ultra-Low Sulfur CARB Diesel Spot Price. Available online: https://www.eia.gov/dnav/pet/hist/LeafHandler.ashx?n=pet&s=eer_epd2dc_pf4_y05la_dpg&f=m (accessed on 13 September 2021).
  30. Average Retail Price of Electricity, United States, Monthly. Available online: https://www.eia.gov/electricity/data/browser/#/topic/7 (accessed on 13 September 2021).
  31. Mont Belvieu, TX Propane Spot Price FOB. Available online: https://www.eia.gov/dnav/pet/hist/eer_epllpa_pf4_y44mb_dpgM.htm (accessed on 13 September 2021).
  32. Yanik, K. Propane Poised to Overtake Diesel Engines on the Farm. Available online: https://www.lpgasmagazine.com/irrigation-transformation-propane-poised-to-overtake-diesel-engines-on-the-farm/ (accessed on 28 September 2021).
  33. Salassi, M.E.; Musick, J.A.; Heatherly, L.G.; Hamill, J.G. An Economic Analysis of Soybean Yield Response to Irrigation of Mississippi River Delta Soils; Mississippi Agricultural & Forestry Experiment Station: Starkville, MS, USA, 1984. [Google Scholar]
  34. Heatherly, L.G.; Pringle, H.C. Soybean Cultivars' Response to Flood Irrigation of Clay Soil. Agron. J. 1991, 83, 231–236. [Google Scholar] [CrossRef]
  35. Laws, F. Irrigation: A Game-Changer for Mid-South Agriculture. Available online: https://www.farmprogress.com/irrigation-systems/irrigation-game-changer-mid-south-agriculture (accessed on 7 October 2021).
  36. Kaur, G.; Singh, G.; Motavalli, P.P.; Nelson, K.A.; Orlowski, J.M.; Golden, B.R. Impacts and management strategies for crop production in waterlogged or flooded soils: A review. Agron. J. 2020, 112, 1475–1501. [Google Scholar] [CrossRef] [Green Version]
  37. Solomon, K.H.; El-Gindy, A.M.; Ibatullin, S.R. Planning and System Selection. In Design and Operation of Farm Irrigation Systems; Hoffman, G.J., Evans, R.G., Jensen, M.E., Martin, D.L., Elliott, R.L., Eds.; American Society of Agricultural and Biological Engineers: St. Joseph, MI, USA, 2007; pp. 57–75. [Google Scholar]
  38. Pringle, H.C., III; Martin, S.W. Cotton yield response and economic implications to in-row subsoil tillage and sprinkler irrigation. J. Cotton Sci. 2003, 7, 185–193. [Google Scholar]
  39. Pringle, H.C., III; Ebelhar, M.W.; Martin, S.W. Yield, and economic response of cotton to in-row deep tillage and furrow irrigation in a corn/cotton rotation on a silty clay loam soil. J. Cotton Sci. 2008, 12, 331–344. [Google Scholar]
Figure 1. (a) Boundaries of the Yazoo–Mississippi Delta (blue shaded region) and the 19 counties it spans; (b) geographic distribution of the low (light grey), medium (dark grey), and high (black) soil hydric classes across the Yazoo–Mississippi Delta.
Agronomy 11 02548 g001
Figure 2. According to the Census of Agriculture, (a) irrigated fraction of harvested cropland among all-Delta counties; (b) irrigated harvested cropland as fraction of each full-Delta county.
Agronomy 11 02548 g002
Figure 3. Stacked column graph of irrigated harvested cropland in Mississippi according to the Census of Agriculture, with the segment height of each color indicating the portion within the corresponding county.
Agronomy 11 02548 g003
Figure 4. Studied permits as fraction of Delta area and as fraction of Delta cropland at the end of 2020, computed by county (left: full-Delta counties; center: part-Delta counties) and by soil hydric class (right: low, medium, high) according to the geospatial analysis.
Agronomy 11 02548 g004
Figure 5. Based on rasterizing on a 1.6 km grid the area under studied permits at the end of 2020 according to the geospatial analysis, (a) the density of irrigated areas; (b) the zones of strong positive spatial autocorrelation as identified by the local Moran’s I test.
Agronomy 11 02548 g005
Figure 6. Across full-Delta counties according to the Census of Agriculture, (a) the fraction of irrigated harvested cropland occupied by each crop and (b) the irrigated fraction of each crop’s harvested area.
Agronomy 11 02548 g006
Figure 7. Averaging over 2016–2020 according to the geospatial analysis, (a) each crop as a fraction of all cropland under studied permits (i.e., irrigated crop mix; cf. Figure 6a) and (b) the fraction of each crop under studied permits (i.e., irrigated fraction; cf. Figure 6b).
Agronomy 11 02548 g007
Figure 8. Averaging over 2016–2020, the extent of each cover type as a fraction of permitted land and of never-permitted land according to the geospatial analysis.
Agronomy 11 02548 g008
Figure 9. Irrigation water sources in Mississippi by Farm and Ranch Irrigation Survey year and studied surface water permits by issue year; permits that were issued before 1992 were not shown because they were often assigned to water withdrawal sites in operation prior to the permitting requirement and thus were deemed not to reflect accurately the new development during their issue years.
Agronomy 11 02548 g009
Figure 10. Irrigation energy sources in Mississippi by Farm and Ranch Irrigation Survey year; the values for natural gas and gasoline/ethanol were not reported in 2013.
Agronomy 11 02548 g010
Figure 11. (a) Irrigation application methods and (b) gravity-irrigated fraction of irrigated crop in Mississippi by Farm and Ranch Irrigation Survey year; the Figure 11a values for polypipe in 1994 and 1998 as well as the Figure 11b value for rice in 2003 were not reported.
Agronomy 11 02548 g011
Table 1. The eight basic land cover types in this study and their corresponding Cropland Data Layer classification codes.
CoverCropland Data Layer Codes
soybean5, 26, 240, 241, 254
cotton2, 232, 238, 239
corn1, 12, 13, 225, 226, 228, 237
rice3
other crops4, 6, 10, 11, 14, 21, 22, 23, 24, 25, 27, 28, 29, 30, 31, 32, 33, 34, 35, 38, 39, 41, 42, 43, 44, 45, 46, 47, 48, 49, 50, 51, 52, 53, 54, 205, 206, 207, 208, 209, 213, 214, 216, 219, 221, 222, 227, 229, 230, 231, 233, 234, 235, 236, 243, 244, 245, 246, 247, 248, 249, 250
grass/trees36, 37, 55, 56, 57, 58, 59, 60, 61, 63, 64, 65, 66, 67, 68, 69, 70, 71, 72, 74, 75, 76, 77, 87, 131, 141, 142, 143, 152, 176, 190, 195, 204, 210, 211, 212, 215, 217, 218, 220, 223, 224, 242
water83, 92, 111, 112
built surfaces82, 88, 121, 122, 123, 124
Publisher’s Note: MDPI stays neutral with regard to jurisdictional claims in published maps and institutional affiliations.

