Abstract
The Latest Common Agricultural Policy reform intends to expand and strengthen environmental and social support and to liberalise the delivery model carried out through strategic planning. This paper aims to assess the potential impacts of the new CAP reform on the main agricultural markets in Croatia. The impact assessment is analysed using the AGMEMOD model where, in addition to the baseline scenario, three scenarios of potential changes are developed and compared to the baseline. Changes in market patterns (production, yield and net trade) at the end of the simulated period are compared with the baseline scenario results by 2030. The reduction in support levels to production, abolishment of voluntary coupled supports and introduction of additional environmental constraints have a significant impact on the main Croatian agricultural markets. Crop markets prov to be less dependent on subsidies, so that market pattern changes will not mean the loss of Croatia’s net export status for soft wheat, maize and soy beans, while barley no longer holds this status. Livestock sectors, especially beef and dairy, in addition to demonstrating a distinct lack of competitiveness even before the Croatian accession to the EU, additionally suffer significant production volume losses along with an increase in imports. Although significant, changes to the Croatian agricultural market are not dramatic enough to cause a complete production breakdown by 2030.
1. Introduction
The Common Agricultural Policy (CAP), since its creation in the 1960 s, has been in a constant process of reform [1,2,3]. From a political economy perspective, the CAP has experienced significant changes in terms of policy targets and instruments due to external and internal pressures such as international trade, domestic budgetary disputes and growing environmental and social concerns [4,5]. Successive CAP reforms since the 1990s have continually diminished the role of market and price policy support, and the market orientation of the CAP has increased with the implementation of coupled and decoupled payments [6]. Along with this change, measures became more and more complex and have started addressing diverse challenges such as environmental issues, rural development, food quality and safety, market volatility and risks, etc. [5,7].
The latest CAP reform process began in June 2018, when the European Commission (EC) presented three legislative proposals for the 2021–2027 period [8,9,10]. Motives for the current policy change are characterised by a concern for the environment and climate (agriculture contributed to 10% of the EU’s overall GHG emissions and is implicated in soil erosion, water scarcity and pollution, and pressures on wildlife and biodiversity) [11], although these issues were already addressed in previous CAP cycles with limited success; the new complement of goals thus contains 9 economic, environmental and social priorities to be pursued through the policy.
Current CAP environmental measures and their impacts on agricultural production have been the subject of research by many authors such as Cortignani and Dono [12], who showed that “greening” under the previous (2013) reform was not very environmentally beneficial throughout the study area of Southern Italy and that only some farm types have been affected by farming practice changes. Gocht et al. [3] analyzed the economic and environmental impacts of greening using the CAPRI model. Results showed that its economic impacts (land use, production, price and income) are rather small, although some farm types, crops (fallow land and pulses) and member states may be affected more significantly; greening will lead simultaneously to a small increase in prices and a small decrease in production. Bartolini et al. [13] found that agri-environmental-climate schemes (AECSs) have a significant effect on extensification, but that the provision of environmental goods differs among the varying levels of payments, which in the authors’ opinion indicates the necessity of measuring the cost-effectiveness of AECSs.
The last policy proposal put a much greater emphasis on agri-environmental support in terms of budgetary distribution and result orientation of measures. Political negotiations from proposal to consensus on the CAP reform were mainly influenced by internal and global challenges which are related to a smaller budget due to Brexit, demands for improved efficiency of the policy, increased flexibility of member states in allocating funds, along with significantly higher environmental and climate goals [14,15,16,17,18]. The new “green architecture” of the CAP post-2022 includes enhanced conditionality for direct support and eco-schemes in the first pillar and agri-environmental climate measures in the second pillar. The other main novelty concerns the introduction of a “New CAP delivery model” which will entail strategic plans prepared by member states (MSs) to implement both pillars of the policy, which should enable greater flexibility and efficiency [18,19]. The new delivery model envisages options for MSs to choose how to direct their national CAP spending in order to create more targeted measures and result-based policies. This feature will allow MSs to direct their given CAP budgetary funds to interventions which will support nine priorities based on quantitatively set targets.
The elaboration of Strategic plans at the national level should be based on evidence and analytical support systems that would facilitate the selection of the best distribution of funds and measures to achieve national targets. In order to help decision makers with their choice, strategic plans with an impact assessment of policy changes need to be provided, to enable the shift to evidence-based policymaking [20]. The economic and market perspectives of planning also include the assessment of potential changes in farm income, land use, supply and demand trends and foreign trade, as well as consideration of the implications for the politically sensitive issue of national agro-food self-sufficiency. Very few studies, apart from EC [20], deal with the impacts on agricultural markets by the post-2022 CAP. Research on the new CAP is mainly focused on how the new policy will contribute to environmental efficiency or on the effects of agricultural trade on the environment, accompanied by heavy criticism of “old” policy elements such as production-coupled payments and direct support [21,22,23,24,25].
The new reform and its related strategic options raise the question of which tools MSs should use to support their decision-making process in the field of economic impacts. The use of models in assessing the impact of permanent changes in the CAP is an established practice of the European Commission and the scientific community [26]. The most common tools in such studies are Computable General Equilibrium (CGE) models, Partial Equilibrium (PE) and Farm management-type models [10,27,28,29,30,31].
The contribution of this research is the application of the Partial equilibrium (PE) sectoral model AGMEMOD to develop a model-based scenario impact assessment under the CAP post-2022 reform with a focus on the main agricultural markets of a single member state (Croatia). Changes in particular market production and net trade structure at the MS level due to exogenous changes in policy variables relative to market projections without policy changes are analysed. The goal of this research is therefore to assess the impact of different options of implementing new direct payments focusing on stronger or weaker environmental conditions compared to the “no policy change” scenario.
The paper addresses an important question: What is the extent of the impact of the stylized model-based policy scenario changes on production and on the net trade structure within the main Croatian agri-food markets up to 2030, considering a stronger or weaker environmental focus compared to the “no policy change” scenario? It is hypothesized that even radical changes in direct payments such as the abolition of voluntary coupled supports would not lead to a breakdown in the production structure nor to dramatic changes in production and net trade at the national level up to 2030. On the other hand, an environmentally strong focused scenario might significantly impact future developments in some Croatian sectors highly dependent on public support. Our assessment of impacts will also test the PE sectoral model itself in terms of the model type’s suitability to provide a plausible model-based assessment.
The structure of the paper is as follows: First, it details the agricultural policy as a constant process of reforms with outlines of major changes within the new CAP reform, which is significantly affecting agricultural markets. Then, the specifics of agricultural policy and agricultural production in Croatia are described, as these features will certainly importantly influence the choice of national CAP budget spending. Section 2 describes the methodology, modelling approach and changes to the model in accordance with scenario details. Scenario results with regard to the impacts of the changes in the budget, instruments and measures under the new agricultural policy on the main agricultural markets in Croatia are analysed in Section 3. In light of the results, a discussion regarding the impact of the new CAP on Croatian agricultural markets up to 2030 and the applicability of PE sectoral models in such situations is presented in Section 4.
Croatian Agricultural Production and Policy before and after CAP Harmonization
The agricultural sector of Croatia is characterized by a dual structure of agricultural holdings with a high share of small, technologically inefficient farms with low productivity, while the production structure favours arable crop production, enabling the country’s status of net exporter of crops [32,33,34]. While Croatia was a net exporter of arable crops even before accession to the EU, its higher competitiveness in crop (primarily cereal and oilseeds) markets as compared to livestock markets has perpetuated the domination of crops, whose share of gross agricultural production was 61.5% in 2020 [35].
The total output of the agricultural sector has grown since accession (Figure 1), mainly as a result of growth in the volume of crop production, while livestock production has stagnated or recorded negative results, depending on the observed sector. There have been particularly strong negative production trends found in the main livestock sectors, especially in the beef, dairy and pig sectors [34,36,37,38,39].
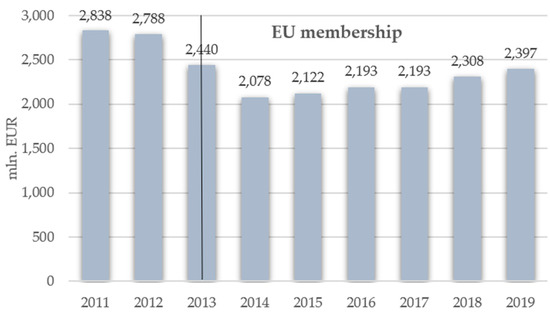
Figure 1.
Output of the Croatian agricultural sector, 2011–2019, in million EUR [40].
Agricultural policy in Croatia is characterized by a relatively short but rather turbulent path taking place in several stages since independence in 1990 [41]. The first stage entailed the establishment of market price support and trade protection measures along with support focused on the reconstruction of production capacities devastated by the war. The next stage began in the early 2000s and was marked by an increase in budgetary expenditure, mainly on coupled direct payments to various agri-food sectors. Between 2010 and 2013, the last stage of intensive CAP harmonization began, at which decoupled payments were introduced and the list of sectors receiving coupled payments shortened [32].
The current policy directed national and EU CAP funds towards direct payments (DP). An annual DP envelope in the amount of 373 mln. EUR for the period after 2015 was set according to the 1307/2013 EU regulation [42], which includes national top-ups until 2023, when CAP direct payments will be financed solely by the EU. In order to further increase the size of the DP envelope, decision makers decided to transfer funds from the second to the first pillar in the amount of 15% of the total RD annual envelope, which increased the annual DP envelope by 49.8 mln. EUR.
A significantly higher amount of national and EU CAP funds is allocated to the first pillar along with a relatively large share of voluntary coupled support, which is mainly directed to livestock sectors (beef, dairy and sheep and goat) (Table 1). Such national policy discourse indicates that policy makers strive to incentivize agri-food market production in order to achieve self-sufficiency levels.

Table 1.
Distribution of 1st Pillar direct payments per measure for Croatia in the period 2015–2020.
In addition, Croatia was paying out state aid which is not part of the CAP and which is allowed by the Accession Treaty. This aid was allocated to some sensitive sectors (olives, olive oil, tobacco, dairy cows and breeding sows). The total annual amount of state aid was set to 22.3 mln. EUR for a period of three years after accession, when the aid functioned as coupled support. Afterwards, these aids were transformed into de minimis support up to 2020.
2. Materials and Methods
The AGMEMOD (Agricultural Member State Modelling) is an econometric, dynamic, multi-product and multi-country partial equilibrium model. It is commonly used to produce medium-term simulations, i.e., market outlooks for key agricultural commodity markets and policy impact assessments for EU member states and other countries [43]. The AGMEMOD partnership uses a bottom-up approach, according to which an individual country-level model (Figure 2) is built as a system of agricultural commodity market sub-models with country-specific characteristics to be subsequently combined in a composite EU 27 AGMEMOD model [44,45].
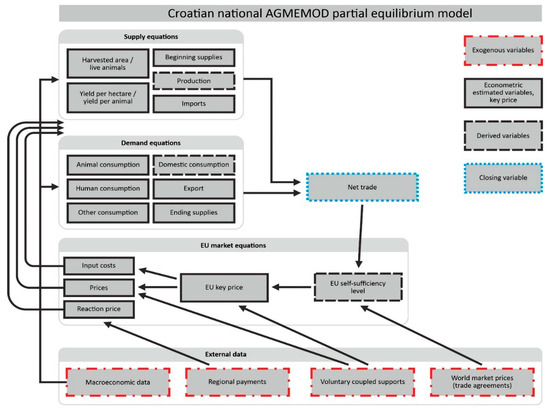
Figure 2.
Stylized structure of the national AGMEMOD model, elaborated by authors according to Bartova et al. [27].
The Croatian country-level model is a result of the authors’ standalone model, according to the AGMEMOD Partnership modelling approach [46]. The supply and demand balance sheets covering data on production, consumption, imports and exports of the observed agricultural markets represent the core endogenous data of each commodity market. National and EU statistical databases for member states were used for the core data. Sub-models, i.e., commodity market models of the key crop and livestock markets, include sets of econometrically estimated behavioural equations that display the relationships of supply and demand. Agricultural commodities are mutually linked via technological relations on the production side and via complementarity or substitutability relations on the consumption side [31]. Econometrically estimated equations were calibrated and then validated based on expert knowledge and literature. In the relations of supply and demand, exogenous variables such as specific Croatian political instruments (direct payments in Croatia during the 2015–2020 period) and macroeconomic variables were incorporated. CAP instruments are incorporated in a harmonised way, meaning that regional and coupled payments are recalculated and included as policy price add-ons [47].
The AGMEMOD model explains future production development based on previous production and stock levels; conversely, previous consumption levels are used to explain future consumption changes. The development of commodity prices in the Croatian model is determined by the national price and self-sufficiency ratio for a given commodity linked with the EU key price and the self-sufficiency ratio of the same commodity. Other variables included in the Croatian model are time trends (a proxy for technological progress) and dummy variables (for special policy regulations or quotas). More details on the structure of the equations involved in the AGMEMOD partnership modelling approach are described in the work of other authors [46,48,49].
2.1. Modelling Approach
The AGMEMOD modelling approach adopted and used in this research takes into account the different effects of coupled and decoupled direct payments as well as additional environmental constraints included in the description of policy instruments [50]. A policy-harmonised approach within AGMEMOD (Figure 3) enables the recalculation of direct and coupled payments to form a policy price add-on to specific producer prices, thus creating a reaction price and gross margins. Changes in the levels of reaction prices and expected gross margins reflect the impacts of policy change (within the instruments and measures of the CAP in combination with the market price) on the production structure of the observed market. The decoupled and coupled payments’ effects on the specific producer price are determined via multiplier coefficients that represent the share of a particular payment in reaction prices or expected gross margins. In different scenarios, the regional Single Area Payments (SAP) multipliers are set differently with the intention to simulate the possible effects of post-2022 changes to CAP.
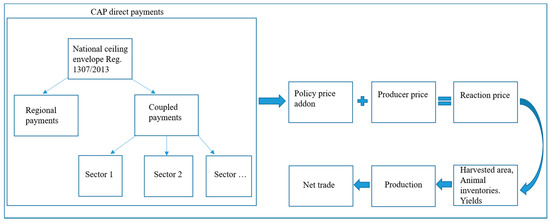
Figure 3.
Policy-harmonised approach within the AGMEMOD model.
Example of crop and livestock policy price add-on equations:
where cpm and rpm are multipliers of coupled and regional payments, cptt,j is the ceiling for the total coupled payments envelope for crop culture j, rptt represents the regional payments envelope, ahrtj represents the reference area for the crop j, and aht−1,j is the lagged observed area harvested of crop culture j.
where cctt−1,i represents the number of animals in group i in year t − 1, ltdt−1 is the average livestock density and slwt,i is the average slaughter weight of animals in group i.
prct,j = (cpm ∗ cptt,j/max (ahrtj, aht−1,j) + (rpm ∗ rptt)/aht−1,j)/yieldt−1,j
prct,i = (cpm ∗ cptt,i)/cctt−1,i + ((rpm ∗ rptt)/aht−1)/ltdt−1/slwt,i
The price add-on (prc) variable is subsequently used in econometrically estimated equations, for example:
where ccti,t is the final breeding number of animal species (i), pi,t is the real producer price for the year t and V is a vector indicating an exogenous variable that can affect the ending breeding numbers of animal species (i). More details about the policy-harmonised modelling approach are available in the work of Salputra et al. [47].
ccti,t = f(ccti,t−1, (pi,t + prci,t), V) i = 1, …, n
For the purposes of the scenario analysis described in the next section, changes take into account the budgetary changes (decoupled and coupled payments), flexibility between pillars and SAP multiplier; however, the 2nd pillar measures were not modelled, as these types of models are not capable of taking them into account. The prices of the analysed markets were not included into the scenario simulation results, as scenario changes were applied only to the Croatian stand-alone model and not to the EU 27 model.
2.2. New Policy Scenarios
The assessment of the impact of policy change in different scenarios for the Croatian agricultural markets made by the AGMEMOD model is based on the reactions of commodity markets to changes in the CAP budget size, policy instruments and multipliers during the 2023–2030 period, since the current CAP rules are extended until 2023. Next-Generation EU funds are also included for 2021 and 2022 on national CAP envelopes according to the EU (NextGenEU) Parliament regulation [51]. To determine the possible impacts of the new CAP on Croatian agricultural markets, three scenarios related to the baseline scenario were developed, with an intention to design scenarios based on a multi-tier hierarchy. Levels in the hierarchy simulate support levels to agricultural producers with regard to the level of environmental commitment (obligatory and less demanding in lower tiers, and more voluntary and demanding requirements in higher-tier scenarios).
Baseline scenario—Represents the ‘no policy change’ scenario that serves as a counterfactual to identify the effects on Croatian agricultural markets and to establish a yardstick against which policy simulations can be judged. It assumes a continuation of the current (CAP 2015–2020) budget, and measures and instruments according to EU Council regulations 1307/2013 and 1310/2013 [42,52] (Table 1), with stable climate conditions and no other exogenous shocks (general economic environment, no extreme weather and disease outbreaks), with steady demand and yield trends up to 2030. The Single Area Payment multipliers are set at 0.3.
Tier 1 entry level scenario—Represents a possible national CAP spending direction with minimal changes in the budgetary and policy framework, retaining the current, mainly production-market-oriented nature of policy in Croatia (Table 2). This scenario includes Croatia’s CAP post-2022 budgetary changes according to the new Multi-annual Financial Framework (MFF) breakdown of national pre-allocated ceilings for direct payments, rural development (RD) and Next Generation EU for the coming 2021–2027 programming period [51,53,54]. It is assumed that Croatia will retain the flexibility mechanism that transfers funds from the European Agricultural Fund for Rural Development (EAFRD) to the European Agricultural Guarantee Fund (EAGF) in an amount of 5% of the total RD envelope. Voluntary coupled support is also retained in this scenario, but its total allocation is reduced from 15% to 13% of the direct payments envelope. Furthermore, environmental commitments in this scenario are set to minimal, which means one eco-scheme (25% of direct payments proposed by the Council). Eco-schemes must entail at least 25% of the DP envelope; they are mandatory for member states to establish and voluntary for farmers to participate in, covering farm-level commitments going beyond basic EU requirements (conditionality). Given that eco-schemes will provide non-market goods or benefits such as clean water, biodiversity and recreational value, their market effect is difficult to simulate with PE sectoral models. It is not yet known which eco-scheme Croatia will choose and what conditions producers will need to meet for it; in order to simulate the market effect of the eco-scheme, we assumed that at least 50% of producers would be in compliance with the requirements. Ultimately this means a 12.5% overall reduction of the Croatian direct payments envelope in the 2023–2030 period. Since this scenario does not include significant changes in policy instruments, the regional Single Area Payments multiplier has been set at 0.4. It is suspected that this scenario is supposed to mimic the historical payments that have a greater production effect [55], assuming that farmers will be more willing to invest in appropriate production technologies.
Table 2.
Tier 1 scenario description of Croatian national CAP post-2022 budgetary changes.
Tier 2 mid-level scenario—This scenario is a middle ground between the production- and environment-focused directions of CAP support. It takes into account the same budgetary changes of the new MFF, but removes the flexibility between pillars (Table 3). This scenario assumes the abolishment of voluntary coupled support, since such payments are, in some ways, in conflict with the new CAP objectives and green ambitions [56]. Some authors also state that coupled supports disturb fair competition between agri-food sectors, that they are applied in a very generic way, and that they are focused towards already intensive livestock sectors, which have a significant environmental impact [24,57]. Environmental commitments in this scenario are set to medium and eco-schemes are assumed to amount to 40% of the overall DP budget, which means a 20% overall reduction in the Croatian direct payments envelope in the 2023–2030 period. Since the environmental commitments are somewhere between the entry-level and high-level commitment scenarios, the SAP multiplier coefficient is set at 0.3.
Table 3.
Tier 2 scenario description of Croatian national CAP post-2022 budgetary changes.
Tier 3 high-level scenario—The focus of this scenario is primarily on environmental commitments, as well as on rural development and societal issues, and less on the production-oriented approach. It represents the biggest change compared to the baseline scenario, with a transfer of funds from the DP to the RD envelope, abolishment of VCS, and a high level of environmental commitment (Table 4). In this scenario, eco-schemes take up 60% of the total DP envelope, resulting in a 30% total reduction in the total DP envelope. In this scenario, the SAP multiplier coefficient are lower (0.2) for direct payments, reflecting a smaller effect of subsidies on production due to the assumption that the policy targets environmental and societal measures more, which will force producers to adopt more environmentally friendly production technologies.
Table 4.
Tier 3 scenario description of Croatian national CAP post-2022 budgetary changes.
The results of the scenario analysis for the main agricultural markets in the Republic of Croatia are presented for soft wheat, corn, barley and soy beans in the crop area and for beef and cattle, pork, lamb and sheep, and cow’s milk. These markets made up over 65% of the total agricultural output in Croatia in 2018 [58].
3. Results
3.1. Crop Market Simulation Results
The share of crop production in Croatian agriculture after EU accession is around 60% (40% of which are cereals). Competitive crop production is a consequence of a long tradition of production, suitable natural resources, and technological progress, which is manifested through an increase in quality but also yields, which are converging towards the EU average, resulting in a net trade surplus in the cereal and oilseed markets [33].
Results of the baseline scenario, in which the current CAP 2015–2020 measures continue up to 2030, confirm such findings and indicate an overall increase in crop production volumes (Table 5), based especially on increases in yields, while the sown areas do not change significantly.
Table 5.
AGMEMOD simulation results for the main Croatian crop markets.
Under all three scenarios, the values of the modelled variables (crop market patterns) are all lower compared to the baseline scenario, though still higher as compared to 2018—growing at different speeds depending on the scenario. As expected, the tier 1 entry-level scenario demonstrates the smallest changes within the observed key crop markets (production of soft wheat −4%; barley −2.8%; maize −5.6%; soy beans −4.7%), while the biggest changes in market outcomes, especially in production and net export quantities, occur under the tier 3 high-level environmental commitment scenario, which assumes substantial CAP budgetary, measure and instrument adjustments combined with greater environmental requirements for budgetary support when compared to the baseline (production of soft wheat −13%; barley −11.2%; maize −16.4%; soy beans −15.5%).
The scenario with small budgetary changes and minimal environmental commitments indicates a slight reduction in net trade and production volumes, while the scenario with the most radical changes in terms of substantial DP budgetary cuts and high environmental commitments shows a moderate negative effect on simulated market indicators. In all scenarios, Croatia remains a net exporter in all observed crop markets, with higher net exports at the end of the simulated period compared to the historical period. Such simulation results may indicate that the main crop sectors in Croatia are not that dependent on high levels of public support and are competitive at least in a regional context.
3.2. Livestock Market Simulation Results
In contrast with the crop sectors, livestock markets stagnate or even decline with respect to production quantities under the baseline scenario (Table 6). As is the case in many new member states, beef production is declining, as are the numbers of dairy cows, while increases in milk yields are observed [44,59]. The Croatian beef and dairy baseline results follow this pattern as well, with shrinking animal herds (dairy −33% and beef cattle −10.2%) and an expected decrease in beef (−29.7%) and milk production (−18.3%). The reduction in the number of dairy cows and a changing breeding structure are also connected with the increase in milk yields (21.25%). Of the other considered livestock markets, pork as well as lamb and sheep will experience a slight growth, reflected by increased live animal numbers and in growing meat production under the baseline scenario. However, under the given modelling assumptions, Croatia will remain a net importer of all the considered livestock products until 2030, while imports of beef and dairy products are expected to grow.
Table 6.
AGMEMOD simulation results for the main Croatian livestock markets.
Due to low competitiveness, the Croatian livestock sector does not show any real potential for growth under the three new policy scenario simulations. On the contrary, all three scenario simulation results indicate a decrease in the observed market indicators compared to the baseline, and in the mid-level and high-level environmental commitment scenarios, the impact of new policy elements is quite significant in the beef, dairy, lamb and sheep markets.
As expected, the tier 3 scenario has the greatest impact on livestock markets in all observed markets except the pork market, which exhibits a minor change in all scenarios. Beef, dairy, lamb and sheep markets suffer a significant impact under tier 2 and tier 3 scenarios, reflected by a decrease in the number of live animals and production quantities, compared to the baseline and historical data. The reason for such negative simulated trends is most likely that, at the moment, these sectors are subject to coupled support provided by the current agricultural policy in Croatia; reducing or abolishing these payments will have a negative impact on production and generally on self-sufficiency levels in these commodities by 2030.
The pork market shows only minor changes in market pattern developments under all scenarios. The reason may not lie in the resilience and competitiveness of Croatian pork producers, but is more likely explained by the fact that the pork market, like in other EU member states, is not a recipient of direct payments.
4. Discussion
The assessment of the impacts of the implementation of the CAP post-2022 policy in Croatia confirms the utility of conducting analyses at the MS level, wherein specific solutions tailored to national priorities could be considered. In this paper, we focused on the impacts stemming from different potential options in the future policy area of Croatian agricultural policy. We analysed three scenarios and focused on the two extreme options that arise from the options available to MSs under the new CAP framework. One represents a course that entails minimal changes in the choice of measures and distribution of funds, while the other shows a very significant shift in policy direction in support of achieving ambitious environmental goals and addressing societal concerns. Market developments caused by changes in policy were demonstrated by means of simulated changes in the main agricultural policy indicators in the observed agri-food markets, i.e., production, yield and net trade, by 2030 [60]. A “no policy change” scenario (baseline) was compared with three stylised multi-tier hierarchical scenario simulations of possible future policy directions in Croatia, which can serve as a useful component for policy makers’ strategic planning.
The results were certainly expected in terms of current trends and policy design that relate to the production-focused and market-oriented CAP support in the current programming period (2015–2020) in Croatia. This also applies to the results of the less production-focused and more environmentally constrained scenario. Namely, Croatia has achieved sufficient levels of competitiveness in crop markets, and higher environmental commitments and constraints may only slow down productivity by 2030. On the other hand, livestock sectors under environmentally demanding scenarios suffer additional production losses compared to the baseline simulation results.
The level of environmental and climate ambition that EU farmers will be asked to meet under the new CAP is defined; however, there are only some scenario projections available from the impact assessment. The CAPRI analysis conducted in support of the Commission impact assessment showed that lowering the share of direct payments allocated to basic income support affects different sectors with different levels of intensity [10]. It has a strong effect on cattle, crop, sheep and olive producers because direct payments represent a large share of their income (cattle and sheep sectors are even more sensitive due to coupled support). Niemi and Kettunen [31], using AGMEMOD to create different new policy scenarios, concluded that CAP policy reforms would result in a small reduction in production levels in Finland, while a larger decrease would occur in farm incomes as a result of cuts to support.
Similar impacts can also be confirmed by our own research, especially within Croatian livestock markets, which are generally uncompetitive [32,36,37,61]. The simulated results indicate that any further reduction in direct support (especially VCS) without changes in technology and investment in farms could cause a significant production drop, especially in beef and dairy. Negative trends in most livestock sectors (where quantity and value-added products are lacking) pose a major challenge to policy makers; they are presented with the conundrum of satisfying domestic producers and consumers while simultaneously addressing new societal demands, such as strengthening the ecological focus of the policy [60]. As Matthews [60] states that the results of the impact assessment simulation suggest that removing coupled support would lead to an increase in the milk supply, as the yield increase outweighs the herd size reduction at the EU level. This may be the case at the EU level in general, but is not necessarily so at the MS level, as demonstrated in the case of Croatia, where modelling results show that the reduction in total support and abolition of coupled support would have a significant negative effect on the beef and dairy sector. It is to be expected that Croatian policy makers will try to keep such types of support in the next programming period and will try to substantiate their decision with studies like Cortignani and Dono [12], in which the authors, using a PMP model, concluded that coupled payments, along with greening practices, have a larger impact and are effective in achieving production goals.
In general, the results of our scenario analyses confirm the hypothesis that even radical changes in the agricultural budget and measures with regard to environmental commitment would not lead to dramatic changes in production (structural breakdowns) and net trade by the end of the simulated period. Croatia would remain a net exporter in the main crop markets, where additional environmental commitments would slow the convergence of productivity with the EU average, as well as a net importer of the main livestock products with a significantly lower degree of national self-sufficiency.
Market impact analysis of the new policy at MS levels is lacking, and the presented results can help to understand the direction in which the strategic decisions of decision-makers will be implemented. Model-based assessments of the impact of implementation choices can contribute to steering the disbursements under CAP national budgets towards achieving the new environmental and social goals of the CAP.
The scenario analysis was determined by the selection of the tool applied. This means that the assessment was made using the PE AGMEMOD model, which is primarily intended for market and trade analyses. The main advantage of AGMEMOD as a PE sectoral model is that the implementation of a policy-harmonised approach enables the linking or de-linking of a specific policy instrument to or from a particular agricultural commodity. This feature allows for a quantitative analysis of the influence of policy changes on markets and the production structure of the observed agricultural markets. By comparing the results of the policy change with the baseline scenario, it can be determined which changes are driven by CAP measures, stronger environmental ambitions, abolition of VCS and reductions in production-related area payments, as all have significant impacts on agricultural markets in Croatia.
However, the modelling results should be taken with caution and cannot be the only and final reason for decision-makers to decide which measures to select. The first reason for this is the limited data quality for Croatia in the model itself, as the data provided by the national statistical bureau can often be distorted and inaccurate in the experience of the authors of this paper. Furthermore, the important impacts of income, environmental and social measures under the rural development policy are not included as this type of model is unable to incorporate such type of impacts and measures. Incorporating these policies remains an important challenge for model builders in the future. In addition to the above, the modelling approach is incapable of including volatile changes in production and the prices of agricultural products in model output variables, which raises the need for a stochastic simulation approach. When looking at the CAP reform and its specifics in the next programming period, we should be extremely cautious. Therefore, strategic planning should be combined with an assessment of different economic models and various other methods of agricultural policy assessment.
AGMEMOD as a PE sectoral model, primarily intended for market and trade analyses, has proven to be an appropriate tool in terms of assessing the market effects of changing budget size and changes in the level of coupled support as part of the new CAP reform. On the other hand, aggregate results do not show changes at the farm level, second pillar measures are not included, and the impacts of measures not targeted towards income maximization but towards ensuring nonmarket/public goods are difficult to simulate. Therefore, it is essential that the selected pool of quantitative tools to support decision-making should include all key indicators and that impact assessments should include broad approaches.
Author Contributions
Conceptualization, D.K., K.Z. and E.E.; methodology, D.K. and M.Z.S.; validation, I.R. and E.E.; formal analysis, D.K.; investigation, D.K., T.S. and M.R.; data curation, M.Z.S.; writing—original draft preparation, D.K. and E.E.; writing—review and editing, D.K., M.R., M.Z.S., I.G. and I.R.; visualization, T.S. and M.R.; supervision, K.Z., I.G. and E.E. All authors have read and agreed to the published version of the manuscript.
Funding
This research received no external funding.
Institutional Review Board Statement
Not applicable.
Informed Consent Statement
Not applicable.
Data Availability Statement
Not applicable.
Conflicts of Interest
The authors declare no conflict of interest.
References
- OECD. Evaluation of Agricultural Policy Reforms in the European Union: The Common Agricultural Policy 2014–2020; Organisation for Economic Cooperation and Development: Paris, France, 2017. [Google Scholar] [CrossRef]
- Louhichi, K.; Ciaian, P.; Espinosa, M.; Perni, A.; Gomez y Paloma, S. Economic impacts of CAP greening: Application of an EU-wide individual farm model for CAP analysis (IFM-CAP). Eur. Rev. Agric. Econ. 2018, 45, 205–238. [Google Scholar] [CrossRef]
- Gocht, A.; Ciaian, P.; Bielza, M.; Terres, J.M.; Röder, N.; Himics, M.; Salputra, G. EU-Wide Economic and Environmental Impacts of CAP Greening with High Spatial and Farm-Type Detail. J. Agric. Econ. 2017, 68, 651–681. [Google Scholar] [CrossRef]
- Garzon, I. Reforming the CAP. History of a Paradigm Change; Palgrave Macmillan, Houndmills: Basingstoke, Hampshire, UK, 2006. [Google Scholar] [CrossRef]
- Erjavec, E.; Lovec, M. Research of European Union’s Common Agricultural Policy: Disciplinary boundaries and beyond. Eur. Rev. Agric. Econ. 2017, 44, 732–754. [Google Scholar] [CrossRef]
- Niemi, J.; Kettunen, L. An analysis of the potential CAP changes: A Finnish case study. In Proceedings of the International Congress, Zurich, Switzerland, 30 August–2 September 2011. [Google Scholar]
- Harvey, D. What does the history of the common agricultural policy tell us. In Research Handbook on EU Agriculture Law; McMahon, J.A., Cardwell, M.N., Eds.; Elgar: Cheltenham, UK, 2015. [Google Scholar] [CrossRef]
- European Commission. Proposal for a Regulation of the European Parliament and of the Council Establishing Rules on Support for Strategic Plans to be Drawn Up by Member States under the Common Agricultural Policy (CAP Strategic Plans) and Financed by the European Agricultural Guarantee Fund (EAGF) and by the European Agricultural Fund for Rural Development (EAFRD) and Repealing Regulation (EU) No 1305/2013 of the European Parliament and of the Council and Regulation (EU) No 1307/2013 of the European Parliament and of the Council. COM (2018) 392 Final; European Commission: Brussels, Belgium, 2018. [Google Scholar]
- European Commission. EU Budget: The Common Agricultural Policy Beyond 2020; European Commission: Brussels, Belgium, 2018. [Google Scholar]
- European Commission. Impact Assessment SWD(2018) 301 Final. PART 1/3; European Commission: Brussels, Belgium, 2018. [Google Scholar]
- Pe’er, G.; Bonn, A.; Bruelheide, H.; Dieker, P.; Eisenhauer, N.; Feindt, P.H.; Hagedorn, G.; Hansjürgens, B.; Herzon, I.; Lomba, Â.; et al. Action needed for the EU Common Agricultural Policy to address sustainability challenges. People Nat. 2020, 2, 305–316. [Google Scholar] [CrossRef] [PubMed]
- Cortignani, R.; Dono, G. Simulation of the impact of greening measures in an agricultural area of the southern Italy. Land Use Policy 2015, 48, 525–533. [Google Scholar] [CrossRef]
- Bartolini, F.; Vergamini, D.; Longhitano, D.; Povellato, A. Do differential payments for agri-environment schemes affect the environmental benefits? A case study in the North-Eastern Italy. Land Use Policy 2020, 107, 104862. [Google Scholar] [CrossRef]
- Lampkin, N.; Stolze, M.; Meredith, S.; de Porras, M.; Haller, L.; Mészáros, D. Using Eco-Schemes in the New CAP: A Guide for Managing Authorities; IFOAM EU, FiBL and IEEP: Brussels, Belgium, 2020. [Google Scholar]
- Pe’er, G.; Zinngrebe, Y.; Moreira, F.; Sirami, C.; Schindler, S.; Vasileios, M.; Bontzorlos, D.; Clough, P.; Bezák, A.; Bonn, B.; et al. A greener path for the EU Common Agricultural Policy. Science 2019, 365, 449–451. [Google Scholar] [CrossRef]
- Latka, C.; Heckelei, T.; Kuhn, A.; Witzke, H.-P.; Kornher, L. CAP Measures towards Environmental Sustainability Trade Opportunities for Africa? ZEF Discussion Papers on Development Policy, No. 295; University of Bonn, Center for Development Research (ZEF): Bonn, Germany, 2020. [Google Scholar]
- Rac, I.; Erjavec, K.; Erjavec, E. Does the proposed CAP reform allow for a paradigm shift towards a greener policy? Span. J. Agric. Res. 2020, 18, e0111. [Google Scholar] [CrossRef]
- Erjavec, E.; Lovec, M.; Juvančić, L.; Šumrada, T.; Rac, I. Research for AGRI Committee–The CAP Strategic Plans Beyond 2020: Assessing the Architecture and Governance Issues in Order to Achieve the EU-Wide Objectives; European Parliament, Policy Department for Structural and Cohesion Policies: Brussels, Belgium, 2018. [Google Scholar]
- Lovec, M.; Šumrada, T.; Erjavec, E. New CAP Delivery Model, Old Issues. Intereconomics 2020, 55, 112–119. [Google Scholar] [CrossRef]
- Cairney, P.; Oliver, K.; Wellstead, A. To Bridge the Divide between Evidence and Policy: Reduce Ambiguity as Much as Uncertainty. Public Adm. Rev. 2016, 76, 399–402. [Google Scholar] [CrossRef]
- Czyżewski, B.; Matuszczak, A.; Grzelak, A.; Guth, M.; Majchrzak, A. Environmental sustainable value in agriculture revisited: How does Common Agricultural Policy contribute to eco-efficiency? Sustain. Sci. 2021, 16, 137–152. [Google Scholar] [CrossRef]
- Balogh, J.M.; Jámbor, A. The Environmental Impacts of Agricultural Trade: A Systematic Literature Review. Sustainability 2020, 12, 1152. [Google Scholar] [CrossRef]
- Haß, M. Coupled support for sugar beet in the European Union: Does it lead to market distortions? J. Agric. Econ. 2021, 1–26. [Google Scholar] [CrossRef]
- Jongeneel, R.A. Research for AGRI Committee–The CAP Support Beyond 2020: Assessing the Future Structure of Direct Payments and the Rural Developments Interventions in the Light of the EU Agricultural and Environmental Challenges.; European Parliament, Policy Department for Structural and Cohesion Policies: Brussels, Belgium, 2018. [Google Scholar]
- Smit, B.; Jongeneel, R.A.; Prins, H.; Jager, J.H.; Hennen, W.H. Impact of Coupled EU Support for Sugar Beet Growing: More Production, Lower Prices; Report 2017-114; Wageningen Economic Research: Wageningen, The Netherlands, 2017. [Google Scholar]
- Gohin, A.; Zheng, Y. Reforming the European Common Agricultural Policy: From price & income support to risk management. J. Policy Model. 2020, 42, 712–727. [Google Scholar] [CrossRef]
- Bartova, L.; M’Barek, R. (Eds.) Impact Analysis of CAP Reform on the Main Agricultural Commodities. Report III AGMEMOD—Model Description. EUR 22940 EN/3; European Commission: Luxembourg, 2008. [Google Scholar]
- Erjavec, E.; Chantreuil, F.; Hanrahan, K.; Donellan, T.; Salputra, G.; Kožar, M.; Van Leeuwen, M. Policy assessment of an EU wide flat area CAP payments system. Econ. Model. 2011, 28, 1550–1558. [Google Scholar] [CrossRef]
- Boulanger, P.; Philippidis, G. The EU budget battle: Assessing the trade and welfare impacts of CAP budgetary reform. Food Policy 2015, 51, 119–130. [Google Scholar] [CrossRef]
- Boysen, O.; Jensen, H.G.; Matthews, A. Impact of EU agricultural policy on developing countries: A Uganda case study. J. Int. Trade Econ. Dev. 2016, 25, 377–402. [Google Scholar] [CrossRef][Green Version]
- Niemi, J.; Kettunen, L. Modelling the impacts of alternative CAP reform scenarios on Finnish agriculture. In Proceedings of the 162nd Seminar, Budapest, Hungary, 26–27 April 2018. [Google Scholar]
- Kranjac, D.; Zmaić, K.; Grgić, I.; Salamon, P.; Erjavec, E. Accession impact and outlook for Croatian and EU crop and livestock markets. Span. J. Agric. Res. 2020, 18, e0103. [Google Scholar] [CrossRef]
- Zrakić Sušac, M.; Kranjac, D.; Grgić, I.; Mesić, Ž. Mid-term outlook on Croatian cereals market—Partial equilibrium model approach. J. Cent. Eur. Agric. 2020, 21, 438–451. [Google Scholar] [CrossRef]
- Grgić, I.; Krznar, S.; Bratić, V. Poljoprivredna proizvodnja Republike Hrvatske prije i nakon pristupanja EU. In Proceedings of the 47th Symposium “Actual Tasks on Agricultural Engineering”, Opatija, Croatia, 5–7 March 2019; pp. 487–496. [Google Scholar]
- CBS. Indices of Agricultural Production, 2019, First Release, Year: LVII., ZAGREB, 6 July, 2020, Number: 1.1.1. Available online: https://www.dzs.hr/Hrv_Eng/publication/2020/01-01-01_01_2020.htm (accessed on 28 October 2021).
- Kranjac, D.; Zmaić, K.; Crnčan, A.; Zrakić, M. Outlook on EU and Croatian poultry meat market—Partial equilibrium model approach. Worlds Poult. Sci. J. 2019, 75, 93–104. [Google Scholar] [CrossRef]
- Kranjac, D.; Zmaić, K.; Erjavec, E. Pregled i perspektiva tržišta svinjskog mesa u Republici Hrvatskoj—Simulacija modelom parcijalne ravnoteže. Agroecon. Croat. 2018, 8, 75–83. [Google Scholar]
- Grgić, I.; Hadelan, L.; Prišenk, J.; Zrakić, M. Stočarstvo Republike Hrvatske: Stanje i očekivanja. Meso 2016, 18, 256–263. [Google Scholar]
- Zrakić, M.; Salputra, G.; Levak, V. Potential impact of EU Common Agriculture Policy on Croatian dairy sector—Modelling results. Mljekarstvo 2015, 65, 195–202. [Google Scholar] [CrossRef][Green Version]
- CBS. Agricultural Economic Accounts, Various Years. 2021. Available online: https://www.dzs.hr/ (accessed on 28 October 2021).
- Kovačićek, T.; Petak, Z.; Mikuš, O. Influence of international and domestic context on Croatian agricultural policy outputs. J. Cent. Eur. Agric. 2019, 20, 1275–1291. [Google Scholar] [CrossRef]
- Europeam Commission. Regulation (EU) No 1307/2013 of the European Parliament and of the Council Establishing Rules for Direct Payments to Farmers Under Support Schemes within the Framework of the Common Agricultural Policy and Repealing Council Regulation (EC) No 637/2008 and Council Regulation (EC) No 73/200; European Commission: Brussels, Belgium, 2013. [Google Scholar]
- Salamon, P.; Banse, M.; Donnellan, T. AGMEMOD Outlook for Agricultural and Food Markets in EU Member States 2018–2030; Thünen Working Paper, No. 114; Johann Heinrich von Thünen-Institut: Braunschweig, Germany, 2019. [Google Scholar] [CrossRef]
- Salamon, P.; Banse, M.; Barreiro-Hurlé, J.; Chaloupka, O.; Donnellan, T.; Erjavec, E.; Fellmann, T.; Hanrahan, K.; Hass, M.; Jongeneel, R.; et al. Unveiling Diversity in Agricultural Markets Projections: From EU to Member States. In A Medium Term Outlook with the AGMEMOD Model; JRC Technical Report; Publications Office of the European Union: Luxembourg, 2017. [Google Scholar] [CrossRef]
- Chantreuil, F.; Hanrahan, K.; van Leeuwen, M. The Future of EU Agricultural Markets by AGMEMOD; Springer: Dordrecht, The Netherland, 2012. [Google Scholar]
- Salamon, P.; Chantreuil, F.; Donnellan, T.; Erjavec, E.; Esposti, R.; Hanrahan, K.; Van Leeuwen, M.; Bouma, F.; Dol, W.; Salputra, G. How to deal with the challenges of linking a large number of individual national models: The case of the AGMEMOD Partnership. Agrarwirtschaft 2008, 57, 373–378. [Google Scholar]
- Salputra, G.; Chantreuil, F.; Hanrahan, K. Policy Harmonized Approach for the EU Agricultural Sector Modelling. Agric. Food Sci. 2011, 20, 119–130. [Google Scholar] [CrossRef]
- Erjavec, E.; Donnellan, T. Development of the AG-MEMOD Country Level Agricultural Policy Analysis Tool in the New Members States of EU. In Proceedings of the 89th Seminar of European Association of Agricultural Economists, Parma, Italy, 2–5 February 2005. [Google Scholar] [CrossRef]
- Chantreuil, F.; Levert, F.; Hanrahan, K.F. The Luxembourg Reform of the CAP: An Analysi susing AGMEMOD Composite Model. In Modelling Agricultural Policies: State of the Art and New Challenges, Proceedings of the 89th EAAE Seminar, Parma, 3–5 February 2005; Arfini, F., Ed.; University of Parma: Parma, Italy, 2005; pp. 632–652. [Google Scholar]
- Chantreuil, F.; Salputra, G.; Erjavec, E. Market Analysis of Direct Payment Options for New EU Member States Using the AGMEMOD Partial Equilibrium Modelling Tool. Outlook Agric. 2013, 42, 33–40. [Google Scholar] [CrossRef]
- European Parliament. Laying Down Certain Transitional Provisions for Support from the European Agricultural Fund for Rural Development (EAFRD) and from the European Agricultural Guarantee Fund (EAGF) in the Years 2021 and 2022 and Amending Regulations (EU) No 1305/2013, (EU) No 1306/2013 and (EU) No 1307/2013 as Regards Resources and Application in the Years 2021 and 2022 and Regulation (EU) No 1308/2013 as Regards Resources and the Distribution of Such Support in Respect of the Years 2021 and 2022; European Parliament: Brussles, Belgium, 2020; Available online: https://www.europarl.europa.eu/doceo/document/A-9-2020-0101-AM-123-123_EN.pdf (accessed on 28 October 2021).
- European Parliament. Laying Down Certain Transitional Provisions on Support for Rural Development by the European Agricultural Fund for Rural Development (EAFRD), Amending Regulation (EU) No 1305/2013 of the European Parliament and of the Council as Regards Resources and their Distribution in Respect of the Year 2014 and Amending Council Regulation (EC) No 73/2009 and Regulations (EU) No 1307/2013, (EU) No 1306/2013 and (EU) No 1308/2013of the European Parliament and of the Council as Regards Their Application in the Year 2014; European Parliament: Brussles, Belgium, 2014; Available online: https://eur-lex.europa.eu/legal-content/EN/TXT/PDF/?uri=CELEX:32013R1310&from=EN (accessed on 28 October 2021).
- European Commission. Breakdown of European Agricultural Guarantee Fund: Pre-Allocations Per Member State (in EUR Million, Current Prices); European Commission: Brussels, Belgium, 2020; Available online: https://ec.europa.eu/info/sites/default/files/about_the_european_commission/eu_budget/2_table_breakdown_of_eagf_28.09.pdf (accessed on 28 October 2021).
- Europeam Commission. Breakdown of European Agricultural Fund for Rural Development per Member State (MFF Only, Current Prices; European Commission: Brussels, Belgium, 2020; Available online: https://ec.europa.eu/info/sites/default/files/about_the_european_commission/eu_budget/3_table_breakdown_of_eafrd_28.09.pdf (accessed on 28 October 2021).
- OECD. Decoupling: Policy Implications; Organisation for Economic Cooperation and Development: Paris, France, 2006. [Google Scholar] [CrossRef]
- Slabe-Erker, R.; Bartolj, T.; Ogorevc, M.; Kavaš, D.; Koman, K. The impacts of agricultural payments on groundwater quality: Spatial analysis on the case of Slovenia. Ecol. Indic. 2017, 73, 338–344. [Google Scholar] [CrossRef]
- Jansson, T.; Nordin, I.; Wilhelmsson, F.; Witzke, P.; Manevska-Tasevska, G.; Weiss, F.; Gocht, A. Coupled Agricultural Subsidies in the EU Undermine Climate Efforts. Appl. Econ. Perspect. Policy 2020. [Google Scholar] [CrossRef]
- CBS. Indices of Agricultural Production, 2018, First Release, Year: LVI., ZAGREB, 9 July, 2019, Number: 1.1.1. Available online: https://www.dzs.hr/Hrv_Eng/publication/2019/01-01-01_01_2019.htm (accessed on 27 October 2021).
- Csaki, C.; Jambor, A. Impacts of the EU Enlargements on the New Member States Agriculture. Acta Oeconomica Inform. 2013, 16, 35–50. [Google Scholar] [CrossRef]
- Matthews, A. The EU’s Common Agricultural Policy Post 2020: Directions of Change and Potential Trade and Market Effects; International Centre for Trade and Sustainable Development: Geneva, Switzerland, 2018. [Google Scholar]
- Kranjac, D.; Zmaić, K.; Jelić Milković, S.; Raguž, N.; Erjavec, E. Simulation of main agrarian policy indicators within beef meat market in the Republic of Croatia by AGMEMOD partial equilibrium model. Poljoprivreda 2019, 25, 45–51. [Google Scholar] [CrossRef]
Publisher’s Note: MDPI stays neutral with regard to jurisdictional claims in published maps and institutional affiliations. |
© 2021 by the authors. Licensee MDPI, Basel, Switzerland. This article is an open access article distributed under the terms and conditions of the Creative Commons Attribution (CC BY) license (https://creativecommons.org/licenses/by/4.0/).