Article

Physiological and Morphometric Response of Forage Grass Species and Their Biomass Distribution Depending on the Term and Frequency of Water Deficiency

by
Grażyna Mastalerczuk
* and
Barbara Borawska-Jarmułowicz
Department of Agronomy, Institute of Agriculture, Warsaw University of Life Sciences—SGGW, Nowoursynowska 159 Str., 02-776 Warsaw, Poland
*
Author to whom correspondence should be addressed.
Agronomy 2021, 11(12), 2471; https://doi.org/10.3390/agronomy11122471
Submission received: 11 November 2021 / Revised: 29 November 2021 / Accepted: 2 December 2021 / Published: 4 December 2021

Abstract

:
Periodic and repeated water scarcity has become an increasing concern on grasslands, causing not only to a reduction in productivity but also negative alterations in the carbon balance. The objective of this work was to comprehensively investigate some physiological performance traits of forage grasses, their roots morphometric features and distribution of biomass under simulated water deficit applied in different terms over a period of study. Plants were exposed to water shortage for 21 days, and then grown in optimal substrate moisture conditions. The gas exchange parameters and the main traits of root system architecture of three grass forage species and their cultivars were analyzed: Festulolium braunii (Richt.) A. Camus, cvs. Felopa and Sulino, Lolium perenne L., cvs. Bajka and Gagat and Festuca arundinacea Schreb. cvs. Odys and Rahela. Rapid decrease in the values of parameters related to the gas exchange process in grasses in the following days of water shortage was noticed. Water use efficiency (WUE) value was low in drought conditions due to increased transpiration of plants and was associated with a low C:N ratio in shoots. No obvious, positive effect of previously experienced drought stress on survival of tested grass species after another stress was observed. Cutting of plants after drought period most probably underlied the lack of memory and also additional factor weakened plant regrowth. When the drought was applied for the second time in spring during intensive plant growth, higher biomass allocation to the roots was observed. It was associated with the reduction of plant dry biomass, a decrease of carbon accumulation and the C:N ratio in the shoots. Due to the drought applied for the second time in summer, some biometric features of the roots were strongly and positively correlated with WUE, which is an important feature from the point of view of yield optimization and moisture use by plants.

1. Introduction

The forecasted global climate changes and the increasingly frequent extreme meteorological conditions indicate the need to seek ways to mitigate and reduce their negative effects in agriculture and to increase the adaptability of crops [1]. Periodic water scarcity and accompanying rising temperature become an increasing environmental concern on grasslands, leading to a reduction not only in productivity but also negative alterations in the ecosystem structure and carbon balance [2,3]. The cultivation of perennial plants, such as grasses, increases soil carbon stocks because of their prolonged photosynthetic activity and greater root biomass [4].
Festuca arundinacea, Festulolium braunii and Lolium perenne are the most important forage grasses, cultivated in the temperate climate zone. These grass species are characterized by variable forage quality and productivity under optimum growing conditions, but also by different resistance to environmental stresses, such as water deficit. F. arundinacea has the ability to avoid water scarcity and has a great potential for the development of a deep and extensive root system. This species is able to tolerate water deficit conditions, reprogramming its cellular metabolism in leaves and other organs. At the same time, forage quality of F. arundinacea is not as good as of L. perenne even under optimal conditions of air temperature and soil moisture [5]. L. perenne is a species widely used not only as forage, but also as lawn grass in urban areas throughout Central and Western Europe. It is distinguished by a high forage value, but unfortunately it is susceptible to summer drought [6]. Festulolium braunii is an intergeneric hybrid derived from the genera Festuca and Lolium. It is characterized by a high yield potential similar to Lolium species, whereas its root system and winter hardiness are similar to that of Fescues [7,8].
Drought resistant plant species are able to modify their morphological characteristics and metabolic processes in order to survive periods of drought and to restore normal functioning after the end of the stress. A major effect of water deficiency is the reduction of photosynthesis intensity, which results from slower leaf development, impaired photosynthesis machinery and premature leaf senescence [9]. Drought stress limits CO2 availability, induces the loss of photosynthetic pigments, impairs the activity of enzymes and also activity of photosystem II [10]. In response to water deficiency, the plants stimulate production of reactive oxygen species (ROS) that cause membrane injuries, protein degradation, enzyme inactivation and thus induce oxidative stress [11]. Stress caused by water scarcity not only limits the size of the source and sink tissues but also the phloem loading, assimilates translocation and dry matter portioning into plants organs are impaired. However, the extent of effects varies with the plant species, its growth stage and also duration and severity of drought [12].
Changes in plant growth and development due to a single drought event may persist, affecting its response to a next period of water deficiency. This plasticity exhibited by plants in response to fluctuations in the environmental conditions has been assigned to the memory of plants and allows them to better respond to adverse growth conditions based on the stress experienced [13]. Mechanisms that allow passing on information about exposure to stress to subsequent generations may be advantageous and help in offspring adaptation to adverse growth conditions and also increase their fitness to adverse growth conditions [14].
Limiting the availability of water reduces the osmotic potential of the soil and the plants are exposed to osmotic stress. Under such conditions, they cannot take up water and sometimes loose water to the soil. High ambient osmotic stress reduces the turgor of plant cells and influences firstly the roots. Therefore, under condition of prolonged water limitation, it is important to adapt morphology and metabolism of the plant root system [12]. The plants root morphometric characters such as biomass, length, density and depth allow them to avoid drought and contribute to the final yield under extreme water scarcity conditions [9,15]. Under drought the growth of lateral roots is significantly reduced, mainly by suppression of the activation of the lateral root meristems [16]. The presence of the lateral and small roots is considered as an adaptive strategy to increase water uptake by providing more absorbent surface. Specialized tissues like rhizodermis, with a thickened outer cell wall or suberized exodermis, and a fewer number of cortical layers are considered as adaptive advantage for drought stress survival [17]. Sometimes, however, even the development of deep and extensive root system is not sufficient to supply the plant with water and severe damage or even death can occur.
Most studies investigate many different drought-related traits of plants, but they are conducted only of aboveground or belowground parts of plants. This makes grass tolerance studies difficult to compare. The detailed information about the simultaneous drought effect on photosynthetic activity, morphometric features of roots and biomass distribution in perennial forage grasses species is missing. Despite the fact that quite good knowledge exists today on the photosynthetic responses of plants to a single drought, knowledge about recurring stress, its severe and long-lasting effects, remains insufficient, especially in perennial forage grasses. In this research, we present a comprehensive study on some physiological performance of forage grasses, as well as the morphometric features of their roots under conditions of repeated simulated water deficit in the substrate. The objective of this work was (i) to evaluate the physiological response of forage grasses and selected traits of roots to water deficit applied in different term in subsequent years (ii) to increase our knowledge on the partitioning and distribution of biomass under stress in this group of plants. We analyzed the main traits of root system architecture and the gas exchange parameters of the three grass forage species and their cultivars.

2. Materials and Methods

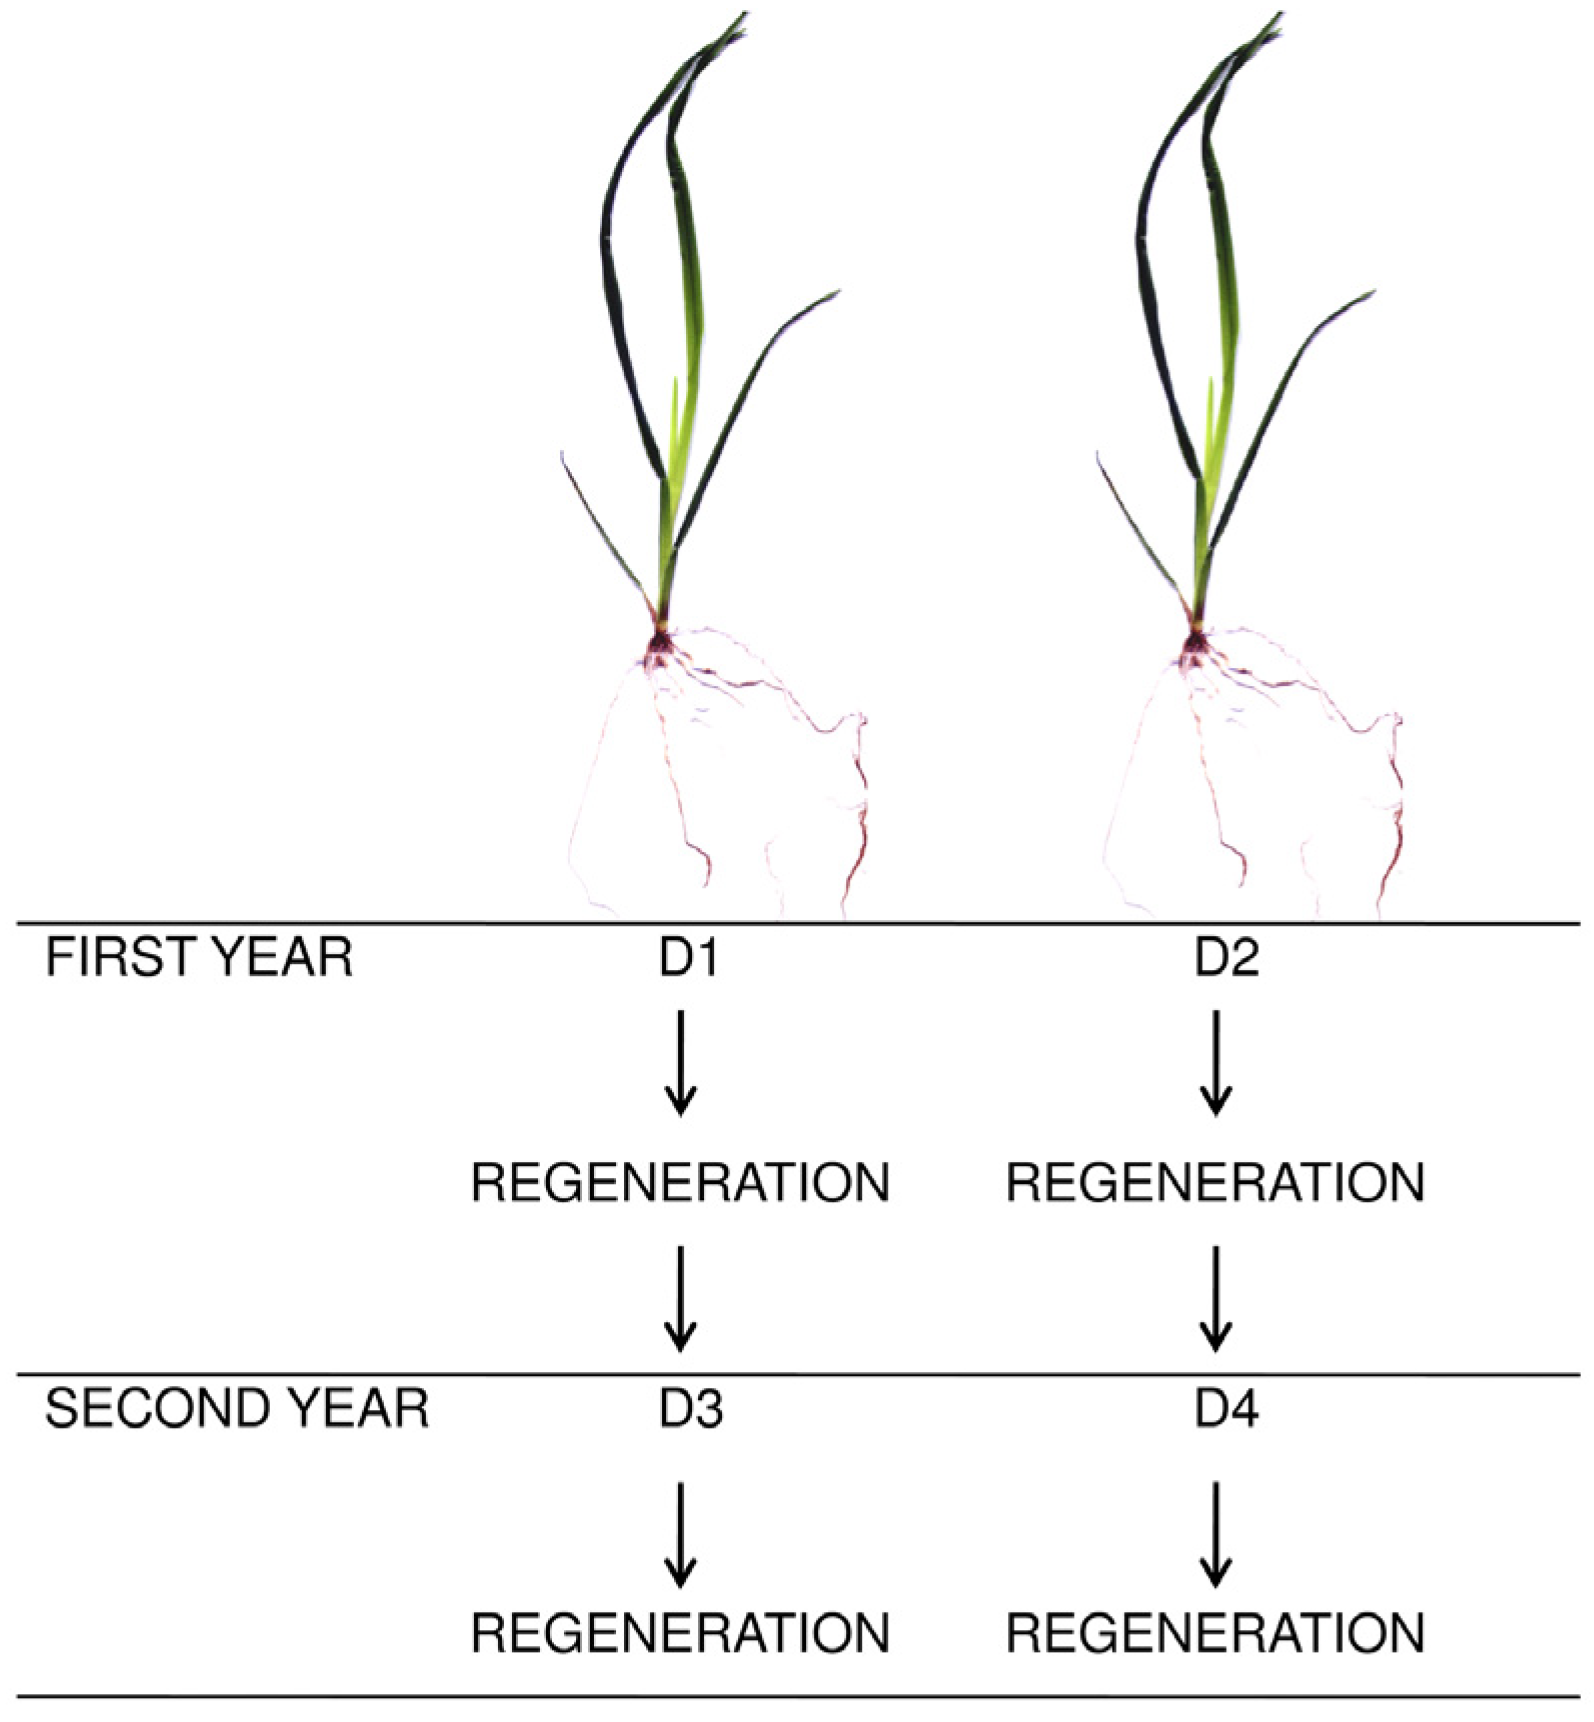
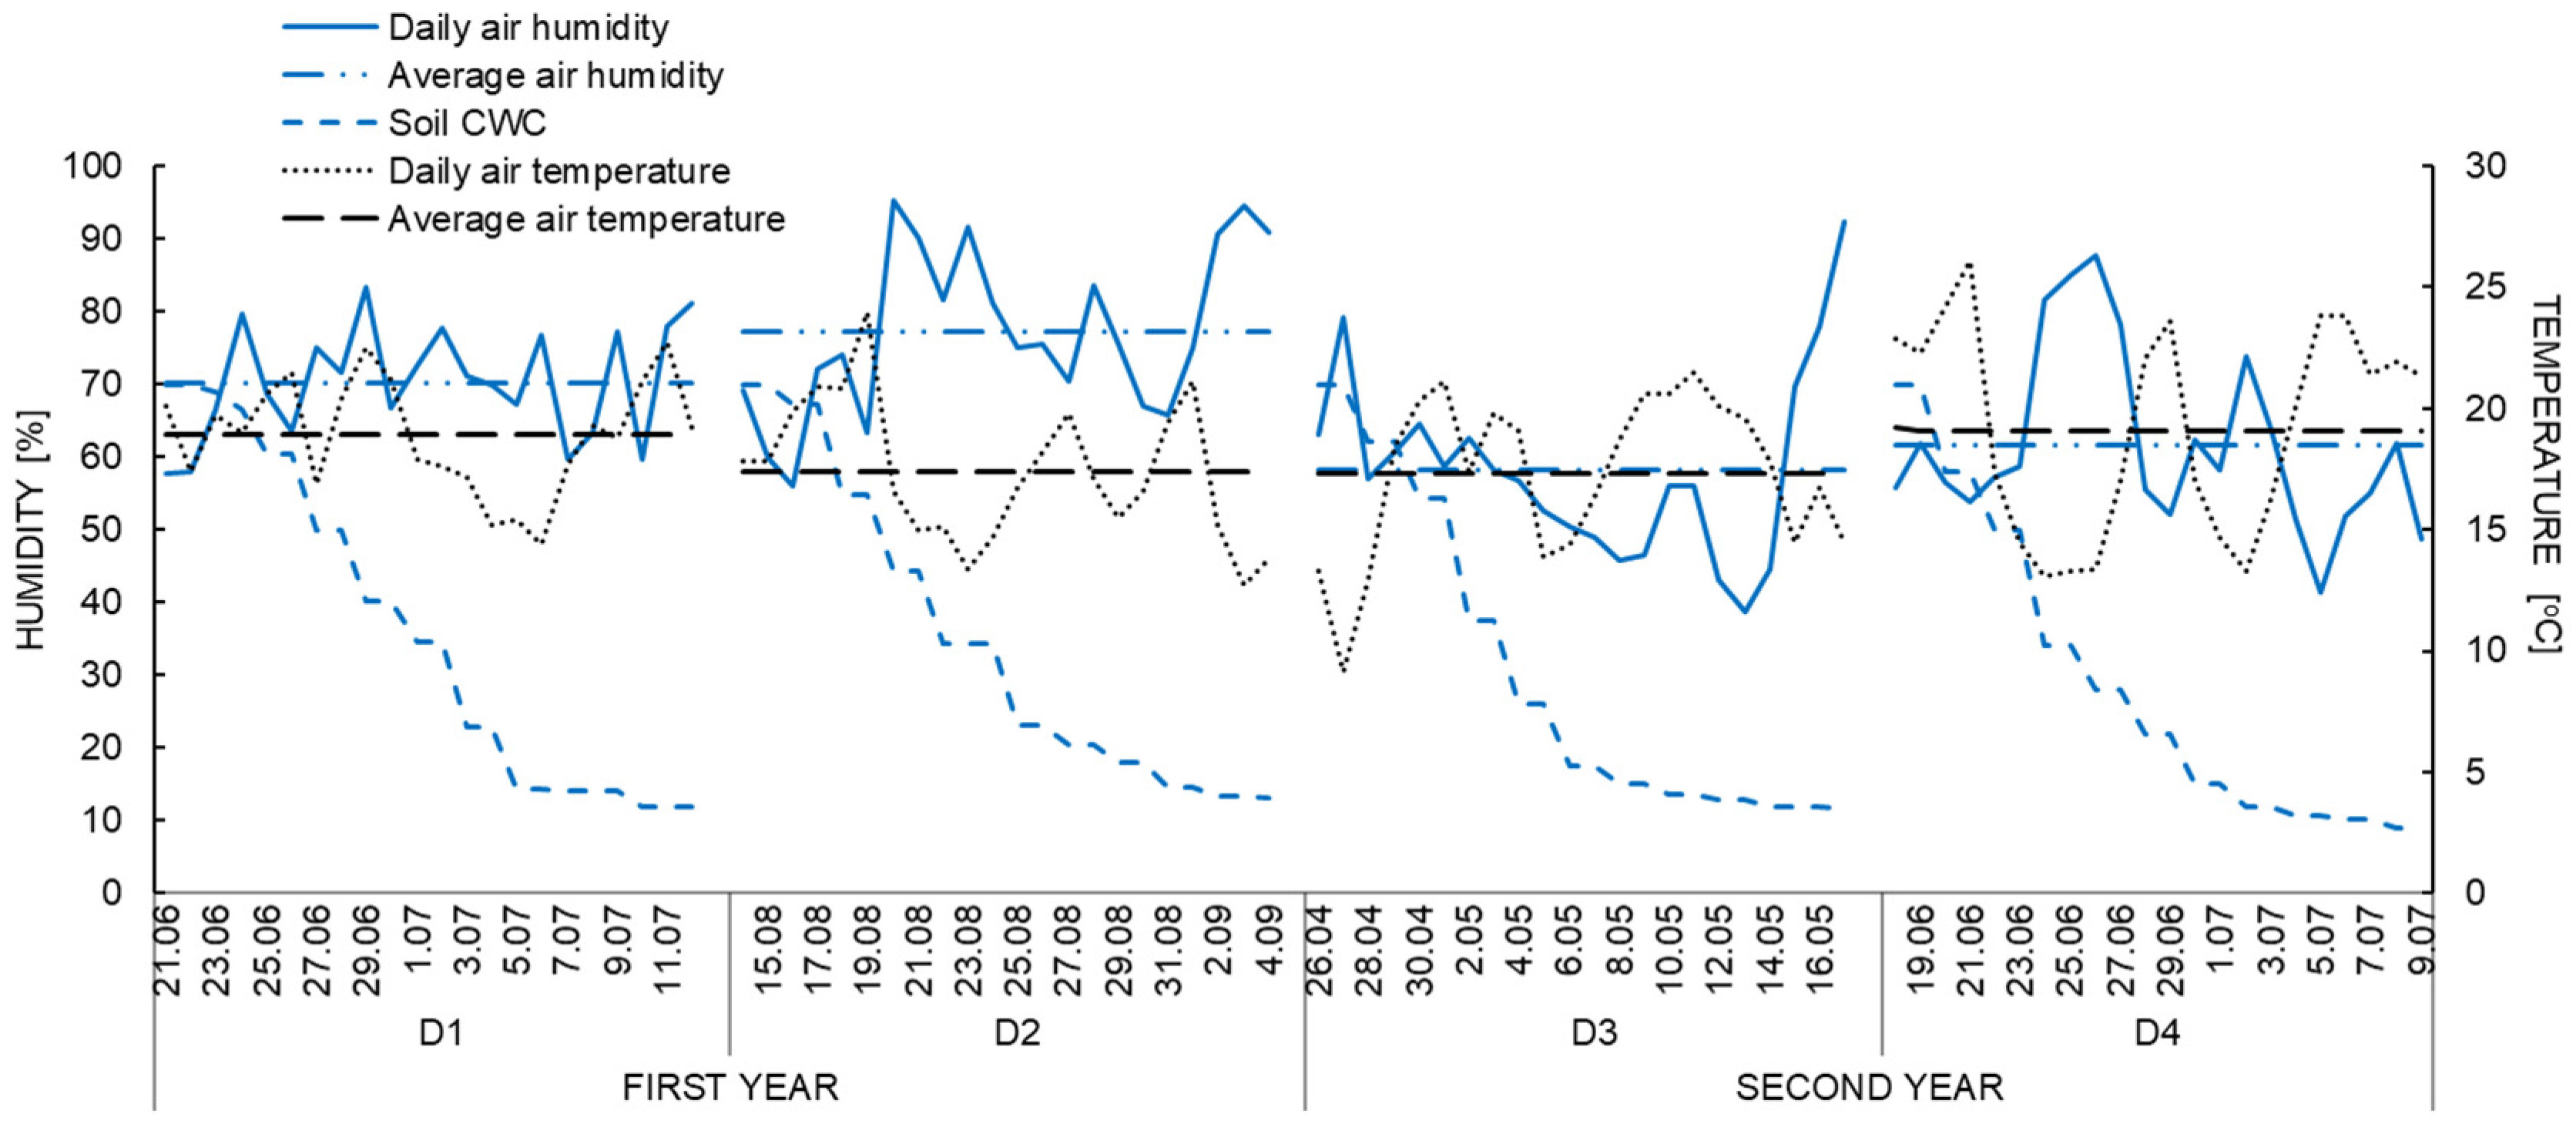
2.1. Experimental Design and Management

The pot experiment was conducted for two years (2017–2018) in semi-natural condition, in an open foil tunnel located in Warsaw University of Life Sciences (52°09′40″ N, 21°03′14″ E). The plant materials of the research were the species and cultivars of forage grasses with different sensitivity to water deficiency: sensitive—Lolium perenne L. (cvs. Bajka and Gagat), sensitive Festulolium braunii (Richt.) A. Camus (cvs. Felopa and Sulino) and tolerant—Festuca arundinacea Schreb. (cvs. Odys and Rahela).
The pots with a dimension of 40 cm × 25 cm (h × d) were filled to a weight of 12 kg with a mixture of sand and soil in the proportion 1:4 (respectively). Luvisol soil with the texture with loamy sand [18] from the temporary grassland was used for the research. The substrate was alkaline (pH = 7.4). It was characterized by a high content of phosphorus, magnesium and average potassium concentration (8.05, 5.9 and 7.31 mg/100 g of soil, respectively). The C:N ratio was 14. Mineral fertilization with nitrogen, phosphorus and potassium corresponding to the amount of (kg/ha, respectively): 180, 26.4 and 83 was used in the research. Nitrogen was applied before each regrowth, potassium—before the first and second, while phosphorus once—in spring. Seeds of grasses were sterilized with 0.7% potassium permanganate solution for 8 min, rinsed and cooling for 7 days in temperature below 0 °C. Initially, 15 seeds were placed in each pot, and after germination, the number of seedlings was reduced to 5. Harvesting of fresh plant mass was carried out three times during the growing season in tillering stage (vegetative) in both years of the study.
In order to assess the impact of water deficiency on the morphological, biometric and physiological characteristics of grasses, some plants were subjected to drought and the other were kept under optimal moisture conditions 70% CWC—control (C). Water deficiency was applied to the plants for 21 days once a year. In the first year, half of pots with plants were subjected to water stress before the first cut of plants (60 days after sowing)—summer drought (D1)—from June 21 to July 12. The other pots were treated with drought conditions before the second cut of plants—late summer drought (D2)—from August 14 to September 4 (Figure 1). In the second-year plants from D1 were subjected to drought again: before the first cut of plants—spring drought (D3)—from April 26 to May 17. Plants from D2 were treated water stress before the second cut of plants—summer drought (D4)—from June 18 to July 9. Except the drought periods (D1–D4), substrate moisture in the pots was maintained at 70% capillary water capacity (CWC). Water losses were replenished daily by watering the plants to a specific weight of the pot. After the end of each drought, all plants were cut. The experiment was conducted under natural lighting conditions. During the study, the air humidity and temperature were recorded by a data logger placed next to the experimental trial (Figure 2). Plants wintered at about 0–5 °C.

2.2. Methods and Measurements

Net photosynthetic rate (PN; μmol CO2/m2/s), transpiration rate (E; mmol H2O/m2/s), stomatal conductance (gs; mol H2O/m2/s) and sub-stomatal CO2 concentration (Ci; µmol CO2/mol air), were measured by a portable gas analyzer (LCpro+, ADC BioScientific Ltd., Hoddesdon, UK). Based on these primary data water use efficiency (WUE; µmol CO2/mmol H2O) was calculated as PN/E. During the measurement, open-gas exchange system was operated in differential mode at a 150 mmol/s flow rate of ambient air. Saturating irradiance was about 1000 µmol/m2/s. The content of chlorophyll (Chl) and flavonols (Flv) of plants were determined using a Dualex meter (Scientific+, FORCE-A, France). The results are expressed in Dualex units (values of Chl range from 0 to 150, while Flv values range from 0 to 3). The parameters were determined on 15 plants, on the middle part of a young, fully developed leaf always after the stabilization of conditions in the chamber. Physiological measurements were done always at the same time (8.00–10.00 a.m.) four times: after 4, 7, 14 and 21 days of maintaining the water deficit.
The tillering intensity (TI; no./plant) was described in each regrowth as the number of shoots per plant. It was determined three times: before stress of water deficiency, after 21 days of stress and after 28 days of plant regeneration under optimal substrate moisture conditions (70% CWC). Survival of plants after the stress was expressed as % share of viable shoots in relation to the control.
In each regrowth, after a period of water deficiency, plants were cut from 5 cm above the soil surface. The harvested biomass was then dried and weighed to determine the shoot dry mass (SDM; g/plant). To estimate relative water content (RWC; %), fresh mass of the plants leaves was determined. Leaves were submerged for 12 h in distilled water at the room temperature (20 °C) to determine their turgid mass and then dried. The RWC was calculated according to the following equation [19] (Equation (1)):
RWC   ( % ) = leaf   fresh   mass leaf   dry   mass ( turgid   mass leaf   dry   mass ) × 100 %
In each year after the last (third) regrowth stubble and root samples were taken from each pot. Plant roots were separated from the soil by washing them on sieves (mesh diameter 3–0.3 mm) in a gentle stream of water. Fresh roots, manually cleaned of organic parts, were analyzed using a stationary system for the analysis of washed plants roots, equipped with an optical scanner and software WinRHIZO 2012 (Regent Instruments Inc., Quebec, QC, Canada). The roots parameters: total length (RL; m), area (RA; cm2) average diameter (RD; mm) and length density (RLD; cm/cm3) were determined. In order to estimate root distribution, roots were sorted into ten size classes according to their diameter (0.0 <= 0.3, 0.3 <= 0.6, 0.6 <= 0.9, 0.9 <= 1.2, 1.2 <= 1.5, 1.5 <= 1.8, 1.8 <= 2.1, 2.1 <= 2.4, 2.4 <= 2.7 and 2.7 <= 3 mm). The stubble and roots were dried at 105 °C for 72 h and then weighed. Root mass (RDM) was expressed in grams per plant (g/plant). Based on the mass and length of the roots, the specific root length (SRL; m/g) was calculated as the ratio of RL to RDM; and specific root area (SRA; m2/g) was calculated as the ratio of RA to RDM. Root length ratio (RLR) which express the potential of the plant to acquire belowground resources, was determined as the ratio of RL to total plant dry mass (TPDM; m/g). Root mass ratio (RMR; g/g), that was calculated as the ratio of RDM to TPDM, is a parameter expressing the relative amount of biomass allocated to the belowground organs.
The CNS elemental analyzer (Vario MACRO CNS, Hanau, Germany) was used to determine the content of carbon (C; g/kg DM) and nitrogen (N; g/kg DM) in roots and shoots of plants. On this primary data the C:N ratio was evaluated. The accumulation of carbon (kg/plant) in the roots (RCA) and shoots (SCA) of plants was assessed based on the carbon content and dry mass of respective organs. Measurements were made after the third regrowth in each year of the study.

2.3. Statistical Analysis
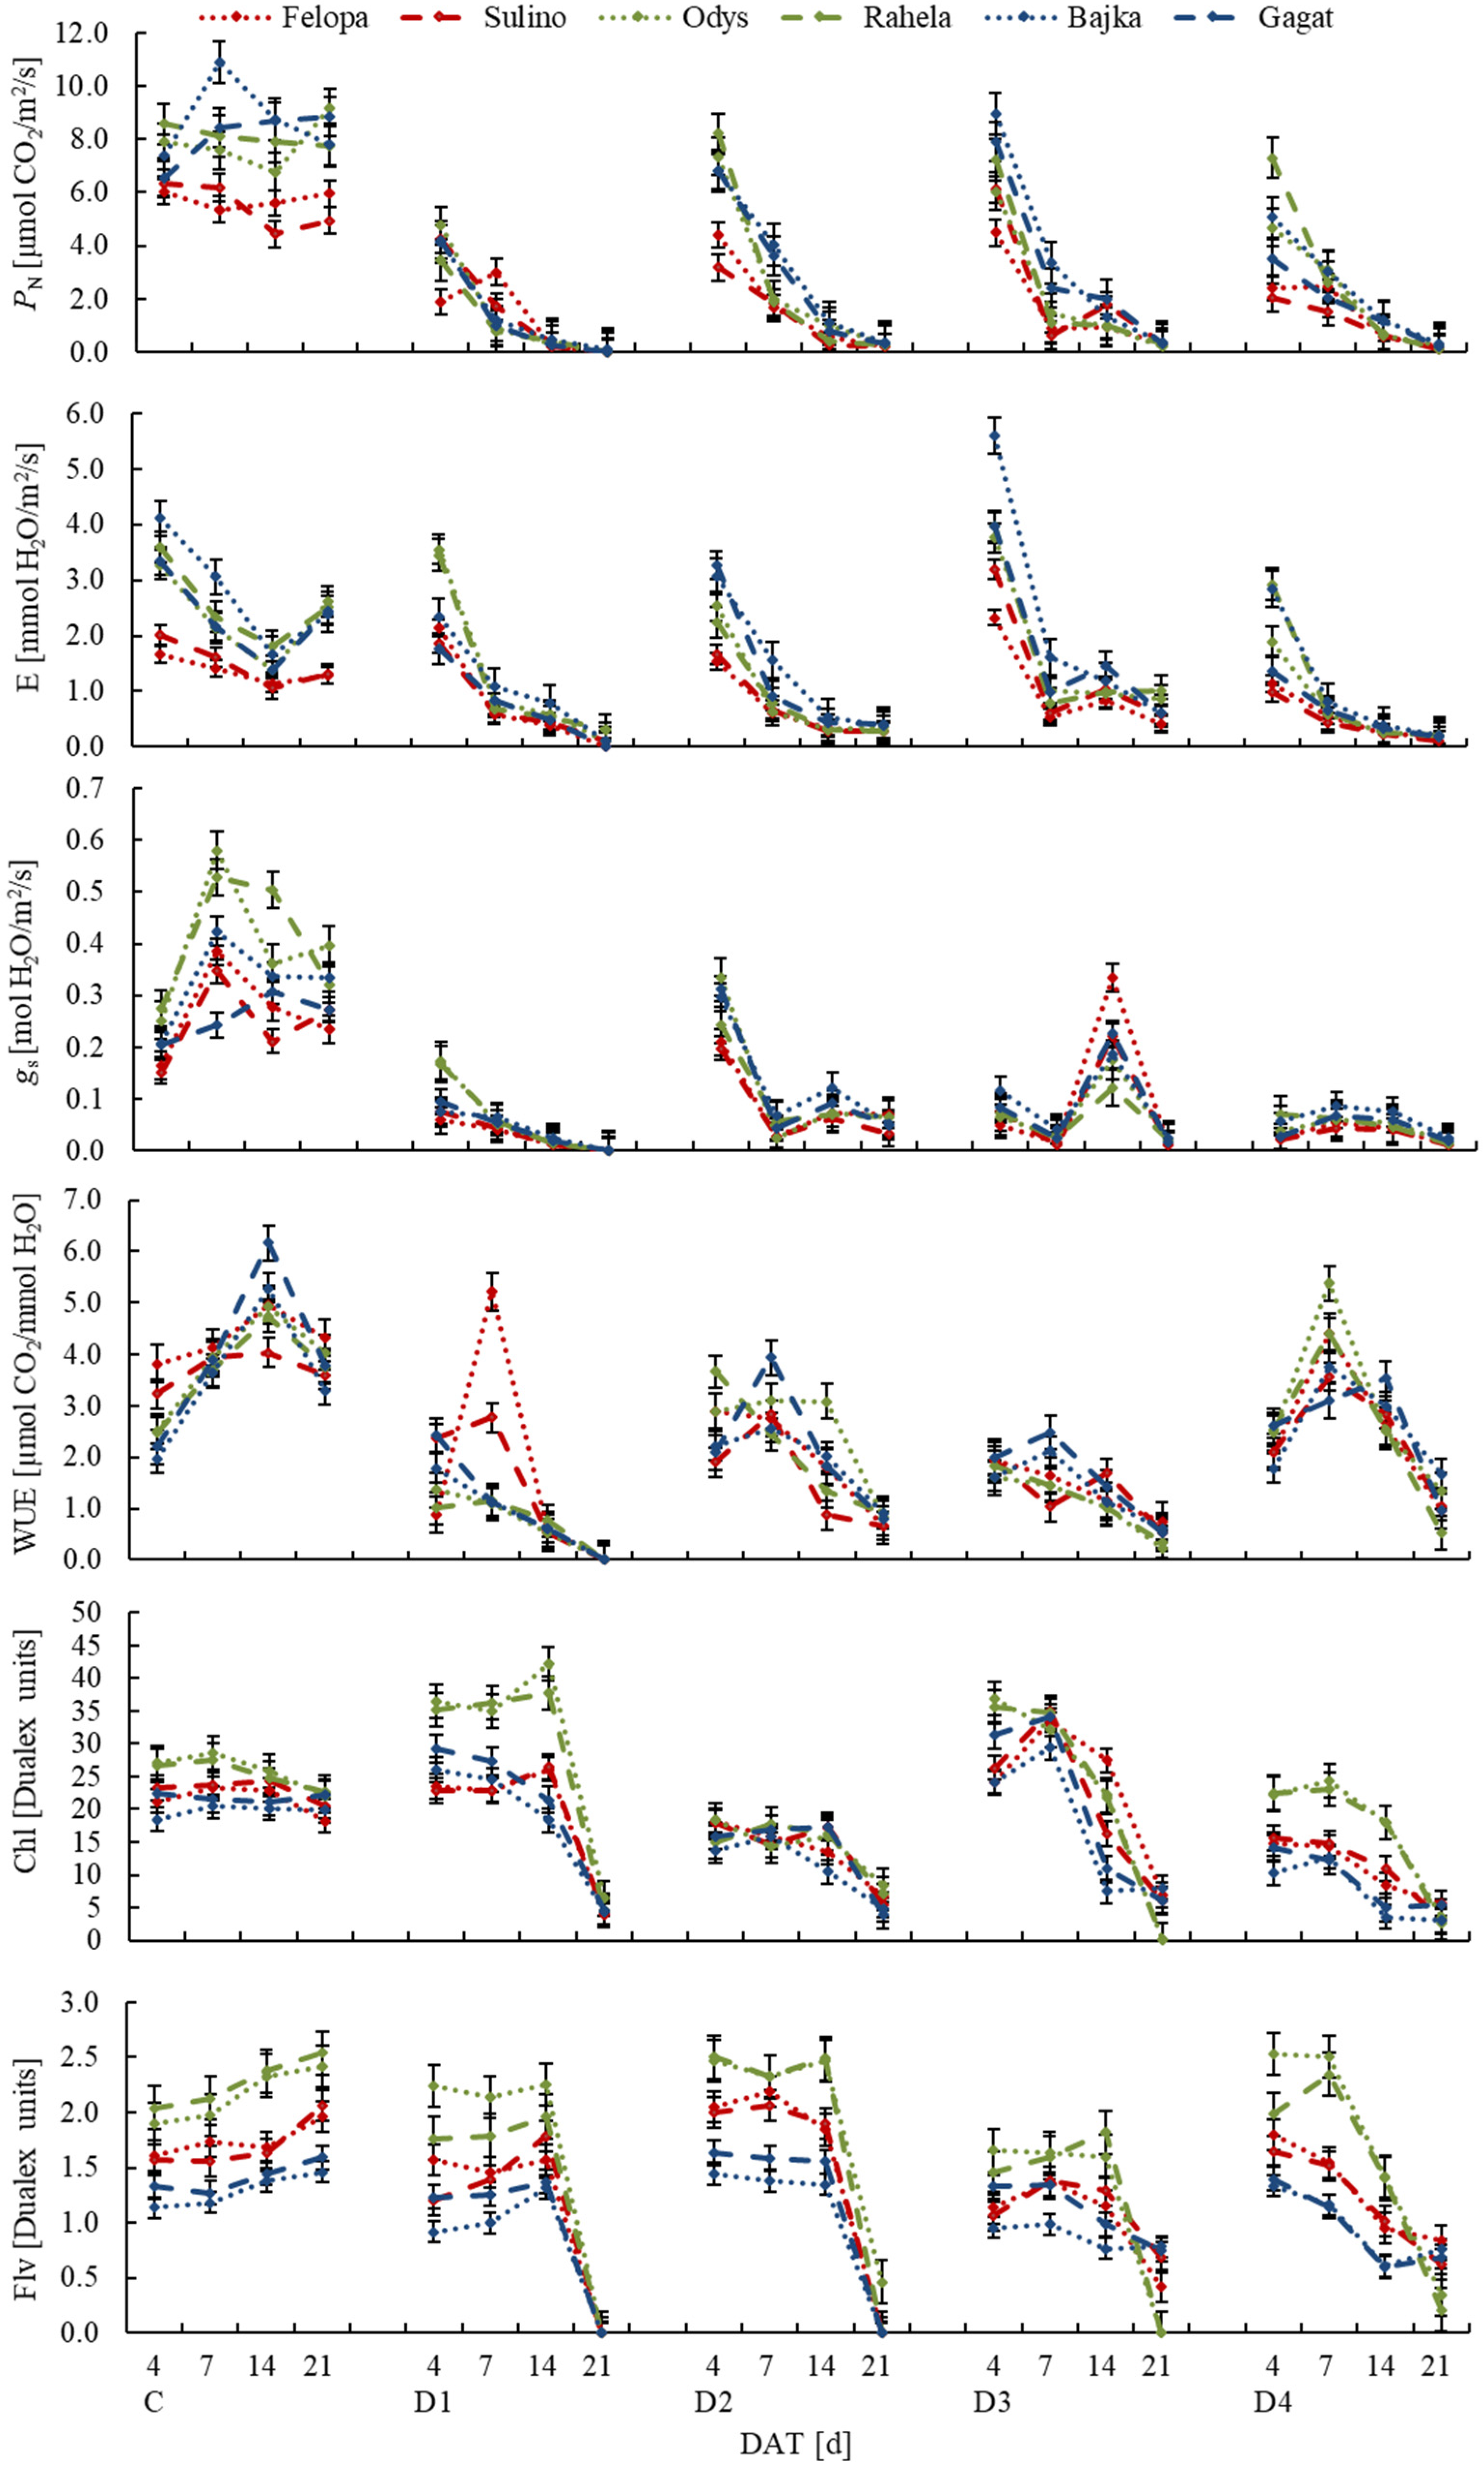
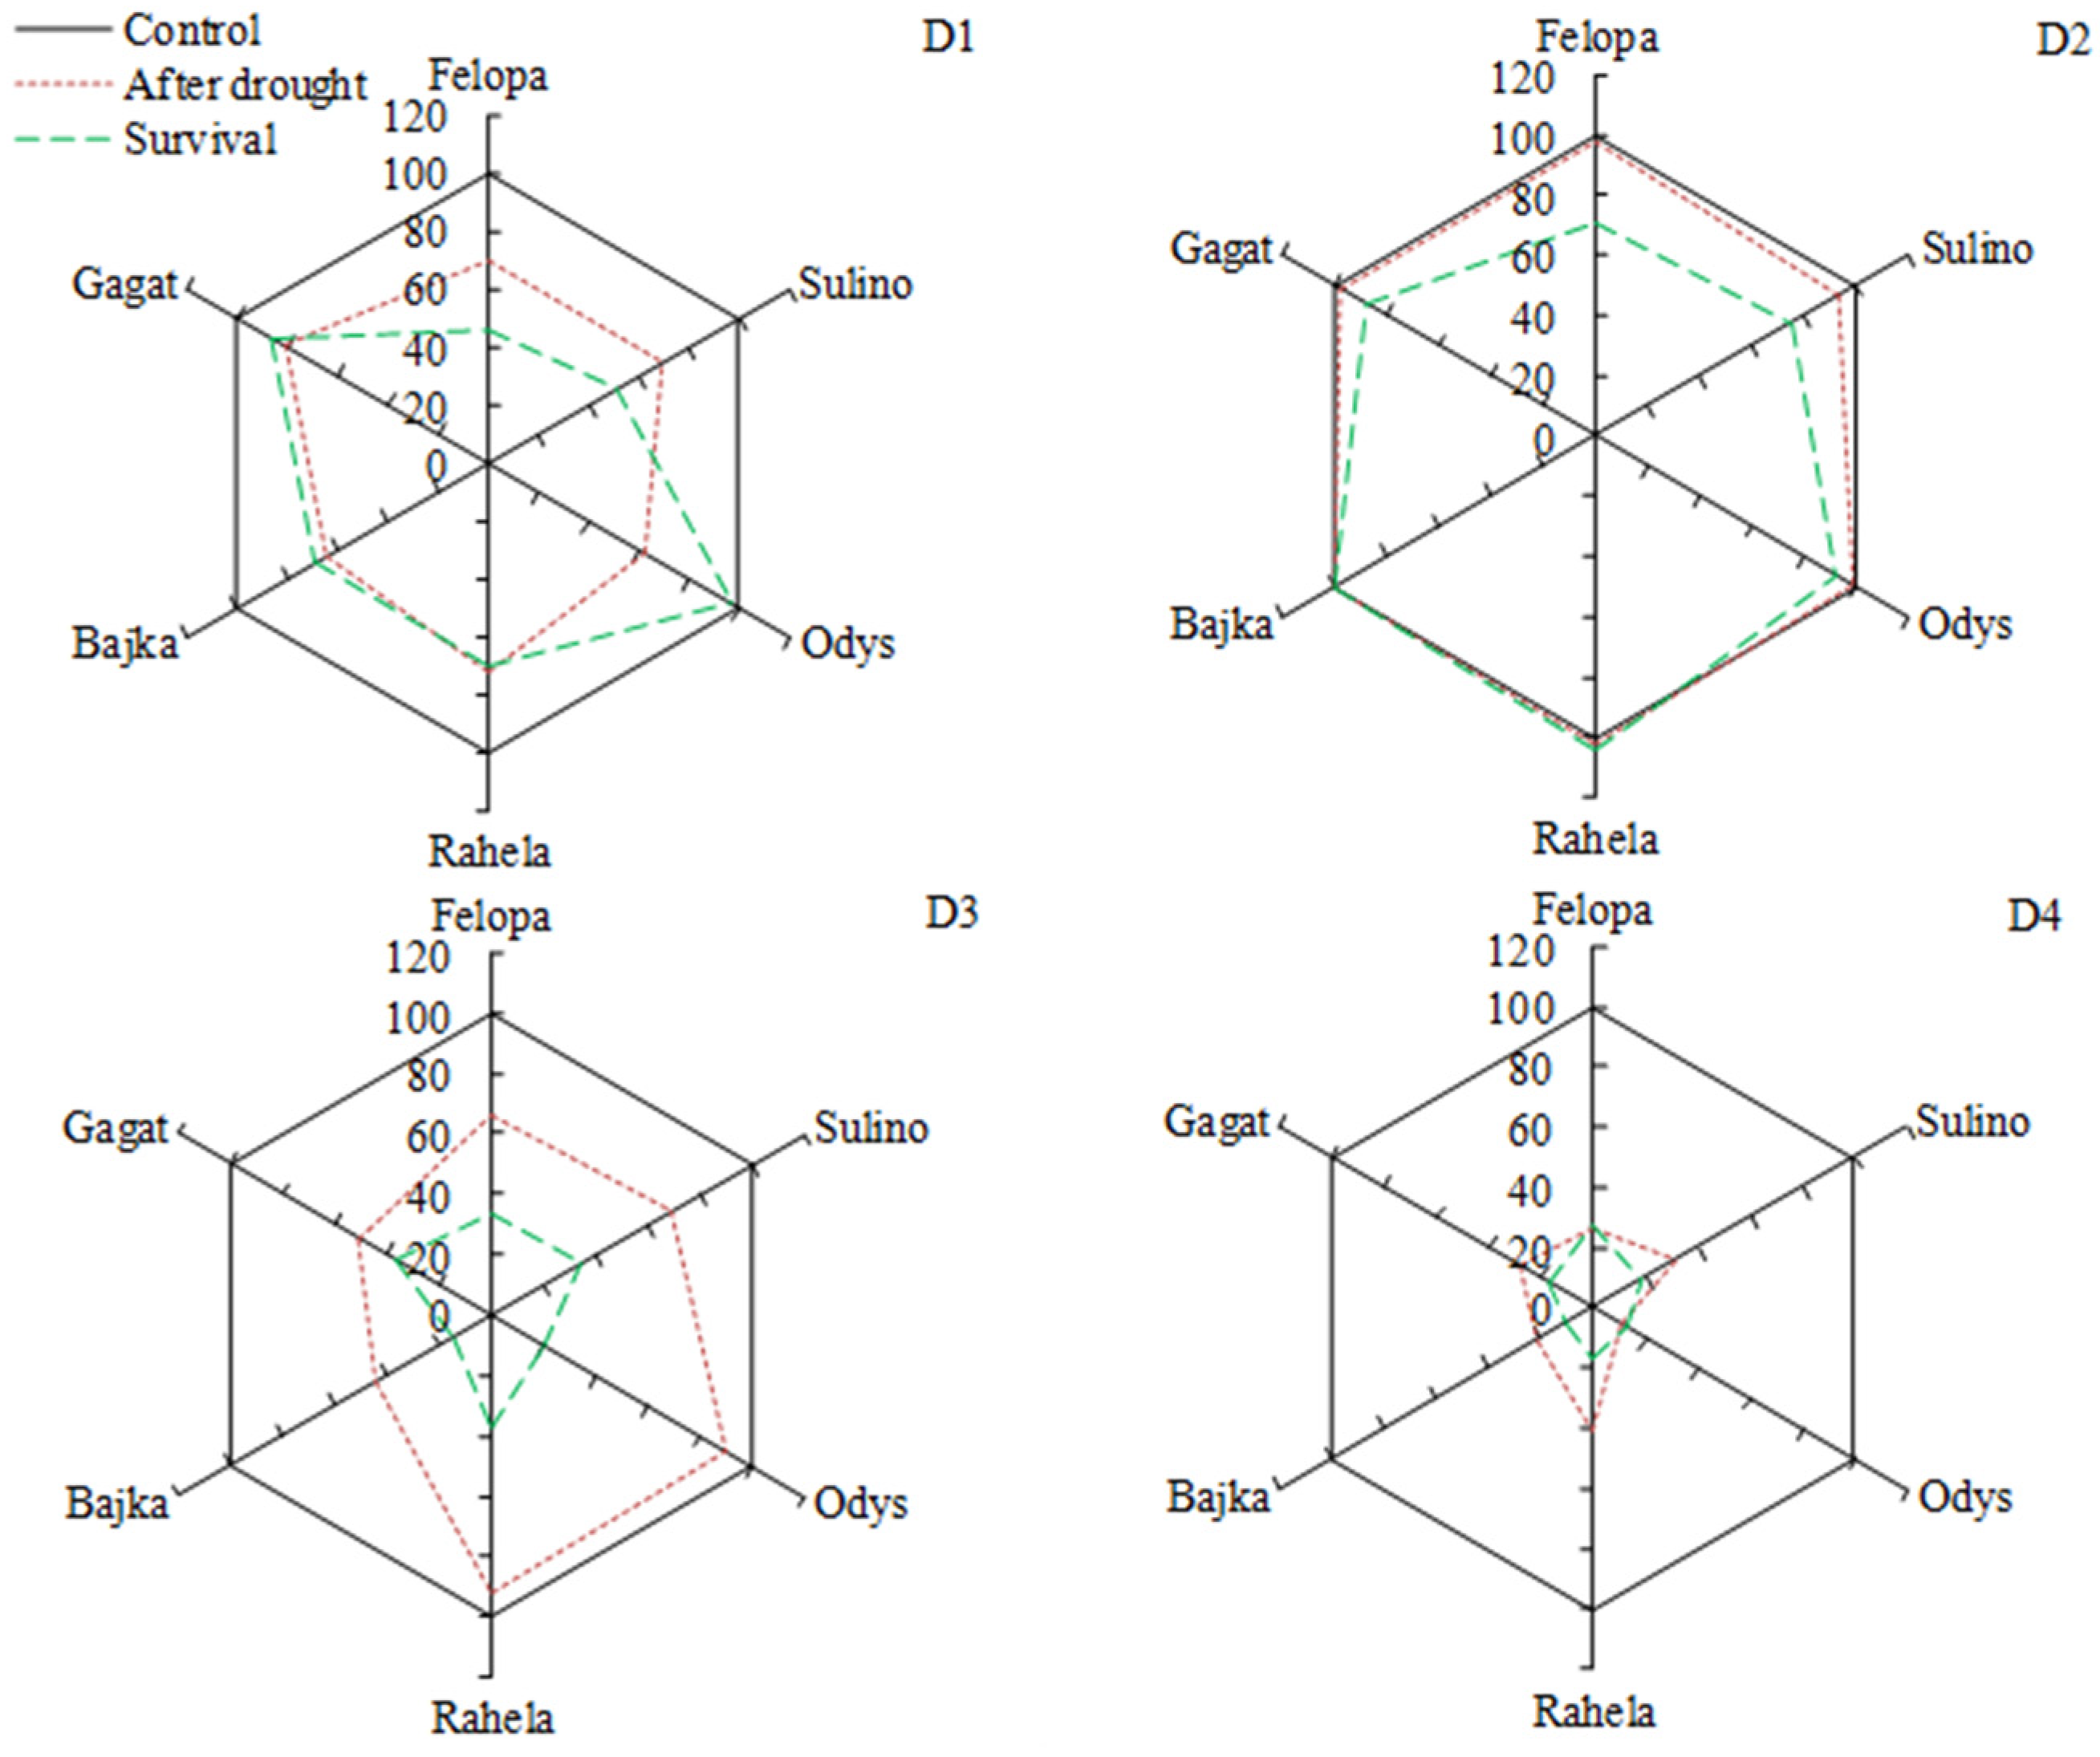
The pot experiment was established in a completely randomized design with three replications (total 108 pots). The data were analyzed through three-way analysis of variance (ANOVA) by using the TIBCO Statistica™ 13.3.0 software. Tukey’s multiple comparison test was used to compare the mean values (p ≤ 0.05. and 0.01). A Principal Component Analysis (PCA) was performed to evaluate the relationships between the all tested parameters (Table 1) and to characterize the multivariate differences between them and drought conditions. Pearson correlation coefficients (PCC) were calculated to measures the strength and direction of a linear relationship between WUE and other tested parameters and also between Surv and these parameters. The values of the coefficients were considered significant at p ≤ 0.05.

3. Results

The CWC (%) of substrate was decreased from 70% to approximately 12%, during the periods of water deficiency (D1, D2, D3 and D4) (Figure 2). In the periods of drought application, the air temperature and air humidity also varied. The first period of summer drought (D1) was characterized by moderate humidity (approx. 70%) and relatively high daily air temperature (19 °C). During late summer drought (D2) lower air temperature and higher humidity were recorded (respectively, 17.5 °C and 77%), than in D1. Such conditions had a positive effect on the survival of plants in the case of water deficiency. During the spring drought (D3) in the next year average air temperature was similar to the late summer drought but humidity was significantly lower (58%). While the summer drought in the second year of the study (D4) characterized by similar average air temperature as in D1 as well as relatively low humidity of air (61%).
Net photosynthetic (PN) and transpiration rate (E) differed between tested species. Cultivars of F. braunii were distinguished by significantly lower values of PN and E than the others (Table 2). Moreover, plants exposed to water deficiency showed noticeably lower mean values of PN, E as well as stomatal conductance (gs) than plants under optimal moisture condition (control). PN was slightly higher, but insignificant during the D2 and D3, while the E values were the highest during the spring water shortages (D3). Relatively low temperature and high air humidity (D2) significantly increased values of gs as well. It was shown that the plants response to water shortage in the following days of each drought was varied. Relatively high values of PN and E were recorded after 4 days of stress application. However, after 7 days as well as at subsequent terms of measurements, the values were significantly lower (Figure 3). There was no significant difference in WUE between the analyzed plant species and cultivars, regardless of other factors (Table 2). However, drought conditions resulted in less effective water management of plants, especially in the period D1 (except cv. F. braunii 7 days from the application of stress) and D3 (Figure 3). It was also found that the content of chlorophyll (Chl) and flavonols (Flv) varied among the tested species. Substantially higher values of both parameters were recorded in F. arundinacea, while the lowest in L. perenne (Table 2). The drought conditions differentiated the Chl values, increasing them relative to the control in D1 and D3, especially in the first days of stress application (on the 4th and 7th day, and also on the 14th day on D1) (Figure 3).
The average carbon content in the roots of plants (RCC) was approx. 8% lower compared to the content in shoots (SCC) (Table 2). Both cultivars of F. arundinacea and cv. Bajka of L. perenne were characterized by the highest carbon content in shoots and roots of plants. Summer drought in the first year (D1) reduced the carbon content in shoots (SCC), while the repeated drought in the second year (D3 and D4) increased the SCC values. The roots of plants subjected to late summer drought (D2) were characterized by a significantly higher carbon content (approx. 7%) compared to the control, whereas the drought applied for the second time in summer (D4) significantly reduced the RCC values (by approx. 7%). Carbon accumulation in shoots (SCA) and roots (RCA) of plants was affected by the cultivar. Cv. Bajka of L. perenne was characterized by the lowest SCA and RCA. Drought conditions limited carbon accumulation, especially drought repeated for the second time in spring (D3). While late summer drought (D2) limited SCA and RCA values the least. It was noted that the cultivars of F. arundinacea were characterized by the lowest nitrogen content in plants, especially in shoots (SNC). The effect of water deficit on SNC and RNC of plants was varied. D1 and D3 applied during the first regrowth increased SNC. While RNC was higher in the second year as a result of D3 and D4 conditions. The C:N ratio in shoots and roots was the highest in both varieties of F. arundinacea. In the case of roots, C:N ratio was higher compared to the control due to drought in the first year (D1 and D2), and lower when the plants were subjected to drought for second time in the following year (D3 and D4). A significant increase in the shoot C:N ratio was shown as a result of the late summer drought (D2). Moreover, summer drought in the first year (D1), similarly to the drought applied to plants in spring for the second time in the following year (D3), resulted in a significant decrease in the shoot C:N ratio compared with the plants under control conditions.
Biometric features of plant growth changed depending on the tested species, cultivar and drought conditions (Table 3). The studies have shown that both cultivars of L. perenne (Bajka and Gagat) were characterized by high intensity of tillering, regardless of the growing conditions, while cultivars of F. arundinacea, especially Rahela, developed the least number of shoots. Water scarcity limited the formation of new shoots by the plants. Only the late summer drought conditions in the first year (D2) did not significantly affect the number of shoots of the studied plants. The dry mass of plants varied with their growth. In the first year, TPDM was determined by higher values of SDM, while in the second year—by higher RDM. L. perenne was distinguished by significantly lower SDM and RDM compared with the other species, especially cv. Bajka. Whereas, the cultivars Sulino (F. braunii) and Odys (F. arundinacea) were characterized by the highest values of RDM and TPDM. The drought significantly differentiated the mass of plants compared with the control conditions. The values of SDM, RDM and TPDM decreased the most when the plants were subjected again to drought during the spring in next year (D3). In contrast, the conditions in D2 (relatively low temperature and high air humidity, 17.5 °C and 77%, respectively) only slightly reduced SDM and TPDM. This study showed the influence of the species and cultivar on the RD. Both cultivars of F. arundinacea had a significantly higher RD than the others. Simultaneously, it was shown that drought conditions reduced the diameter of the roots, especially D3. The values of the RL and RA parameters were different in the tested species and cultivars. The highest values of both traits were found in the cultivars of L. perenne, while the lowest—in the cultivars of F. arundinacea. Drought conditions reduced both RL and RA. The strongest reaction was found in plants that were subjected to water deficiency twice during the research period, including in spring of the second year (D3).
Parameters reflecting roots fineness (SRL, SRA, RLD and RLR) varied depending on the species and cultivar (Table 3). It was found, that L. perenne cultivars had the highest values (especially Bajka), while the cultivars of F. arundinacea showed the lowest values (especially Odys). Simultaneously, it was shown that Bajka was characterized by the smallest, and Odys by the highest values of parameters expressing the relative amount of biomass allocated to the roots (R:S and RMR). The drought in the second year (D3 and D4) significantly increased SRL and SRA relative to the control. RLD decreased in all treatment of drought, however the D1 and D3 resulted in the highest reduction in values compared to the control. In the case of the other parameters related to the allocation of biomass to the roots (R:S, RMR and RLR), the lowest values were found in the first year due to D2. Relatively low air temperature and high humidity at that time contributed to the allocation of biomass to the aboveground organs of plants. The conditions in D3, where the plants were treated with drought twice, resulted in a significant increase in the RLR (express a plant’s potential to acquire belowground resources) compared to the control.
The research showed that the effect of water shortage on the distribution of the root length in individual diameter classes varied (Figure 4). D1 application during the tillering of young plants increased the share of fine roots only in the cv. Odys (F. arundinacea). There were less fine roots in the other cultivars. In turn, in the cultivars Sulino, Gagat and Rahela, an increase in the share of roots with a diameter of 2.4–3.0 mm was noted. The late summer drought (D2) favored the development of roots with a diameter of 0.0–0.6 and 2.7–3.0 in both L. perenne cultivars. In the case of other cultivars, a reduction in the length of the roots was found in each of the separated diameter classes. The root distribution in Sulino was similar to that of D1. The drought applied for the second time in spring (D3) resulted in a significant reduction of the root length in each of the separated diameter classes in all plants, as compared to the conditions of optimal substrate moisture (70% CWC). While the drought applied for the second time in summer (D4) limited the development of fine roots in most cultivars. Only cv. Bajka (L. perenne) was characterized by the share of fine roots similar to that of the conditions of optimal humidity. Furthermore, Bajka and Rahela were distinguished by the highest share of thicker roots with a diameter of 2.1–2.7 mm.
The results also showed a significant reduction in RWC under each drought (Table 3). Moreover, relative water content of leaves varied in tested cultivars. The highest RWC values were obtained by Rahela cv.
Survival of plants after drought periods was depended on the term and frequency of its application (Figure 5). Plants of the studied cultivars survived the first summer drought (D1) quite well (mean 70% independent on cultivar). Only cv. Odys (F. arundinacea) was characterized by high regeneration (98%). The highest survival rate was found after the late summer drought (D2). The cultivars Rahela (F. arundinacea) and Bajka (L. perenne) regenerated completely (100%), while Odys (F. arundinacea) and Gagat (L. perenne) have achieved approx. 90% regeneration. The repetition of drought in the following year in spring (D3) reduced plant survival to about 20–35%, while plants subjected to drought again in summer (D4) showed a survival rate of about 18–20%. Only Bajka (L. perenne) showed 10% regeneration. Simultaneously, survival of tested cultivars was positively correlated with C:N root, gs, Flv (except L. perenne cv.), RCC, and TI (except Rahela) while negatively correlated with RLR and RNC (Figure 6a).
PCA analysis showed that the first component accounted for 52.42% and the second 25.48% of the analyzed variability (Figure 7a,b). Drought conditions had the highest impact on the values of TPDM, SDM, RCA and slightly less, but significant, on RDM, C: N shoot, SCA and Flv values. These parameters were significantly and positively correlated with each other and simultaneously negatively with the parameters related to the allocation of biomass to the roots (R:S, RMR). Moreover, the analysis showed that the parameters determining the root fineness and biomass accumulation (SRL, SRA and RLR) were strongly and negatively correlated with the Surv, C:N ratio in the roots and RCC. There was also a significant relationship between biometric traits of roots (RL, RA, RLD) and WUE. These parameters were significantly and negatively correlated with relative content of Chl and RWC.

4. Discussion

The water deficiency which was applied in our study adversely influenced treated plants, but the effect varied depending on the term and frequency of stress as well as the species and cultivars tested.
Many studies have indicated that mild drought has no obvious impact on plant growth and even stimulate it to a certain degree, but severe drought can lead to dramatic reductions of physiological processes. Whether the photosynthetic capacity completely recovers after re-watering depends on the drought tolerance of different species and cultivars [20]. In the study of Dąbrowski et al. [21], the resistant cultivars of L. perenne preserved higher photosynthetic activity under drought stress. In our study we used three species varying in the reaction of their photosynthetic apparatus to drought condition. The cultivars of F. braunii have reached the lowest values of gas exchange parameters (PN, E, gs, Ci) (Table 2, Figure 3) recorded during subsequent terms of water shortages. In the case of F. arundinacea and L. perenne the values of PN and E were higher, especially in the initial period of stress (after four days). In subsequent measurements, the differences between species and cultivars were slight. Simultaneously, in the following terms of measurement (7–21 DAT), a rapid decrease in the value of parameters related to the gas exchange process in plants was observed. According to Lawlor and Cornic [22] decreases in the leaf water potential initially induce stomatal closure, imposing a decrease in the supply of CO2 to the mesophyll cells and consequently, reduces the rate of leaf photosynthesis. In our research, plant water relations as well as stomatal opening and closing were affected by limited availability of water. Moreover, change in leaf temperature could have been an important factor in controlling of leaf water status under drought stress. It was especially visible during the summer droughts (D1 and D4), when already four days after the stress application, the PN and gs values were significantly lower compared to the conditions of optimal substrate humidity (Figure 3). In agreement with the recent studies, it was indicated that the increase in temperature decrease the net CO2 assimilation rate, as a result of closing stomata in response to high temperature conditions and the lower availability of CO2 [23]. Stomatal control the access of CO2 to the mesophyll and diffusion of water vapor between the leaf and an environment [24,25]. Thus, positive correlation between leaf water potential and stomatal conductance has been suggested. Our studies showed strong positive correlation between gs and WUE—as a measure of the amount of water transpired per given unit of CO2 (especially in F. arundinacea and L. perenne cvs.) (Figure 6b). Strong correlations were also demonstrated between others of the studied parameters and WUE in the conditions of water deficit, particularly according to F. arundinacea and L. perenne cultivars. The rate of water loss by plants is largely determined by stomatal conductance. According to Deikman et al. [26], plant mechanisms protecting against the stress such as reduced plant size or decreased stomatal conductance may be responsible for decreased productivity. Limitation the opening of the stomatal allows plants to maintain sufficient cell turgor to continue metabolic processes, and it is often considered the first symptom of cope with drought [27]. Drought tolerant species maintain WUE by reducing the water loss. However, in the events where plant growth is hindered to a greater extent, WUE is also reduced significantly [12]. Our research showed that the WUE values differed depending on the substrate moisture conditions. Drought applied during the period of intensive plant growth (D1and D3) reduced the WUE values the most.
The photosynthesis process is closely related to the leaf chlorophyll content, as the primary means of harvesting light energy to drive the electron transport reactions [28]. Content of Chl of plant leaves varies among species and cultivars, and also depends on soil and weather conditions, availability of nutrients and plants stage development [29]. Results revealed that both species and drought conditions differentiated the Chl content, increasing it the most in F. arundinacea cultivars compared with the control, especially in D1 and D3, in the first days of stress application. In the literature it has been suggested repeatedly that stress sensitivity can be correlated to the extent of chlorophyll degradation induced by moisture deficit [30,31]. The components of the photosynthetic apparatus could be damaged in drought sensitive genotypes, and drought tolerant genotypes may have a good adaptability to decrease/evade impairment resulting from drought stress. In the study of Bothe et al. [6] the boost of chlorophyll content induced by the PEG20 treatment may reflect two distinct and opposing processes: the disruption of chlorophyll metabolism and the development of smaller leaves, which as a consequence contain a higher concentration of chlorophyll. Whereas chlorophyll is the most important photosynthetic pigment, flavonoids are critical antioxidants [32]. One of the essential mechanisms of drought acclimation is an accumulation of compounds that increase antioxidant capacity and play a role in detoxification of reactive oxygen species frequently formed under drought stress. They include, e.g., non-enzymatic flavonoids which are preferentially localized in epidermal cells of leaves and play an important role in the protection of photosynthetic apparatus [33]. In our study drought stimulated an accumulation of flavonols only in the initial period of stress application, especially during mild drought in late summer (D2). Simultaneously, the more resistant cultivars of F. arundinacea were distinguished by a higher content of these compounds. An increase of total flavonoid amount in tolerant genotypes of wheat under drought condition was also found by Ma et al. [34]. The C fixed in plants by photosynthesis, and added to soil as above- and belowground litter, is the primary source of C in ecosystems. The amount of C in the methods of estimating net primary productivity (NPP) and annual C inputs to soil for agroecosystems is determined from agricultural yields, using published or assumed values for harvest index (HI), S:R ratios, plant C in root exudates, and C concentrations in the plant parts. All these calculations assume that the C concentration of all parts of plant is 0.45 g/g) [35]. Our studies can help to updated the data of C concentration in plant parts and the plant C allocation coefficients that are used in simulation models. The mean content of C in the roots of grasses tested was low (0.37 g/g) when compared to the literature (0.45 g/g), regardless of substrate moisture conditions.
According to literature, the ratio of carbon to nitrogen in plants varies widely—from about 5 in microalgae to over 100 in trees [36]. In our research the grass species varied in C:N ratio as well. The highest values were in F. arundinacea, both in the shoot and roots. Plant growth, strictly connected with, the production of biomass is the result of photosynthesis and assimilation of nitrogen taken from the substrate. Drought stress decreases the photosynthetic rate, and disrupts the carbohydrate metabolism and level of sucrose in leaves that spills over to a decreased export rate. Limited photosynthesis and sucrose accumulation in the leaves may hamper the rate of sucrose export to the sink organs and ultimately affect the plant development [12]. Prolonged drought results in sugar accumulation and a decrease in leaf N content, leading to C:N imbalance, which is reflected in the increased C:N ratio. Soluble sugars, such as glucose and fructose, accumulate together with other osmolytes during drought. This provides protection of plants against structural and functional damage caused by dehydration and is considered to be plant osmotic adjustment to water shortage [37,38]. In our research, the water deficit also caused the C:N ratio imbalance. Drought applied in the second regrowth (D2 and D4) reduced nitrogen content in the shoots and increased C:N ratio after regeneration period. Plant growth was inhibited, but a preference for root growth, especially RL, RLD and RCA, was shown (Table 2 and Table 3). Whereas plants that were subjected to drought in the first regrowth (D1 and D3), in the period of intensive growth, were showed a high nitrogen content and a low C:N ratio in shoots. It was related to the reduction of plant growth, decrease in TPDM, SDM, RL, RLD as well as RCA and SCA.
The increasing R:S ratio and root growth dynamics into deeper soil layers are strategies for dealing with drought stress. Drought frequently enhances allocation of dry matter to the roots [39,40,41]. Our results concerning the allocation of biomass to the roots after drought and the regeneration period under optimal soil moisture conditions showed both no significant change in the R:S ratio (D1, D3) and a reduction in its value (D2, D4) compared to the control. A similar relationship was demonstrated in relation to RMR. The change in the distribution of biomass in D2 and D4 compared with D1 and D3 may be related to lower dynamics of roots development compared to shoots growth. Simultaneously, watering after drought during recovery time hastened the death and decay of the older roots. In the study of Nosalewicz et al. [42] the lack of change in the R:S value under drought as compared to control resulted of the short time interval between the water deficit and the dissection of the plants for root analyses and also due to the severity of the stresses (two drought episodes).
According to Liu et al. [43] it is incorrect to assume that a larger and denser root system always cause better drought resistance. From the perspective of optimizing yield and moisture utilization, a plant subjected to limited water resource must have an appropriate morphological characteristics of root system. Investigation with Bothriochloa ischaemum under serious drought stress, showed that the correlation between WUE and root morphological characteristics (i.e., root length and surface area, specific length and specific surface area) was better than that between WUE and biomass. In the present study the relationship between WUE and biomass as well as biometric parameters of the roots (i.e., RL and RLD) in drought conditions was confirmed (Figure 6b). However, the response of individual species and cultivars varied. The strongest positive correlation between WUE and RL and RA was found in L. perenne cv. Bajka and Gagat. Whereas, cultivars of F. arundinacea were characterized by the highest and negative correlation between WUE and parameters reflecting root fineness (e.g., SRL, SRA). In turn, F. braunii (especially Felopa cvs.) showed strong negative correlation between WUE and the parameters expressing the allocation of biomass to the belowground organs (e.g., R:S and RMR).
Relative water content (also referred as relative turgidity) is considered a measure of plant water status, reflecting the metabolic activity in tissues and used as the important indicator for dehydration tolerance. However higher leaf RWC can be owing to low water loss or increase of water uptake or can be also a combination of these two possibilities [44,45] Value of this parameter is related to water uptake by the roots and also water loss by transpiration [44]. According to Blum [46] favorable genotypic plant water status as reflected in measurements of RWC or canopy temperature under drought stress could be correlated with low WUE. In our studies a significant reduction in RWC under each drought was observed (Table 3). Simultaneously, the water deficit in plants resulted in increase of WUE values, which was confirmed by the negative correlation coefficient between RWC and WUE in drought conditions (significantly in F. braunii cvs.) (Figure 6 and Figure 7a). Low WUE values in drought, caused by increased transpiration, were associated with low C:N ratio in shoots, which limited plant growth, especially after D1 and D3.
Survival strategies in perennial grasses include both conservation of production during drought, and also the capacity to survive and recover quickly after rewatering [47]. Our results showed that the water stress applied in different term and frequency caused a significant reduction in values of plant physiological and morphometric features. Plants that have been supplied to drought once (in the first year: D1, D2), after regeneration period and third regrowth, were characterized by survival on the level above 70% (D1) and 89% (D2). While drought that was applied for the second time in the following year (D3, D4) significantly reduced the survival rate to about 30 and 17% (respectively). Changes in plant growth and development due to a single drought event may persist and affect response of plants during the next period of water deficiency [13]. Results obtained by Nosalewicz et al. [14] show that the intense water stress occurring at the flag leaf stage significantly affected the growth of a subsequent barley generation. The alterations in plant morphology and topology in response to the stress experienced by the maternal generation were evident to a greater extent in the progeny exposed to drought than daughter plants grown in optimum conditions. Borawska-Jarmułowicz et al. [48] indicated that plants of Dactylis glomerata obtained from seeds subjected to drought during germination, showed a higher or similar the quantum efficiency of PSII as compared to those germinated under optimal humidity conditions both under next water deficiency and also after regeneration period. Moreover, drought during seed germination positively affected the nitrogen balance index (NBI) and chlorophyll content (Chl) of plants seedlings under next drought stress. In our study, in the case of perennial grasses, vegetatively reproduced no obvious positive effect of previously experienced drought stress on survival after another stress was observed (Figure 5). An additional factor that weakened plant regrowth after drought could be their cutting. Survival of all cultivars tested after drought and regeneration period in optimal water condition was associated with significant decrease in the potential to acquire belowground resources (RLR), especially nitrogen (RNC), and an increase in C:N ratio in the roots of grasses (Figure 6a). Simultaneously, better survival was correlated with increase in stomatal conductance (gs) and accumulation of lavonols (Flv), especially in F. braunii and F. arundinacea cultivars. In the case of F. braunii and L. perenne cultivars, a significant positive correlation was also demonstrated between survival and the intensity of tillering. The drought tolerance determined after the end of the experiment (regardless of drought conditions) showed the following order: Odys > Rahela > Gagat > Bajka > Sulino > Felopa.
In summary, the effect of water deficiency varied depending on the term and frequency of stress as well as the species and cultivars tested. It was showed a rapid decrease in the value of parameters related to the gas exchange process in tested plants in the following days of water shortage. Low WUE values in drought, caused by increased transpiration, were associated with low C:N ratio in shoots. The assimilate deficit limited plant development especially after the drought applied during the period of intensive growth (summer in the first year D1and spring in the following year D3). Both species and drought conditions, differentiated the Chl content and accumulation of flavonols, increasing it the most in F. arundinacea cultivars.
The C:N ratio varied depending on the water deficit and the tested species. The highest values were observed in F. arundinacea, both in the shoot and roots. Plants that were subjected to drought in the period of intensive growth, in the first regrowth (D1 and D3), after regeneration were showed a high nitrogen content and a low C:N ratio in shoots. Whereas drought applied in the second regrowth (D2 and D4) reduced nitrogen content in the shoots and increased C:N ratio after regeneration period. Our studies confirmed the relationship between WUE and biomass as well as between WUE and some biometric parameters of the roots (RL and RLD) in drought conditions. The response of individual species and cultivars varied.
Survival of all cultivars tested after drought and regeneration period in optimal water condition was associated with significant decrease in the potential to acquire belowground resources (RLR), especially nitrogen (RNC), and an increase in C:N ratio in the roots of grasses. Better survival was correlated with increase in gs and Flv, especially in F. braunii and F. arundinacea cultivars. F. braunii and L. perenne cultivars demonstrated a significant positive correlation also between the intensity of tillering. In the case of tested perennial grasses, vegetatively reproduced, no obvious positive effect of previously experienced drought on survival after stress in following year was observed. Higher biomass allocation to the roots (high values of R:S, RMR and RLR) was observed after the drought applied for the second time in spring (D3) during intensive plant growth. It was associated with the reduction of plant dry biomass, decrease of carbon accumulation and the ratio of C:N in the shoots. Due to the drought applied to plants for the second time in summer (D4), the biometric features of the roots (RL, RA, RLD) were strongly and positively correlated with WUE, which is an important feature from the point of view of yield optimization and moisture use by plants.
Our studies can also help to update the data of C concentration in plant parts and the plant C allocation coefficients that are used in simulation models. The mean content of C in the roots of grasses tested was low when compared to the literature (regardless of substrate moisture conditions).

Author Contributions

Conceptualization, G.M.; methodology, G.M.; formal analysis, G.M.; investigation, G.M. and B.B.-J.; data curation, G.M.; writing—original draft preparation, G.M.; writing—review and editing, G.M. and B.B.-J.; visualization, G.M.; supervision, G.M. All authors have read and agreed to the published version of the manuscript.

Funding

This research received no external funding.

Institutional Review Board Statement

Not applicable.

Informed Consent Statement

Not applicable.

Data Availability Statement

The datasets used and/or analyzed during the current study are available from the corresponding author on reasonable request.

Acknowledgments

We are thankful for the assistance from Piotr Królikowski-Ampuła. The insightful and constructive comments of the anonymous reviewers are appreciated.

Conflicts of Interest

The authors declare no conflict of interest.

References

  1. Łabędzki, L.; Bąk, B. Monitoring and forecasting the course and impact of water deficit in rural areas. Infrastruct. Ecol. Rural Areas 2013, 2, 65–76. (In Polish) [Google Scholar]
  2. Robertson, T.R.; Bell, C.W.; Zak, J.C.; Tissue, D.T. Precipitation timing and magnitude differentially affect aboveground annual net primary productivity in three perennial species in a Chihuahuan Desert grassland. New Phytol. 2009, 181, 230–242. [Google Scholar] [CrossRef]
  3. Kipling, P.; Virkajärvi, R.P.; Breitsameter, L.; Curnel, Y.; De Swaef, T.; Gustavsson, A.M.; Hennart, S.; Höglind, M.; Järvenranta, K.; Minet, J.; et al. Key challenges and priorities for modelling European grasslands under climate change. Total Environ. 2016, 566–567, 851–864. [Google Scholar] [CrossRef] [Green Version]
  4. Marshall, A.H.; Collins, R.P.; Humphreys, M.W.; Scullion, J. A new emphasis on root traits for perennial grass and legume varieties with environmental and ecological benefits. Food Energy Secur. 2016, 5, 26–39. [Google Scholar] [CrossRef] [PubMed] [Green Version]
  5. Kosmala, A.; Perlikowski, D.; Pawłowicz, I.; Rapacz, M. Changes in the chloroplast proteome following water deficit and subsequent watering in a high- and a low-drought-tolerant genotype of Festuca Arundinacea. J. Exp. Bot. 2012, 63, 6161–6172. [Google Scholar] [CrossRef] [Green Version]
  6. Bothe, A.; Westermeier, P.; Wosnitza, A.; Willner, E.; Schum, A.; Dehmer, K.J.; Hartmann, S. Drought tolerance in perennial ryegrass (Lolium perenne L.) as assessed by two contrasting phenotyping systems. J. Agron. Crop. Sci. 2018, 204, 375–389. [Google Scholar] [CrossRef]
  7. Ghesquiere, M.; Humphreys, M.W.; Zwierzykowski, Z. Festulolium. In Fodder Crops and Amenity Grasses; Boller, B., Posselt, U.K., Veronesi, F., Eds.; Springer: New York, NY, USA, 2010; pp. 293–315. [Google Scholar]
  8. Yamada, T.J.; Forster, W.; Humphreys, M.W.; Takamizo, T. Genetics and molecular breeding in Lolium/Festuca grass species complex. Grass. Sci. 2005, 51, 89–106. [Google Scholar] [CrossRef]
  9. Turner, N.C.; Wright, G.C.; Siddique, K.H.M. Adaptation of grain legumes (pulses) to water-limited environments. Adv. Agron. 2001, 71, 123–231. [Google Scholar]
  10. Hura, T.; Hura, K.; Grzesiak, M.; Rzepka, A. Effect of long-term drought stress on leaf gas exchange and fluorescence parameters in C3 and C4 plants. Acta Physiol. Plant 2007, 29, 103–113. [Google Scholar] [CrossRef]
  11. Zlatev, Z.; Lidon, F.C. An overview on drought induced changes in plant growth, water relations and photosynthesis. Emir. J. Food Agric. 2012, 24, 57–72. [Google Scholar]
  12. Farooq, M.; Wahid, A.; Kobayashi, N.; Fujita, D.; Basra, S.M.A. Plant drought stress: Effects, mechanisms and management. Agron. Sustain. Dev. 2009, 29, 185–212. [Google Scholar] [CrossRef] [Green Version]
  13. Munné-Bosch, S.; Alegre, L. Cross-stress tolerance and stress “memory” in plants: An integrated view. Env. Exp. Bot. 2013, 94, 1–2. [Google Scholar] [CrossRef]
  14. Nosalewicz, A.; Siecińska, J.; Śmiech, M.; Nosalewicz, M.; Wiącek, D.; Pecio, A.; Wach, D. Transgenerational effects of temporal drought stress on spring barley morphology and functioning. Environ. Exp. Bot. 2016, 131, 120–127. [Google Scholar] [CrossRef]
  15. Verslues, P.E.; Agarwal, M.; Katiyar-Agarwal, S.; Zhu, J.; Zhu, J.K. Methods and concepts in quantifying resistance to drought, salt and freezing, abiotic stresses that affect plant water status. Plant J. 2006, 45, 523–539. [Google Scholar] [CrossRef] [PubMed]
  16. Deak, K.I.; Malamy, J. Osmotic regulation of root system architecture. Plant J. 2005, 43, 17–28. [Google Scholar] [CrossRef]
  17. Basu, S.; Ramegowda, V.; Kumar, A.; Pereira, A. Plant adaptation to drought stress [version 1; peer review: 3 approved]. F1000 Res. 2016, 5, 1554. [Google Scholar] [CrossRef]
  18. FAO. World Reference Base for Soil Resources (WRBSR) 2014. In International Soil Classification System for Naming Soils and Creating Legends for Soil Maps; World Soil Resources Report No. 106; FAO: Rome, Italy, 2015. [Google Scholar]
  19. Turner, N.C. Techniques and experimental approaches for the measurement of plant water status. Plant Soil 1981, 58, 339–366. [Google Scholar] [CrossRef]
  20. Chaves, M.M.; Flexas, J.; Pinheiro, C. Photosynthesis under drought and salt stress: Regulation mechanisms from whole plant to cell. Ann. Bot. 2009, 103, 551–560. [Google Scholar] [CrossRef] [Green Version]
  21. Dąbrowski, P.; Baczewska-Dąbrowska, A.H.; Kalaji, H.M.; Goltsev, V.; Paunov, M.; Rapacz, M.; Wójcik-Jagła, M.; Pawluśkiewicz, B.; Bąba, W.; Brestic, M. Exploration of chlorophyll a fluorescence and plant gas exchange parameters as indicators of drought tolerance in Perennial Ryegrass. Sensors 2019, 19, 2736. [Google Scholar] [CrossRef] [Green Version]
  22. Lawlor, D.W.; Cornic, G. Photosynthetic carbon assimilation and associated metabolism in relation to water deficits in higher plants. Plant Cell Env. 2002, 25, 275–294. [Google Scholar] [CrossRef] [Green Version]
  23. Hussain, S.; Ulhassan, Z.; Brestic, M.; Zivcak, M.; Zhou, W.; Allakhverdiev, S.I.; Yang, X.; Safdar, M.E.; Yang, W.; Liu, W. Photosynthesis research under climate change. Photosynth Res. 2021, 150, 5–19. [Google Scholar] [CrossRef] [PubMed]
  24. Ruiz-Vera, U.M.; Siebers, M.; Gray, S.B.; Drag, D.W.; Rosenthal, D.M.; Kimball, B.A. Global warming can negate the expected CO2 stimulation in photosynthesis and productivity for soybean grown in the Midwestern United States. Plant Physiol. 2013, 162, 410–423. [Google Scholar] [CrossRef] [PubMed] [Green Version]
  25. Kumari, V.V.; Roy, A.; Vijayan, R.; Banerjee, P.; Verma, V.C.; Nalia, A.; Pramanik, M.; Mukherjee, B.; Ghosh, A.; Reja, M.H.; et al. Drought and heat stress in cool-season food legumes in sub-tropical regions: Consequences, adaptation, and mitigation strategies. Plants 2021, 10, 1038. [Google Scholar] [CrossRef]
  26. Deikman, J.; Petracek, M.; Heard, J.E. Drought tolerance through biotechnology: Improving translation from the laboratory to farmers’ fields. Curr. Opin. Biotechnol. 2012, 23, 243–250. [Google Scholar] [CrossRef] [PubMed]
  27. Lipiec, J.; Doussan, C.A.; Nosalewicz, A.; Kondracka, K. Effect of drought and heat stresses on plant growth and yield: A review. Int. Agrophys. 2013, 27, 463–477. [Google Scholar] [CrossRef]
  28. Croft, H.; Chen, J.M.; Luo, X.; Bartlett, P.; Chen, B.; Staebler, R.M. Leaf chlorophyll content as a proxy for leaf photosynthetic capacity. Glob. Chang. Biol. 2017, 23, 3513–3524. [Google Scholar] [CrossRef]
  29. Loka, D.; Harper, J.; Humphreys, M.; Gasior, D.; Gwynn-Jones, D.; Scullion, J.; Doonan, J.; Kingston-Smith, A.; Dodd, R.; Wang, J.; et al. Impacts of abiotic stresses on the physiology and metabolism of cool-season grasses: A review. Food Energy Secur. 2018, 8, e00152. [Google Scholar] [CrossRef] [Green Version]
  30. Li, R.H.; Guo, P.G.; Michael, B.; Stefania, G.; Salvatore, C. Evaluation of chlorophyll content and fluorescence parameters as indicators of drought tolerance in barley. Agric. Sci. China 2006, 5, 751–757. [Google Scholar] [CrossRef]
  31. Staniak, M.; Bojarszczuk, J.; Kraska, P.; Kwiatkowski, C.; Harasim, E. Prolonged drought stress induced changes in yield and physiological processes of Trifolium repens and Festulolium braunii. Biol. Plant. 2020, 64, 701–709. [Google Scholar] [CrossRef]
  32. Pappi, P.; Nikoloudakis, N.; Fanourakis, D.; Zambounis, A.; Delis, C.; Tsaniklidis, G. Differential Triggering of the Phenylpropanoid Biosynthetic Pathway Key Genes Transcription upon Cold Stress and Viral Infection in Tomato Leaves. Horticulturae 2021, 7, 448. [Google Scholar] [CrossRef]
  33. Basu, S.; Roychoudhury, A.; Saha, P.P.; Sengupta, D.N. Differential antioxidative responses of indica rice cultivars to drought stress. Plant Growth Regul. 2010, 60, 51–59. [Google Scholar] [CrossRef]
  34. Ma, D.; Sun, D.; Wang, C.; Li, Y.; Guo, T. Expression of flavonoid biosynthesis genes and accumulation of flavonoid in wheat leaves in response to drought stress. Plant Physiol. Biochem. 2014, 80, 60–66. [Google Scholar] [CrossRef] [PubMed]
  35. Bolinder, M.A.; Janzen, H.H.; Gregorich, E.G.; Angers, D.A.; VandenBygaart, A.J. An approach for estimating net primary productivity and annual carbon inputs to soil for common agricultural crops in Canada. Agric. Ecosyst. Environ. 2007, 118, 29–42. [Google Scholar] [CrossRef]
  36. Raven, J.A.; Handley, L.L.; Andrews, M. Global aspects of C/N interactions determining plant-environment interactions. J. Exp. Bot 2004, 55, 11–25. [Google Scholar] [CrossRef]
  37. Nio, S.A.; Cawthray, G.R.; Wade, L.J.; Colmer, T.D. Pattern of solutes accumulated during leaf osmotic adjustment as related to duration of water deficit for wheat at the reproductive stage. Plant Physiol. Biochem. 2011, 49, 1126–1137. [Google Scholar] [CrossRef]
  38. Reguera, M.; Peleg, Z.; Abdel-Tawab, Y.M.; Tumimbang, E.B.; Delatorre, C.A.; Blumwald, E. Stress-induced cytokinin synthesis increases drought tolerance through the coordinated regulation of carbon and nitrogen assimilation in rice. Plant Physiol. 2013, 163, 1609–1622. [Google Scholar] [CrossRef] [PubMed] [Green Version]
  39. Leport, L.; Turner, N.C.; French, R.J.; Barr, M.D.; Duda, R.; Davies, S.L. Physiological responses of chickpea genotypes to terminal drought in a Mediterranean-type environment. Eur. J. Agron. 2006, 11, 279–291. [Google Scholar] [CrossRef]
  40. Kahmen, A.; Perner, J.; Buchmann, N. Diversity-dependent productivity in semi-natural grasslands following climate perturbations. Funct. Ecol. 2005, 19, 594–601. [Google Scholar] [CrossRef]
  41. Xu, W.; Cui, K.; Xu, A.; Nie, L.; Huang, J.; Peng, S. Drought stress condition increases root to shoot ratio via alteration of carbohydrate partitioning and enzymatic activity in rice seedlings. Acta Physiol. Plant. 2015, 37, 9. [Google Scholar] [CrossRef]
  42. Nosalewicz, A.; Siecińska, J.; Kondracka, K.; Nosalewicz, M. The functioning of Festuca arundinacea and Lolium perenne under drought is improved to a different extend by the previous exposure to water deficit. Environ. Exp. Bot. 2018, 156, 271–278. [Google Scholar] [CrossRef]
  43. Liu, Y.; Li, P.; Xu, G.C.; Xiao, L.; Ren, Z.P.; Li, Z.B. Growth, morphological, and physiological responses to drought stress in Bothriochloa ischaemum. Front. Plant Sci. 2017, 8, 230. [Google Scholar] [CrossRef] [PubMed] [Green Version]
  44. Anjum, S.A.; Xiao-yu Xie, X.; Wang, L.; Saleem, M.F.; Man, C.; Le, W. Morphological, physiological and biochemical responses of plants to drought stress. Afr. J. Agric. Res. 2011, 6, 2026–2032. [Google Scholar] [CrossRef]
  45. Taheri-Garavand, A.; Rezaei Nejad, A.; Fanourakis, D.; Fatahi, S.; Majd, M.A. Employment of artificial neural networks for non-invasive estimation of leaf water status using color features: A case study in Spathiphyllum wallisii. Acta Physiol Plant 2021, 43, 78. [Google Scholar] [CrossRef]
  46. Blum, A. Effective use of water (EUW) and not water-use efficiency (WUE) is the target of crop yield improvement under drought stress. Field Crop. Res. 2009, 112, 119–123. [Google Scholar] [CrossRef]
  47. Abdollahi, B.M.; Saeidnia, F.; Majidi, M.M.; Mirlohi, A. Growth traits associated with drought survival, recovery and persistence of cocksfoot (Dactylis glomerata) under prolonged drought treatments. Crop. Pasture Sci. 2019, 70, 85–94. [Google Scholar]
  48. Borawska-Jarmułowicz, B.; Mastalerczuk, G.; Dąbrowski, P.; Kalaji, H.M.; Wytrążek, K. Improving tolerance in seedlings of some Polish varieties of Dactylis glomerata to water deficit by application of simulated drought during seed germination. Photosynth 2020, 58, 355–363. [Google Scholar] [CrossRef] [Green Version]
Figure 1. Diagram of application of water deficit during the study. First year: D1—summer drought, D2—late summer drought; second year: D3—spring drought, D4—summer drought.
Agronomy 11 02471 g001
Figure 2. Average daily air humidity (%), temperature (°C) and substrate capillary water capacity (%) during the periods of water deficit (D1, D2, D3, D4).
Agronomy 11 02471 g002
Figure 3. Variation in physiological features among cultivars of F. braunii (cvs. Felopa and Sulino), F. arundinacea (cvs. Odys and Rahela) and L. perenne (cvs. Bajka and Gagat) during experiment (after 4, 7, 14 and 21 treatment days) depending on terms of water conditions (C—control; D1, D2, D3; D4—water deficit). Vertical bars denote the standard error.
Agronomy 11 02471 g003
Figure 4. Root length distribution (% relative to control) of F. braunii (cvs. Felopa and Sulino), F. arundinacea (cvs. Odys and Rahela) and L. perenne (cvs. Bajka and Gagat) in ten diameter classes (0.0 <= 0.3, 0.3 <= 0.6, 0.6 <= 0.9, 0.9 <= 1.2, 1.2 <= 1.5, 1.5 <= 1.8, 1.8 <= 2.1, 2.1 <= 2.4, 2.4 <= 2.7 and 2.7 <= 3 mm) depending on the term of water deficit (D1, D2, D3, D4).
Agronomy 11 02471 g004
Figure 5. Live shoots of plants (%) after water deficit and recovery periods (survival) compared to the control, depending on the term of water deficit (D1, D2, D3, D4).
Agronomy 11 02471 g005
Figure 6. Correlation coefficients (r) of F. braunii (cvs. Felopa and Sulino), F. arundinacea (cvs. Odys and Rahela) and L. perenne (cvs. Bajka and Gagat) cultivars under drought condition (a) between survival (Surv) and other studied parameters, (b) between water use efficiency (WUE) and other studied parameters; n = 12; correlations significant at p ≤ 0.05 (*); for explanation of abbreviations see Table 1.
Agronomy 11 02471 g006
Figure 7. Results of principal component analysis (PCA) (a) presenting relationships between all analyzed parameters and (b) for the term of water deficit (D1, D2, D3, D4); for explanation of abbreviations see Table 1.
Agronomy 11 02471 g007
Table 1. Abbreviations and their explanations used in the text.
TraitDescription and UnitTraitDescription and Unit
ChlContent of chlorophyll (Dualex unit)RMRRoot mass ratio—root dry mass to total plant dry mass (g/g)
CiSub-stomatal CO2 concentration (µmol CO2/mol air)RNCRoot nitrogen content (g/kg DM)
ETranspiration rate (mmol H2O/m2/s)Root C:NRoot carbon to nitrogen ratio
FlvContent of flavonols (Dualex unit)RWCRelative water content (%)
gsStomatal conductance (mol H2O/m2/s)SCAShoot carbon accumulation (kg/plant)
PNNet photosynthetic rate (μmol CO2/m2/s)SCCShoot carbon content (g/kg DM)
R:SRoot to shoot ratio—root dry mass to shoot dry mass (g/g)SDMShoot dry mass (g/plant)
RARoot area (cm2/plant)Shoot C:NShoot carbon to nitrogen ratio
RCARoot carbon accumulation (kg/plant)SNCShoot nitrogen content (g/kg DM)
RCCRoot carbon content (g/kg DM)SRASpecific root area (m2/g)
RDRoot diameter (mm)SRLSpecific root length (m/g)
RDMRoot dry mass (g/plant)SurvSurvival of plants (%)
RLTotal root length (m/plant)TITillering intensity—the number of shoots per plant (no./plant)
RLDRoot length density (cm/cm3)TPDMTotal plant dry mass (g/plant)
RLRRoot length ratio—root length to total plant dry mass (m/g)WUEWater use efficiency (µmol CO2/mmol H2O)
Table 2. Physiological and chemical features of grass species (F. braunii—Fb; F. arundinacea—Fa; L. perenne—Lp) in different substrate water conditions (C—control; D1, D2, D3; D4—water deficit); for explanation of abbreviations see Table 1.
FactorFeatures
PNECigsWUEChlFlvSCCSNCShoot C:NSCARCCRNCRoot C:NRCA
year
1st4.11 a1.44 a564 b0.27 b2.76 a20.3 a1.54 a400 a16.5 a28.9 b2.22 a377 b9.7 a39.0 b2.54 b
2nd5.28 b1.79 b525 a0.14 a2.85 a19.9 a1.49 a408 b20.4 b22.1 a2.30 a366 a14.4 b26.0 a2.40 a
water conditions
C7.33 b2.15 c567 b0.32 c3.85 c22.9 b1.76 c402 b14.8 b28.7 b3.08 c371 b10.9 b34.8 b3.15 e
D11.38 a0.95 a429 a0.04 a1.08 a22.6 b1.17 a397 a27.0 c14.8 a1.96 b375 b9.4 a39.8 c1.82 b
D22.40 a0.99 a584 b0.19 b2.04 b13.4 a1.50 b403 b11.1 a37.2 c2.17 b396 c10.2 b38.9 c2.88 d
D32.52 a1.62 b523 b0.08 a1.31 a21.3 b1.09 a409 c29.1 d14.4 a1.34 a369 b15.8 d23.5 a1.44 a
D41.91 a0.73 a551 b0.04 a2.57 b12.0 a1.26 ab408 c14.0 b29.4 b1.92 b345 a15.0 c23.2 a2.36 c
species
Fb3.57 a1.11 a415 a0.17 a2.90 a19.3 b1.48 b400 a19.0 b24.2 a2.28 b363 a12.6 b30.9 a2.59 b
Fa5.07 b1.81 b474 b0.25 b2.74 a23.2 c1.88 c407 c17.3 a27.6 b2.50 c382 b11.6 a34.1 c2.49 b
Lp5.43 b1.92 b745 c0.20 a2.77 a17.8 a1.17 a404 b19.0 b24.8 a1.99 a368 a11.9 a32.5 b2.32 a
cultivars
FbFelopa3.62 a1.07 a419 a0.18 a3.11 a19.0 ab1.49 b398 a18.9 b24.5 ab2.13 b358 a12.7 c30.1 a2.60 b
FbSulino3.51 a1.15 a410 a0.16 a2.69 a19.6 b1.46 b402 b19.2 b24.0 a2.44 c367 b12.4 bc31.7 b2.58 b
FaOdys4.99 b1.75 b475 a0.25 b2.83 a23.5 c1.89 c407 c17.4 a28.1 c2.69 d388 d11.7 a34.8 d2.45 ab
FaRahela5.16 b1.87 b472 a0.25 b2.64 a23.0 c1.87 c406 c17.3 a27.0 c2.31 bc376 bc11.6 a33.5 cd2.54 b
LpBajka5.66 b2.12 b831 c0.21 ab2.62 a16.6 a1.10 a407 c18.8 b25.2 b1.85 a380 c12.0 ab33.0 bc2.18 a
LpGagat5.21 b1.72 b659 b0.18 a2.93 a18.9 ab1.23 a401 ab19.1 b24.4 ab2.13 b357 a11.8 a32.0 b2.46 ab
Data in columns marked with the same lowercase (a, b, ...) letters do not differ significantly according to Tukey’s test (p ≤ 0.05).
Table 3. Biometric growth features of grass species (F. braunii—Fb; F. arundinacea—Fa; L. perenne—Lp) in different substrate water conditions (C—control; D1, D2, D3; D4—water deficit); for explanation of abbreviations see Table 1.
FactorFeatures
TISDMRDMTPDMRDRLRASRLSRARLDR:SRMRRLRRWC
year
1st26.0 a6.42 b5.97 a15.56 b0.48 b346 a4952 a60.18 a869 a4.74 a0.63 a0.38 a3.24 a48.25 a
2nd27.3 a5.94 a6.24 b15.06 a0.44 a408 b5597 b70.87 b974 b5.59 b0.70 b0.41 b3.86 b47.75 a
water conditions
C31.9 b7.92 e8.27 c19.67 e0.47 c479 d6693 d61.53 a861 ab6.56 d0.72 c0.41 c3.45 b81.40 e
D119.4 a4.62 b5.29 b12.69 b0.48 c299 a4573 b60.24 a937 bc4.09 a0.71 c0.41 c3.66 b11.45 b
D231.9 b7.22 d5.55 b16.22 d0.46 bc340 b4524 b59.79 a803 a4.65 b0.52 a0.34 a2.77 a15.93 c
D318.0 a3.56 a3.64 a9.13 a0.43 a277 a3785 a78.49 c1071 d3.80 a0.67 bc0.40 c4.25 c25.52 d
D416.3 a5.84 c5.61 b14.48 c0.45 b386 c5379 c71.56 b998 cd5.30 c0.64 b0.38 b3.73 bc5.51 a
species
Fb25.2 b6.55 c6.34 b15.94 b0.44 a401 b5429 b65.62 b884 b5.50 b0.66 b0.40 b3.45 b47.61 a
Fa20.7 a6.18 b6.55 b15.58 b0.49 b264 a3920 a42.28 a633 a3.61 a0.73 b0.42 c2.62 a48.73 a
Lp34.1 c5.80 a5.42 a14.42 a0.44 a465 c6474 c88.67 c1248 c6.37 c0.60 a0.37 a4.58 c47.66 a
cultivars
FbFelopa24.2 bc6.62 d6.00 b15.63 bc0.45 a389 b5268 b67.79 c913 b5.34 b0.62 b0.38 b3.42 b48.39 ab
FbSulino26.3 cd6.48 cd6.69 c16.24 c0.44 a413 b5589 b63.45 c856 b5.67 b0.71 c0.41 c3.48 b46.83 a
FaOdys21.3 ab6.07 b6.97 c15.91 c0.50 c255 a3835 a39.07 a590 a3.49 a0.78 d0.43 d2.53 a48.53 ab
FaRahela20.0 a6.30 bc6.14 b15.24 b0.48 b272 a4006 a45.49 b676 a3.73 a0.67 bc0.40 c2.72 a48.93 b
LpBajka39.2 e5.41 a4.92 a13.76 a0.45 a476 c6742 d97.59 e1397 d6.52 c0.56 a0.36 a5.00 d47.26 ab
LpGagat29.0 d6.20 bc5.92 b15.07 b0.44 a454 c6206 c79.75 d1100 c6.22 c0.63 b0.38 b4.16 c48.05 ab
Data in columns marked with the same lowercase (a, b, ...) letters do not differ significantly according to Tukey’s test (p ≤ 0.05).
Publisher’s Note: MDPI stays neutral with regard to jurisdictional claims in published maps and institutional affiliations.

