
Grain Yield Estimation in Rice Breeding Using Phenological Data and Vegetation Indices Derived from UAV Images


Abstract
:1. Introduction
2. Materials and Methods
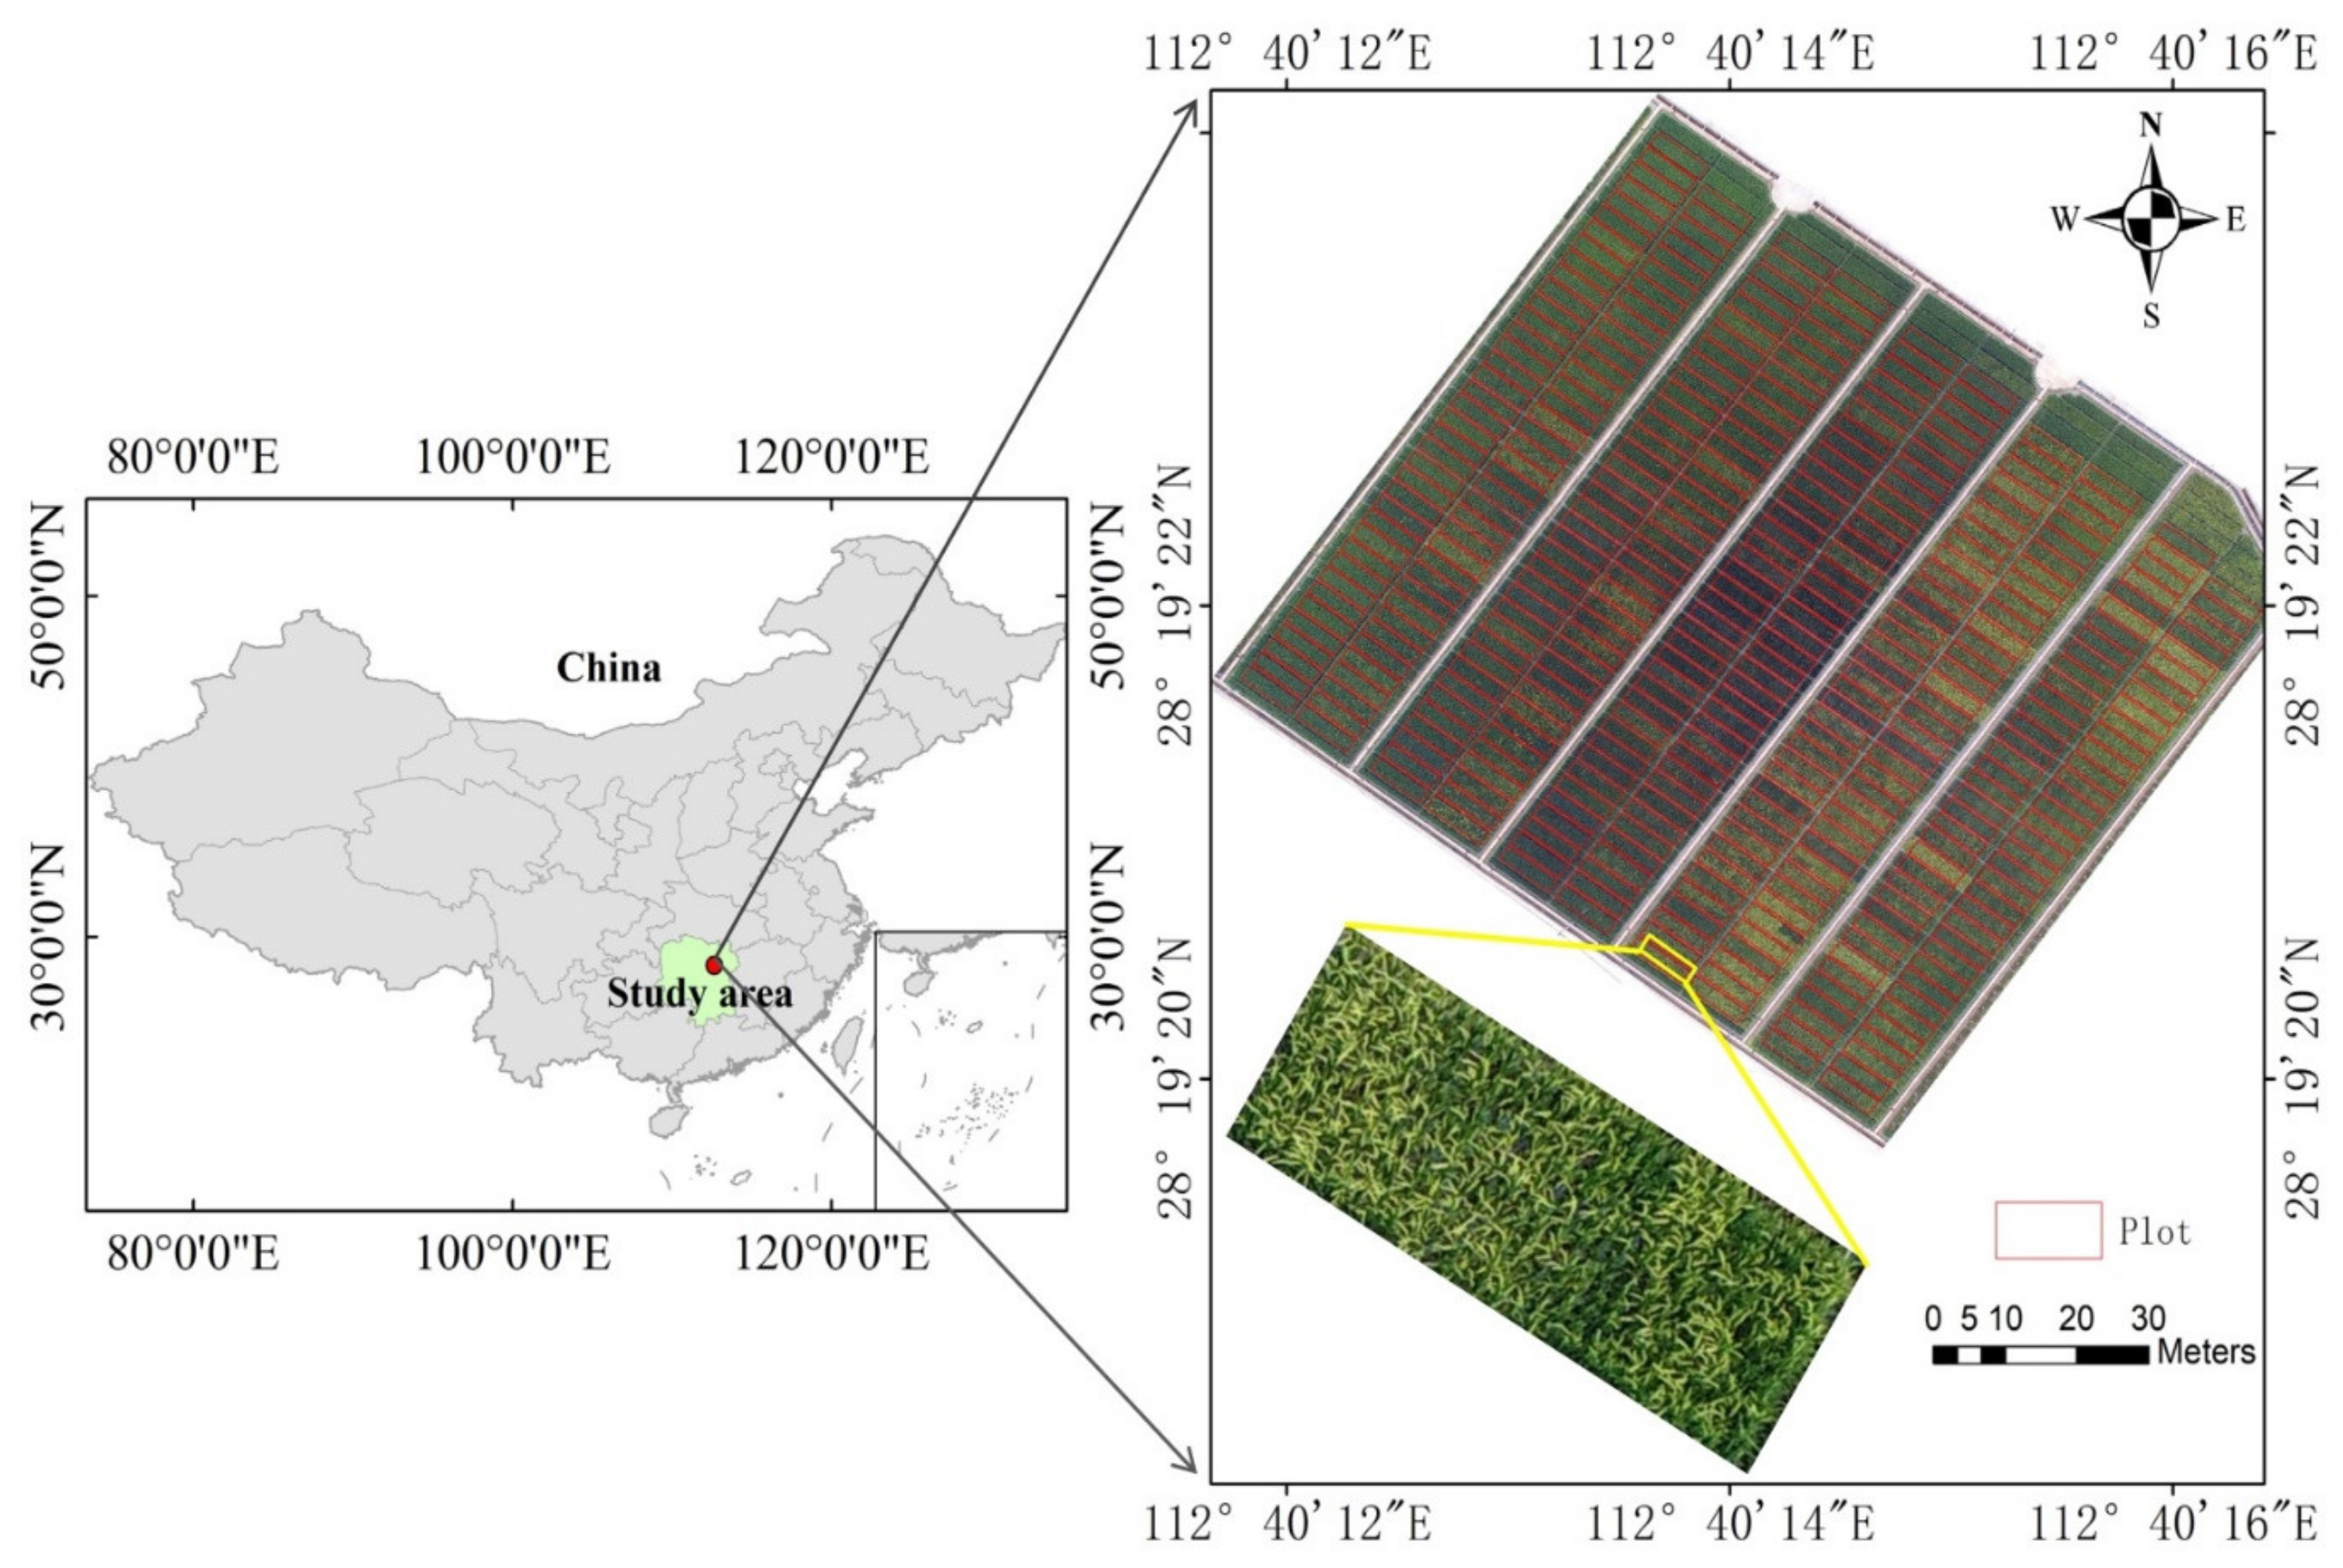
2.1. Field Trial Design
2.2. Field Data Collection
2.3. UAV Data Acquisition and Image Processing
2.4. RF Model
2.5. CERES-Rice Model
2.5.1. Input Data
2.5.2. Cultivar Parameter Estimations
2.6. Statistical Methods
3. Results
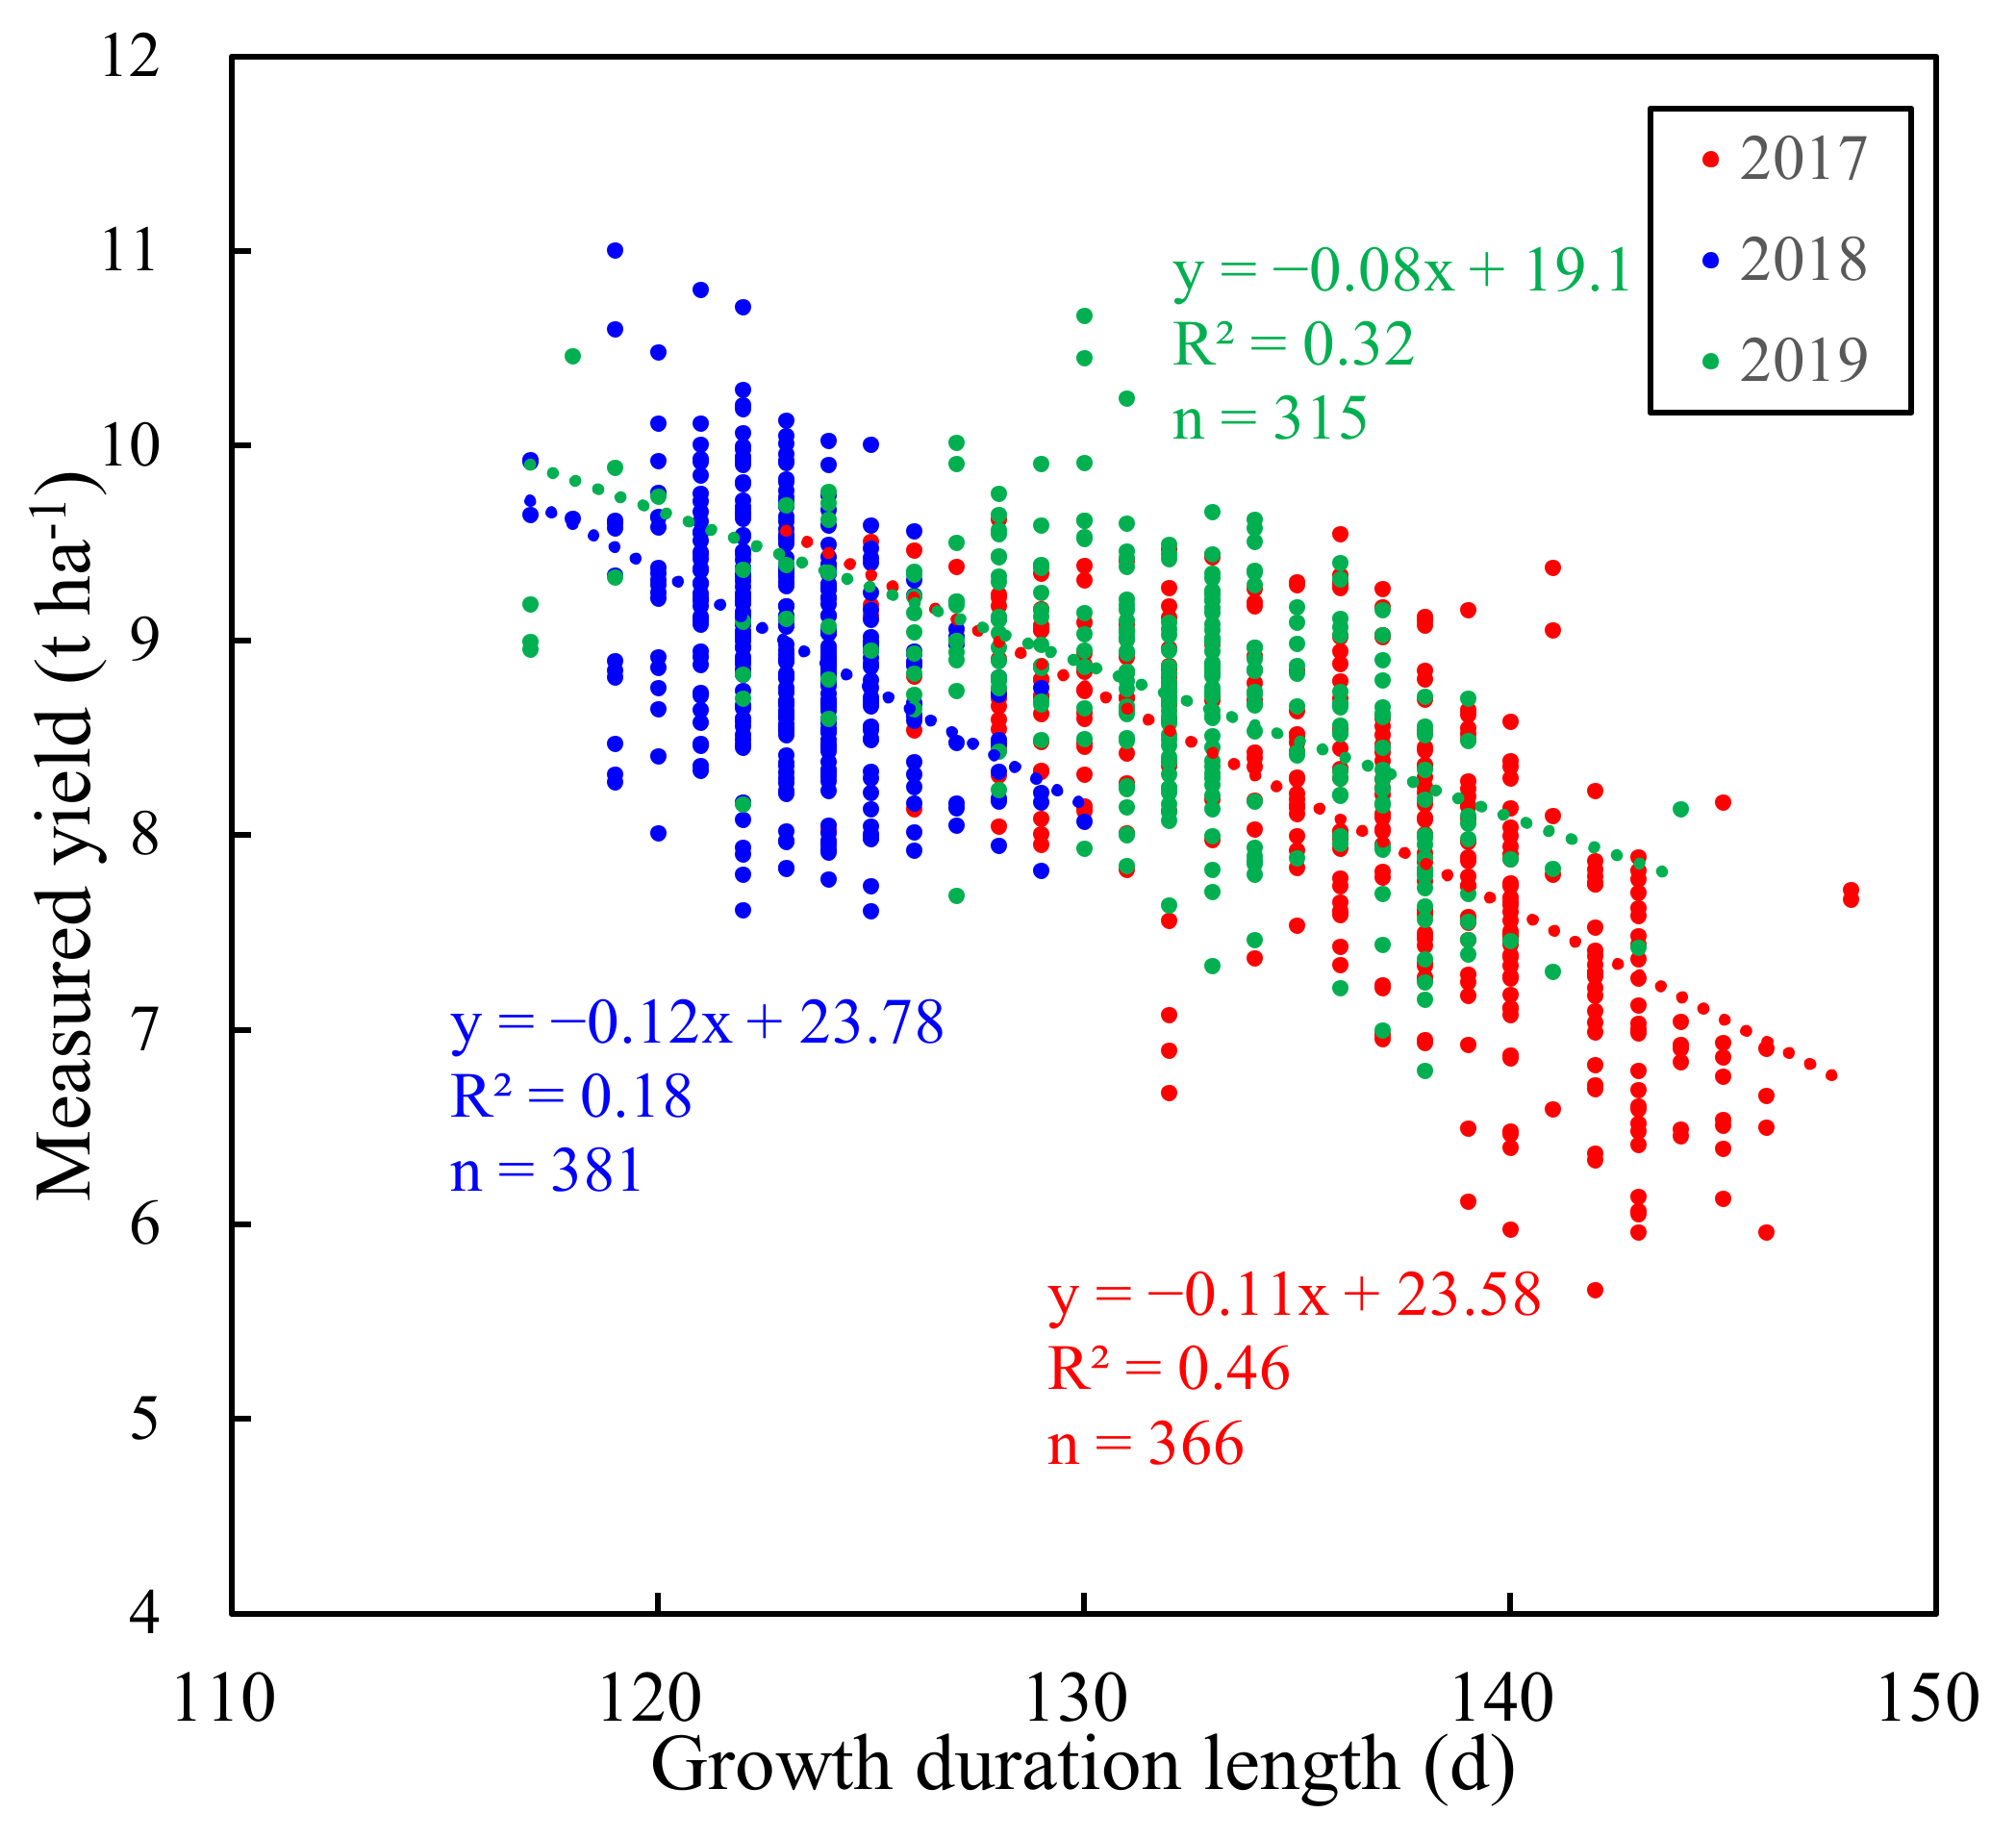
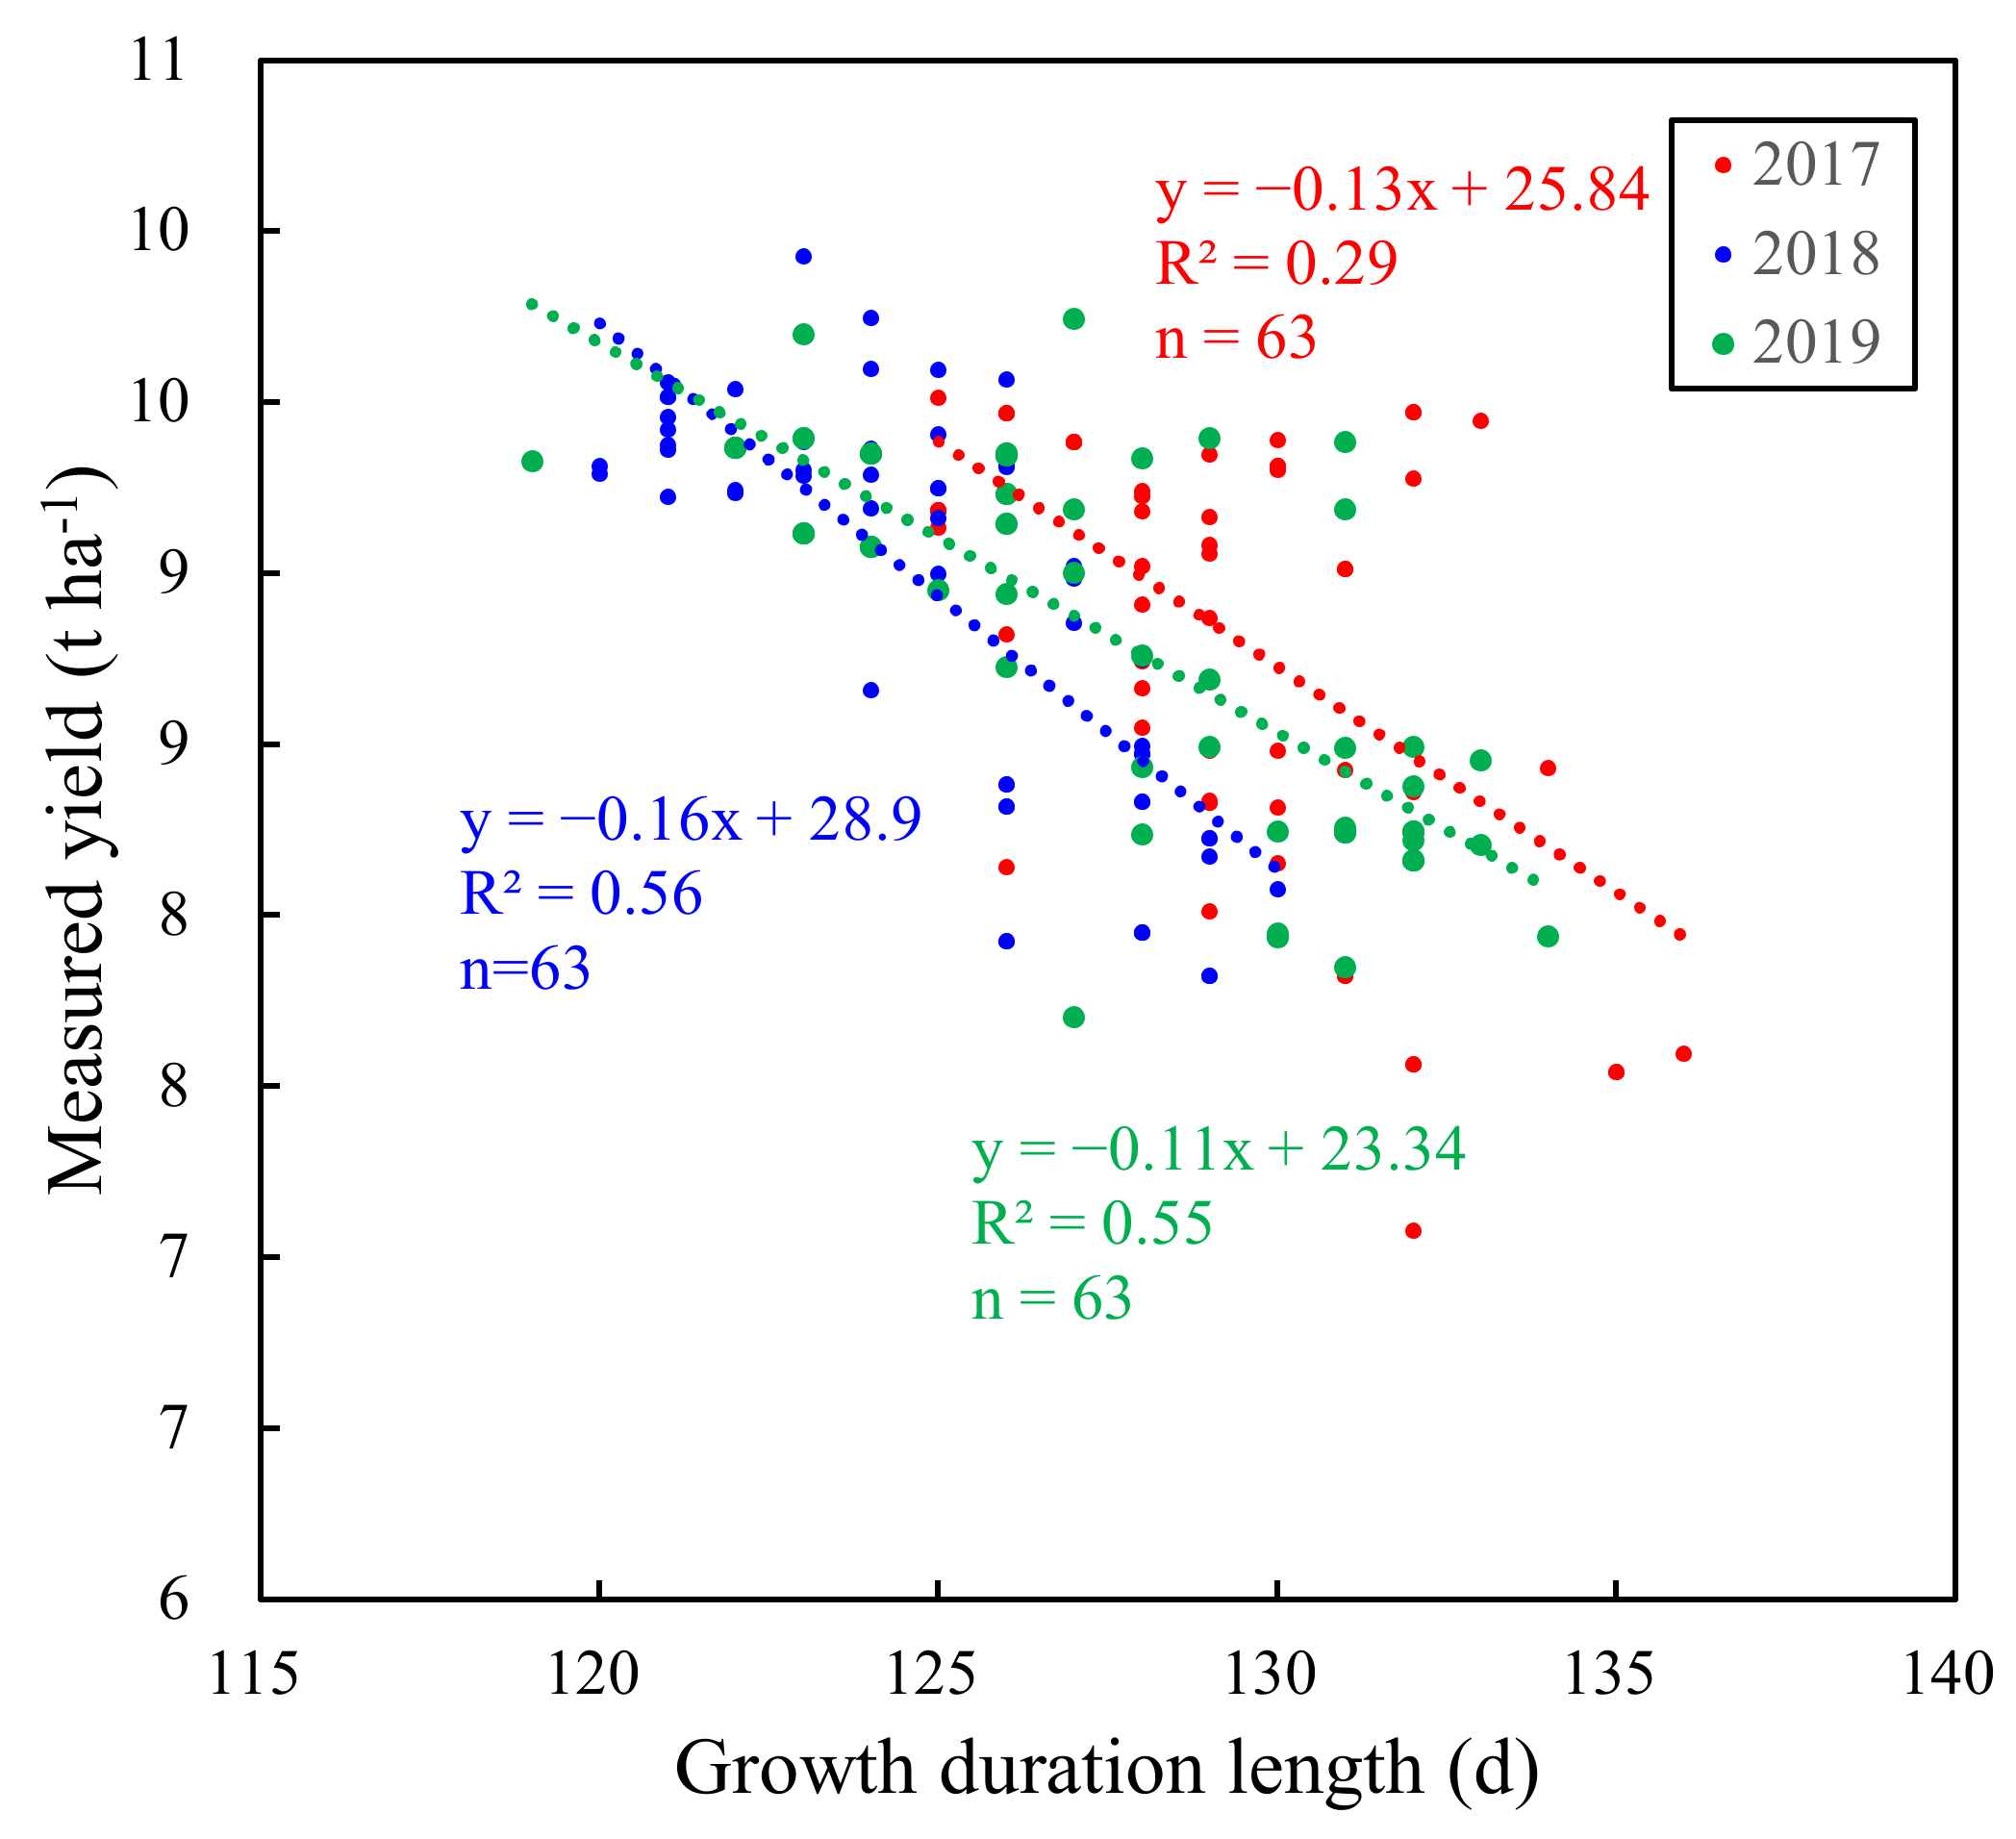
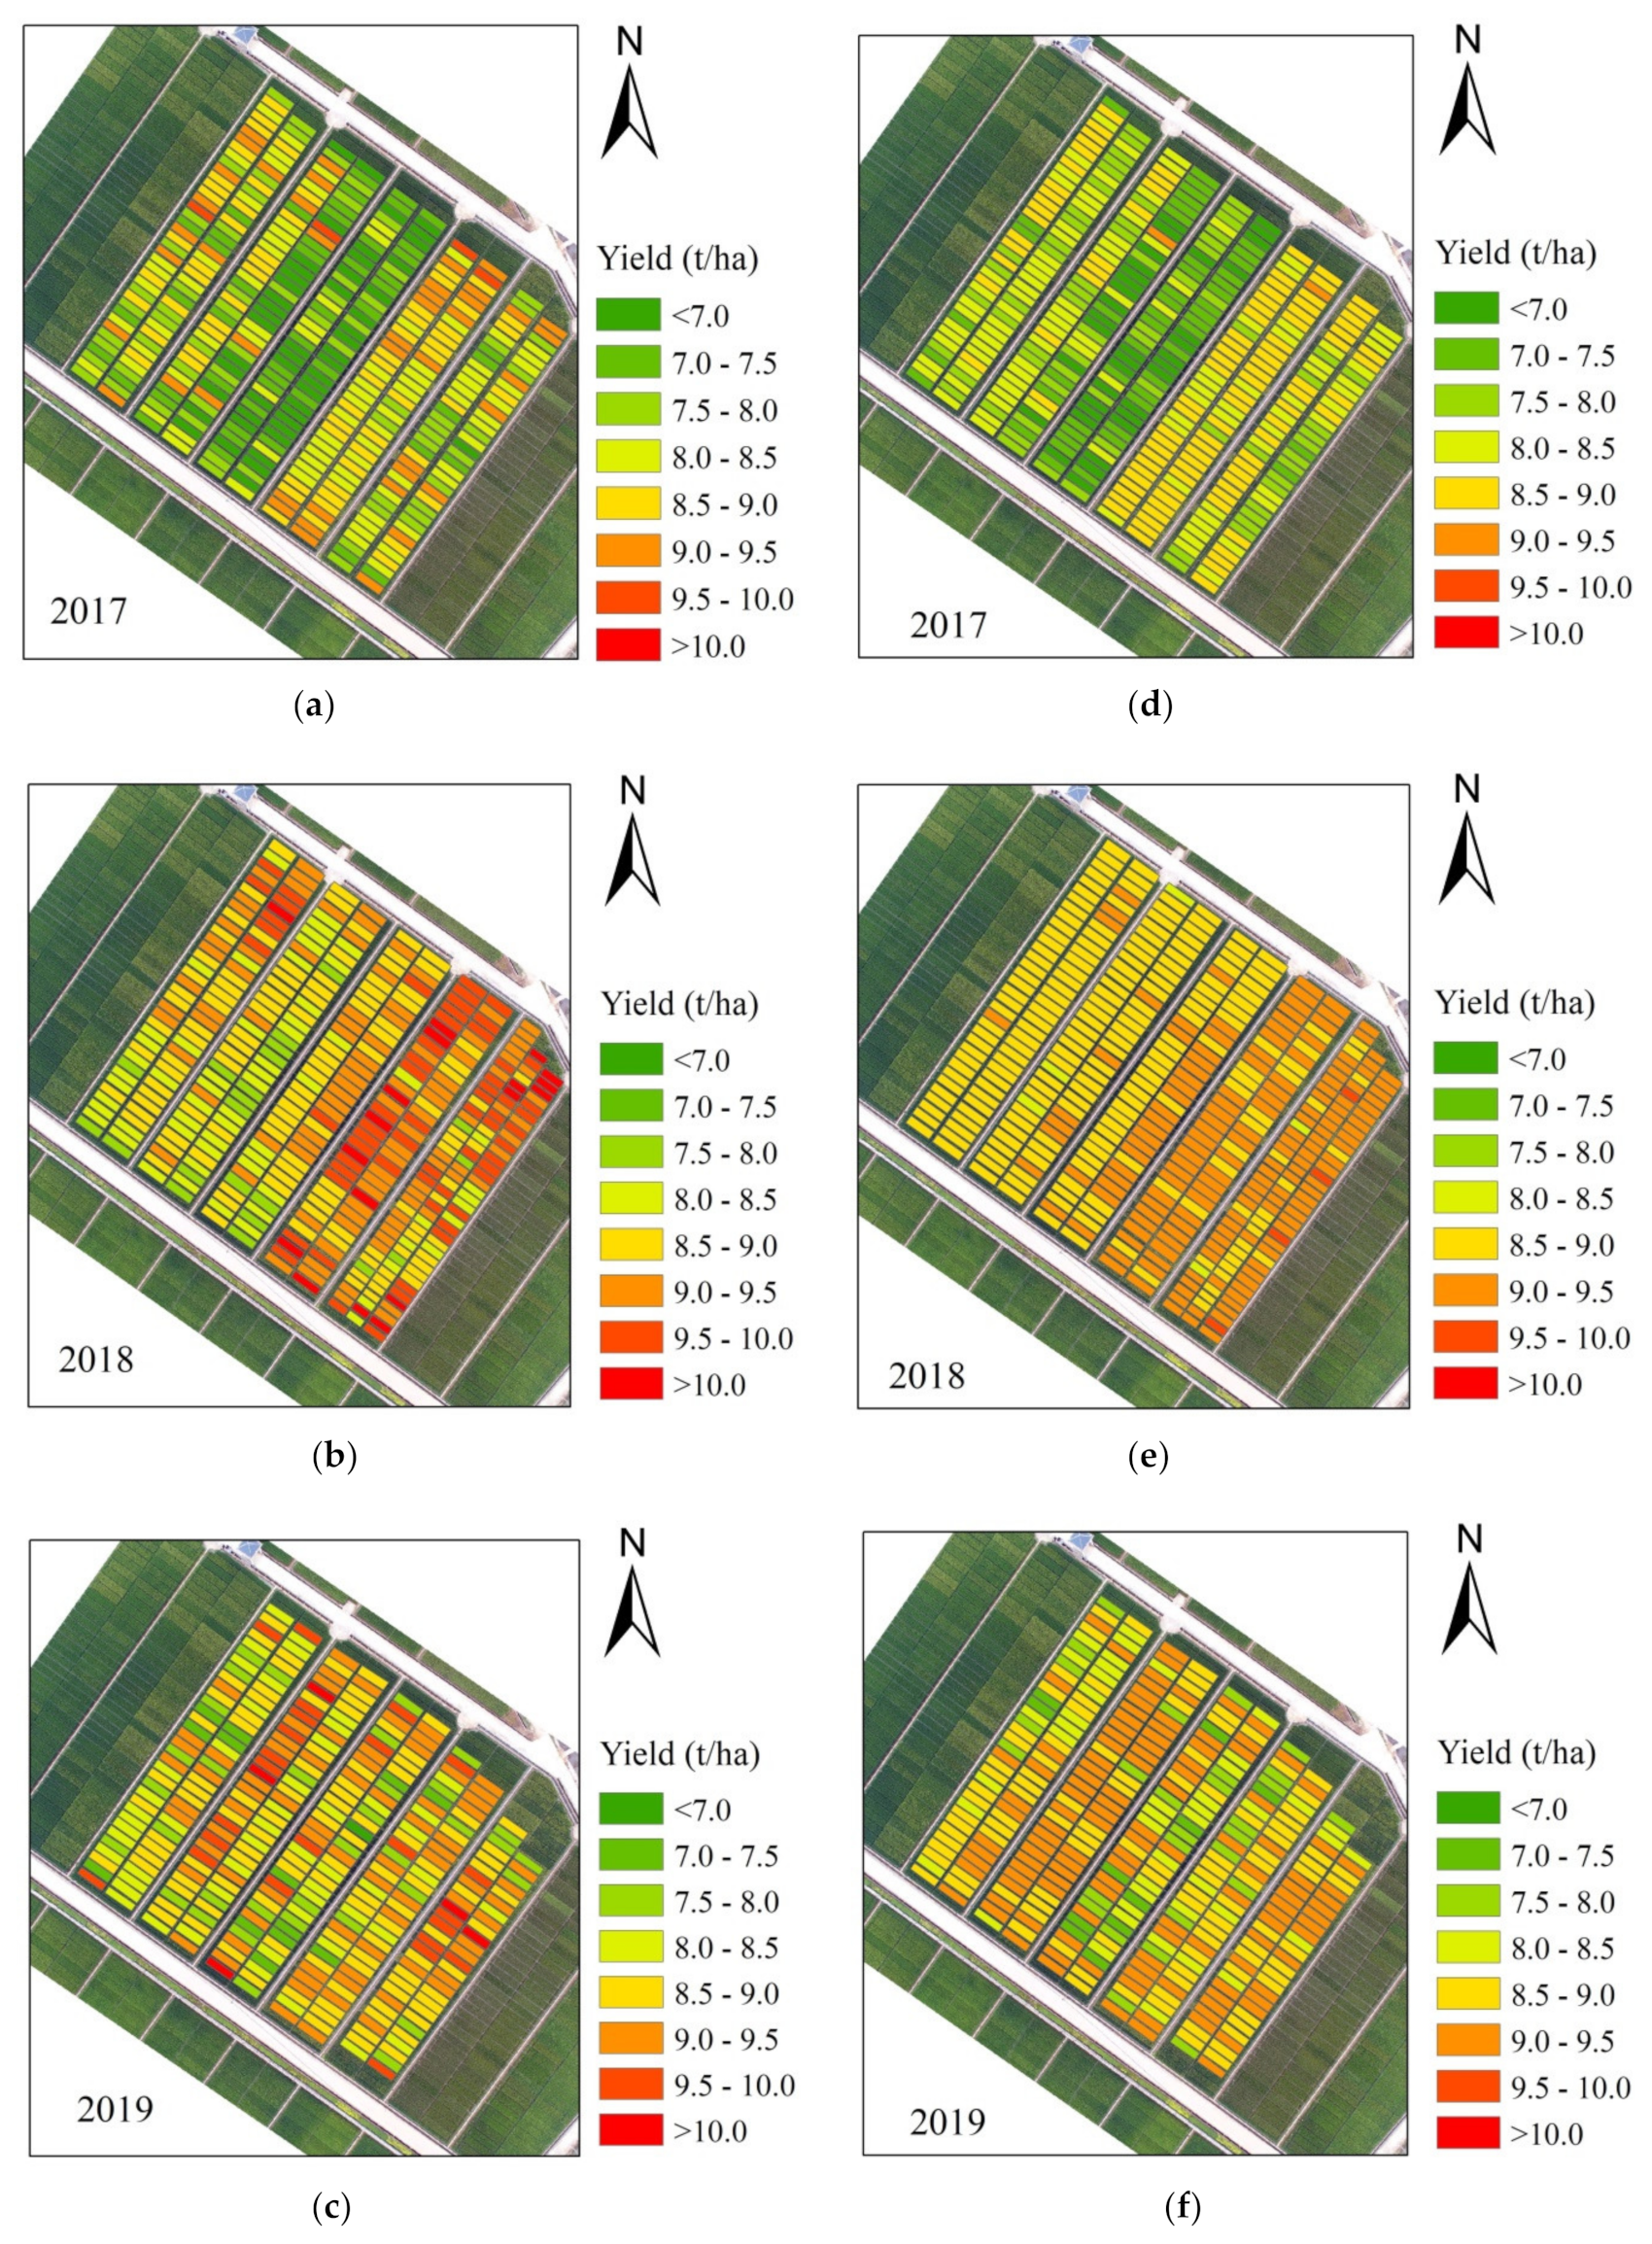
3.1. Statistical Analysis of Measured Yield
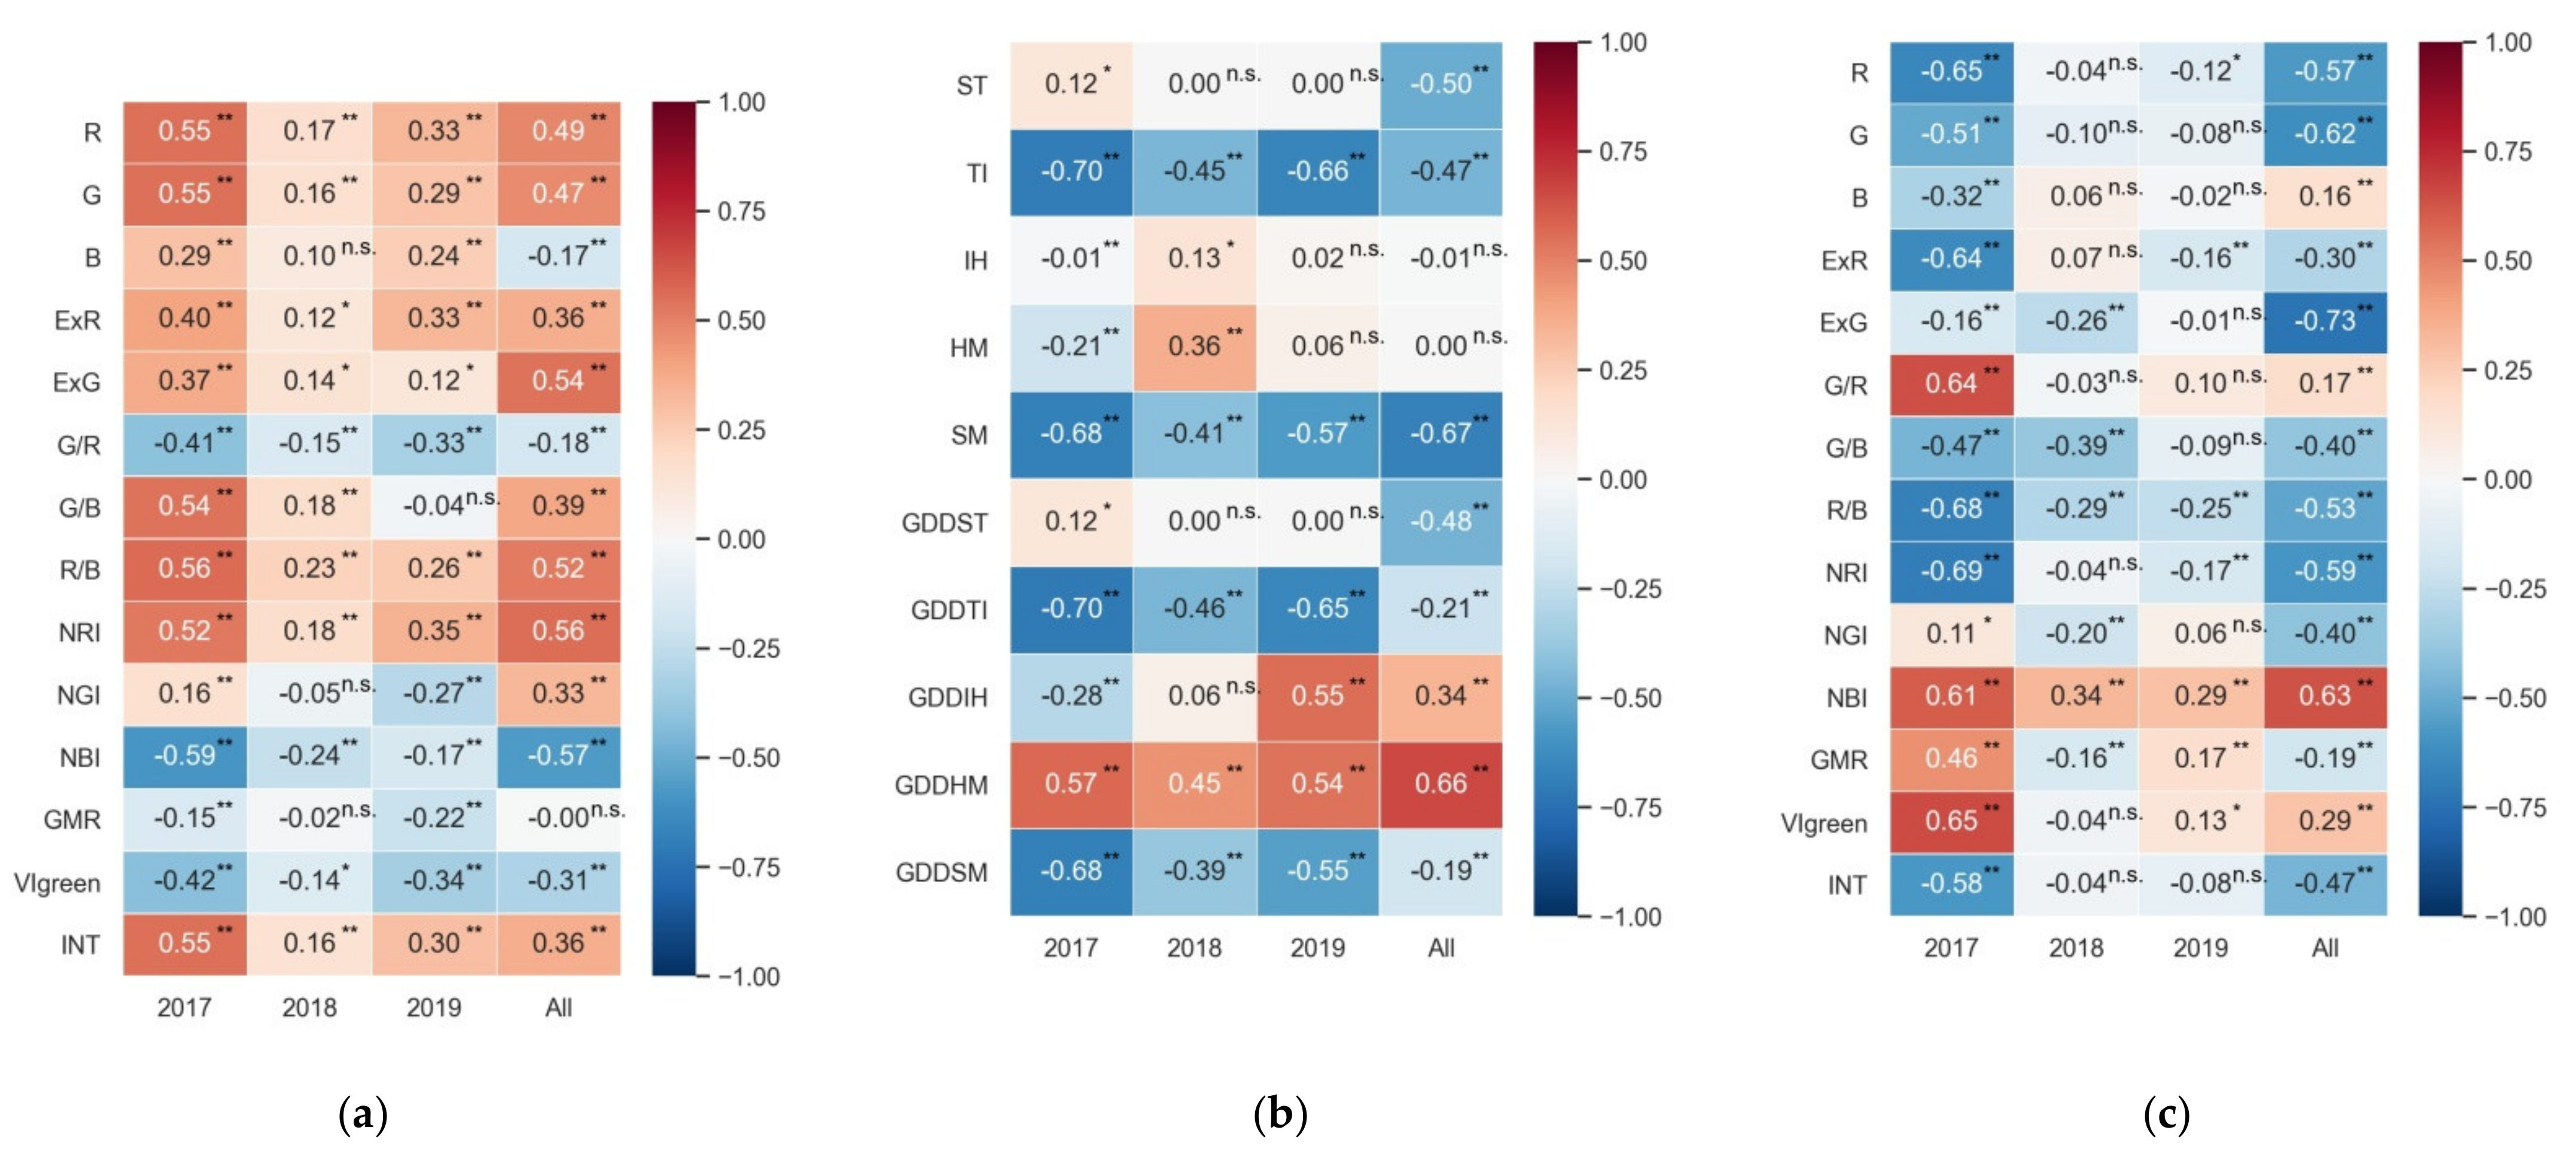
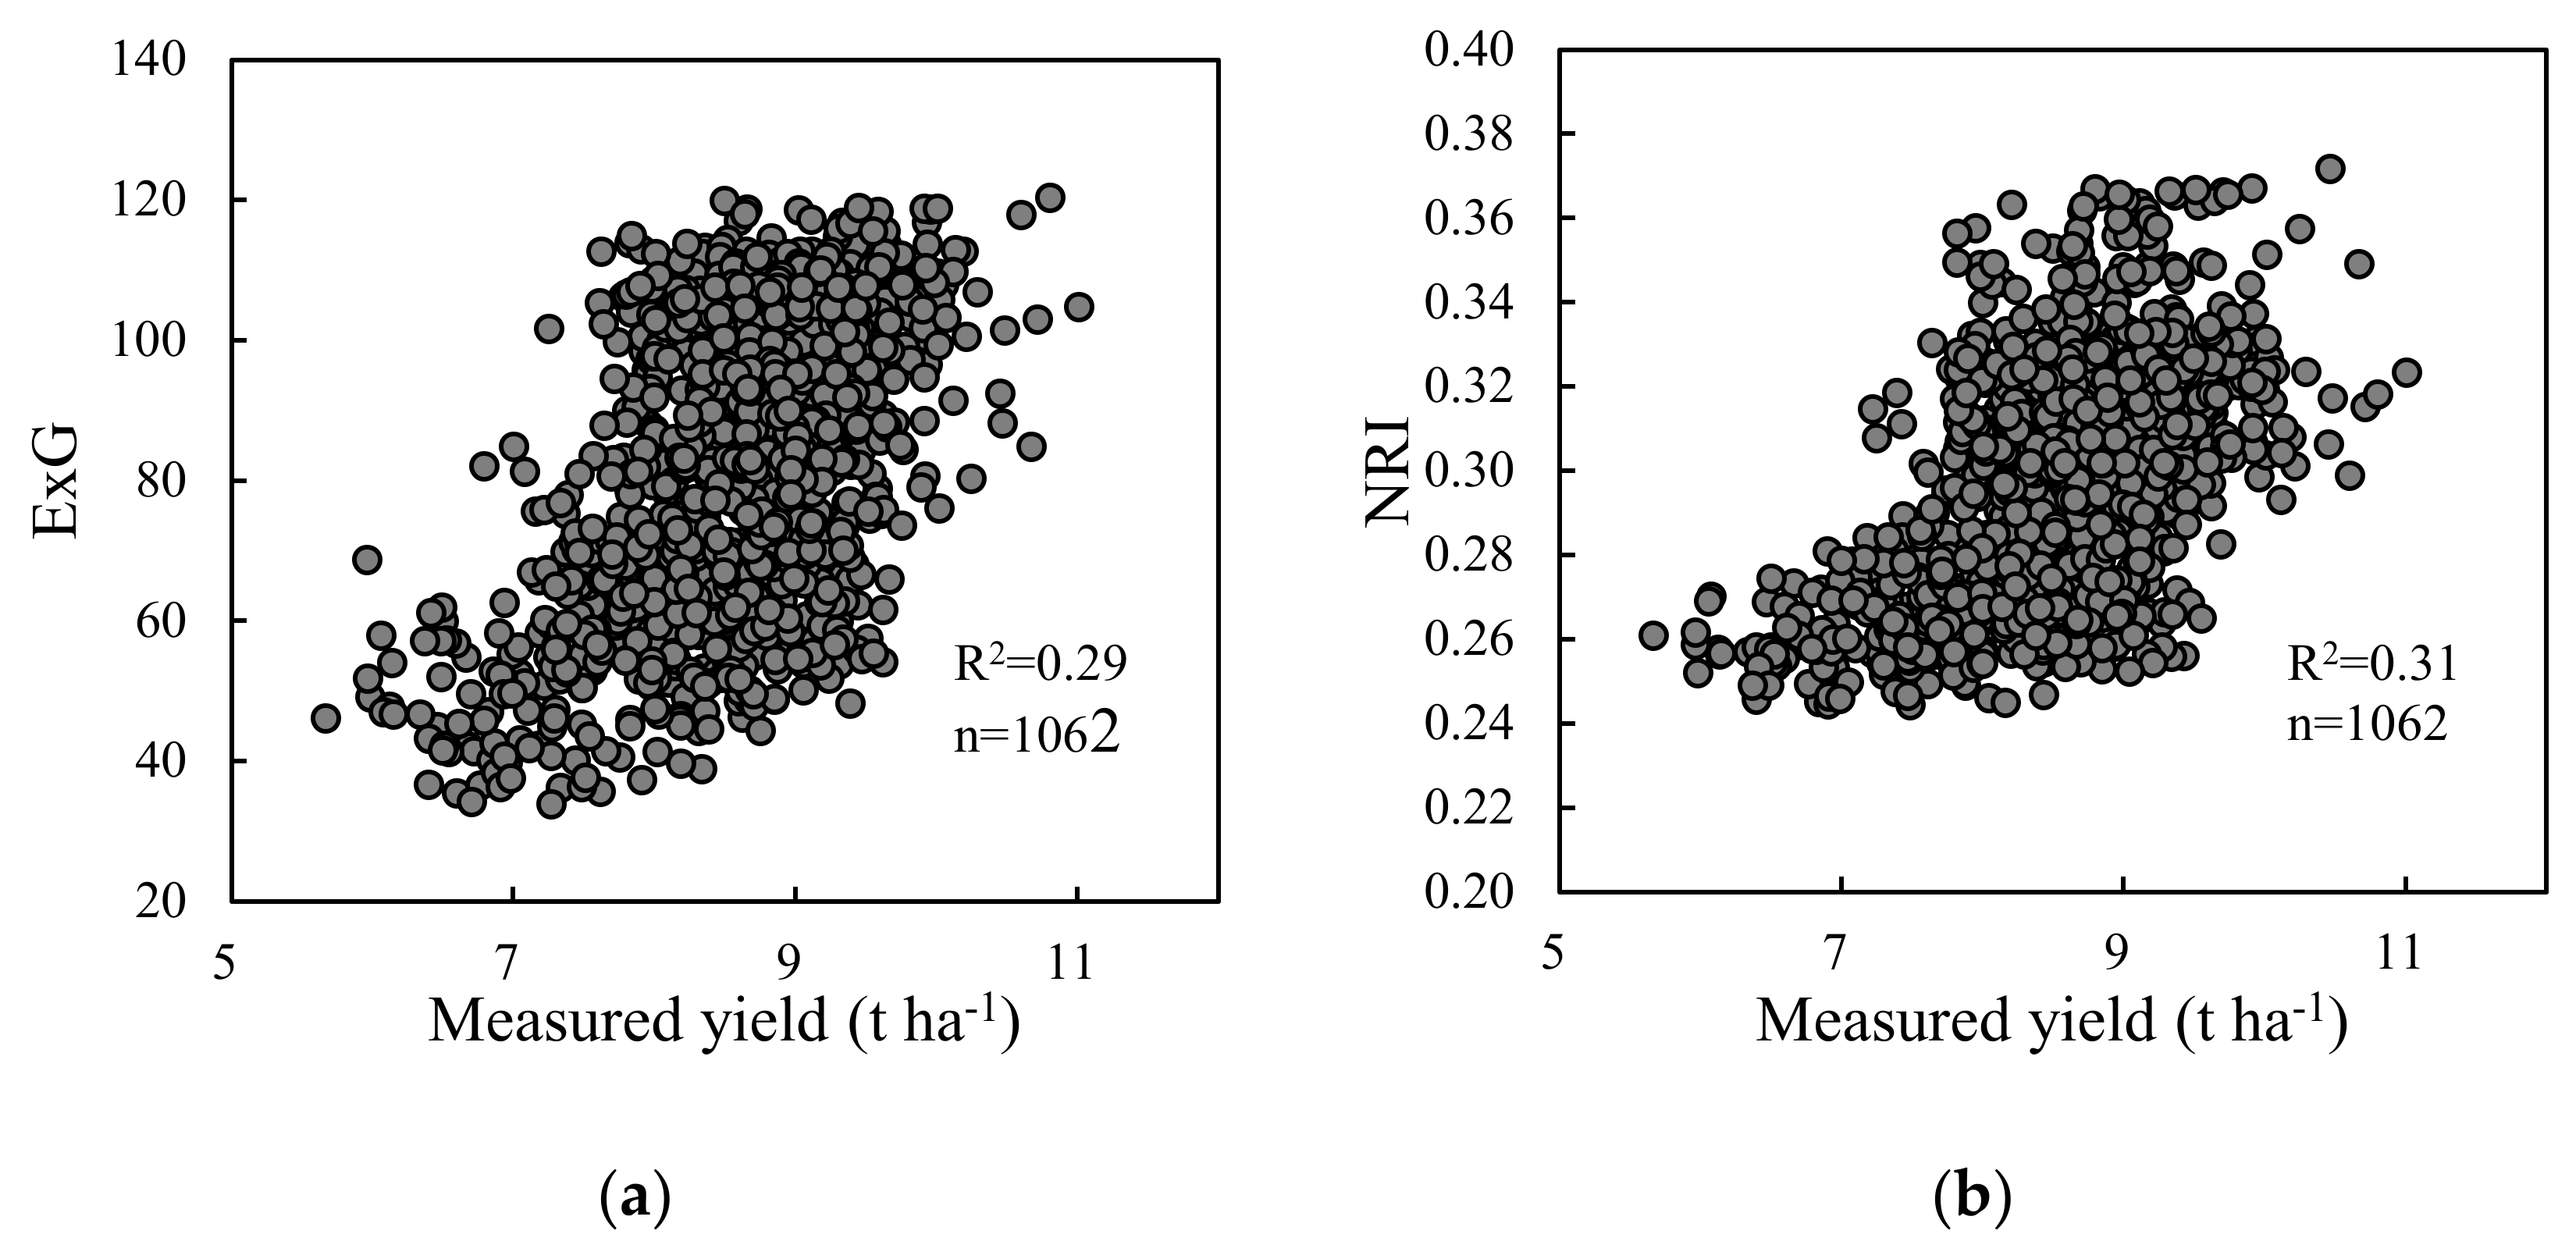
3.2. Analysis of VIs and Phenological Data
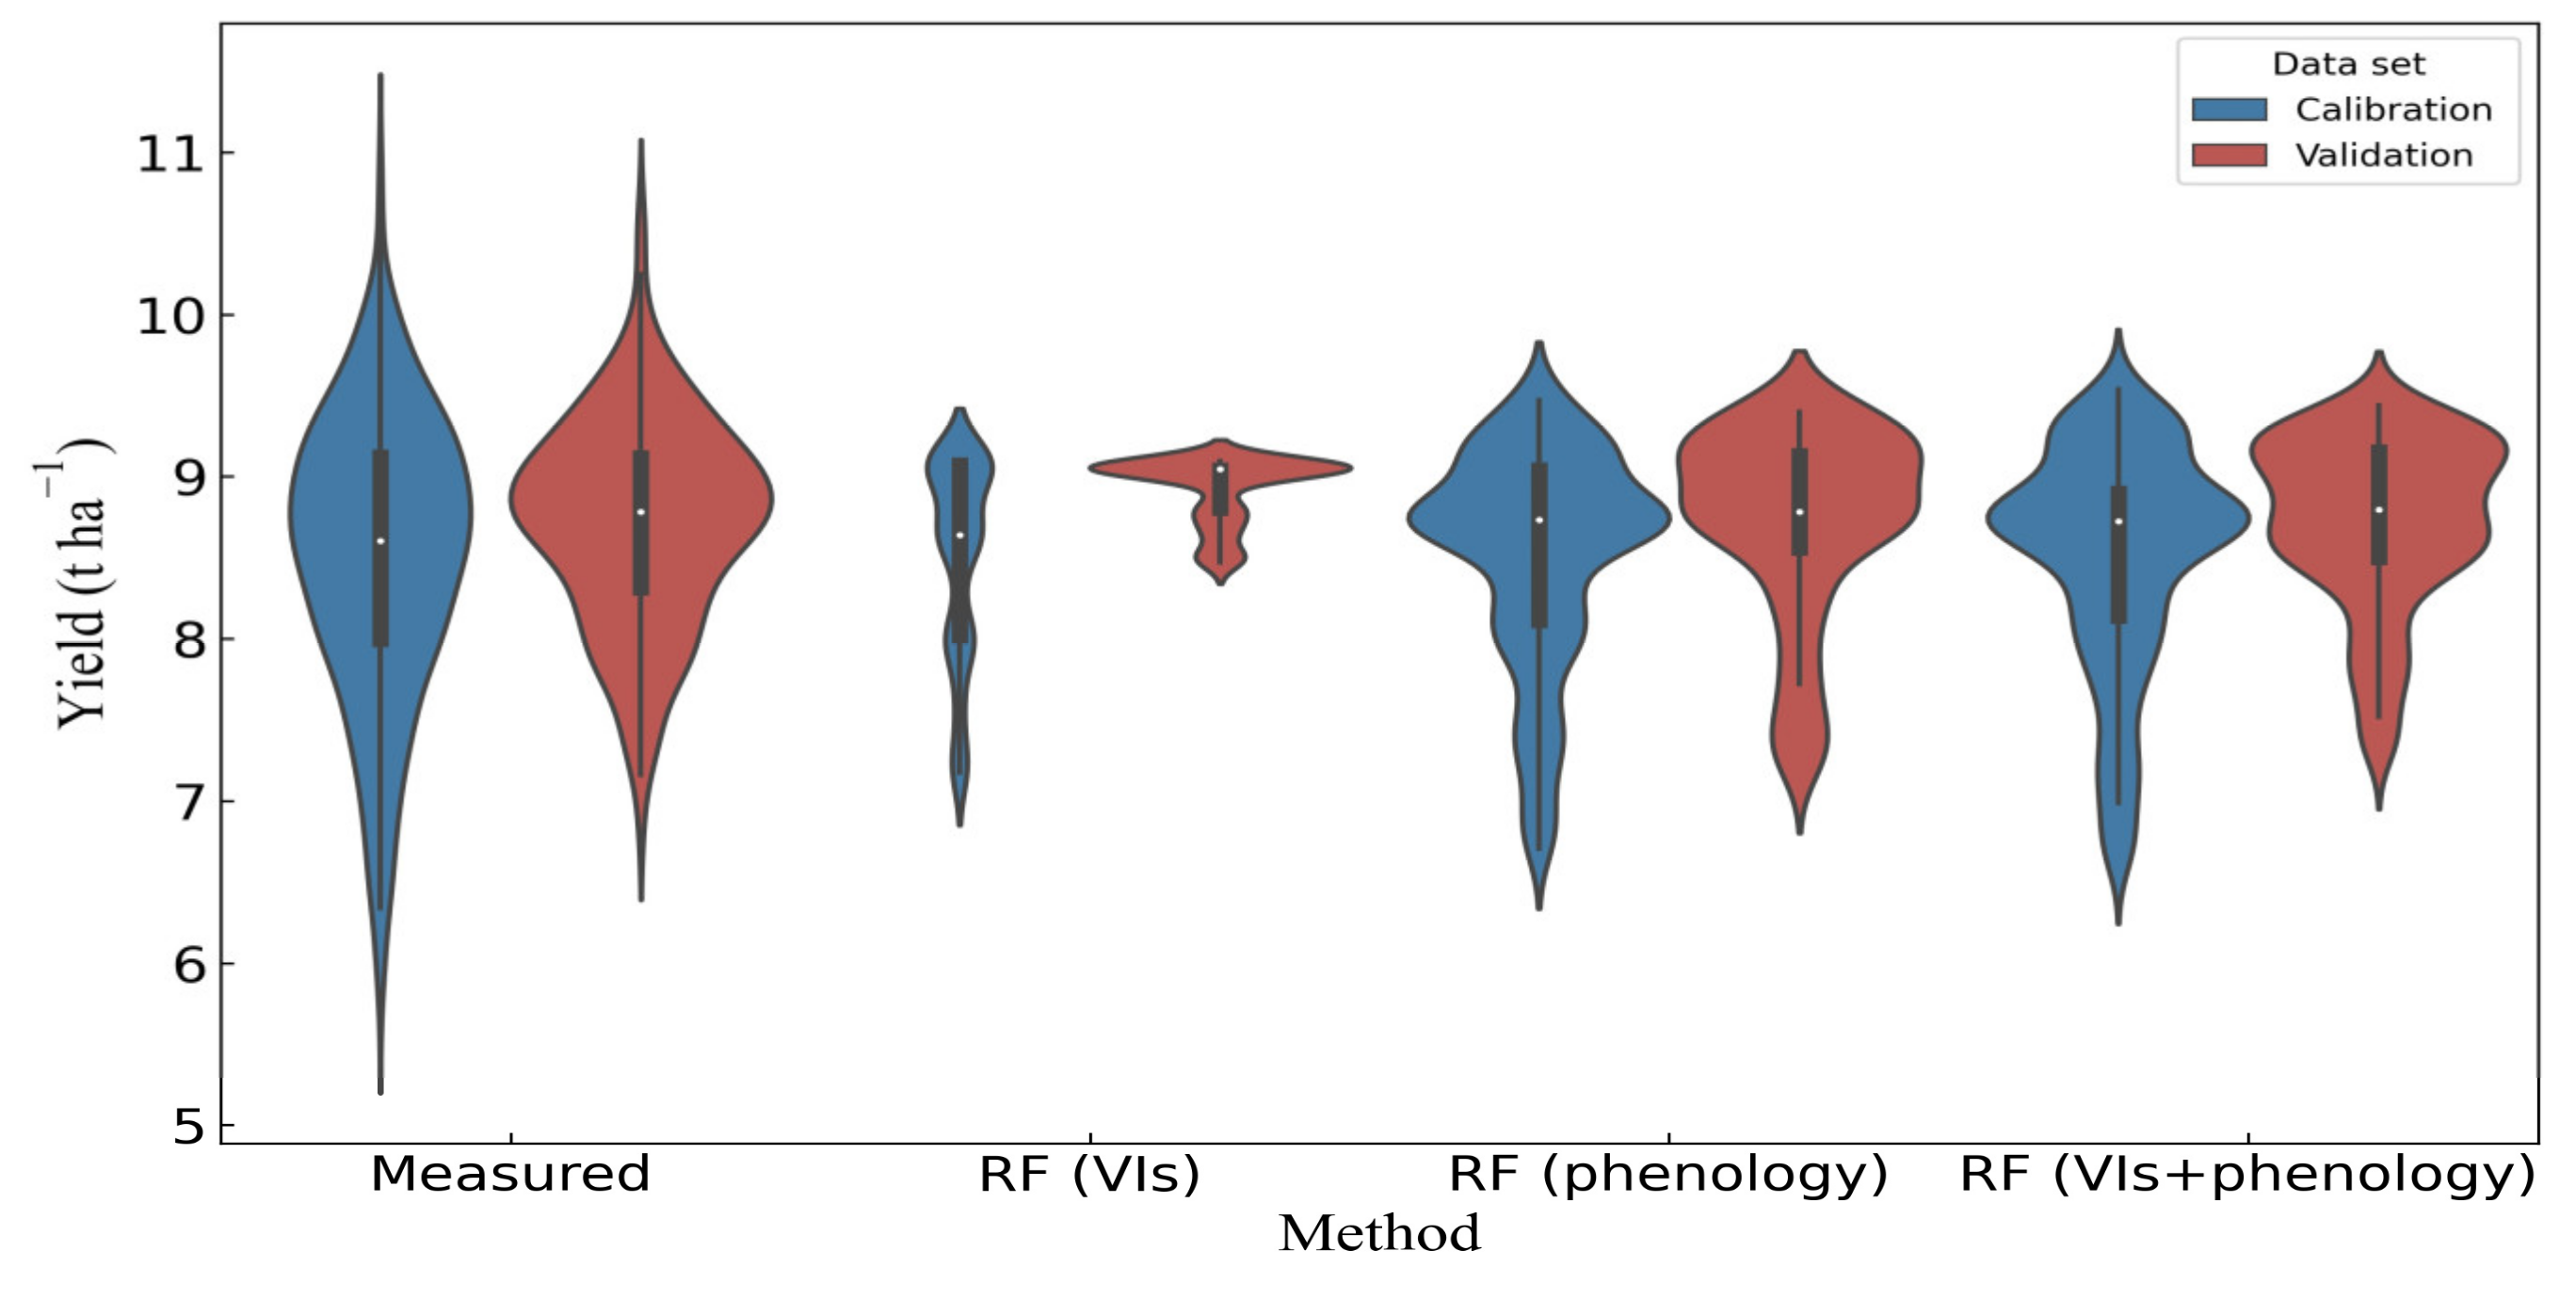
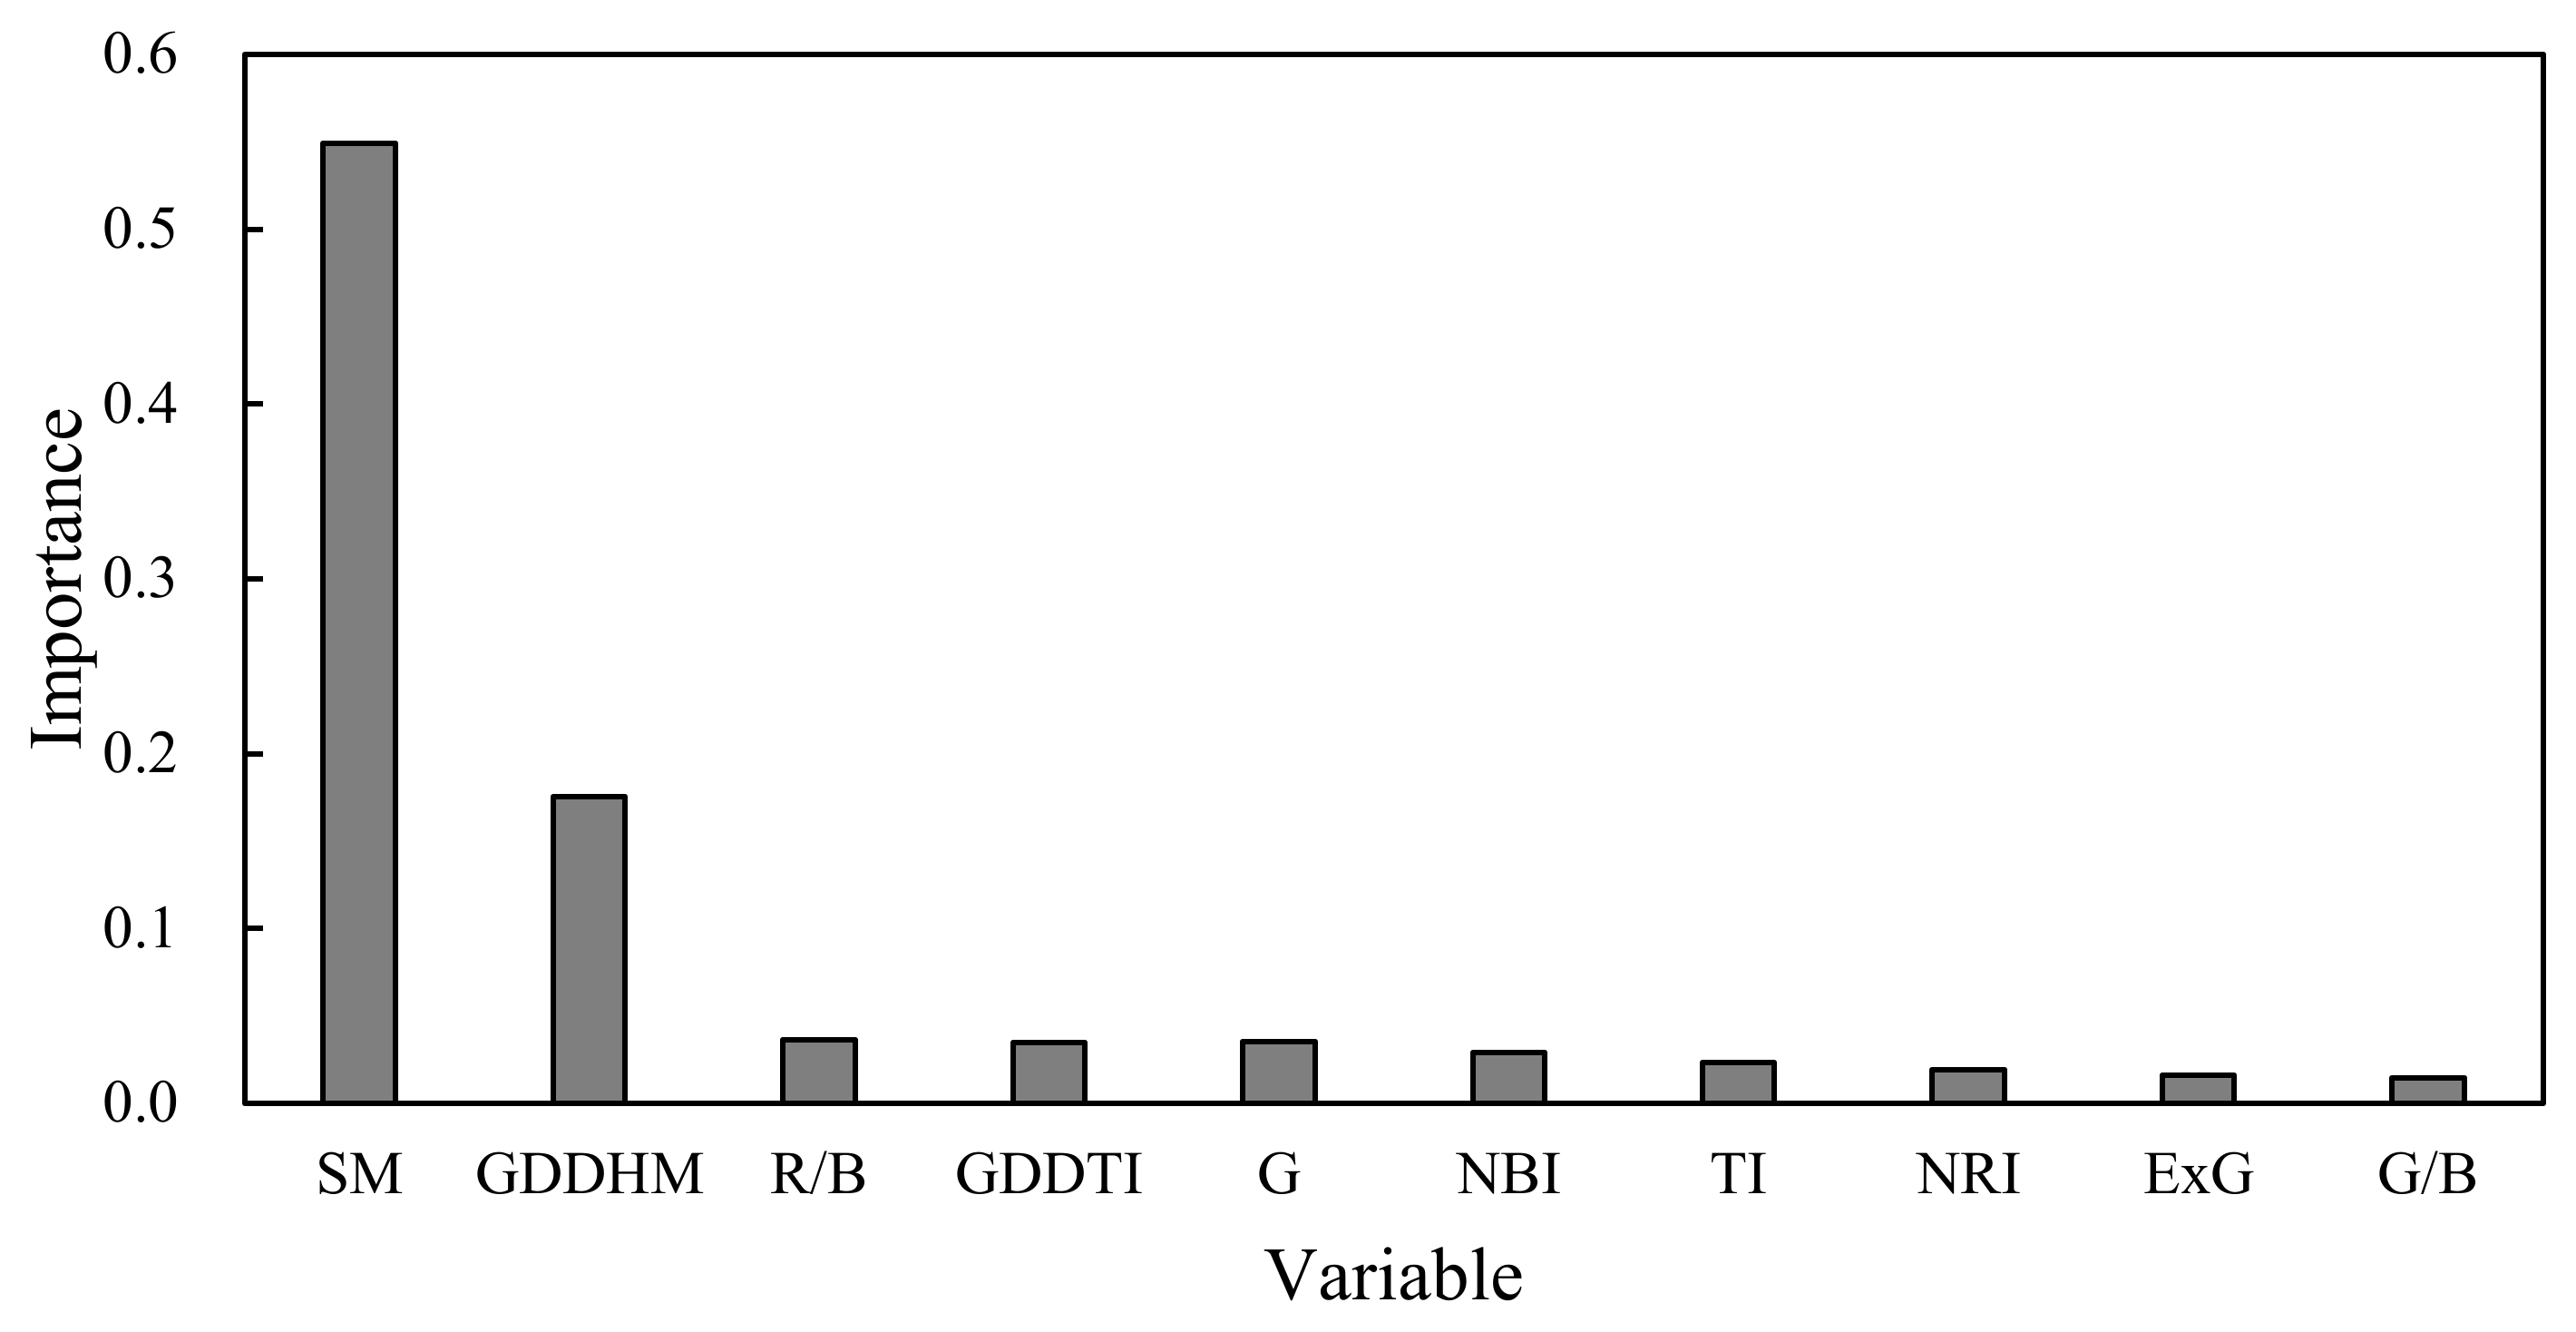
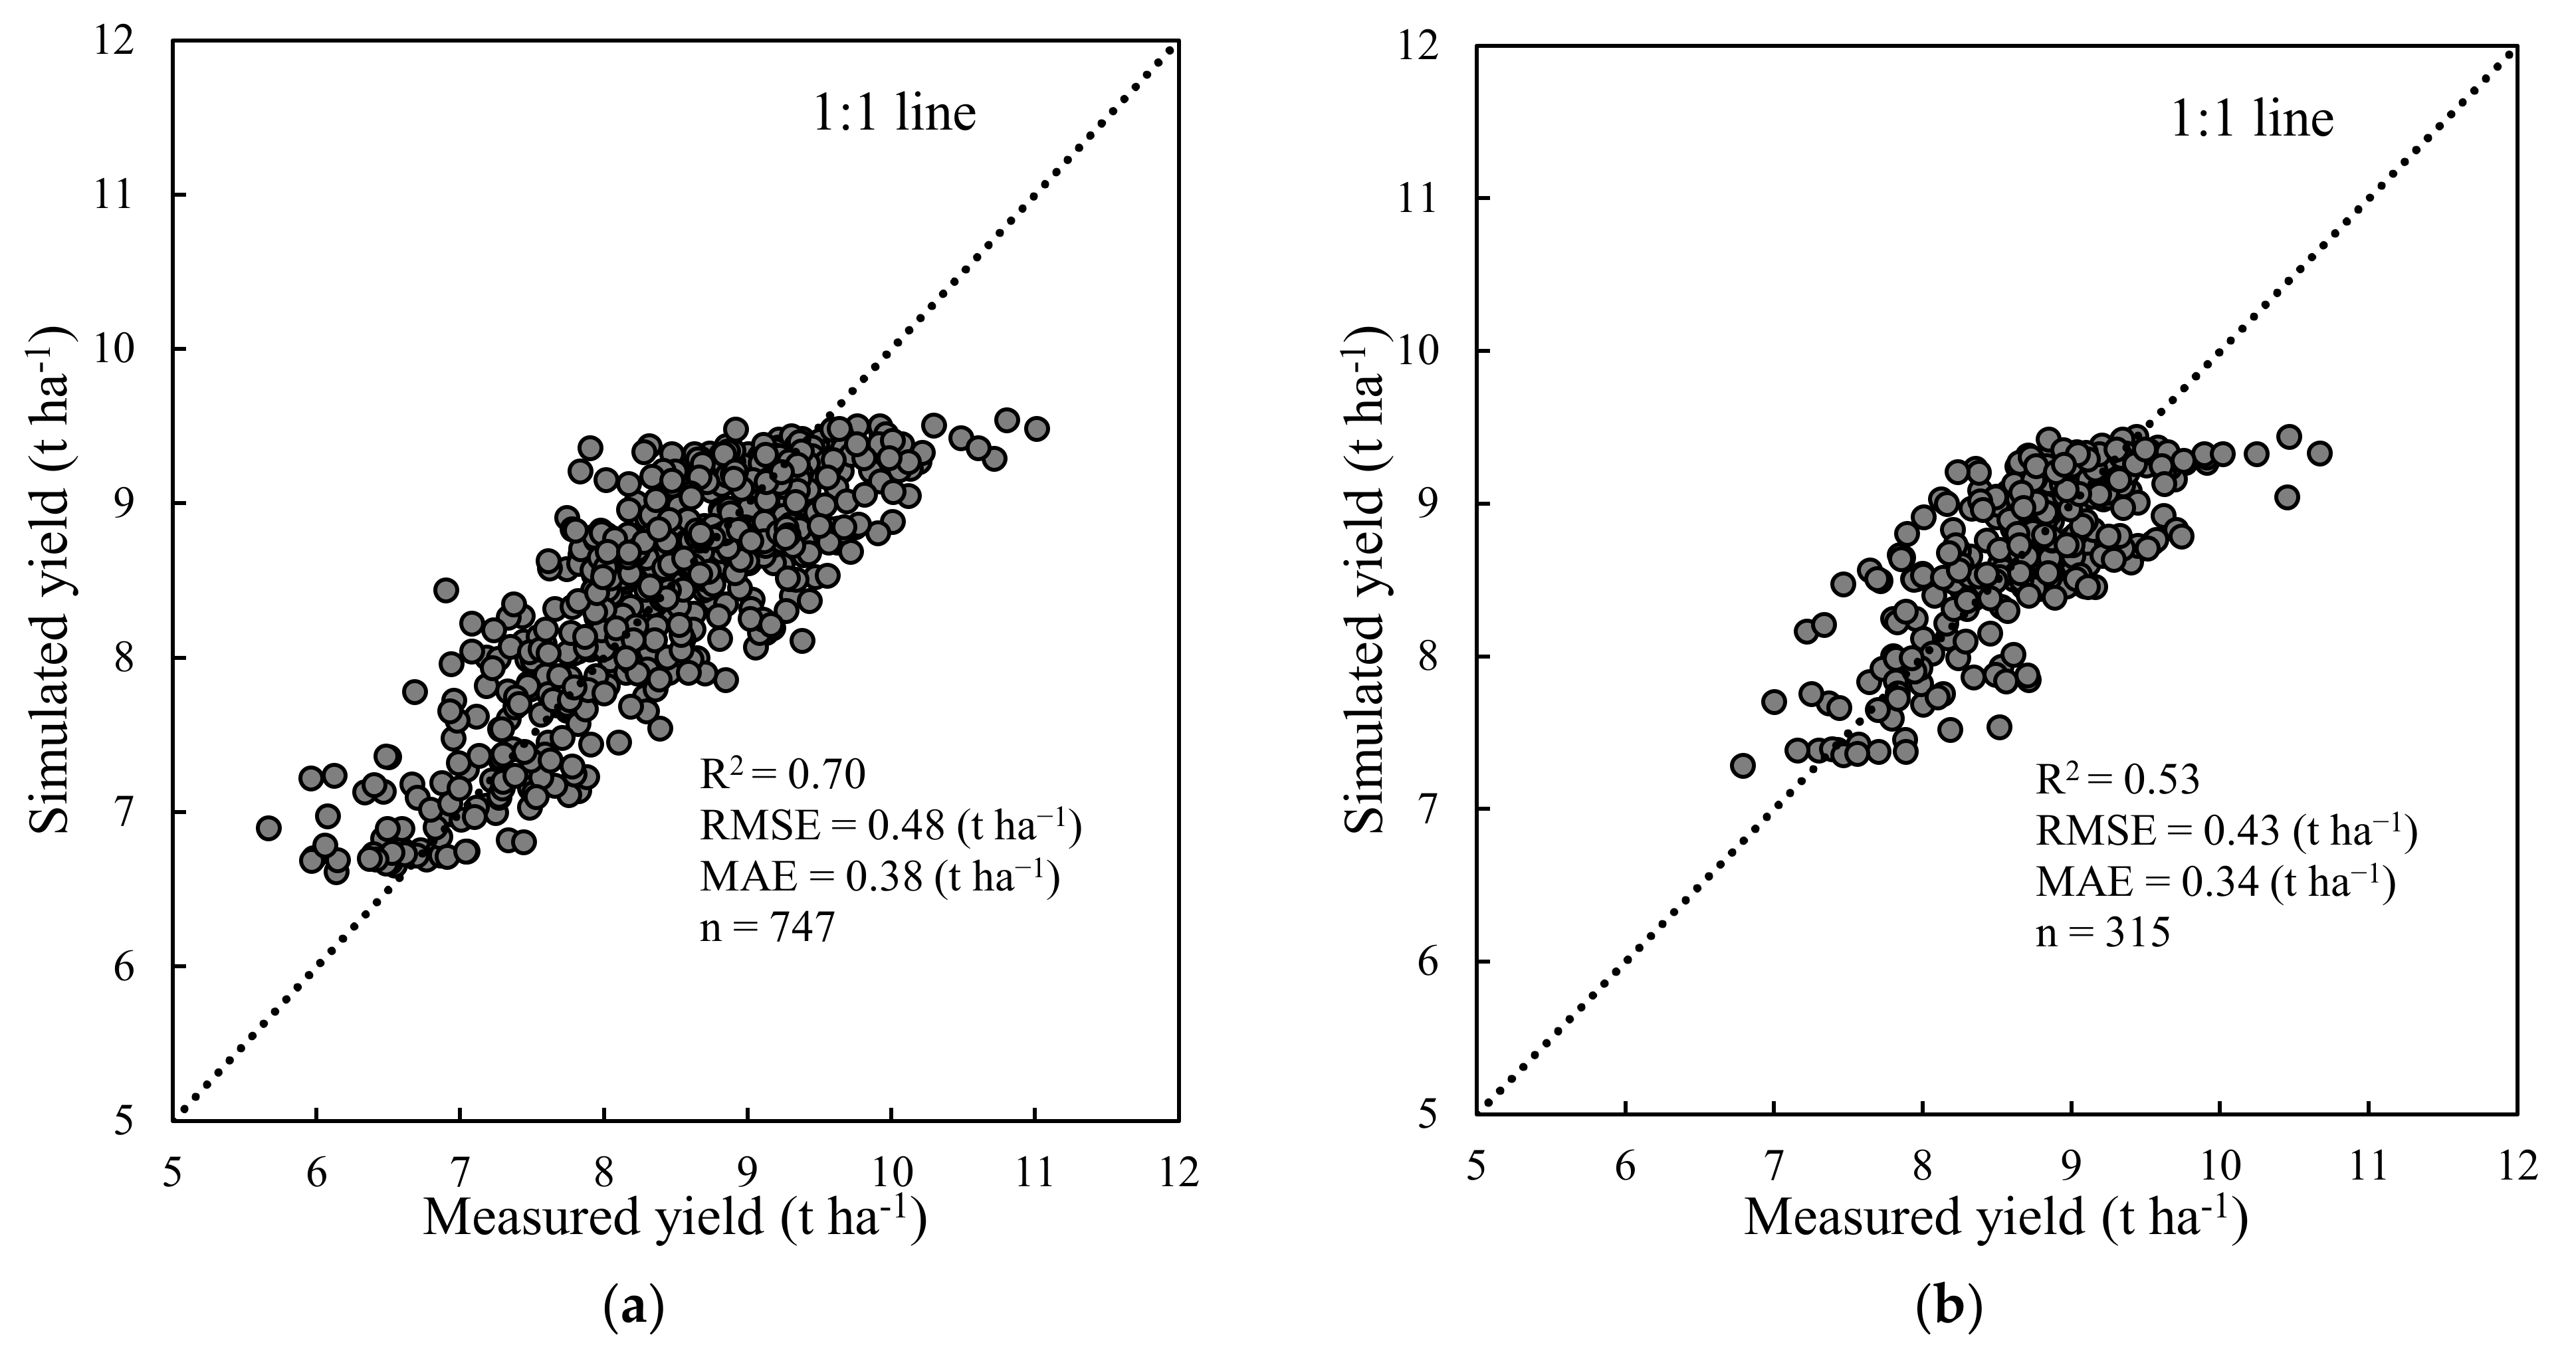
3.3. RF Method for Yield Estimation
3.4. CERES-Rice Model for Yield Estimation
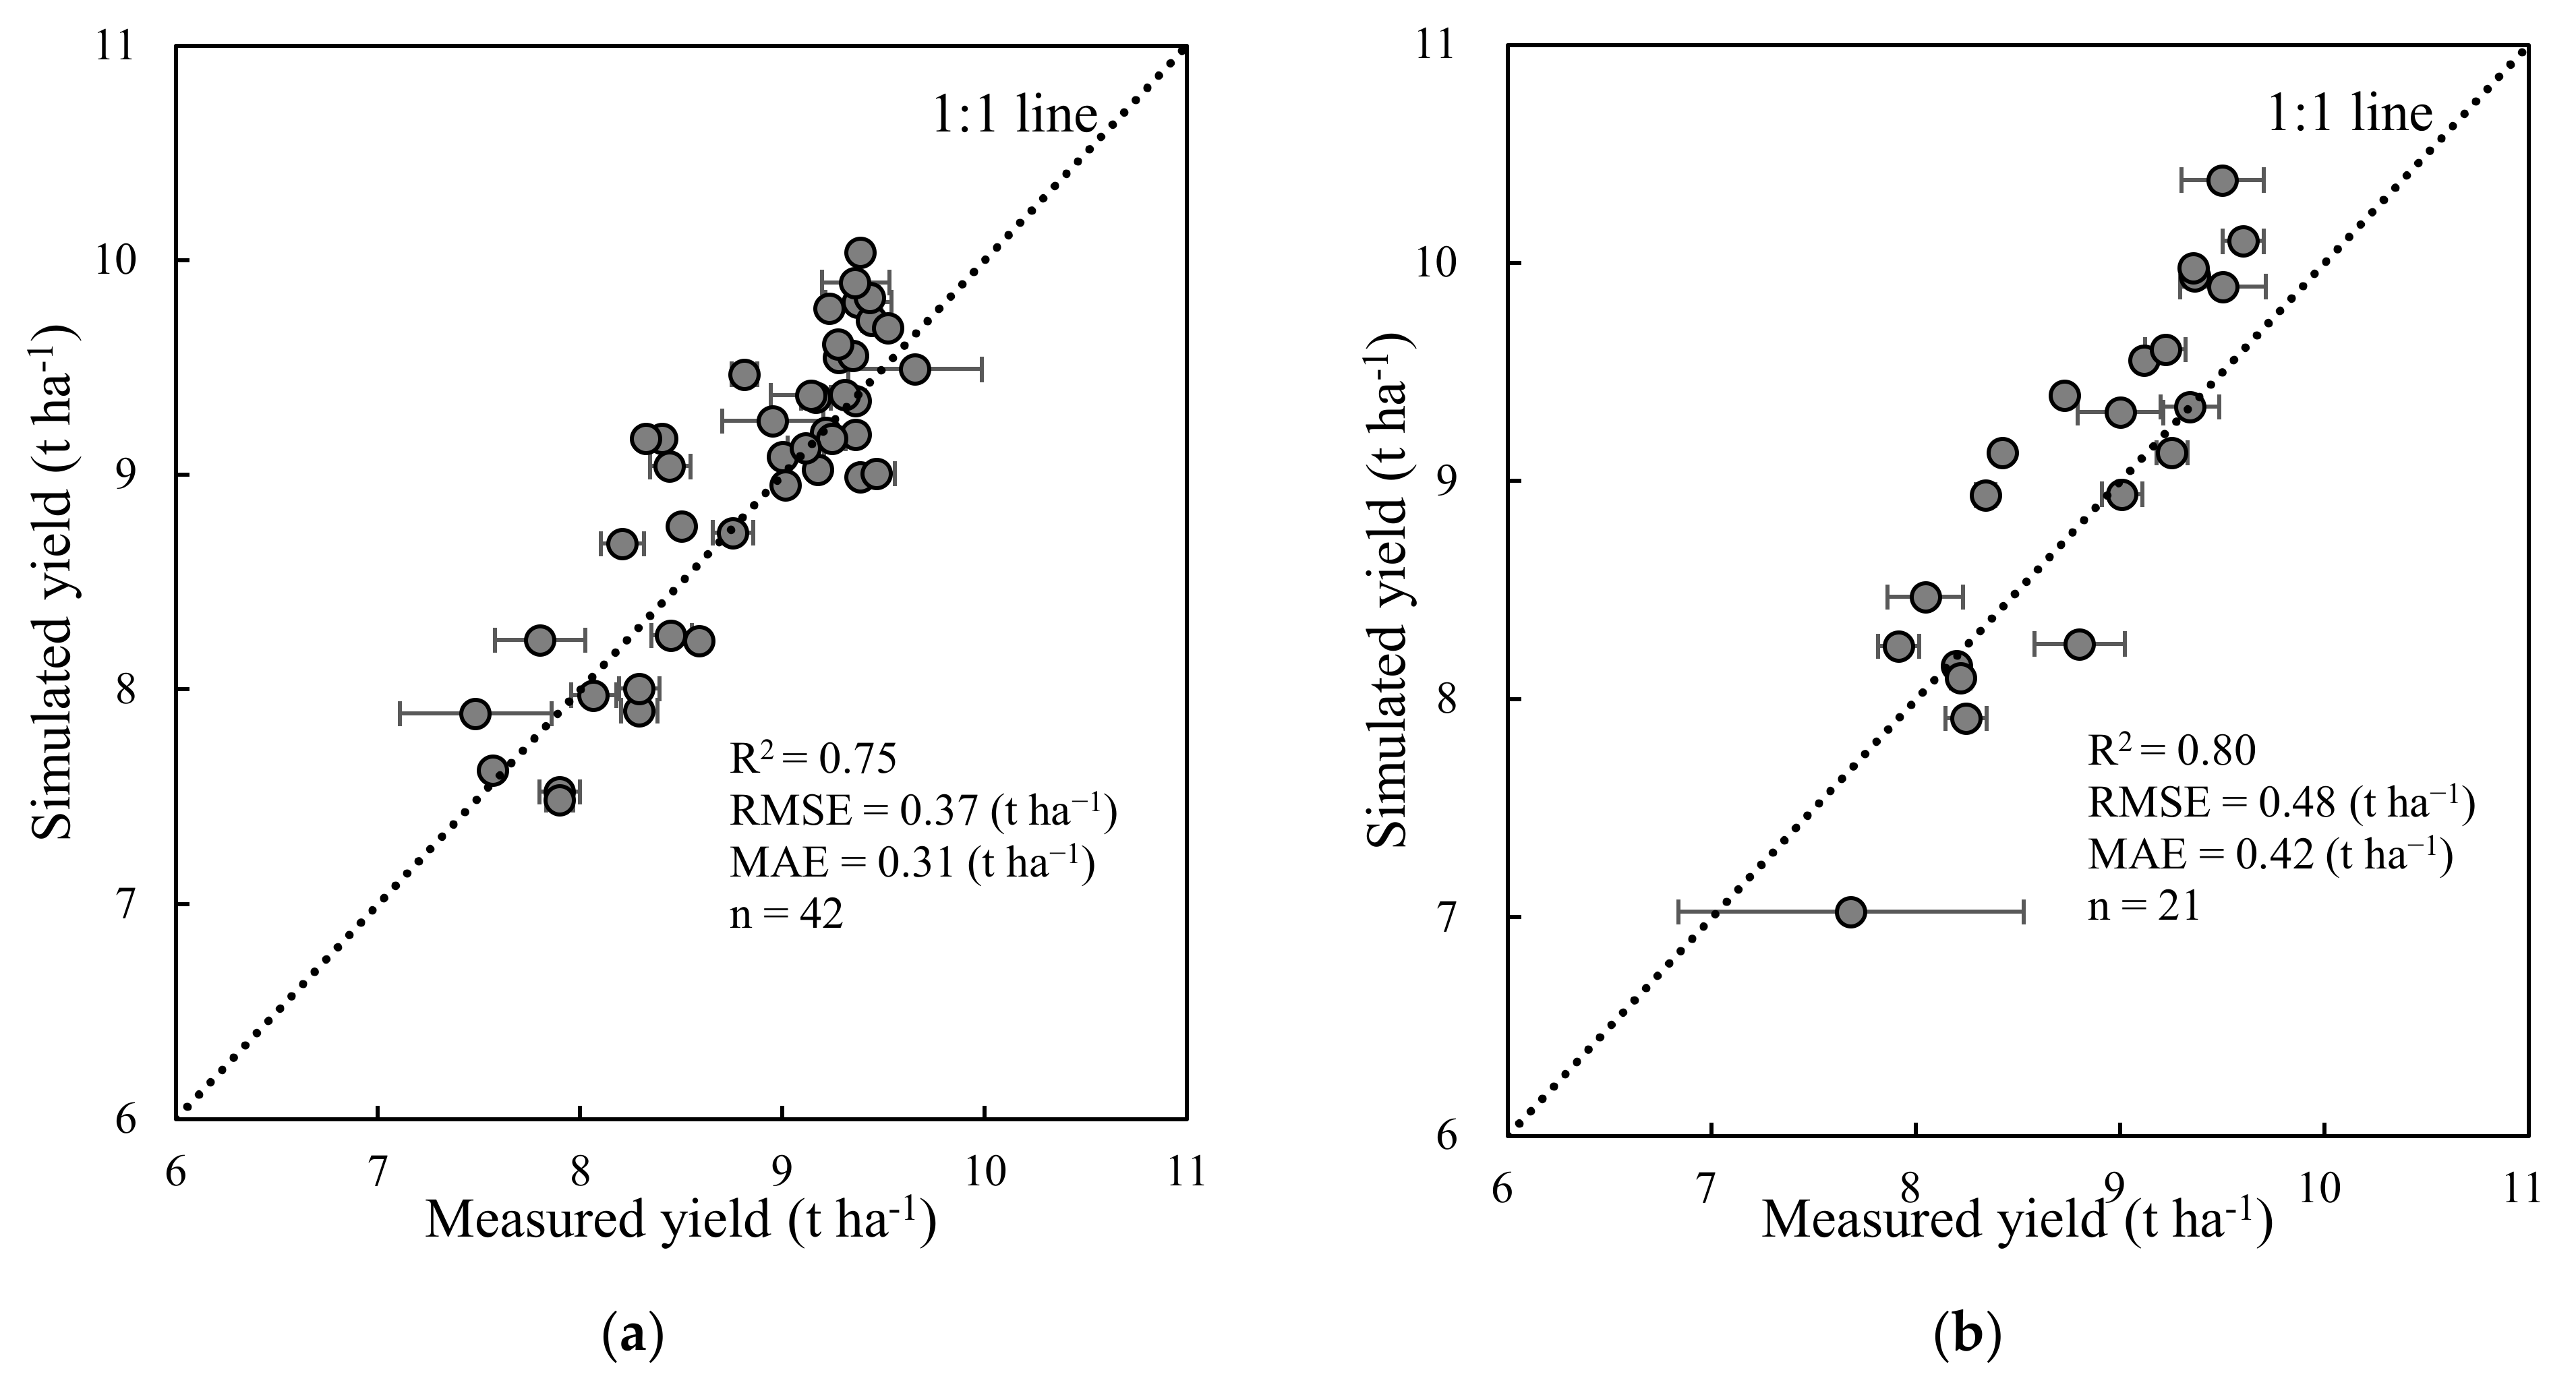
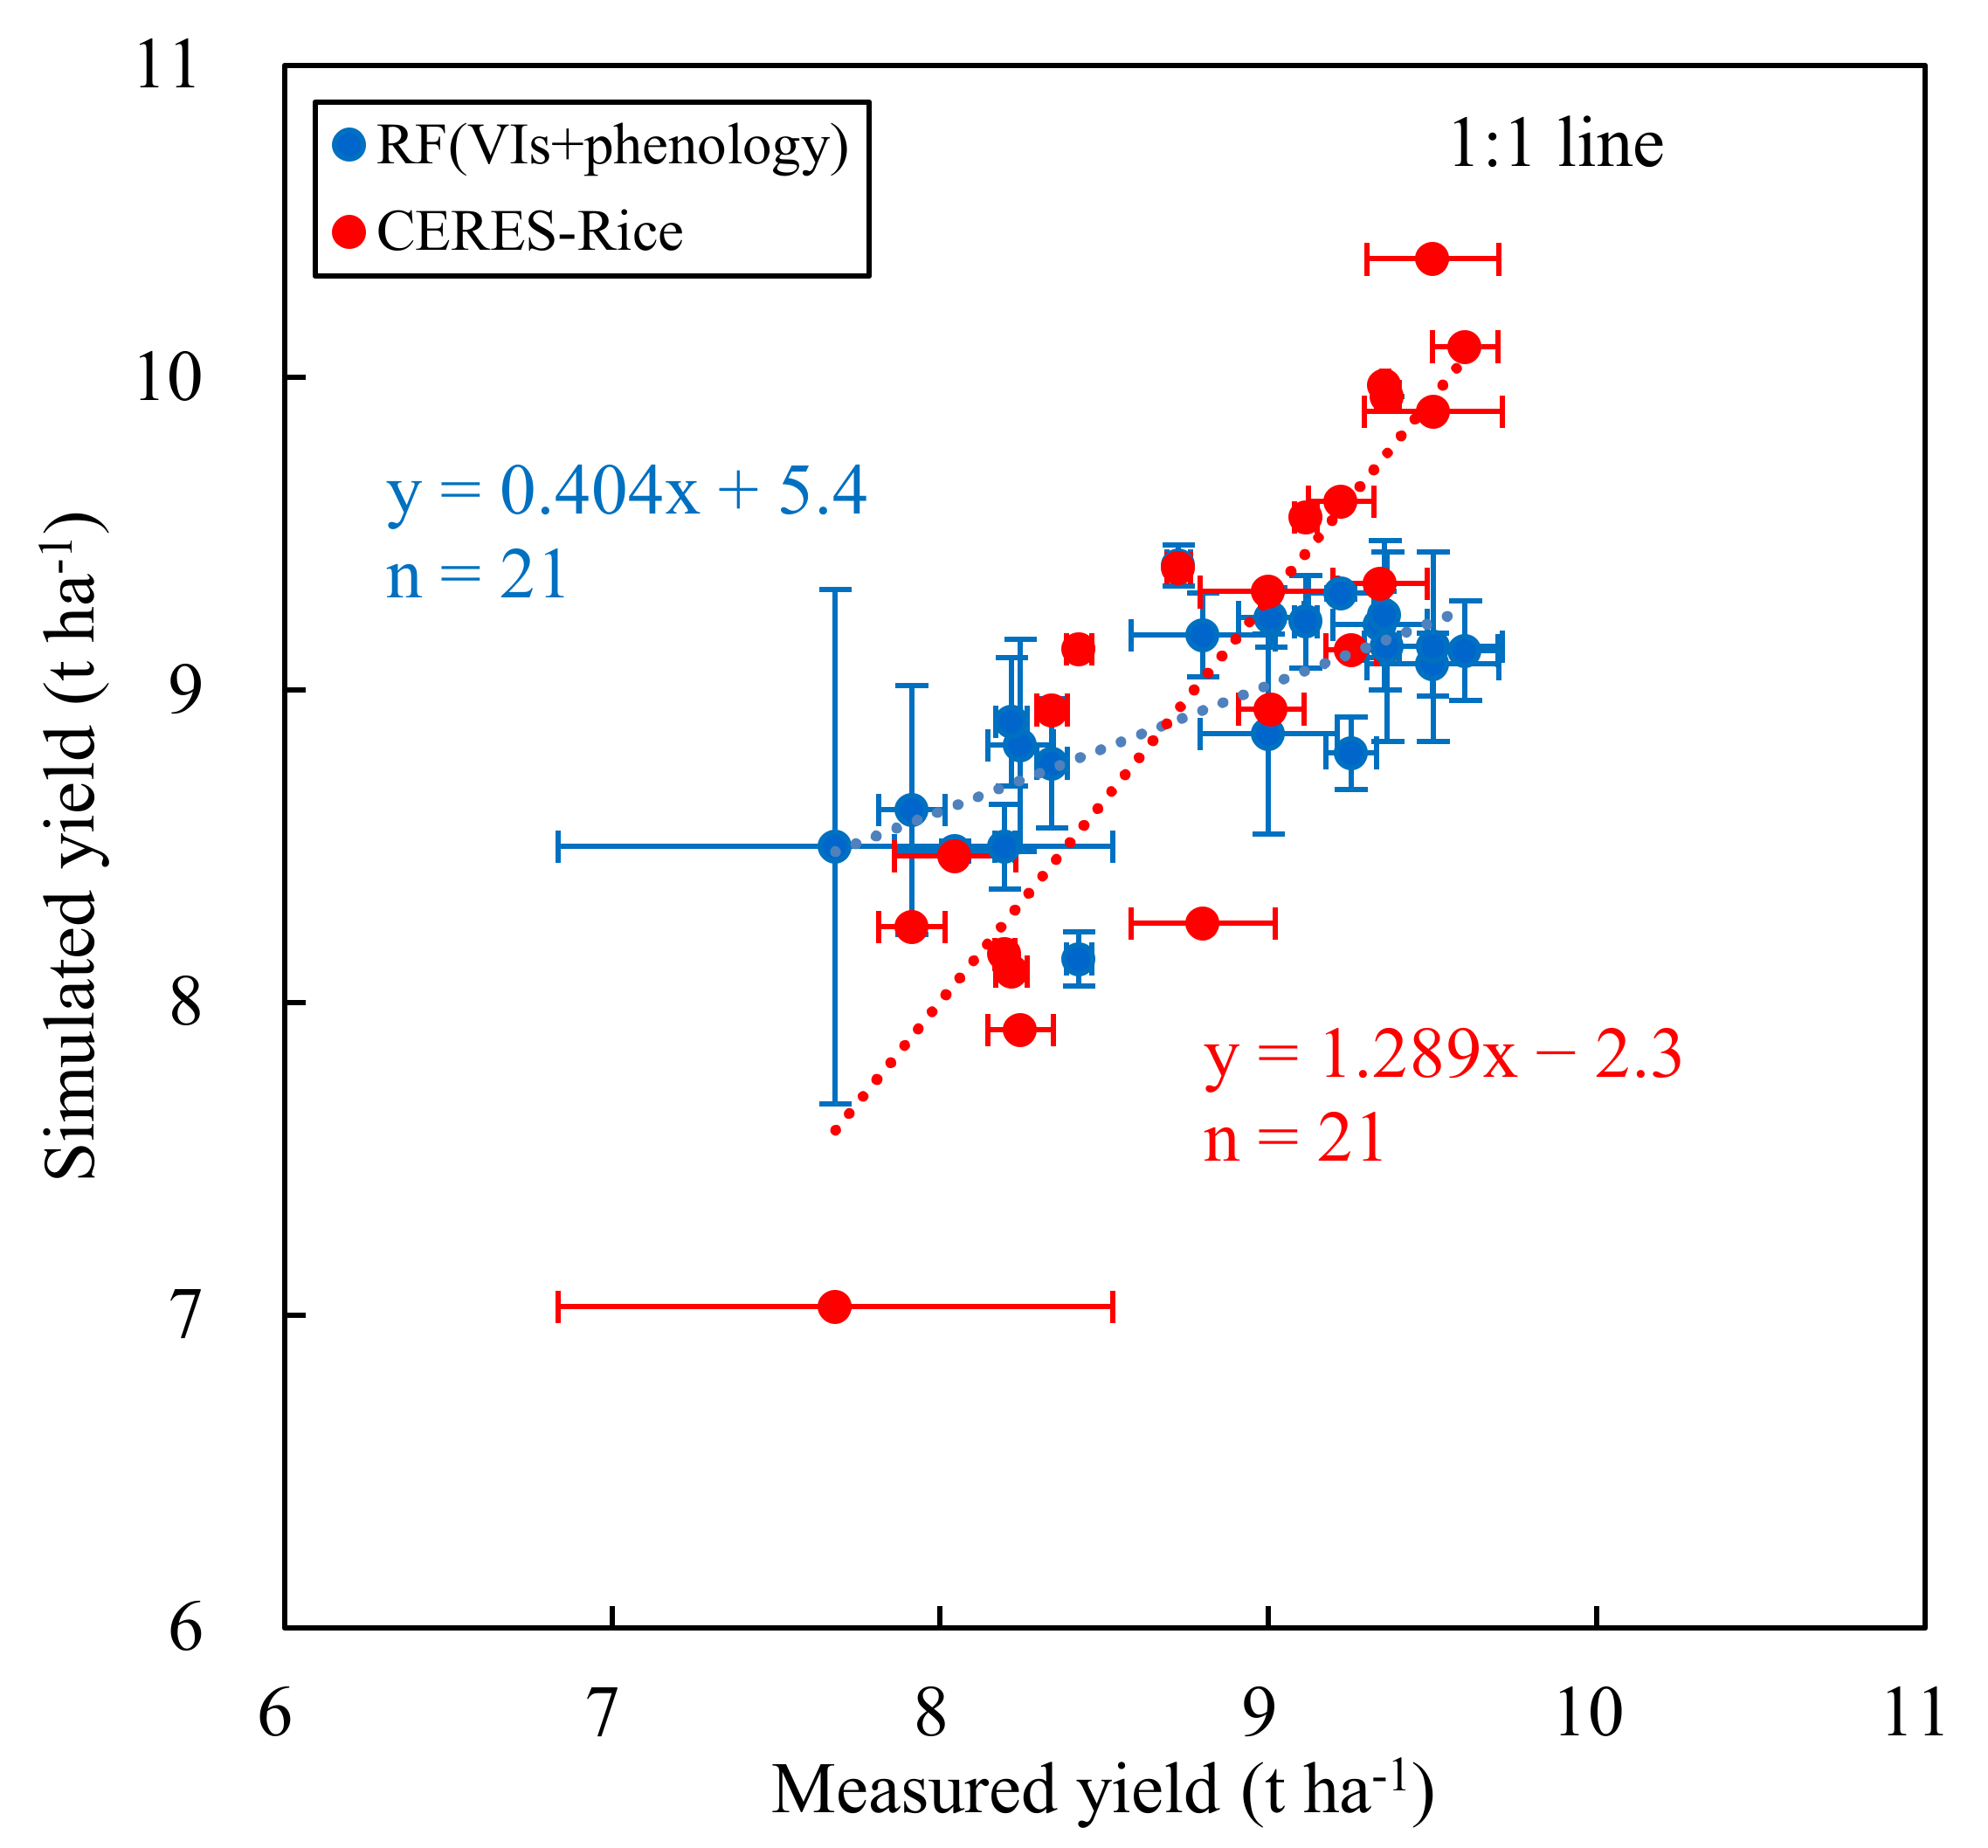
3.5. Performance Comparison between CERES-Rice Model and the Optimal RF Model
4. Discussion
4.1. Response of Phenology to Yield
4.2. Importance of Phenology to RF Model Formulation
4.3. Comparison between RF and CERES-Rice Models
5. Conclusions
Author Contributions
Funding
Data Availability Statement
Acknowledgments
Conflicts of Interest
Appendix A

| Year | Plots | Cultivars | Initial Heading Date | Full Heading Date | Maturity Date |
|---|---|---|---|---|---|
| 2017 | 366 | 122 | August 25–September 15 | August 31–September 19 | October 8–December 2 |
| 2018 | 381 | 127 | August 19–September 5 | August 23–September 9 | October 5–October 17 |
| 2019 | 315 | 105 | August 15–September 3 | August 20–September 8 | October 1–October 28 |
| Descriptive Statistics | Duration length (d) | Growth Degree Days (°C) | ||||||||
|---|---|---|---|---|---|---|---|---|---|---|
| ST | TI | IH | HM | SM | GDDST | GDDTI | GDDIH | GDDHM | GDDSM | |
| Min | 19 | 47 | 3 | 34 | 117 | 358 | 990 | 59 | 412 | 2061 |
| Max | 32 | 68 | 7 | 56 | 148 | 521 | 1412 | 140 | 720 | 2329 |
| Mean | 24.03 | 58.99 | 4.55 | 42.83 | 130.40 | 419.64 | 1211.13 | 97.10 | 560.11 | 2233 |
| SD | 5.76 | 3.91 | 0.55 | 3.44 | 7.08 | 72.55 | 77.03 | 17.69 | 62.45 | 35.86 |
| CV (%) | 23.96 | 6.63 | 12.16 | 8.02 | 5.43 | 17.29 | 6.36 | 18.22 | 11.15 | 1.61 |
| Cultivar Name | P1 | P2R | P5 | P2O | G1 | G2 | G3 | G4 |
|---|---|---|---|---|---|---|---|---|
| 5960You058 | 665 | 285.7 | 518.1 | 12.72 | 51.81 | 0.026 | 1.187 | 0.954 |
| CLY343 | 706.2 | 190.6 | 445.2 | 11.96 | 51.32 | 0.022 | 1.231 | 0.991 |
| R534 | 591.1 | 169 | 491.2 | 11.11 | 51.73 | 0.022 | 1.079 | 1.001 |
| HYY605 | 612.9 | 221.6 | 491.7 | 12.78 | 67.41 | 0.025 | 1.134 | 0.943 |
| HLY2035 | 275 | 278.2 | 422.7 | 11.27 | 55.6 | 0.021 | 1.265 | 0.8 |
| HLY3748 | 288.6 | 227.1 | 483.2 | 11.44 | 66.58 | 0.02 | 1.245 | 0.878 |
| HLY5035 | 565.7 | 249.5 | 432.4 | 12.09 | 58.46 | 0.022 | 1.239 | 1.019 |
| HLY7155 | 487.7 | 243.4 | 531.7 | 13.11 | 66.84 | 0.025 | 0.793 | 0.988 |
| HLY8210 | 418.9 | 259.5 | 483.3 | 13.57 | 73.89 | 0.025 | 0.729 | 1.059 |
| JLY1678 | 395.4 | 95.5 | 689.1 | 9.62 | 71.17 | 0.025 | 0.866 | 1.032 |
| JLY2626 | 395.4 | 75.1 | 454 | 7.544 | 66.38 | 0.024 | 1.257 | 1.043 |
| JLY9936 | 395.4 | 182.4 | 643.1 | 11.91 | 59.47 | 0.03 | 0.851 | 0.974 |
| LFY905 | 601.3 | 98.76 | 465.1 | 10.33 | 60.05 | 0.022 | 1.106 | 1.057 |
| LJY8246 | 555.8 | 130 | 409.9 | 10.05 | 50.04 | 0.024 | 0.85 | 1.006 |
| LLY3748 | 395.4 | 283.7 | 461.8 | 12.35 | 61.62 | 0.024 | 0.841 | 1.039 |
| LLY5809 | 395.4 | 76.56 | 450 | 7.133 | 59.89 | 0.025 | 1.263 | 1.077 |
| RLY1019 | 417.5 | 142.8 | 520 | 10.5 | 55.55 | 0.03 | 1.097 | 0.88 |
| WLY6018 | 395.4 | 60 | 472.7 | 3 | 71.52 | 0.025 | 1.196 | 0.957 |
| XLY7629 | 395.4 | 86.07 | 506.5 | 9.049 | 52.11 | 0.03 | 0.955 | 1.045 |
| XLY8736 | 395.4 | 330 | 550 | 12.94 | 61.46 | 0.03 | 1.244 | 0.907 |
| YLY526 | 601.3 | 193.2 | 450 | 11.52 | 55.44 | 0.024 | 0.966 | 0.898 |
| Year | ST | TI | IH | HM | SM | ||||||||||
|---|---|---|---|---|---|---|---|---|---|---|---|---|---|---|---|
| 2017 | 23.4 | 29.2 | 26.3 | 26.6 | 33.8 | 30.2 | 22.1 | 26.8 | 24.5 | 19.3 | 25.7 | 22.5 | 23.4 | 30.0 | 26.7 |
| 2018 | 24.8 | 32.7 | 28.8 | 26.7 | 34.5 | 30.6 | 25.4 | 30.7 | 28.0 | 20.6 | 28.0 | 24.3 | 24.3 | 32 | 28.1 |
| 2019 | 23.0 | 30.1 | 26.5 | 26.4 | 34.4 | 30.4 | 25.2 | 30.8 | 28.0 | 20.4 | 27 | 23.7 | 23.7 | 31.1 | 27.4 |

References
- Son, N.T.; Chen, C.F.; Chen, C.R.; Minh, V.Q.; Trung, N.H. A comparative analysis of multitemporal MODIS EVI and NDVI data for large-scale rice yield estimation. Agric. For. Meteorol. 2014, 197, 52–64. [Google Scholar] [CrossRef]
- Bastiaanssen, W.G.M.; Ali, S. A new crop yield forecasting model based on satellite measurements applied across the Indus Basin, Pakistan. Agric. Ecosyst. Environ. 2003, 94, 321–340. [Google Scholar] [CrossRef]
- Reynolds, C.A.; Yitayew, M.; Slack, D.C.; Hutchinson, C.F.; Huete, A.; Petersen, M.S. Estimating crop yields and production by integrating the FAO Crop specific Water Balance model with real-time satellite data and ground-based ancillary data. Int. J. Remote Sens. 2000, 21, 3487–3508. [Google Scholar] [CrossRef]
- Sakamoto, T.; Gitelson, A.A.; Arkebauer, T.J. MODIS-based corn grain yield estimation model incorporating crop phenology information. Remote Sens. Environ. 2013, 131, 215–231. [Google Scholar] [CrossRef]
- Inoue, Y.; Sakaiya, E.; Zhu, Y.; Takahashi, W. Diagnostic mapping of canopy nitrogen content in rice based on hyperspectral measurements. Remote Sens. Environ. 2012, 126, 210–221. [Google Scholar] [CrossRef]
- Yonezawa, C.; Negishi, M.; Azuma, K.; Watanabe, M.; Ishitsuka, N.; Ogawa, S.; Saito, G. Growth monitoring and classification of rice fields using multitemporal RADARSAT-2 full-polarimetric data. Int. J. Remote Sens. 2012, 33, 5696–5711. [Google Scholar] [CrossRef]
- Kern, A.; Barcza, Z.; Marjanovic, H.; Arendas, T.; Fodor, N.; Bonis, P.; Bognar, P.; Lichtenberger, J. Statistical modelling of crop yield in Central Europe using climate data and remote sensing vegetation indices. Agric. For. Meteorol. 2018, 260, 300–320. [Google Scholar] [CrossRef]
- Zhang, C.; Kovacs, J.M. The application of small unmanned aerial systems for precision agriculture: A review. Precis. Agric. 2012, 13, 693–712. [Google Scholar] [CrossRef]
- Zheng, H.; Cheng, T.; Li, D.; Zhou, X.; Yao, X.; Tian, Y.; Cao, W.; Zhu, Y. Evaluation of RGB, Color-Infrared and Multispectral Images Acquired from Unmanned Aerial Systems for the Estimation of Nitrogen Accumulation in Rice. Remote Sens. 2018, 10, 824. [Google Scholar] [CrossRef] [Green Version]
- Koppe, W.; Gnyp, M.L.; Hennig, S.D.; Li, F.; Miao, Y.; Chen, X.; Jia, L.; Bareth, G. Multi-Temporal Hyperspectral and Radar Remote Sensing for Estimating Winter Wheat Biomass in the North China Plain. Photogramm. Fernerkund. Geoinf. 2012, 3, 281–298. [Google Scholar] [CrossRef]
- Jin, X.; Yang, G.; Xu, X.; Yang, H.; Feng, H.; Li, Z.; Shen, J.; Zhao, C.; Lan, Y. Combined Multi-Temporal Optical and Radar Parameters for Estimating LAI and Biomass in Winter Wheat Using HJ and RADARSAR-2 Data. Remote Sens. 2015, 7, 13251–13272. [Google Scholar] [CrossRef] [Green Version]
- Peng, Y.; Zhu, T.e.; Li, Y.; Dai, C.; Fang, S.; Gong, Y.; Wu, X.; Zhu, R.; Liu, K. Remote prediction of yield based on LAI estimation in oilseed rape under different planting methods and nitrogen fertilizer applications. Agric. For. Meteorol. 2019, 271, 116–125. [Google Scholar] [CrossRef]
- Palosuo, T.; Kersebaum, K.C.; Angulo, C.; Hlavinka, P.; Moriondo, M.; Olesen, J.E.; Patil, R.H.; Ruget, F.; Rumbaur, C.; Takac, J.; et al. Simulation of winter wheat yield and its variability in different climates of Europe: A comparison of eight crop growth models. Eur. J. Agron. 2011, 35, 103–114. [Google Scholar] [CrossRef] [Green Version]
- Katerji, N.; Campi, P.; Mastrorilli, M. Productivity, evapotranspiration, and water use efficiency of corn and tomato crops simulated by AquaCrop under contrasting water stress conditions in the Mediterranean region. Agric. Water Manag. 2013, 130, 14–26. [Google Scholar] [CrossRef]
- Wang, X.; Liu, G.; Yang, J.; Huang, G.; Yao, R. Evaluating the effects of irrigation water salinity on water movement, crop yield and water use efficiency by means of a coupled hydrologic/crop growth model. Agric. Water Manag. 2017, 185, 13–26. [Google Scholar] [CrossRef]
- Bai, H.; Tao, F. Sustainable intensification options to improve yield potential and ecoefficiency for rice-wheat rotation system in China. Field Crops Res. 2017, 211, 89–105. [Google Scholar] [CrossRef]
- Jin, X.; Kumar, L.; Li, Z.; Feng, H.; Xu, X.; Yang, G.; Wang, J. A review of data assimilation of remote sensing and crop models. Eur. J. Agron. 2018, 92, 141–152. [Google Scholar] [CrossRef]
- Devkota, K.P.; Hoogenboom, G.; Boote, K.J.; Singh, U.; Lamers, J.P.A.; Devkota, M.; Vlek, P.L.G. Simulating the impact of water saving irrigation and conservation agriculture practices for rice-wheat systems in the irrigated semi-arid drylands of Central Asia. Agric. For. Meteorol. 2015, 214, 266–280. [Google Scholar] [CrossRef]
- Zhang, J.; Miao, Y.; Batchelor, W.D.; Lu, J.; Wang, H.; Kang, S. Improving High-Latitude Rice Nitrogen Management with the CERES-Rice Crop Model. Agronomy 2018, 8, 263. [Google Scholar] [CrossRef] [Green Version]
- Cheyglinted, S.; Ranamukhaarachchi, S.L.; Singh, G. Assessment of the CERES-Rice model for rice production in the Central Plain of Thailand. J. Agric. Sci. 2001, 137, 289–298. [Google Scholar] [CrossRef]
- Shamim, M.; Shekh, A.M.; Pandey, V.; Patel, H.R.; Lunagaria, M.M. Simulating the phenology, growth and yield of aromatic rice cultivars using CERES-Rice model under different environments. J. Agrometeorol. 2012, 14, 31–34. [Google Scholar]
- Amiri, E.; Rezaei, M.; Rezaei, E.E.; Bannayan, M. Evaluation of Ceres-Rice, Aquacrop and Oryza2000 Models in Simulation of Rice Yield Response to Different Irrigation and Nitrogen Management Strategies. J. Plant Nutr. 2014, 37, 1749–1769. [Google Scholar] [CrossRef]
- Yeom, J.; Jung, J.; Chang, A.; Maeda, M.; Landivar, J. Automated Open Cotton Boll Detection for Yield Estimation Using Unmanned Aircraft Vehicle (UAV) Data. Remote Sens. 2018, 10, 1895. [Google Scholar] [CrossRef] [Green Version]
- Fu, Z.; Jiang, J.; Gao, Y.; Krienke, B.; Wang, M.; Zhong, K.; Cao, Q.; Tian, Y.; Zhu, Y.; Cao, W.; et al. Wheat Growth Monitoring and Yield Estimation based on Multi-Rotor Unmanned Aerial Vehicle. Remote Sens. 2020, 12, 508. [Google Scholar] [CrossRef] [Green Version]
- Zhang, M.; Zhou, J.; Sudduth, K.A.; Kitchen, N.R. Estimation of maize yield and effects of variable-rate nitrogen application using UAV-based RGB imagery. Biosyst. Eng. 2020, 189, 24–35. [Google Scholar] [CrossRef]
- Feng, A.; Zhou, J.; Vories, E.D.; Sudduth, K.A.; Zhang, M. Yield estimation in cotton using UAV-based multi-sensor imagery. Biosyst. Eng. 2020, 193, 101–114. [Google Scholar] [CrossRef]
- Yang, Q.; Shi, L.; Han, J.; Zha, Y.; Zhu, P. Deep convolutional neural networks for rice grain yield estimation at the ripening stage using UAV-based remotely sensed images. Field Crops Res. 2019, 235, 142–153. [Google Scholar] [CrossRef]
- Geipel, J.; Link, J.; Claupein, W. Combined Spectral and Spatial Modeling of Corn Yield Based on Aerial Images and Crop Surface Models Acquired with an Unmanned Aircraft System. Remote Sens. 2014, 6, 10335–10355. [Google Scholar] [CrossRef] [Green Version]
- Agueera Vega, F.; Carvajal Ramirez, F.; Perez Saiz, M.; Orgaz Rosua, F. Multi-temporal imaging using an unmanned aerial vehicle for monitoring a sunflower crop. Biosyst. Eng. 2015, 132, 19–27. [Google Scholar] [CrossRef]
- Sanches, G.M.; Duft, D.G.; Kolln, O.T.; dos Santos Luciano, A.C.; Quassi De Castro, S.G.; Okuno, F.M.; Junqueira Franco, H.C. The potential for RGB images obtained using unmanned aerial vehicle to assess and predict yield in sugarcane fields. Int. J. Remote Sens. 2018, 39, 5402–5414. [Google Scholar] [CrossRef]
- Justin, J.R.; Fehr, W.R. Principles of cultivar development. v. 1. Theory and technique—v. 2. Crop species. Soil Sci. 1987, 145, 390. [Google Scholar] [CrossRef] [Green Version]
- Zhou, J.; Zhou, J.; Ye, H.; Ali, M.L.; Chen, P.; Nguyen, H.T. Yield estimation of soybean breeding lines under drought stress using unmanned aerial vehicle-based imagery and convolutional neural network. Biosyst. Eng. 2021, 204, 90–103. [Google Scholar] [CrossRef]
- Ashapure, A.; Oh, S.; Marconi, T.G.; Chang, A.; Enciso, J. Unmanned aerial system based tomato yield estimation using machine learning. In Proceedings of the Autonomous Air and Ground Sensing Systems for Agricultural Optimization and Phenotyping IV, Baltimore, MD, USA, 15–16 April 2019. [Google Scholar]
- Katsura, K.; Maeda, S.; Lubis, I.; Horie, T.; Cao, W.; Shiraiwa, T. The high yield of irrigated rice in Yunnan, China—‘A cross-location analysis’. Field Crops Res. 2008, 107, 1–11. [Google Scholar] [CrossRef]
- Cen, H.; Wan, L.; Zhu, J.; Li, Y.; Li, X.; Zhu, Y.; Weng, H.; Wu, W.; Yin, W.; Xu, C.; et al. Dynamic monitoring of biomass of rice under different nitrogen treatments using a lightweight UAV with dual image-frame snapshot cameras. Plant Methods 2019, 15, 32. [Google Scholar] [CrossRef]
- Wan, L.; Cen, H.; Zhu, J.; Zhang, J.; Zhu, Y.; Sun, D.; Du, X.; Zhai, L.; Weng, H.; Li, Y.; et al. Grain yield prediction of rice using multi-temporal UAV-based RGB and multispectral images and model transfer—A case study of small farmlands in the South of China. Agric. For. Meteorol. 2020, 291, 108096. [Google Scholar] [CrossRef]
- Sun, J.; Yang, J.; Shi, S.; Chen, B.; Du, L.; Gong, W.; Song, S. Estimating Rice Leaf Nitrogen Concentration: Influence of Regression Algorithms Based on Passive and Active Leaf Reflectance. Remote Sens. 2017, 9, 951. [Google Scholar] [CrossRef] [Green Version]
- Fageria, N.K. Yield physiology of rice. J. Plant Nutr. 2007, 30, 843–879. [Google Scholar] [CrossRef]
- Su, L.; Liu, Y.; Wang, Q. Rice growth model in China based on growing degree days. Trans. Chin. Soc. Agric. Eng. 2020, 36, 162–174. [Google Scholar]
- Natarajan, S.; Basnayake, J.; Wei, X.; Lakshmanan, P. High-Throughput Phenotyping of Indirect Traits for Early-Stage Selection in Sugarcane Breeding. Remote Sens. 2019, 11, 2952. [Google Scholar] [CrossRef] [Green Version]
- Liu, K.; Li, Y.; Han, T.; Yu, X.; Ye, H.; Hu, H.; Hu, Z. Evaluation of grain yield based on digital images of rice canopy. Plant Methods 2019, 15, 28. [Google Scholar] [CrossRef] [PubMed]
- Woebbecke, D.M.; Meyer, G.E.; Vonbargen, K.; Mortensen, D.A. Color Indices for Weed Identification Under Various Soil, Residue, and Lighting Conditions. Trans. ASAE 1995, 38, 259–269. [Google Scholar] [CrossRef]
- Meyer, G.E.; Neto, J.C. Verification of color vegetation indices for automated crop imaging applications. Comput. Electron. Agric. 2008, 63, 282–293. [Google Scholar] [CrossRef]
- Maimaitijiang, M.; Sagan, V.; Sidike, P.; Maimaitiyiming, M.; Hartling, S.; Peterson, K.T.; Maw, M.J.W.; Shakoor, N.; Mockler, T.; Fritschi, F.B. Vegetation Index Weighted Canopy Volume Model (CVMVI) for soybean biomass estimation from Unmanned Aerial System-based RGB imagery. ISPRS J. Photogramm. Remote Sens. 2019, 151, 27–41. [Google Scholar] [CrossRef]
- Wang, Y.; Wang, D.; Zhang, G.; Wang, J. Estimating nitrogen status of rice using the image segmentation of G-R thresholding method. Field Crops Res. 2013, 149, 33–39. [Google Scholar] [CrossRef]
- Ahmad, I.S.; Reid, J.F. Evaluation of colour representations for maize images. J. Agric. Eng. Res. 1996, 63, 185–195. [Google Scholar] [CrossRef]
- Li, Y.; Chen, D.; Walker, C.N.; Angus, J.F. Estimating the nitrogen status of crops using a digital camera. Field Crops Res. 2010, 118, 221–227. [Google Scholar] [CrossRef]
- Breiman, L. Random forests. Mach. Learn. 2001, 45, 5–32. [Google Scholar] [CrossRef] [Green Version]
- Hutengs, C.; Vohland, M. Downscaling land surface temperatures at regional scales with random forest regression. Remote Sens. Environ. 2016, 178, 127–141. [Google Scholar] [CrossRef]
- Bendig, J.; Bolten, A.; Bennertz, S.; Broscheit, J.; Eichfuss, S.; Bareth, G. Estimating Biomass of Barley Using Crop Surface Models (CSMs) Derived from UAV-Based RGB Imaging. Remote Sens. 2014, 6, 10395–10412. [Google Scholar] [CrossRef] [Green Version]
- Yue, J.; Yang, G.; Tian, Q.; Feng, H.; Xu, K.; Zhou, C. Estimate of winter-wheat above-ground biomass based on UAV ultrahigh-ground-resolution image textures and vegetation indices. ISPRS J. Photogramm. Remote Sens. 2019, 150, 226–244. [Google Scholar] [CrossRef]
- Jay, S.; Maupas, F.; Bendoula, R.; Gorretta, N. Retrieving LAI, chlorophyll and nitrogen contents in sugar beet crops from multi-angular optical remote sensing: Comparison of vegetation indices and PROSAIL inversion for field phenotyping. Field Crops Res. 2017, 210, 33–46. [Google Scholar] [CrossRef] [Green Version]
- Reitemeier, R.F. Methods of analysis for soils, plants, and waters. Soil Sci. 1961, 93, 68. [Google Scholar] [CrossRef]
- Mongiano, G.; Titone, P.; Pagnoncelli, S.; Sacco, D.; Tamborini, L.; Pilu, R.; Bregaglio, S. Phenotypic variability in Italian rice germplasm. Eur. J. Agron. 2020, 120, 126131. [Google Scholar] [CrossRef]
- Zhang, S.; Tao, F.; Zhang, Z. Changes in extreme temperatures and their impacts on rice yields in southern China from 1981 to 2009. Field Crops Res. 2016, 189, 43–50. [Google Scholar] [CrossRef] [Green Version]
- Tao, F.; Zhang, S.; Zhang, Z. Changes in rice disasters across China in recent decades and the meteorological and agronomic causes. Reg. Environ. Change 2013, 13, 743–759. [Google Scholar] [CrossRef]
- Xu, L.; Zhan, X.; Yu, T.; Nie, L.; Huang, J.; Cui, K.; Wang, F.; Li, Y.; Peng, S. Yield performance of direct-seeded, double-season rice using varieties with short growth durations in central China. Field Crops Res. 2018, 227, 49–55. [Google Scholar] [CrossRef]
- Chen, J.; Zhang, R.; Cao, F.; Yin, X.; Zou, Y.; Huang, M.; Abou-Elwafa, S.F. Evaluation of Late-Season Short- and Long-Duration Rice Cultivars for Potential Yield under Mechanical Transplanting Conditions. Agronomy 2020, 10, 1307. [Google Scholar] [CrossRef]
- Zhang, T.; Huang, Y.; Yang, X. Climate warming over the past three decades has shortened rice growth duration in China and cultivar shifts have further accelerated the process for late rice. Glob. Change Biol. 2013, 19, 563–570. [Google Scholar] [CrossRef] [PubMed]
- Siebert, S.; Ewert, F. Spatio-temporal patterns of phenological development in Germany in relation to temperature and day length. Agric. For. Meteorol. 2012, 152, 44–57. [Google Scholar] [CrossRef]
- Nagarajan, S.; Jagadish, S.V.K.; Prasad, A.S.H.; Thomar, A.K.; Anand, A.; Pal, M.; Agarwal, P.K. Local climate affects growth, yield and grain quality of aromatic and non-aromatic rice in northwestern India. Agric. Ecosyst. Environ. 2010, 138, 274–281. [Google Scholar] [CrossRef]
- Jagadish, S.V.K.; Septiningsih, E.M.; Kohli, A.; Thomson, M.J.; Ye, C.; Redona, E.; Kumar, A.; Gregorio, G.B.; Wassmann, R.; Ismail, A.M.; et al. Genetic Advances in Adapting Rice to a Rapidly Changing Climate. J. Agron. Crop Sci. 2012, 198, 360–373. [Google Scholar] [CrossRef]
- Zhou, X.; Zheng, H.B.; Xu, X.Q.; He, J.Y.; Ge, X.K.; Yao, X.; Cheng, T.; Zhu, Y.; Cao, W.X.; Tian, Y.C. Predicting grain yield in rice using multi-temporal vegetation indices from UAV-based multispectral and digital imagery. ISPRS J. Photogramm. Remote Sens. 2017, 130, 246–255. [Google Scholar] [CrossRef]
- Gitelson, A.A.; Kaufman, Y.J.; Stark, R.; Rundquist, D. Novel algorithms for remote estimation of vegetation fraction. Remote Sens. Environ. 2002, 80, 76–87. [Google Scholar] [CrossRef] [Green Version]
- Bolton, D.K.; Friedl, M.A. Forecasting crop yield using remotely sensed vegetation indices and crop phenology metrics. Agric. For. Meteorol. 2013, 173, 74–84. [Google Scholar] [CrossRef]
- Chen, J.; Jonsson, P.; Tamura, M.; Gu, Z.H.; Matsushita, B.; Eklundh, L. A simple method for reconstructing a high-quality NDVI time-series data set based on the Savitzky-Golay filter. Remote Sens. Environ. 2004, 91, 332–344. [Google Scholar] [CrossRef]
- Jonsson, P.; Eklundh, L. Seasonality extraction by function fitting to time-series of satellite sensor data. IEEE Trans. Geosci. Remote Sens. 2002, 40, 1824–1832. [Google Scholar] [CrossRef]
- Zeng, L.; Wardlow, B.D.; Xiang, D.; Hu, S.; Li, D. A review of vegetation phenological metrics extraction using time-series, multispectral satellite data. Remote Sens. Environ. 2020, 237, 111511. [Google Scholar] [CrossRef]


| Year | Plots | Cultivars | Sowing Date | Transplanting Date |
|---|---|---|---|---|
| 2017 | 366 | 122 | June 7–10 | July 9 |
| 2018 | 381 | 127 | June 10 | June 29 |
| 2019 | 315 | 105 | June 6 | June 27 |
| Vegetation Index or Band | Formula | Reference |
|---|---|---|
| R band of UAV image (R) | DN values of R band | -- |
| G band of UAV image (G) | DN values of G band | -- |
| B band of UAV image (B) | DN values of B band | -- |
| Normalized red index (NRI) | R/(R + G + B) | [41] |
| Normalized green index (NGI) | G/(R + G + B) | [41] |
| Normalized blue index (NBI) | B/(R + G + B) | [41] |
| Normalized excess green index (E × G) | (2G − R − B)/(G + R + B) | [42] |
| Normalized excess red index (E × R) | (1.4R − G)/(G + R + B) | [43] |
| Green–red ratio index (G/R) | G/R | [44] |
| Green–blue ratio index (G/B) | G/B | [44] |
| Red–blue ratio index (R/B) | R/B | [44] |
| Green minus red index (GMR) | G − R | [45] |
| Color intensity index (INT) | (R + G + B)/3 | [46] |
| Green and red index (VIgreen) | (G − R)/(G + R) | [47] |
| Parameter | Range | Interval | Model | ||
|---|---|---|---|---|---|
| RF (VIs) | RF (Phenology) | RF (Vis + Phenology) | |||
| max_depth | 2–8 | 1 | 2 | 3 | 4 |
| min_samples_split | 2–14 | 2 | 12 | 8 | 12 |
| min_samples_leaf | 2–16 | 2 | 8 | 10 | 4 |
| Layer (cm) | Clay (%) | Silt (%) | Organic Carbon (%) | Cation Exchange Capacity (cmol kg−1) | Total Nitrogen (%) |
|---|---|---|---|---|---|
| 0–20 | 26.0 | 28.6 | 2.1 | 14.5 | 0.18 |
| 20–40 | 25.1 | 27.1 | 2.1 | 16.9 | 0.20 |
| 40–60 | 23.0 | 25.7 | 1.7 | 17.1 | 0.17 |
| 60–80 | 23.0 | 27.9 | 1.5 | 17.2 | 0.19 |
| 80–100 | 24.5 | 28.0 | 1.6 | 14.6 | 0.16 |
| Statistical Indicator | Data Set | Year | Cultivars | Descriptive Statistics | ||||
|---|---|---|---|---|---|---|---|---|
| Minimum | Maximum | Mean | SD | CV (%) | ||||
| Yield | All cultivars | 2017 | 122 | 5.67 | 9.62 | 8.01 | 0.84 | 10.51 |
| 2018 | 127 | 7.61 | 11.01 | 8.99 | 0.60 | 6.7 | ||
| 2019 | 105 | 6.79 | 10.67 | 8.72 | 0.64 | 7.3 | ||
| Replicated cultivars | 2017 | 21 | 7.08 | 9.51 | 8.84 | 0.64 | 7.22 | |
| 2018 | 21 | 7.82 | 9.93 | 8.93 | 0.58 | 6.46 | ||
| 2019 | 21 | 7.70 | 9.74 | 8.82 | 0.55 | 6.28 | ||
| GDL | All cultivars | 2017 | 122 | 123 | 148 | 137 | 5.02 | 3.68 |
| 2018 | 127 | 117 | 130 | 124 | 2.1 | 1.71 | ||
| 2019 | 105 | 117 | 144 | 132 | 4.6 | 3.47 | ||
| Replicated cultivars | 2017 | 21 | 125 | 136 | 129 | 2.59 | 2.01 | |
| 2018 | 21 | 120 | 130 | 125 | 2.72 | 2.17 | ||
| 2019 | 21 | 119 | 134 | 127 | 3.65 | 2.86 | ||
| Model | Calibration Set | Validation Set | ||||
|---|---|---|---|---|---|---|
| R2 | RMSE (t ha−1) | MAE (t ha−1) | R2 | RMSE (t ha−1) | MAE (t ha−1) | |
| RF (VIs) | 0.52 | 0.61 | 0.49 | 0.06 | 0.65 | 0.51 |
| RF (phenology) | 0.62 | 0.54 | 0.43 | 0.46 | 0.51 | 0.39 |
| RF (VIs + phenology) | 0.70 | 0.48 | 0.38 | 0.53 | 0.43 | 0.34 |
| Model | Cultivars | Statistical Indicators | Mean Paired Differences (t ha−1) | Significance (p Value) | ||
|---|---|---|---|---|---|---|
| R2 | RMSE (t ha−1) | MAE (t ha−1) | ||||
| RF (VIs + phenology) | 21 | 0.51 | 0.44 | 0.38 | −0.07 | 0.69 |
| CERES-Rice | 21 | 0.80 | 0.48 | 0.42 | ||
Publisher’s Note: MDPI stays neutral with regard to jurisdictional claims in published maps and institutional affiliations. |
© 2021 by the authors. Licensee MDPI, Basel, Switzerland. This article is an open access article distributed under the terms and conditions of the Creative Commons Attribution (CC BY) license (https://creativecommons.org/licenses/by/4.0/).
Share and Cite
Ge, H.; Ma, F.; Li, Z.; Du, C. Grain Yield Estimation in Rice Breeding Using Phenological Data and Vegetation Indices Derived from UAV Images. Agronomy 2021, 11, 2439. https://doi.org/10.3390/agronomy11122439
Ge H, Ma F, Li Z, Du C. Grain Yield Estimation in Rice Breeding Using Phenological Data and Vegetation Indices Derived from UAV Images. Agronomy. 2021; 11(12):2439. https://doi.org/10.3390/agronomy11122439
Chicago/Turabian StyleGe, Haixiao, Fei Ma, Zhenwang Li, and Changwen Du. 2021. "Grain Yield Estimation in Rice Breeding Using Phenological Data and Vegetation Indices Derived from UAV Images" Agronomy 11, no. 12: 2439. https://doi.org/10.3390/agronomy11122439
APA StyleGe, H., Ma, F., Li, Z., & Du, C. (2021). Grain Yield Estimation in Rice Breeding Using Phenological Data and Vegetation Indices Derived from UAV Images. Agronomy, 11(12), 2439. https://doi.org/10.3390/agronomy11122439