Article

Photosynthetic Efficiency in Flag Leaves and Ears of Winter Wheat during Fusarium Head Blight Infection

1
Department of Biology, University of Osijek, Cara Hadrijana 8A, 31000 Osijek, Croatia
2
Department of Ecology, Faculty of Science, Charles University in Prague, Viničná 7, 12844 Prague, Czech Republic
3
Agricultural Institute Osijek, Južno Predgrađe 17, 31000 Osijek, Croatia
*
Author to whom correspondence should be addressed.
Agronomy 2021, 11(12), 2415; https://doi.org/10.3390/agronomy11122415
Submission received: 31 October 2021 / Revised: 15 November 2021 / Accepted: 25 November 2021 / Published: 27 November 2021
(This article belongs to the Special Issue Treatment and Management of Fusarium Disease in Wheat)

Abstract

:
Fusarium head blight (FHB) is one of the most serious fungal diseases of wheat (Triticum aestivum L.). It causes major reduction of grain yield and quality, while the safety of wheat products is at risk due to mycotoxin contaminations. To contribute to a better understanding of mechanisms governing more efficient defense strategies against FHB, an evaluation of photosynthetic efficiency was performed during different phases of infection, i.e., before visual symptoms occur, at the onset and after the development of disease symptoms. Six different winter wheat varieties were artificially inoculated with the most significant causal agents of FHB (Fusarium graminearum and F. culmorum) at two different locations. Photosynthetic efficiency was assessed in flag leaves and ears of inoculated and untreated (control) plants based on measurements of chlorophyll a fluorescence rise kinetics and the calculation of JIP-test parameters. Obtained results indicate that the response of wheat to Fusarium infection includes changes in photosynthetic efficiency which can encompass alternating reductions and increases in photosynthetic performance during the course of the infection in both flag leaves and ears. FHB-induced photosynthetic adjustments were shown to be somewhat variety-specific, but location was shown to be a more significant factor in modulating the response of wheat to Fusarium infection. Changes in chlorophyll a fluorescence rise kinetics could be detected prior to visible symptoms of the disease. Therefore, this method could be applied for the early detection of Fusarium infection, particularly the analysis of L-band appearance, which showed a similar response in all inoculated plants, regardless of variety or location.

1. Introduction

Wheat (Triticum aestivum L.) is one of the world’s most important cereal crops. Global demand for wheat is growing but achieving yield and quality increases is challenging [1]. Along with the decreasing availability of suitable agricultural land, climate change, and unfavorable abiotic conditions, wheat production is significantly affected by pathogenic fungi [2]. Fusarium head blight (FHB), which is among the most serious wheat diseases, is caused by several Fusarium spp., such as F. graminearum, F. culmorum, and F. avenaceum, and other related fungi [3]. Infection with Fusarium fungi significantly reduces grain yield and causes poor wheat grain quality [4,5,6]. In addition, wheat grains and products become contaminated with mycotoxins produced by FHB pathogens, which are harmful for humans and animals [7,8,9].
Appropriate crop management practice and selected chemical treatments may lower losses associated with FHB. Along with this, the selection of more FHB resistant wheat genotypes, which are able to retain adequate grain yield and quality and low mycotoxin contamination when exposed to FHB, represents a long-term sustainable strategy of wheat production. Furthermore, fungicide treatment was shown to be more effective at reducing FHB severity and decreasing the accumulation of the main Fusarium mycotoxin deoxynivalenol (DON) in moderately resistant, compared to highly FHB susceptible varieties [10]. However, selecting for such genotypes is hampered by the complexity of FHB resistance traits [11,12]. The mechanisms governing more efficient defense against FHB are not fully uncovered [13]. The resistance reaction of wheat to Fusarium infection includes the following components: Type I, resistance to initial infection; Type II, resistance to spread of symptoms [14]; Type III, resistance to toxin accumulation [15]; Type IV, resistance to kernel infection [16,17]; Type V, yield tolerance [16,17].
In general, pathogen attack can induce significant changes in secondary metabolic processes associated with plant defense, but it can also impair primary metabolism, such as photosynthesis, assimilate partitioning, and source–sink regulation [18]. During Fusarium infection, various changes at the physiological and molecular level can be detected. These changes affect wheat ears where infection is located, but other parts of the infected plant such as leaves can also be affected [13,19,20]. FHB was shown to be associated with changes in oxidative stress levels and modifications in antioxidative response as well as callose deposition, which are considered to be related to FHB resistance [13,20,21,22,23]. It was also implicated that photosynthesis is interconnected with plant immune defense against Fusarium species [24]. More significant reduction of net photosynthesis and stomatal conductance of flag leaves was detected in a resistant, compared to susceptible wheat sister line, while the opposite effect was observed for yield components [19]. A possible role of photosynthesis in response to FHB was also indicated by changes of leaf and ear transcriptome [13], while Ajigboye et al. [25] pointed to changes in photosystem II (PSII) photochemistry in detached glumes caused by different Fusarium species. However, in some studies, a correlation between leaf photosynthetic efficiency and Fusarium infection was not indicated [26].
In C3 cereals, such as wheat, the flag leaf is considered to be the main photosynthetic tissue, but the ear is also photosynthetically active and can contribute to final grain yield, especially under unfavorable growth conditions [27]. The evaluation of photosynthetic efficiency of flag leaves and ears of wheat in this study was based on the measurement of chlorophyll a fluorescence rise kinetics (OJIP kinetics) combined with a multiparametric analysis of the recorded fluorescence transients (JIP-test). This is an efficient and non-invasive approach to obtain insights into the functioning of photosynthetic machinery [28,29,30]. It has been intensively used for the investigation of abiotic stress response in various plant species and the adaptation of plants to different growth conditions [31,32,33,34,35,36,37]. Chlorophyll a fluorescence (ChlF) measurements were also used for the evaluation of the plant’s response to pathogen attack and disease severity [25,38,39,40,41]. The aim of this study was to provide a better understanding of the response of the photosynthetic apparatus of different winter wheat varieties to Fusarium infection and to explore the possible role of FHB-induced changes in photosynthetic efficiency in overall disease outcome. Since the impact of FHB as well as defense strategies can vary significantly between different wheat varieties and due to specific growth conditions and/or agricultural practices [42,43], the evaluation of dynamic of FHB-induced changes in photosynthetic efficiency was performed at two different locations.

2. Materials and Methods

2.1. Plant Material

The experiment was conducted on six winter wheat (Triticum aestivum L.) varieties from Agricultural Institute Osijek: Golubica, El Nino, Galloper, Tika Taka, Vulkan, and Kraljica. Golubica is a winter variety with excellent quality, belonging to A1 quality group, with more than 14% protein content. However, it is subject to underproduction due to its high susceptibility to FHB. El Nino is a winter variety with plant height of 89 cm. It has tolerance to low temperatures and mild drought. Furthermore, it has medium quality properties with average 1000 kernel weight of 41 g. Galloper is a medium early variety with plant height of 92 cm. Galloper has an average 1000 kernel weight is 45 cm with medium quality properties (B1 quality group). Plant regulators are recommended for good efficiency of genetic potential. It has good resistance to most widespread wheat diseases. Tika Taka is a new high yielding variety belonging to A2-B1 quality group, the same quality group as Vulkan. It has good lodging resistance with plant height of 82 cm and 1000 kernel weight of 42 g. Vulkan is a winter variety with owns, with high genetic potential. It has a large number of productive tillers per unit area but is taller than Kraljica with plant height of 87 cm. Kraljica is a high yielding winter wheat variety which belongs to A2 quality group. It is also the most widespread variety in Croatia. Kraljica has an average 1000 kernel weight of 40 g. It demonstrates tolerance to low temperatures and good resistance to lodging.

2.2. Field Experiments

The experiment was conducted during the vegetative season 2019/2020 at two experimental locations: Osijek (45°27′ N, 18°48′ E) and Tovarnik (45°10′ N, 19°09′ E). Those two locations differ in soil type and climatic condition [44]. At Osijek, the soil is eutric cambisol (pHKCl–6.25, humus–2.00–2.20%), while Tovarnik has black soil chernozem (pHKCl–7.42, humus–2.75–3.00%). At both locations, a completely randomized block design was applied. Wheat was sown during October 2019 in 7.56 m2 plots. The agrotechnical practice used was standard for commercial wheat production, except for fungicide application which was omitted in this experiment. The experiment included two different treatments (Fusarium inoculation and untreated control) where one treatment consisted of two replications (two plots). Each wheat variety was planted in four plots at each location and same experimental design was used at both locations (Osijek and Tovarnik). Plant density was 3000–3500 plants per 7.56 m2.
In order to assess the effects of FHB on photosynthesis, artificial inoculation on selected wheat varieties was performed at the flowering stage (Zadok’s stage 65) [45] at two replicated plots with Fusarium inoculum composed of 1:1 F. graminearum stain PIO 31 (obtained from the wheat in East Croatia) and F. culmorum strain IFA 104 (obtained from IFA, Tulln, Austria). Plants from untreated plots were used as a control in the experiment. Inoculum preparation and inoculation were performed as previously described [44]. Disease severity (general resistance) was estimated based on the percentage of bleached spikelets per plot according to a linear scale (0–100%) at 10, 14, 18, 22, and 26 days after inoculation. All these values were used to calculate the area under the disease progress curve (AUDPC) for FHB severity [46] and additionally values for days when ChlF was recorded (10 and 18 dpi) are presented. Disease incidence (Type I resistance) was calculated as the percentage of diseased ears after assessing a random sample of 30 heads at 10, 14, 18, 22, and 26 days after inoculation. All these values were used to calculate the area under the disease progress curve (AUDPC) for Type I resistance [46]. Additionally, values for days when ChlF was recorded (10 and 18 dpi) are presented. Agronomical and quality traits for all varieties included in this study have been assessed at both Osijek and Tovarnik in season 2019/2020 [44]. The grain yield was measured by harvesting the whole area of each plot followed by correction to 14% moisture (on a wet basis) and expressed as dt ha−1.

2.3. Measurement and Analysis of Fast Cholophyll a Fluorescence

The chlorophyll a fluorescence (ChlF) measurements on flag leaves and ears of artificially inoculated and untreated wheat were performed at three measurement points: (1) prior to the development of symptoms at three days post-inoculation (dpi) (Zadok’s stage 65 [45]); (2) at the onset of first visible disease symptoms at 10 dpi (Zadok’s stage 70 [45]); and (3) after the development of disease symptoms at 18 dpi (Zadok’s stage 75 [45]).
The OJIP fluorescence transients were measured with a Handy-PEA fluorimeter (Plant Efficiency Analyser, Hansatech Instruments Ltd., King’s Lynn, Norfolk, England). At both locations (Osijek and Tovarnik), for each of the six varieties, 20 plants (10 from each plot) from inoculated plots and 20 plants (10 from each plot) from untreated plots were analyzed by performing measurements on flag leaves and ears. After dark adaptation for 30 min, ChlF transients were induced by red light (peak at 650 nm) of 3000 μmol photons m−2 s−1 and recorded for 1 s with 12 bit resolution. The JIP-test was applied to analyze and compare ChlF transients [28,30]. JIP-test parameters included in this study are presented in Table 1. Additionally, transients were normalized as relative variable fluorescence (WOP, WOJ, WOK) and presented as difference kinetics (ΔW = Winoculated − Wuntreated) between plants inoculated with Fusarium fungi and untreated control plants. The difference kinetics ΔWOP was used to reveal major changes occurring in the O–J and O–I phases after Fusarium inoculation. The difference kinetics ΔWOJ is used to reveal K band (at 300 μs) which, when positive, is considered to reflect an inactivation of the oxygen evolving complex and/or an increase of the functional PSII antenna size. The difference kinetics ΔWOK is used to reveal the L band (at 150 μs), which is positive when energetic connectivity (grouping) between the PSII photosynthetic units is lower in inoculated plants, compared to untreated control plants, and negative when energetic connectivity is higher in inoculated plants, compared to untreated control plants [28,30].

2.4. Statistical Analysis

Statistical data analysis included factorial analysis of variance followed by post-hoc Tukey’s HSD (honestly significant difference) test in order to determine statistically significant differences among artificially inoculated and untreated plants of each variety separately. For statistical analysis, Statistica 13.4.0.14 software (TIBCO Software Inc., Palo Alto, CA, USA) was used. Differences were considered significant at p < 0.05.

3. Results

3.1. FHB Severity, Incidence and Effect on Grain Yield

FHB severity and incidence were assessed for the first time at 10 days post inoculation (dpi) and assessment continued every four days until 26 dpi in order to calculate AUDPC for general FHB and AUDPC for Type I resistance (Table 2). Symptoms of FHB were not visible at 3 dpi for any of tested varieties. However, FHB symptoms became visible at all Fusarium inoculated plots during the experiment, indicating the success of applied artificial inoculation. Moreover, symptoms of FHB were not visible on wheat untreated with Fusarium spp. during the experiment at both Osijek and Tovarnik. FHB severity varied between 0 and 2.5 at 10 dpi and between 0 and 22.5 at 18 dpi (Table 2). AUDPC for FHB severity was the highest for El Nino, followed by Golubica at both locations, and it was lowest for Galloper, compared to other varieties at Osijek. Meanwhile, at Tovarnik, Galloper and Kraljica had the same AUDPC for FHB severity. FHB incidence at 10 dpi varied between 0 and 11.5 and between 3 and 23.5 at 18 dpi (Table 2). AUDPC for Type I resistance at Osijek was the highest for El Nino, but it was also quite high for Golubica, Tika Taka, and Kraljica varieties, while it was lower for Galloper and Vulkan. At Tovarnik, differences in AUDPC for Type I resistance between varieties were more pronounced with El Nino showing a much higher value compared to other varieties, and the lowest value was obtained for Vulkan followed by Kraljica and Galloper.
Fusarium inoculation caused a decrease in the grain yield of all tested varieties at both locations. The grain yield decrease was lowest for Galloper, compared to other varieties at both locations, while Golubica and El Nino showed more pronaunced grain yield reduction. All varieties showed lower grain yield at Tovarnik compared to Osijek and stronger yield reduction due to Fusarium infection.

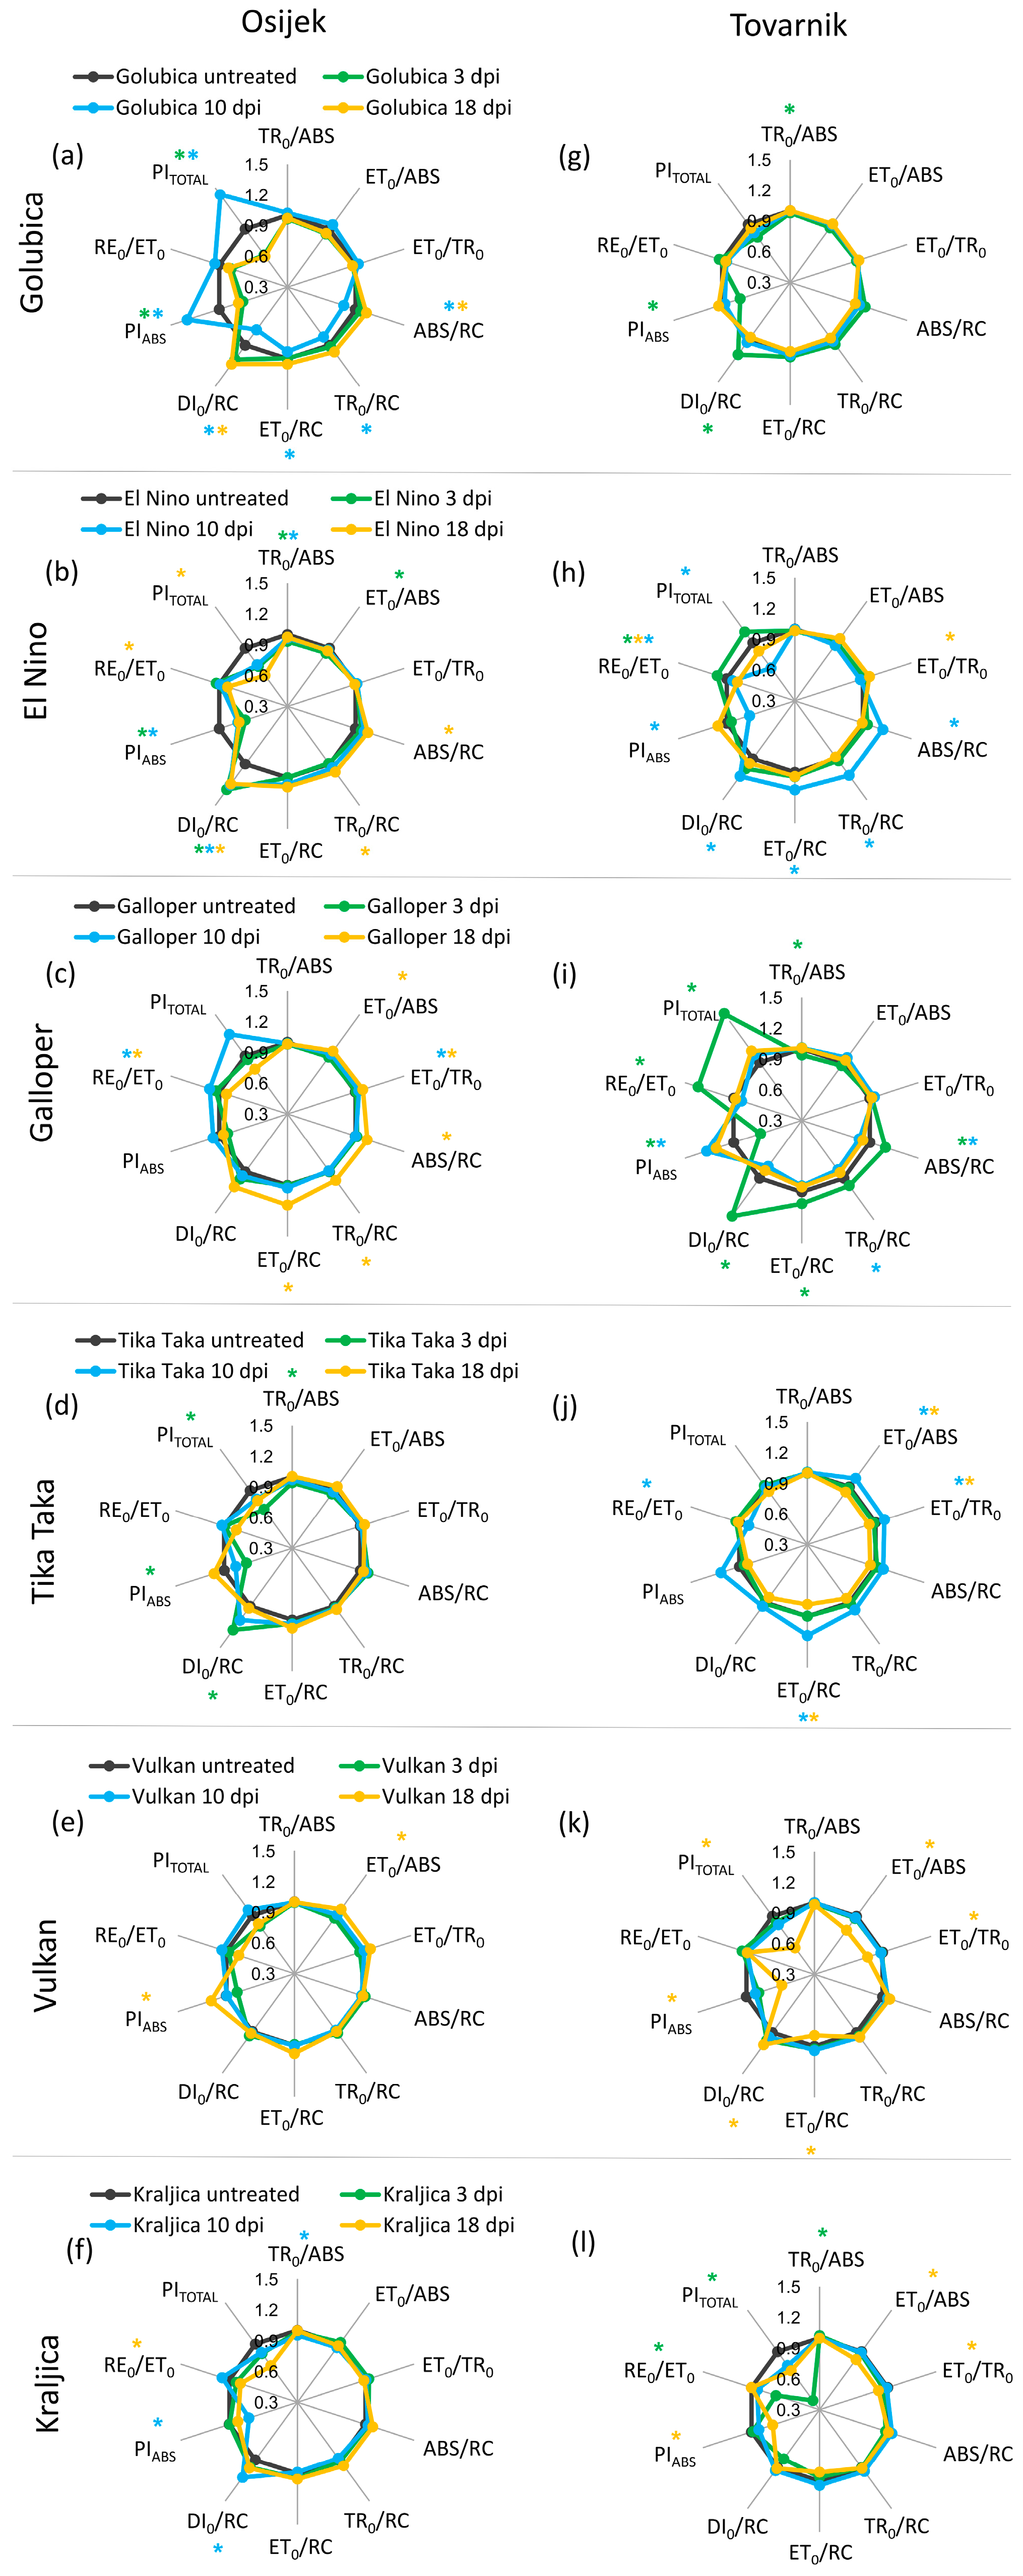
3.2. Phytosynthetic Parameters in Flag Leaves

Location, variety, and treatment significantly affected all three quantum yields (TR0/ABS, ET0/ABS, ET0/TR0), while measurement time point significantly influenced only the maximum quantum yield for primary photochemistry (TR0/ABS) and probability that an electron moves further than QA (ET0/TR0), while it did not affect quantum yield for electron transport (ET0/TR0) (Table 3). Specific energy fluxes per active (QA−reducing) photosystem II (PSII) reaction center (RC), including absorption, trapping, electron transport, and dissipation flux (ABS/RC, TR0/RC, ET0/RC, DI0/RC), were affected by all tested factors, as was the performance index for energy conservation from exciton to the reduction of PSI end acceptors (PITOTAL). The performance index for energy conservation from exciton to the reduction of intersystem electron acceptors (PIABS) was affected by location, variety and measurement time point, while the efficiency with which an electron from the intersystem electron carriers moves to reduce end electron acceptors at the PSI acceptor (RE0/ET0) was affected by variety, treatment, and measurement time point. Interactions of tested factors are further presented in Table 3. The interaction of all four tested factors significantly affected ET0/ABS, ET0/TR0, both performance indexes (PIABS and PITOTAL) and RE0/ET0, but not specific energy fluxes per active RC.
The chlorophyll a fluorescence (ChlF) transients of the dark-adapted flag leaves at three measurement points had the expected OJIP shape for all untreated control plants as well as for FHB inoculated plants of all six winter wheat varieties at both experimental locations (Osijek and Tovarnik), demonstrating that all measured flag leaves were photosynthetically active (data not shown). Differences in average variable fast fluorescence transients between O and P steps in flag leaves are presented as difference kinetics ΔWOP (Figure 1). It revealed differences between tested varieties in the changes occurring in the O–J and O–I phase as well as considerable impact of the environment on ChlF, especially before and at the onset of symptoms development. Negative peaks at J-step can be seen at 3 dpi in all varieties (Figure 1a–f) at Osijek, but this was not observed at location Tovarnik where Fusarium infection had opposite effect at J-step (Figure 1g–l). Negative peaks at J-step were also visible for variety El Nino (Figure 1b), Galloper (Figure 1c), Vulkan (Figure 1e), and Kraljica (Figure 1f) at 10 dpi at Osijek, but only for variety Golubica at location Tovarnik (Figure 1g). The effect of FHB at both locations at 18 dpi was similar at J-step for varieties Golubica (Figure 1a,g), Galloper (Figure 1c,i), Tika Taka (Figure 1d,j), and Vulkan (Figure 1e,k) and opposite for variety El Nino (Figure 1b,h) and Kraljica (Figure 1f,l). At location Osijek, negative amplitude at I-step was observed for Golubica (Figure 1a), Tika Taka (Figure 1d), and Vulkan (Figure 1e) at 3 dpi and only for Tika Taka (Figure 1d) at 10 dpi, while the effect of FHB at I-step was relatively small at 18 dpi compared to other measurement points for all varieties. Moreover, the impact of FHB on amplitude of I-step at location Tovarnik was mostly not very pronounced at 3 dpi (Figure 1g–l).
The occurrence of K-bands and L-bands in flag leaves after FHB inoculation is presented at Figure 2. For variety Golubica, only small differences in K-band are induced by FHB at both locations (Figure 2a), while El Nino showed a positive K-band, especially in earlier phases of infection (Figure 1b). Galloper had a less pronounced positive K-band than El Nino, which at location Tovarnik was visible only at 3 dpi (Figure 2c). Variety Tika Taka at location Osijek had a positive K-band at 3 dpi and 10 dpi and negative K-band at 18 dpi, while the effect of FHB on K-band of this variety at location Tovarnik was very small (Figure 2d). The effect of FHB on K-band of variety Vulkan was also less pronounced at Tovarnik compared to Osijek (Figure 2e). Variety Kraljica showed a positive K-band at all three measurements at Osijek with the highest peak observed at 3 dpi, while at Tovarnik it had a positive K-band only at 3 dpi, and a negative K-band was visible at 10 dpi in Kraljica (Figure 2f). Compared to the variable effect of Fusarium infection on the occurrence and amplitude of K-band, all plants infected by Fusarium at both locations showed similar patterns in L-band occurrence (Figure 2g–l). Overall, the L-band was mostly positive for all inoculated plants during different phases of infection, but the most considerable effect of FHB is the induction of a high positive L-band at 3 dpi for all six varieties.
Changes in JIP-test parameters in flag leaves after inoculation with F. graminearum + F. culmorum spores for each variety separately at location Osijek are presented in Figure 3a–f. Fusarium treatment caused some changes in flag leaves of treated plants, compared to untreated control plants before (3 dpi) and at the onset of symptoms development (10 dpi) at location Osijek. However, at 18 dpi, the difference between treated and untreated plants at this location was not detected in flag leaves for any of the tested varieties. For variety El Nino at 3 dpi, TR0/ABS was slightly decreased (Figure 3b), but for all other varieties at all measuring time points at location Osijek Fusarium infection did not affect TR0/ABS (Figure 3a,c–f). Furthermore, Fusarium treatment at location Osijek did not induced changes in PIABS. Performance index PITOTAL was also generally unchanged in treated compared to control plants, except for the decreased value of PITOTAL for variety El Nino at 3 dpi (Figure 3b) and variety Tika Taka at 10 dpi (Figure 3d). Variety Tika Taka showed statistically significant increase of all four specific energy fluxes per active RC (ABS/RC, TR0/RC, ET0/RC, DI0/RC) at 3 and 10 dpi (Figure 3d) and similar was observed for El Nino, except that change of DI0/RC in flag leaves of El Nino was not statistically significant. Additionally, ABS/RC and TR0/RC were also affected in variety Vulkan (Figure 3e) at 3 dpi (Figure 3b,e) and in variety Kraljica at 3 and 10 dpi (Figure 3f).
Changes in JIP-test parameters in flag leaves after inoculation with F. graminearum + F. culmorum for each variety separately at location Tovarnik are presented in Figure 3g–l. At location Tovarnik, similar to what was observed at location Osijek, Fusarium infection generally had a greater effect on measured JIP-test parameters in earlier phases of infection. However, for variety Galloper, none of the analyzed parameters in flag leaves at this location were affected by FHB (Figure 3i), and the only difference between treated plants and the untreated control of variety Golubica at location Tovarnik was seen in a statistically significant increase in PITOTAL at 18 dpi (Figure 3g). Changes in variety El Nino were observed at 3 dpi when ET0/ABS, ET0/TR0, PIABS, and PITOTAL were decreased and ABS/RC, TR0/RC, and DI0/RC were increased (Figure 3h). Additionally, El Nino showed a decrease of PIABS at 10 dpi (Figure 3h). Values of TR0/ABS were mostly not affected by FHB at location Tovarnik, similarly to what was observed at location Osijek. Only slight but statistically significant increase of this parameter was detected at 10 dpi in variety Tika Taka (Figure 3j). Furthermore, ET0/RC was affected at 3 and 10 dpi for this variety (Figure 3j). Variety Vulkan showed only small decrease of ET0/RC at 10 dpi (Figure 3k), while variety Kraljica had decreased values ET0/ABS and ET0/TR0 at 3 dpi, and increased values of ABS/RC, TR0/RC, and ET0/RC at 3 dpi as well as increased values of ABS/RC and TR0/RC and 10 dpi in treated, compared to corresponding inoculated plants at location Tovarnik (Figure 3l).

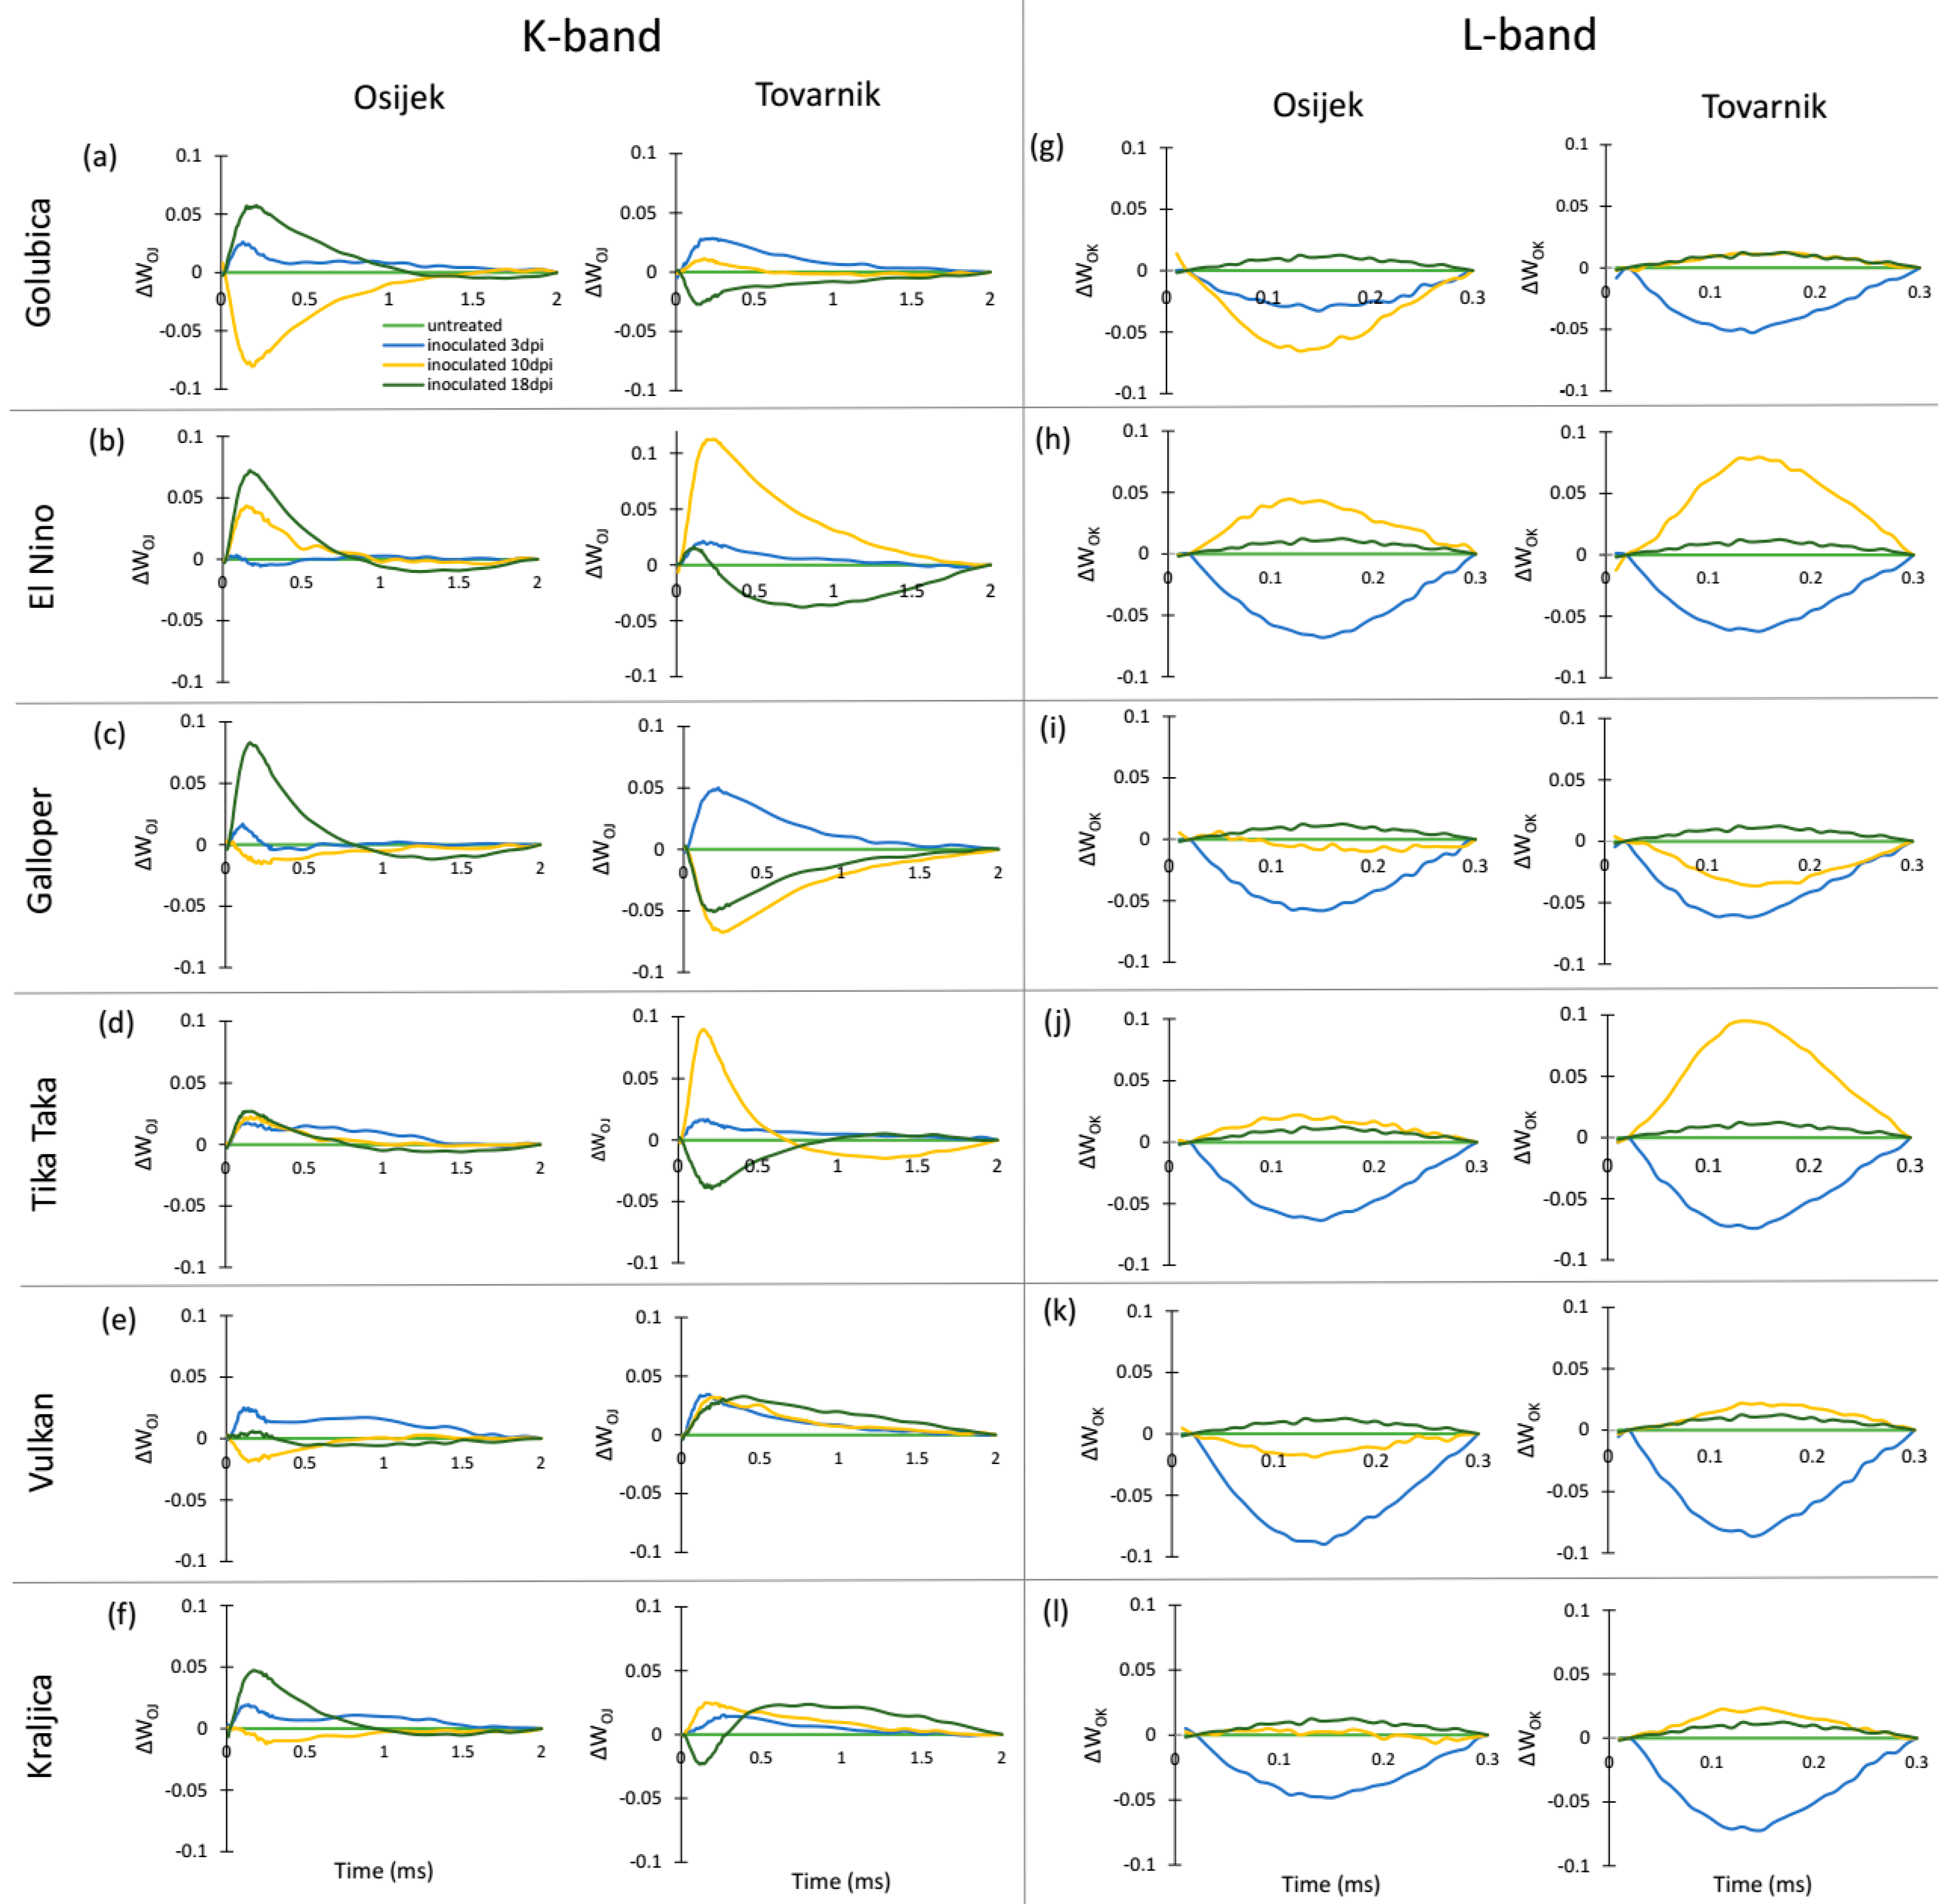
3.3. Phytosynthetic Parameters in Ears

Variety, treatment, and measurement time point significantly affected all analysed JIP-test parameters, while location affected all of them, except RE0/ET0 (Table 4). Moreover, various interactions of tested parameters mostly had a significant effect on analysed parameters, and interactions of all four tested factors were significant for all JIP-test parameters in wheat ears (Table 4).
The chlorophyll a fluorescence (ChlF) transients of the dark-adapted ears at three measurement points had the expected OJIP shape for all untreated control plants as well as for FHB inoculated plants of all six winter wheat varieties at both experimental locations (Osijek and Tovarnik), demonstrating that all measured ears were photosynthetically active (data not shown). Differences in average variable fast fluorescence transients between O and P steps in ears are presented as difference kinetics ΔWOP (Figure 4). Similarly, as in flag leaves, changes occurring in the O–J and O–I phase between inoculated and untreated plants were considerably affected by location. Generally, a strong J-peak and I-peak were not visible for the majority of varieties regardless of measurement time, although more considerable differences were observed between inoculated and untreated plants of variety El Nino (Figure 4h), Vulkan (Figure 4k), and Kraljica (Figure 4l) at location Tovarnik.
The occurrence of K-bands and L-bands in ears after inoculation with Fusarium fungi is presented at Figure 5. At 3 dpi, the occurrence of the small but positive K-band was generally observed and at this measurement point a more pronounced positive K-band was only seen for Galloper at Tovarnik (Figure 5c). A high positive K-band at 10 dpi was specific for El Nino (Figure 5b) and Tika Taka (Figure 5d) at Tovarnik, while a substantial negative K-band at 10 dpi was observed for Golubica (Figure 5a) at Osijek. At 18 dpi, all varieties at location Osijek showed a positive K-band, except Vulkan (Figure 5e) which did not show considerable changes in K-band occurrence in inoculated, compared to control plants. In contrast, Golubica (Figure 5a), Galloper (Figure 5c), Tika Taka (Figure 5d), and Kraljica (Figure 5f) had a negative K-band at 18 dpi at Tovarnik. Although some differences between varieties and locations in occurrence of L-band were visible, the response of L-band for all varieties before the development of symptoms at 3 dpi was similar, including a visible negative L-band.
Changes in JIP-test parameters in ears after inoculation with F. graminearum + F. culmorum for each variety separately at location Osijek are presented in Figure 6a–f. In comparison to leaves where changes were observed only in earlier measurement points, Fusarium treatment caused the same changes before as well as after the development symptoms in ears of treated plants compared to untreated control plants. The exception here was variety Tika Taka which showed differences due to FHB only at 3 dpi, including a decrease of TR0/ABS and performance indexes (PIABS and PITOTAL), and an increase of DI0/RC (Figure 6d). Golubica showed a statistically significant decrease of performance indices (PIABS and PITOTAL) in ears of treated plants, compared to untreated control plants at 3 dpi and 10 dpi. Additionally, Fusarium infection decreased ABS/RC, TR0/RC, and ET0/RC in variety Gloubica at 10 dpi, while at 18 dpi inoculated plants had increased ABS/RC and DI0/RC compared to the corresponding control at location Osijek (Figure 6a). For variety El Nino at 3 dpi and 10 dpi, TR0/ABS was decreased and a decrease in ET0/ABS was observed at 3 dpi in ears of treated compared to untreated plants. Performance index PIABS was decreased due to FHB in variety El Nino at 3 dpi and 10 dpi, while PITOTAL and RE0/ET0 were significantly decreased at 18 dpi. Furthermore, ABS/RC and TR0/RC were increased at 18 dpi and DI0/RC was lower at all three measuring time points in ears of infected compared to control plants of variety El Nino at location Osijek (Figure 6b). Both performance indexes (PIABS and PITOTAL) as well as TR0/ABS and DI0/RC remained unchanged during the experiment for variety Galloper, while ET0/ABS increased at 18 dpi when ABS/RC, TR0/RC, and ET0/RC flux were also increased in ears of inoculated compared to untreated control plants of this variety and ET0/TR0 increased at 10 dpi and at 18 dpi. The only effect of FHB on JIP-test parameters in ears for variety Vulkan at location Osijek included a statistically significant increase of ET0/ABS and PIABS at 18 dpi (Figure 6e), while for variety Kraljica a decrease of TR0/ABS and PIABS along with an increase of DI0/RC was detected at 10 dpi and at 18 dpi. RE0/ET0 was increased in ears of inoculated compared to untreated control plants (Figure 6f).
Changes in JIP-test parameters in ears after inoculation with F. graminearum + F. culmorum for each variety separately at location Tovarnik are presented in Figure 6g–l. Similar to what was observed at location Osijek, certain differences between measured JIP-test parameters were detected at each measurement time point (3, 10, and 18 dpi). However, the pattern of changes in measured JIP-test parameters during the course of infection was different to what was observed at location Osijek. Variety Golubica showed a slight but statistically significant decrease of TR0/ABS at 3 dpi in inoculated, compared to untreated plants as well as a decrease of PIABS and increase of DI0/RC (Figure 6g). At 3 dpi, only an increase in RE0/ET0 and no other changes in ears were induced in variety El Nino by FHB. However, at 10 dpi, inoculated plants of variety El Nino had significant increased values of all specific energy fluxes per active RC (ABS/RC, TR0/RC, ET0/RC, DI0/RC) as well as decreased values of both performance indices (PIABS and PITOTAL) and values of RE0/ET0, compared to corresponding control plants, while an increase of ET0/TR0 and decrease of RE0/ET0 were detected at 18 dpi (Figure 6h). Although at Osijek variety Galloper showed FHB-induced changes at 18 dpi, at location Tovarnik differences between inoculated and untreated plants of variety Galloper were observed only at 3 and 10 dpi. These differences included a very significant increase in PITOTAL accompanied by an increase of RE0/ET0 at 3 dpi. Furthermore, at 3 dpi, inoculated plant of variety Galloper had decreased TR0/ABS and PIABS as well as increased ABS/RC, ET0/RC, and DI0/RC. At 10 dpi, Fusarium infection induced a decrease in ABS/RC and DI0/RC along with an increase in performance index PIABS in inoculated compared to untreated plants of variety Galloper (Figure 6i). For variety Tika Taka, statistically significant variations between inoculated and untreated plant were detected only at 3 dpi at Osijek, while at Tovarnik no differences were observed before the development of symptoms. At the onset of symptom development, Tika Taka showed increased ET0/ABS, ET0/TR0, and ET0/RC and decreased value of RE0/ET0 in ears of inoculated, compared to untreated plants. Additionally, ET0/ABS, ET0/TR0, and ET0/RC were decreased at 18 dpi in FHB inoculated plants of variety Tika Taka (Figure 6j). Changes in measured JIP-test parameters in ears of variety Vulkan at Tovarnik occurred only at 18 dpi, as was observed at Osijek. However, changes in Tovarnik were more pronounced and negative compared with Osijek since the decrease of ET0/ABS, ET0/TR0, and ET0/RC as well as both performance indexes PIABS and PITOTAL along with an increase in DI0/RC were observed at 18 dpi at location Tovarnik in inoculated, compared to untreated plants of variety Vulkan (Figure 5k). The most pronounced effect of FHB in ears of variety Kraljica at Tovarnik was a major decrease in PITOTAL along with a decrease in RE0/ET0 at 3 dpi when an increase in TR0/ABS was also observed in inoculated, compared to untreated plants. Furthermore, variety Kraljica showed decreased values of ET0/ABS, ET0/TR0, and PIABS in infected compared to untreated plants at 18 dpi (Figure 6l).

4. Discussion

Due to a major reduction of yield, quality, and safety, FHB epidemics significantly threaten wheat production worldwide [3,5,47]. Various morphological and developmental wheat characteristics and specific physiological mechanisms affect the development of FHB [11]. Moreover, during field growth, plants are generally exposed to several unfavorable factors and a specific combination of factors exists at each growth season and at each location. During the quite long growth period from sowing to harvest, winter wheat is exposed to different combinations of abiotic factors which can modify its response and final outcome of Fusarium infection.
In this study, the effect of Fusarium infection on photosynthesis was assessed by measuring ChlF in flag leaves and ears of six winter wheat varieties with different susceptibility to Fusarium infection [44]. According to FHB severity at 10 and 18 dpi and AUDPC for FHB severity as well as FHB incidence at 10 and 18 dpi and AUDPC for Type I resistance, Golubica and El Nino varieties were highly susceptible at both locations, while Galloper showed the highest level of FHB resistance among tested varieties, together with Kraljica at Tovarnik. The characterization of varieties from this study showed the expected response of yield and yield components under FHB stress which were much more reduced for susceptible varieties than for resistant varieties [44]. Moreover, yield reduction was stronger at location Tovarnik compared to Osijek. Analysis of OJIP transients and comparison of values of JIP-test parameters pointed to the general functionality of PSII in both flag leaves and ears of wheat plants infected with Fusarium fungi. However, variations in several JIP-test parameters during the course of infection were observed when inoculated plants were compared to untreated control plants. It is particularly important that some of these alterations in photosynthetic apparatus functioning were measurable before disease symptoms were visible (at the 3 dpi). Although this method is not applicable as a reliable diagnostic method, the obtained results support the assumption that routine monitoring of ChlF changes around anthesis, when Fusarium infection is expected to occur, might be useful for the early detection of infection [25]. The applicability of JIP-test analysis to detect plant stress before visible symptoms of the disease was suggested for other plant pathogens as well [38]. According to the results of this study, the occurrence of L-band might be the most applicable for the purpose of early FHB detection since this parameter showed a similar response in all inoculated plants regardless of variety or environmental conditions. A positive L-band was detected in flag leaves of inoculated plants at 3 dpi before any visible symptom of infection could be observed, at the same time as a negative L-band occurred in inoculated ears. This indicates that an early response of wheat to Fusarium infection includes lowering of the energetic connectivity (grouping) between the PSII photosynthetic units in flag leaves and increase of energetic connectivity in infected ears.
Various host and pathogen related factors affect epidemics of FHB, e.g., physiological state and genetic make-up of the host and adaptation and virulence of the pathogen. Local and regional environment factors also contribute to the dynamic of Fusarium infections [3]. The impact of FHB as well as defense strategies can vary significantly between different wheat varieties and due to specific growth conditions and/or agricultural practices [42,43]. Therefore, the severity and impact of the disease may differ for particular wheat variety if it is exposed to different environmental conditions. Results of this study indicate that changes in the photosynthetic efficiency due to Fusarium infection vary depending on environmental conditions. Environment, i.e., location, was shown to significantly modify the response of both flag leaves and ears to FHB stress. Experimental locations included in this study (Osijek and Tovarnik) are located in the continental part of Croatia and are about 60 km apart but have different soil types and slightly different climatic conditions. These differences between Osijek and Tovarnik were sufficient to induce variability in the response to FHB considering agronomical and quality traits [44] as well as JIP-test parameters, as observed in this study. This points to a possibility that modification in photosynthetic efficiency is interconnected with the response of wheat to Fusarium infection as previously indicated [24,25].
Despite indicating variations in the functioning of photosynthetic apparatus, obtained results did not indicate a heavy impairment of PSII or electron transport in wheat infected with Fusarium. Maximum quantum yield for primary photochemistry (TR0/ABS) in flag leaves was mostly unchanged during the course of this experiment, which is in accordance with previously conducted field measurements [26]. One exception here is the minor decrease of TR0/ABS in inoculated, compared to untreated plants of variety El Nino at location Osijek at 3 dpi and minor increase of this parameter in inoculated compared to untreated plants of variety Tika Taka at location Tovarnik at 10 dpi. In this study, slight changes in TR0/ABS in ears due to FHB were observed for some varieties in earlier phases of infection, but the maximum quantum yield of primary photochemistry in ears was mostly unchanged during the course of infection, as in flag leaves. Previously, a decrease of maximum quantum yield of primary PSII photochemistry as a response to Fusarium avenaceum and F. culmorum in detected glumes was reported [25]. Two photosynthetic performance indexes (PIABS and PITOTAL) were calculated and compared as a more reliable indicator of photosynthetic efficiency than TR0/ABS. Compared to previous studies [26], the result of this study showed that values of PIABS and PITOTAL occasionally responded to Fusarium infection, mostly in earlier phases of infection, but also at 18 dpi.
Some previous studies indicated different impacts of FHB on photosynthetic activity of susceptible and resistant wheat varieties and assumed the involvement of photosynthesis in the disease response [24]. Some authors showed that a decrease of net photosynthetic rate (Pn) and stomatal conductance (Gs) is more pronounced in the flag leaves of resistant variety compared to its susceptible sister line [19]. However, decreases in measured photosynthetic parameters yield components were less affected by Fusarium infection in the resistant line compared to the susceptible one. The downregulation of photosynthesis is considered to contribute to higher FHB resistance, which includes more significant physiologic modifications, but results in only modest yield loss [19]. On the contrary, some research associated increasing photosynthetic efficiency with higher resistance to FHB [48]. They observed decreasing photosynthetic efficiency in susceptible cultivar Rebelde compared to resistant cultivar Sumai3 after inoculation and suggested that cross-talk between genes regulating stomatal closure and opening are important in the development of FHB resistance. Results of our study also support the variety-specific response of photosynthetic apparatus in flag leaves as well as in ears to Fusarium infection. However, ChlF measurements of six varieties in this study does not seems to reflect their disease susceptibility. In this study, susceptible variety El Nino had 39% and 54% decreases in yield at Osijek and Tovarnik, respectively. This variety showed pronounced changes in analyzed JIP-test parameters due to Fusarium infection, indicating a levering of photosynthetic efficiency and inefficient use of absorbed energy in both flag leaves and ears. On the other hand, variety Golubica, which was also susceptible to FHB and showed 53% and 59% decreases in yield, did not show such a decrease in photosynthetic efficiency in flag leaves nor in ears at location Tovarnik, where an even higher yield decrease is recorded compared to location Osijek. The response of leaves of resistant variety Galloper was similar to those of variety Golubica at location Osijek and no changes in flag leaves of this variety was observed at location Tovarnik. However, response of ears of this variety was more pronounced at location Tovarnik compared to location Osijek. Variety Tika Taka and Vulkan showed similar yield decreases at both locations, but the photosynthetic efficiency of variety Tika Taka was slightly more affected by FHB compared to variety Vulkan. For variety Kraljica, FHB slightly more affected photosynthetic efficiency at location Tovarnik, where a higher yield loss for this variety was observed compared to location Osijek. Altogether, results of this study and previous studies [19,48] might be interpreted as an indicator that the modification of photosynthetic efficiency occurs as a response of some varieties to Fusarium infection, while for some varieties other defense strategies might be more important. Moreover, it should be noted that measurements were performed using different methodological approaches in each of these studies, including the difference in growth conditions and methods for photosynthetic evaluation, and therefore they should be compared with caution.
Photosynthetic adjustments of wheat infected by Fusarium fungi were shown to be dynamic, including alternating down-regulation and up-regulation during the course of infection. Observed variability in photosynthetic efficiency among six tested wheat varieties might result from a specific genotype-associated response on complex interactions of all factors acting in a particular growth environment along with FHB. It is possible that some of the parameters which were different in flag leaves and ears between control and treated plants are significant in terms of the defense and ultimate response of the variety as previously suggested [19,24], especially since those changes mainly occur before or at the beginning of the development of symptoms. However, field conditions make it difficult to distinguish such an association between specific PSII functioning and better response to infection.

5. Conclusions

Variety-specific alternations in photosynthetic efficiency in flag leaves mostly occurred only in earlier phases, while some changes in the functioning of photosynthetic apparatus in ears were also detected after the development of symptoms. Changes in PSII photochemistry and electron transport in FHB-inoculated, compared to untreated control plants, differed between two experimental locations (Osijek and Tovarnik) as well as overall disease outcome and grain yield. ChlF measurement, as a fast, non-invasive, and field-adjusted technique could be adopted to efficiently supplement other methodological approaches for the early detection of FHB epidemics since changes in ChlF could be detected prior to visible symptoms of the disease. The L-band, which showed similar responses in all inoculated plants regardless of variety or location, might be particularly useful for the purpose of early FHB detection. However, results of this study indicate the limited applicability of OJIP kinetics in field conditions as an indicator of the degree of FHB resistance. In future, experiments in controlled conditions, such as a greenhouse, and the evaluation of early changes in ChlF (starting from few hours post-inoculation) should be tested in order to determine when the response of the photosynthetic apparatus to Fusarium infection begins and whether these early changes are uniform between varieties or if they could indicate the level of FHB-resistance.

Author Contributions

Conceptualization, V.Š., Z.K. and S.M.; methodology, V.Š., Z.K. and S.M.; formal analysis, V.Š., Z.K., S.M., J.Ć. and N.K.; investigation, V.Š., Z.K., S.M., J.Ć. and N.K.; resources, V.Š.; writing—original draft preparation, Z.K.; writing—review and editing, V.Š., Z.K., S.M., J.Ć., N.K. and V.Š.; visualization, Z.K. and S.M.; supervision, Z.K.; project administration, V.Š.; funding acquisition, V.Š. All authors have read and agreed to the published version of the manuscript.

Funding

This research was co-financed by the European Union through the European Regional Development Fund-the Competitiveness and Cohesion Operational Programme for grant number KK.01.1.1.04.0067.

Institutional Review Board Statement

Not applicable.

Informed Consent Statement

Not applicable.

Data Availability Statement

The data presented in this study are available on request from the corresponding author.

Conflicts of Interest

The authors declare no conflict of interest.

References

  1. Hawkesford, M.J.; Araus, J.L.; Park, R.; Calderini, D.; Miralles, D.; Shen, T.; Zhang, J.; Parry, M.A.J. Prospects of doubling global wheat yields. Food Energy Secur. 2013, 2, 34–48. [Google Scholar] [CrossRef]
  2. Figueroa, M.; Hammond-Kosack, K.E.; Solomon, P.S. A review of wheat diseases—A field perspective. Mol. Plant Pathol. 2018, 19, 1523–1536. [Google Scholar] [CrossRef]
  3. Osborne, L.E.; Stein, J.M. Epidemiology of Fusarium head blight on small-grain cereals. Int. J. Food Microbiol. 2007, 119, 103–108. [Google Scholar] [CrossRef] [PubMed]
  4. Parry, D.W.; Jenkinson, P.; Mcleod, L. Fusarium ear blight (scab) in small grain cereals—A review. Plant Pathol. 1995, 44, 207–238. [Google Scholar] [CrossRef]
  5. Dweba, C.C.; Figlan, S.; Shimelis, H.A.; Motaung, T.E.; Sydenham, S.; Mwadzingeni, L.; Tsilo, T.J. Fusarium head blight of wheat: Pathogenesis and control strategies. Crop. Prot. 2017, 91, 114–122. [Google Scholar] [CrossRef]
  6. Spanic, V.; Horvat, D.; Drezner, G.; Zdunic, Z. Changes in protein composition in the grain and malt after Fusarium infection dependently of wheat resistance. Pathogens 2019, 8, 112. [Google Scholar] [CrossRef] [PubMed] [Green Version]
  7. da Rocha, M.E.B.; da Freire, F.C.O.; Erlan Feitosa Maia, F.; Izabel Florindo Guedes, M.; Rondina, D. Mycotoxins and their effects on human and animal health. Food Control 2014, 36, 159–165. [Google Scholar] [CrossRef]
  8. Škrbić, B.; Malachova, A.; Živančev, J.; Veprikova, Z.; Hajšlová, J. Fusarium mycotoxins in wheat samples harvested in Serbia: A preliminary survey. Food Control 2011, 22, 1261–1267. [Google Scholar] [CrossRef]
  9. Spanic, V.; Katanic, Z.; Sulyok, M.; Krska, R.; Puskas, K.; Vida, G.; Drezner, G.; Šarkanj, B. Multiple fungal metabolites including mycotoxins in naturally infected and Fusarium-inoculated wheat samples. Microorganisms 2020, 8, 578. [Google Scholar] [CrossRef] [Green Version]
  10. Mesterházy, Á.; Tóth, B.; Varga, M.; Bartók, T.; Szabó-Hevér, Á.; Farády, L.; Lehoczki-Krsjak, S. Role of fungicides, application of nozzle types, and the resistance level of wheat varieties in the control of Fusarium head blight and deoxynivalenol. Toxins 2011, 3, 1453. [Google Scholar] [CrossRef] [Green Version]
  11. Bai, G.; Su, Z.; Cai, J. Wheat resistance to Fusarium head blight. Can. J. Plant Pathol. 2018, 40, 336–346. [Google Scholar] [CrossRef]
  12. Zhang, W.; Boyle, K.; Brule-Babel, A.; Fedak, G.; Gao, P.; Djama, Z.R.; Polley, B.; Cuthbert, R.; Randhawa, H.; Graf, R.; et al. Evaluation of genomic prediction for Fusarium head blight resistance with a multi-parental population. Biology 2021, 10, 756. [Google Scholar] [CrossRef]
  13. Li, X.; Zhong, S.; Chen, W.; Fatima, S.A.; Huang, Q.; Li, Q.; Tan, F.; Luo, P. Transcriptome analysis identifies a 140 Kb region of chromosome 3B containing genes specific to Fusarium head blight resistance in wheat. Int. J. Mol. Sci. 2018, 19, 852. [Google Scholar] [CrossRef] [PubMed] [Green Version]
  14. Schroeder, H.W.; Christensen, J.J.; Christensen, J.D.; Platz-Christensen, J.; Schroeder, H.W. Factors affecting resistance of wheat to scab caused by Gibberella zeae. Phytopathology 1963, 53, 831–838. [Google Scholar]
  15. David Miller, J. Degradation of deoxynivalenol by suspension cultures of the Fusarium head blight resistant wheat cultivar frontana. Can. J. Plant Pathol. 1986, 8, 147–150. [Google Scholar] [CrossRef]
  16. Mesterhazy, A. Types and components of resistance to Fusarium head blight of wheat. Plant Breed. 1995, 114, 377–386. [Google Scholar] [CrossRef]
  17. Mesterházy, Á.; Bartók, T.; Mirocha, C.G.; Komoroczy, R. Nature of wheat resistance to Fusarium head blight and the role of deoxynivalenol for breeding. Plant Breed. 1999, 118, 97–110. [Google Scholar] [CrossRef]
  18. Berger, S.; Sinha, A.K.; Roitsch, T. Plant physiology meets phytopathology: Plant primary metabolism and plant-pathogen interactions. J. Exp. Bot. 2007, 58, 4019–4026. [Google Scholar] [CrossRef] [PubMed]
  19. Yang, S.; Li, X.; Chen, W.; Liu, T.; Zhong, S.; Ma, L.; Zhang, M.; Zhang, H.; Yu, D.; Luo, P. Wheat resistance to Fusarium head blight is associated with changes in photosynthetic parameters. Plant Dis. 2016, 100, 847–852. [Google Scholar] [CrossRef]
  20. Spanic, V.; Vuletic, M.V.; Horvat, D.; Sarkanj, B.; Drezner, G.; Zdunic, Z. Changes in antioxidant system during grain development of wheat (Triticum aestivum l.) and relationship with protein composition under FHB stress. Pathogens 2020, 9, 17. [Google Scholar] [CrossRef] [Green Version]
  21. Walter, S.; Nicholson, P.; Doohan, F.M. Action and reaction of host and pathogen during Fusarium head blight disease. New Phytol. 2010, 185, 54–66. [Google Scholar] [CrossRef] [PubMed]
  22. Bai, G.; Shaner, G. Management and resistance in wheat and barley to Fusarium head blight. Annu. Rev. Phytopathol. 2004, 42, 135–161. [Google Scholar] [CrossRef] [PubMed]
  23. Khaledi, N.; Taheri, P.; Falahati-Rastegar, M. Evaluation of resistance and the role of some defense responses in wheat cultivars to Fusarium head blight. J. Plant Prot. Res. 2017, 57, 396–408. [Google Scholar] [CrossRef] [Green Version]
  24. Yang, H.; Luo, P. Changes in photosynthesis could provide important insight into the interaction between wheat and fungal pathogens. Int. J. Mol. Sci. 2021, 22, 8865. [Google Scholar] [CrossRef]
  25. Ajigboye, O.O.; Bousquet, L.; Murchie, E.H.; Ray, R.V. Chlorophyll fluorescence parameters allow the rapid detection and differentiation of plant responses in three different wheat pathosystems. Funct. Plant Biol. 2016, 43, 356–369. [Google Scholar] [CrossRef]
  26. Spanic, V.; Vuletic, M.V.; Drezner, G.; Zdunic, Z.; Horvat, D. Performance indices in wheat chlorophyll a fluorescence and protein quality influenced by FHB. Pathogens 2017, 6, 59. [Google Scholar] [CrossRef] [PubMed] [Green Version]
  27. Tambussi, E.A.; Maydup, M.L.; Carrión, C.A.; Guiamet, J.J.; Araus, J.L. Ear photosynthesis in C3 cereals and its contribution to grain yield: Methodologies, controversies, and perspectives. J. Exp. Bot. 2021, 72, 3956–3970. [Google Scholar] [CrossRef]
  28. Yusuf, M.A.; Kumar, D.; Rajwanshi, R.; Strasser, R.J.; Tsimilli-Michael, M.; Govindjee; Sarin, N.B. Overexpression of γ-tocopherol methyl transferase gene in transgenic Brassica juncea plants alleviates abiotic stress: Physiological and chlorophyll a fluorescence measurements. Biochim. Et Biophys. Acta Bioenerg. 2010, 1797, 1428–1438. [Google Scholar] [CrossRef] [Green Version]
  29. Strasser, R.J.; Srivastava, A.; Tsimilli-Michael, M. The fluorescence transient as a tool to characterize and screen photosynthetic samples. In Probing Photosynthesis: Mechanisms, Regulation and Adaptation; Yunus, M., Pathre, U., Mohanty, P., Eds.; Taylor & Francis: London, UK, 2000; pp. 445–483. [Google Scholar]
  30. Strasser, R.J.; Tsimilli-Michael, M.; Srivastava, A. Analysis of the chlorophyll a fluorescence transient. In Chlorophyll A Fluorescence; Springer: Dordrecht, The Netherlands, 2004; pp. 321–362. [Google Scholar] [CrossRef]
  31. Begović, L.; Galić, V.; Abičić, I.; Lončarić, Z.; Lalić, A.; Mlinarić, S. Implications of intra-seasonal climate variations on chlorophyll a fluorescence and biomass in winter barley breeding program. Photosynthetica 2020, 58, 995–1008. [Google Scholar] [CrossRef]
  32. Begović, L.; Mlinarić, S.; Antunović Dunić, J.; Katanić, Z.; Lončarić, Z.; Lepeduš, H.; Cesar, V. Response of lemna minor L. to short-term cobalt exposure: The effect on photosynthetic electron transport chain and induction of oxidative damage. Aquat. Toxicol. 2016, 175, 117–126. [Google Scholar] [CrossRef]
  33. Mlinarić, S.; Begović, L.; Tripić, N.; Piškor, A.; Cesar, V. Evaluation of light-dependent photosynthetic reactions in reynoutria japonica houtt. leaves grown at different light conditions. Front. Plant Sci. 2021, 12, 1–13. [Google Scholar] [CrossRef]
  34. Pavlović, I.; Mlinarić, S.; Tarkowská, D.; Oklestkova, J.; Novák, O.; Lepeduš, H.; Bok, V.V.; Brkanac, S.R.; Strnad, M.; Salopek-Sondi, B. Early brassica crops responses to salinity stress: A comparative analysis between chinese cabbage, white cabbage, and kale. Front. Plant Sci. 2019, 10, 1–16. [Google Scholar] [CrossRef] [PubMed] [Green Version]
  35. Rapacz, M.; Sasal, M.; Kalaji, H.M.; Kościelniak, J. Is the OJIP test a reliable indicator of winter hardiness and freezing tolerance of common wheat and triticale under variable winter environments? PLoS ONE 2015, 10, 1–18. [Google Scholar] [CrossRef] [Green Version]
  36. Kalaji, H.M.; Jajoo, A.; Oukarroum, A.; Brestic, M.; Zivcak, M.; Samborska, I.A.; Cetner, M.D.; Łukasik, I.; Goltsev, V.; Ladle, R.J. Chlorophyll a fluorescence as a tool to monitor physiological status of plants under abiotic stress conditions. Acta Physiol. Plant. 2016, 38, 1–11. [Google Scholar] [CrossRef] [Green Version]
  37. Pollastrini, M.; Desotgiu, R.; Camin, F.; Ziller, L.; Gerosa, G.; Marzuoli, R.; Bussotti, F. Severe drought events increase the sensitivity to ozone on poplar clones. Environ. Exp. Bot. 2014, 100, 94–104. [Google Scholar] [CrossRef]
  38. Christen, D.; Schönmann, S.; Jermini, M.; Strasser, R.J.; Défago, G. Characterization and early detection of grapevine (vitis vinifera) stress responses to esca disease by in situ chlorophyll fluorescence and comparison with drought stress. Environ. Exp. Bot. 2007, 60, 504–514. [Google Scholar] [CrossRef]
  39. Baghbani, F.; Lotfi, R.; Moharramnejad, S.; Bandehagh, A.; Roostaei, M.; Rastogi, A.; Kalaji, H.M. Impact of Fusarium verticillioides on chlorophyll fluorescence parameters of two maize lines. Eur. J. Plant Pathol. 2019, 154, 337–346. [Google Scholar] [CrossRef] [Green Version]
  40. Zhori, A.; Meco, M.; Brandl, H.; Bachofen, R. In situ chlorophyll fluorescence kinetics as a tool to quantify effects on photosynthesis in Euphorbia cyparissias by a parasitic infection of the rust fungus Uromyces pisi. BMC Res. Notes 2015, 8, 1–7. [Google Scholar] [CrossRef] [PubMed] [Green Version]
  41. Warzecha, T.; Skrzypek, E.; Adamski, T.; Surma, M.; Kaczmarek, Z.; Sutkowska, A. Chlorophyll a fluorescence parameters of hulled and hull-less barley (Hordeum vulgare l.) DH lines inoculated with Fusarium culmorum. Plant Pathol. J. 2019, 35, 112–124. [Google Scholar] [CrossRef]
  42. Matić, M.; Vuković, R.; Vrandečić, K.; Čamagajevac, I.Š.; Ćosić, J.; Vuković, A.; Sabljić, K.; Sabo, N.; Dvojković, K.; Novoselović, D. Oxidative status and antioxidative response to Fusarium attack and different nitrogen levels in winter wheat varieties. Plants 2021, 10, 611. [Google Scholar] [CrossRef]
  43. Vaughan, M.; Backhouse, D.; del Ponte, E.M. Climate change impacts on the ecology of Fusarium graminearum species complex and susceptibility of wheat to Fusarium head blight: A review. World Mycotoxin J. 2016, 9, 685–700. [Google Scholar] [CrossRef] [Green Version]
  44. Spanic, V.; Cosic, J.; Zdunic, Z.; Drezner, G. Characterization of agronomical and quality traits of winter wheat (Triticum Aestivum L.) for Fusarium head blight pressure in different environments. Agronomy 2021, 11, 213. [Google Scholar] [CrossRef]
  45. Zadoks, J.C.; Chang, T.T.; Konzak, C.F. A decimal code for the growth stages of cereals. Weed Res. 1974, 14, 415–421. [Google Scholar] [CrossRef]
  46. Sunic, K.; Kovac, T.; Loncaric, A.; Babic, J.; Sulyok, M.; Krska, R.; Drezner, G.; Spanic, V. Fusarium secondary metabolite content in naturally produced and artificially provoked FHB pressure in winter wheat. Agronomy 2021, 11, 2239. [Google Scholar] [CrossRef]
  47. Torres, A.M.; Palacios, S.A.; Yerkovich, N.; Palazzini, J.M.; Battilani, P.; Leslie, J.F.; Logrieco, A.F.; Chulze, S.N. Fusarium head blight and mycotoxins in wheat: Prevention and control strategies across the food chain. World Mycotoxin J. 2019, 12, 333–355. [Google Scholar] [CrossRef]
  48. Francesconi, S.; Balestra, G.M. The Modulation of stomatal conductance and photosynthetic parameters is involved in Fusarium head blight resistance in wheat. PLoS ONE 2020, 15, 1–21. [Google Scholar] [CrossRef]
Figure 1. Changes in the shape of the chlorophyll a fluorescence transient curves in flag leaves of winter wheat variety Golubica (a,g), El Nino (b,h), Galloper (c,i), Tika Taka (d,j), Vulkan (e,k) and Kraljica (f,l) measured at 3 (orange), 10 (gray) and 18 (yellow) days post-inoculation (dpi) at locations Osijek and Tovarnik. Each curve represents average kinetics of 20 replicates and time (ms) refers to time after onset of illumination during chlorophyll a fluorescence measurement. Average fluorescence data were normalized between O–P steps and plotted as difference kinetics ∆WOP. Average values measured in corresponding untreated control plants were used as referent value for each variety, measurement point and location.
Agronomy 11 02415 g001
Figure 2. Changes in the shape of the chlorophyll a fluorescence transient curves in flag leaves of winter wheat variety Golubica (a,g), El Nino (b,h), Galloper (c,i), Tika Taka (d,j), Vulkan (e,k) and Kraljica (f,l) measured at 3 (orange), 10 (gray) and 18 (yellow) days post-inoculation (dpi) at locations Osijek and Tovarnik. Each curve represents average kinetics of 20 replicates and time (ms) refers to time after onset of illumination during chlorophyll a fluorescence measurement. Average fluorescence data were normalized between O–J steps (K-band) and between O-K steps (L-band) and plotted as difference kinetics ∆WOJ (af) and ∆WOK (gl). Average values measured in corresponding untreated control plants were used as referent value for each variety, measurement point and location.
Agronomy 11 02415 g002
Figure 3. Spider plots of selected JIP-test parameters in flag leaves of winter wheat variety Golubica (a,g), El Nino (b,h), Galloper (c,i), Tika Taka (d,j), Vulkan (e,k) and Kraljica (f,l) measured at 3 (green), 10 (blue) and 18 (yellow) days post-inoculation (dpi) at locations Osijek and Tovarnik. Values for inoculated plants are shown as difference compared to the untreated plants at the same time point for two locations separately. Statistically significant differences (ANOVA, Tukey’s HSD) in measured parameters in inoculated plants compared to corresponding untreated plants are indicated by asterix (*). Descriptions of used JIP-test parameters are presented in Table 1.
Agronomy 11 02415 g003
Figure 4. Changes in the shape of the chlorophyll a fluorescence transient curves in ears of winter wheat variety Golubica (a,g), El Nino (b,h), Galloper (c,i), Tika Taka (d,j), Vulkan (e,k) and Kraljica (f,l) measured at 3 (blue), 10 (yellow) and 18 (green) days post-inoculation (dpi) at locations Osijek and Tovarnik. Each curve represents average kinetics of 20 replicates and time (ms) refers to time after onset of illumination during chlorophyll a fluorescence measurement. Average fluorescence data were normalized between O–P steps and plotted as difference kinetics ∆WOP. Average values measured in corresponding untreated control plants were used as referent value for each variety, measurement point and location.
Agronomy 11 02415 g004
Figure 5. Changes in the shape of the chlorophyll a fluorescence transient curves in flag leaves of winter wheat variety Golubica (a,g), El Nino (b,h), Galloper (c,i), Tika Taka (d,j), Vulkan (e,k) and Kraljica (f,l) measured at 3 (blue), 10 (yellow) and 18 (green) days post-inoculation (dpi) at locations Osijek and Tovarnik. Each curve represents average kinetics of 20 replicates and time (ms) refers to time after onset of illumination during chlorophyll a fluorescence measurement. Average fluorescence data were normalized between O–J steps (K-band) and between O–K steps (L-band) and plotted as difference kinetics ∆WOJ (af) and ∆WOK (gl). Average values measured in corresponding untreated control plants were used as referent value for each variety, measurement point and location.
Agronomy 11 02415 g005
Figure 6. Spider plots of selected JIP-test parameters in ears of winter wheat variety Golubica (a,g), El Nino (b,h), Galloper (c,i), Tika Taka (d,j), Vulkan (e,k) and Kraljica (f,l) measured at 3 (green), 10 (blue) and 18 (yellow) days post-inoculation (dpi) at location Osijek and Tovarnik. Values for inoculated plants are shown as difference compared to the untreated plants at the same time point for two locations separately. Statistically significant differences (ANOVA, Tukey’s HSD) in measured parameters in inoculated plants compared to corresponding untreated plants are indicated by asterix (*) for each measurement point. Descriptions of used JIP-test parameters are presented in Table 1.
Agronomy 11 02415 g006
Table 1. List of JIP-test parameter used in the study including their calculations and descriptions [28,29,30]. Parameters written in bold are presented in the study and other parameters included in the table are required for their calculation.
Data extracted from the recorded ChlF transient
Minimal fluorescence intensity at 20 ms—O stepF0
Maximal fluorescence intensity—P stepFm
Fluorescence intensity at 300 μsF300
Fluorescence intensity at 2 ms—I stepFI
Fluorescence intensity at 30 ms—J stepFJ
Fluorescence intensity at any time t Ft
Time (in ms) to reach maximal fluorescence FMtFM
Total complementary area between fluorescence induction curve and F = FMArea
Fluorescence parameters derived from the extracted data
Maximal variable fluorescenceFV = Fm − F0
Relative variable fluorescence at 2 ms (J step)VJ = (FJ − F0)/(Fm − F0)
Relative variable fluorescence at 30 ms (I step)VI = (FI − F0)/(Fm − F0)
Relative variable fluorescence normalized to the amplitude at any time tWOP = (Ft − F0)/(Fm − F0)
Relative variable fluorescence normalized to the amplitude of the O–J phase (K-band)WOJ = (Ft − F0)/(FJ − F0)
Relative variable fluorescence normalized to the amplitude of the O–K phase (L-band)WOK = (Ft − F0)/(FK − F0)
Approximated initial slope (in ms−1) of the fluorescence transient V = f(t)M0 = (dV/dt)0 = 4 × (F300 − F0)/(FM − F0)
Quantum yields and efficiencies
Maximum quantum yield for primary
photochemistry
TR0/ABS ≡ φP0 = [1 − (F0/FM)] = Fv/FM
Quantum yield for electron transport (ET)ET0/ABS ≡ φE0 = (1 − F0/FM) × (1 − VJ)
Efficiency/probability for electron transport (ET), i.e., efficiency/probability that an electron moves further than QAET0/TR0 ≡ ψE0 = (1 − VJ)
Efficiency/probability with which an electron from the intersystem electron carriers moves to reduce end electron acceptors at the photosystem I (PSI acceptor) side (RE)RE0/ET0 ≡ δR0 = (1 − VI)/(1 − VJ)
Probability that PSII chlorophyll (Chl) molecule functions as RCγRC = ChlRC/Chltotal = RC/(ABS + RC)
QA-reducing RCs per PSII antenna Chl (reciprocal of ABS/RC)RC/ABS = γRC/(1 − γRC) = φP0 (VJ/M0)
Specific energy fluxes per active (QA− reducing) photosystem II (PSII) reaction center (RC)
Absorption flux (of antenna Chls) per active RCABS/RC = M0 × (1/VJ) × (1/φP0)
Trapping flux (leading to QA reduction) per active RCTR0/RC = M0 × (1/VJ)
Electron transport flux (further than QA) per active RCET0/RC = M0 × (1/VJ) × ψE0
Dissipation flux per active RCDI0/RC = (ABS/RC) − (TR0/RC)
Performance indexes
Performance index (potential) for energy conservation from
exciton to the reduction of intersystem electron acceptors
PIABS = [γRC/(1 − γRC)] × [φP0/(1 − φP0)] × [ψE0/(1 − ψE0)]
Performance index (potential) for energy conservation from
exciton to the reduction of PSI end acceptors
PITOTAL = PIABS × (δR0/1−δR0)
Table 2. Fusarium head blight (FHB) severity at 10 days post inoculation (dpi) and 18 dpi, AUDPC for general FHB (calculated from the percentage of bleached spikelets per plot at 10, 14, 18, 22 and 26 dpi), FHB incidence at 10 dpi and 18 dpi, AUDPC for Type I resistance (calculated from the percentage of diseased ears after assessing a random sample of 30 heads at 10, 14, 18, 22 and 26 days after inoculation) and grain yield (GY) decrease for six winter wheat varieties at two different locations (Osijek and Tovarnik).
VarietyFHB Severity at 10 dpiFHB Severity at 18 dpiAUDPC for FHB SeverityFHB Incidence
at 10 dpi
FHB Incidence
at 18 dpi
AUDPC for Type I ResistanceGY
Decrease (%)
Osijek
Golubica1.57.51044.852222243
El Nino0.59137323.524439
Galloper0011.53338
Tika Taka0.53433.518.521525
Vulkan12364.858.3512016
Kraljica24.5726.8518.52179
Tovarnik
Golubica039304.8511159
El Nino2.522.521311.54242154
Galloper011804.858713
Tika Taka0270011.8513834
Vulkan01.534035129
Kraljica00.5181.538014
Table 3. Mean squares from the analysis of variance for selected JIP-test parameters measured in flag leaves of six wheat varieties at two different locations (Osijek and Tovarnik) and three measurement points (3, 10 and 18 dpi). Treatment refers to artificially inoculated plants and untreated control plants. Description of used JIP-test parameters is presented in Table 1.
MS
Source of
Variation
dfTR0/ABSET0/ABSET0/TR0ABS/RCTR0/RCET0/RCDI0/RCPIABSRE0/ET0PITOTAL
Location (L)10.0164 *0.0844 *0.0695 *0.2011 *0.4948 *0.8105 *0.0650 *15.371 *0.0016 ns11.838 *
Variety (V)50.0008 *0.0100 *0.0116 *0.4886 *0.2943 *0.0417 *0.0283 *6.5287 *0.0675 *7.4672 *
Treatment (T)10.0014 *0.0120 *0.0257 *1.1816 *0.6566 *0.6015 *0.0765 *0.1362 ns0.0163 *2.2237 *
Measurement point (M)20.0010 *0.0013 ns0.0043 *2.5874 *1.5735 *0.6717 *0.1263 *3.5233 *0.3737 *52.807 *
L × V50.0003 ns0.0009 ns0.0009 ns0.0406 ns0.0226 ns0.0108 ns0.0042 ns0.4499 ns0.0121 *1.5749 *
L × T10.0008 *0.0286 *0.0512 *1.1390 *0.6550 *0.8227 *0.0665 *0.6890 ns0.0014 ns0.2751 ns
V × T50.0002 ns0.0014 ns0.0014 ns0.2623 *0.1551 *0.0378 *0.0149 *1.3500 *0.0015 ns1.5473 *
L × M20.0005 *0.0243 *0.0399 *1.3478 *0.9452 *0.7080 *0.0401 *2.1542 *0.0398 *0.3673 ns
V × M100.0004 *0.0021 *0.0020 *0.1023 *0.0587 *0.0206 *0.0081 *1.1179 *0.0028 *0.5757 *
T × M20.0023 *0.0007 ns0.0000 ns0.8547 *0.4265 *0.1553 *0.0748 *4.6259 *0.0105 *1.2659 *
L × V × T50.0001 ns0.0018 *0.0022 *0.0632 ns0.0415 *0.0112 ns0.0028 ns0.8940 *0.0044 *0.3705 ns
L × V × M100.0003 ns0.0021 *0.0024 *0.0865 *0.0448 *0.0169 *0.0077 *0.9259 *0.0015 ns0.3350 ns
L × T × M20.0009 *0.0107 *0.0159 *0.1900 *0.0870 *0.1127 *0.0199 *3.4890 *0.0046 *4.1613 *
V × T × M100.0001 ns0.0002 ns0.0003 ns0.0283 ns0.0164 ns0.0036 ns0.0024 ns0.2175 ns0.0018 ns0.3449 ns
L × V × T × M100.0002 ns0.0015 *0.0018 *0.0339 ns0.0199 ns0.0092 ns0.0033 ns0.6381 *0.0033 *0.5676 *
ns—not significant; *—statisticaly significant at p < 0.05; df—degrees of freedom; MS—mean sum of squares.
Table 4. Mean squares from the analysis of variance for selected JIP-test parameters measured in ears of six wheat varieties at two different locations (Osijek and Tovarnik) and three measurement points (3, 10 and 18 days post-inoculation). Treatment refers to artificially inoculated plants and untreated control plants. Descriptions of used JIP-test parameters are presented in Table 1.
MS
Source of
Variation
dfTR0/ABSET0/ABSET0/TR0ABS/RCTR0/RCET0/RCDI0/RCPIABSRE0/ET0PITOTAL
Location (L)10.1965 *0.0047 *0.1776 *11.822 *1.6843 *3.0867 *4.5816 *10.468 *0.0003 ns14.352 *
Variety (V)50.0101 *0.0523 *0.0491 *1.8584 *0.6258 *0.0928 *0.3545 *11.416 *0.0894 *8.8653 *
Treatment (T)10.0375 *0.0107 *0.0006 ns3.9920 *0.8694 *0.3737 *1.1355 *10.060 *0.0367 *12.178 *
Measurement point (M)20.0217 *1.0873 *1.9154 *4.4020 *1.3606 *14.373 *0.8684 *89.485 *0.0273 *99.214 *
L × V50.0046 *0.0045 *0.0033 *0.4963 *0.1504 *0.0404 ns0.1309 *1.5515 *0.0061 *3.2458 *
L × T10.0134 *0.0014 ns0.0204 *0.2670 ns0.0000 ns0.1007 *0.2613 *0.0584 ns0.0040 ns0.1454 ns
V × T50.0021 *0.0036 *0.0092 *0.3110 *0.1135 ns0.0825 *0.0627 *0.6261 *0.0218 *6.2946 *
L × M20.0028 *0.2210 *0.3933 *0.3258 *0.3597 *1.5361 *0.0008 ns22.316 *0.0954 *38.717 *
V × M100.0024 *0.0093 *0.0104 *0.4299 *0.2365 *0.1653 *0.0604 *0.8278 *0.0235 *4.4150 *
T × M20.0060 *0.0091 *0.0065 *0.1906 ns0.0117 ns0.0203 ns0.1246 *2.8933 *0.0367 *2.1364 *
L × V × T50.0026 *0.0053 *0.0060 *0.2133 ns0.1064 ns0.0394 ns0.0572 *0.6986 *0.0089 *4.0147 *
L × V × M100.0022 *0.0039 *0.0077 *0.2696 *0.1467 *0.0460 *0.0489 *0.6680 *0.0115 *2.8763 *
L × T × M20.0009 ns0.0073 *0.0069 *1.1995 *0.9113 *0.5624 *0.0199 ns0.0269 ns0.0609 *0.9325 ns
V × T × M100.0023 *0.0036 *0.0030 *0.4347 *0.1987 *0.0663 *0.0678 *1.3925 *0.0229 *3.1128 *
L × V × T × M100.0023 *0.0058 *0.0079 *0.3705 *0.1362 *0.0561 *0.0738 *1.0498 *0.0157 *3.7578 *
ns—not significant; *—statisticaly significant at p < 0.05; df—degrees of freedom; MS—mean sum of squares.
Publisher’s Note: MDPI stays neutral with regard to jurisdictional claims in published maps and institutional affiliations.

