Article

Alternate Wetting and Drying (AWD) Mitigates the Decline in Grain Filling of Basmati 370 Due to Low Temperature in Tropical Highlands

by
Takahiro Kakehashi
1,†,
Mayumi Kikuta
2,3,†,
Daniel Makori Menge
4,
Emily Waringa Gichuhi
4,
Hiroaki Samejima
5 and
Daigo Makihara
6,*
1
Graduate School of Bioagricultural Sciences, Nagoya University, Nagoya 464-8601, Japan
2
Applied Social System Institute of Asia, Nagoya University, Nagoya 464-8601, Japan
3
Graduate School of Integrated Sciences for Life, Hiroshima University, Higashihiroshima 739-8528, Japan
4
Kenya Agricultural and Livestock Research Organization, Kerugoya P.O. Box 298-10300, Kenya
5
National Agriculture and Food Research Organization, Hokkaido Agricultural Research Center, Sapporo 062-8555, Japan
6
International Center for Research and Education in Agriculture, Nagoya University, Nagoya 464-8601, Japan
*
Author to whom correspondence should be addressed.
Contributed equally.
Agronomy 2021, 11(11), 2345; https://doi.org/10.3390/agronomy11112345
Submission received: 5 October 2021 / Revised: 15 November 2021 / Accepted: 17 November 2021 / Published: 19 November 2021

Abstract

:
In the rice growing area of Kenya’s highlands, the development of a water-saving rice cultivation system is a key strategy because the shortage of irrigation water is a frequently occurring problem. The purpose of this study was to investigate the effect of alternate wetting and drying (AWD) on the growth and yield of rice under the unique cultivation environment of tropical highlands. Field experiments were performed over a period of four years (2014–2017) in a paddy field. Dry matter production of a lowland variety, Basmati 370, was greater under continuous flooding (CF) than under AWD. In years with low minimum temperature (less than 15 °C) during the reproductive and ripening stages, filled grain ratios were significantly higher under AWD than under CF. Accordingly, higher dry matter production under CF did not contribute to grain yield. In the years when rice was not exposed to low minimum temperature during the reproductive and ripening stages, filled grain ratio did not decrease even under CF. Therefore, there was no difference between filled grain ratio under AWD and CF. Our results indicated that AWD could mitigate the decline in grain filling, induced by low minimum temperature during the reproductive and ripening stages in Basmati 370, under the cultivation conditions in tropical highlands. Although AWD may reduce the above-ground biomass, its mitigation effect on grain filling could outweigh this drawback and can still be beneficial to rice farmers in the tropical highlands.

1. Introduction

Rice is a staple food for over half the world’s population and rice consumption is increasing with population growth [1]. Approximately, 75% of the world’s rice production is derived from irrigated lowland fields, which receive some 34–43% of the total world’s irrigation water [2]. However, water resources for the agricultural sector have been decreasing along with a rapid increase in non-agricultural demands for water and global climate change [3]. Therefore, a key strategy for sustainable rice production would be developing water-saving rice cultivation systems.
Alternate wetting and drying (AWD) is an irrigation practice that can reduce water consumption in rice fields without sacrificing yield. Its use has been proposed and tested in many regions [4,5,6,7,8,9]; however, the effect of AWD on rice yield has produced inconsistent results. For instance, some studies on rice reported higher grain yields under AWD than under continuously flooded conditions [10,11,12,13], while others reported AWD to decrease grain yields [14,15,16]. The conflicting results of these reports suggest that yield responses under AWD may depend on the cultivation environment and rice variety. Consequently, for successful local implementations of AWD, reliable validation and adaptation trials are needed.
In Kenya, the demand for rice is increasing due to changes in eating habits and increasing urban population [17]. In 2017, Kenya imported 634,852 t of rice, costing the country 264 million USD [18]. Thus, boosting rice production is an urgent issue for food security in the country. In Kenya, approximately 80% of rice is produced in irrigated lowland fields [19,20]. The Mwea Irrigation Scheme, which is located 100 km northeast of Nairobi at the southern foot of Mt. Kenya, is the largest rice-growing irrigation scheme in Kenya, covering 9000 ha and accounting for 78% of the irrigated paddy fields [20]. Hence, Mwea would be one of the most important areas for increasing rice production in Kenya.
The location of Mwea (near the equator, at approximately 1200 m above sea level) ensures high levels of radiation—typical for tropical regions—and large day–night temperature differences that are typical for highlands. The main rice variety grown in Mwea is Basmati 370, a lowland variety favored by consumers, especially in the urban areas, for its aroma and high cooking quality [21]. Most farmers in Mwea grow rice once a year, sowing between July and August and harvesting between December and January [21,22,23]. However, as shortage of irrigation water is often a problem in Mwea, some farmers may start sowing around September-November, depending on the availability of irrigation water [21]. Due to the high-altitude location of Mwea, the air temperature can sometimes drop below 18 °C during the growing periods, which can reduce filled-grain ratio in Basmati 370 [24,25]. In order to improve the rice productivity, this problem needs to be addressed.
Under such cultivation environment, AWD has been introduced as a part of the technology packages for rice cultivation, such as System of Rice Intensification (SRI) and Water Saving Rice Culture (WSRC) [17,26]. These technology packages improved rice grain yield compared to conventional continuous flooding (CF) cultivation [17,27]. However, the factors responsible for the yield improvement have not been clarified. Moreover, SRI and WSRC are technology packages that combine AWD and other cultivation technologies, so it cannot be said that AWD itself was evaluated.
Clarifying whether the yield response under AWD depends on the cultivation environment and rice variety will provide useful information for developing a water management strategy based on the actual condition. In this study, we investigated the effects of AWD on rice growth and yield over four cropping seasons under the unique cultivation environment in the tropical highlands and analyzed the reasons behind the differential effects of AWD on rice yields across these cropping seasons.

2. Materials and Methods

The study was conducted at the experimental field of the Kenya Agricultural and Livestock Research Organization (KALRO), Mwea Centre, Kerugoya County, Kenya (0°39′ S, 37°22′ E), at an elevation of 1162 m above sea level, during the rice growing season, from 2014 to 2017. The soil of the experimental field was Nitisol. At the start of the experiment, it contained 3.3% total C, 0.25% total N (C/N coda), 753 mg kg−1 available phosphorous pentoxide (Bray II), 0.35 cmol (+) kg−1 exchangeable K, determined after extraction with 1 M ammonium acetate (pH 7.0), 0.52 mg kg−1 Cu, 188 mg kg−1 Fe, 0.19 mg kg−1 Zn, and 43 mg kg−1 Mn. Cu, Fe, Zn, and Mn were extracted by 0.1 N HCl and determined by inductively coupled plasma-atomic emission spectroscopy (ICPE-9000; Shimadzu Co. Ltd., Kyoto, Japan). Soil pH (H2O) was 5.24. Temperature, rainfall, and solar radiation were recorded by a weather station (Weather Bucket; Agriweather Inc., Sapporo, Japan) located at the research farm.
The experiments comprised two water management regimes: CF and AWD. The two treatments were laid out in randomized block designs—the size of each plot was 4 m × 7 m in all years—in three replications. To prevent the movement of water from CF to AWD, the plots were separated by bands (approx. 1 m width) and enclosed by buried PVC sheets (Aze sheet; Iwatani Corporation, Osaka, Japan, 0.5 mm thick, and 45 cm high). In the AWD plots, soil was maintained with shallow water depth, and irrigation was stopped after the first application of chemical fertilizer, at 7−10 days after transplanting (DAT). In the AWD plots, irrigation water was applied approximately 5 cm above the soil surface when the perched water table reached −20 cm. This cycle was repeated until the late-ripening stage. In the CF plots, water depth was maintained at approximately 5 cm above the soil surface until the late-ripening stage. Approximately 10 d before harvesting, irrigation water was drained in both water treatments. The depth of the perched water tables was measured using a plastic pipe (diameter 20 cm) with numerous small holes inserted in the soil. Soil water potential at 20 cm of soil depth was also measured using a tensiometer (pF meter DIK8333; Daiki Rika Kogyo Co. Ltd., Saitama, Japan). Soil electrical conductivity (EC) and temperature were measured weekly (at an approximately 5 cm soil depth) from transplanting to heading time, using an EC meter (FieldScout Direct Soil EC Meter 2265FSTP; Spectrum Technologies, Inc., Aurora, IL, USA). Soil pH and oxidation-reduction potential (ORP) were also measured weekly (at the same soil depth) using a pH meter (FieldScout SoilStik pH Meter 2105; Spectrum Technologies, Inc.), and an ORP meter (ORP Meter 2010; Spectrum Technologies, Inc.), respectively.
The rice variety used in the study was Basmati 370, which is widely grown in the Mwea region in Kenya. In Mwea, farmers usually start sowing in July according to the allocation of irrigation water [22,23]. The peak season of sowing is from July to August. However, depending on the availability of irrigation water, the sowing time is often delayed by 1–2 months [21]. Therefore, the trials were conducted with early sowing in 2015 and 2017 and late sowing in 2014 and 2016 to replicate the actual sowing practices of farmers. Seeds of Basmati 370 were soaked in water for two days and sowed in a seedbed. Sowing was conducted on 25 September, 26 August, 17 September, and 9 July in 2014, 2015, 2016, and 2017, respectively. In all plots, 15 t ha−1 of manure, made from cow dung, was applied in the soil before transplanting. The grain yields of this rice variety sown between July and February were reported to be comparable in the Mwea region [23]. Seedlings were manually transplanted, with one seedling per hill, approximately 14 days after sowing. The transplanting density was 30 cm between rows and 30 cm between plants in a row. Seven DAT, 25 kg ha−1 of N, P, and K was applied in the form of NPK (17:17:17), with an additional 25 kg ha−1 of N fertilizer applied 21 and 54 DAT in the form of ammonium sulfate.
Plant growth measurements were performed on five randomly selected plants from each plot. Number of tillers and plant length were regularly measured from tillering to heading stage. The Soil Plant Analysis Development (SPAD) values for leaf chlorophyll content were regularly measured with a SPAD meter (SPAD-502 plus; Konica Minolta Inc., Tokyo, Japan). Heading date was defined as the point, where more than half of panicles had emerged from the plants’ sheath. Plants were then harvested approximately 40 days after heading. In 2014, we selected three portions of 1.44 m2 from each plot and the above-ground part was harvested manually. In 2015, 2016, and 2017, 1 m2 of the above-ground part was harvested from each plot. After measuring the number of panicles, grains were manually removed from the panicle and dried in the open air. The harvested grains were placed in fresh water; subsequently, the grains that floated were defined as unfilled grains (immature grains + sterile grains), whereas those that sank grains were defined as filled grains. Both filled and unfilled grains were dried in the air and counted. Filled grain ratio was calculated as follows: filled grains (sunken grains)/total grains × 100. The weight of 1000-grain was measured for filled grains, and grain moisture content of the grains was measured by a grain moisture tester (Riceter f512; KETT Electric Laboratory, Tokyo, Japan). Rice straws were dried in an oven at 80 °C for more than three days, and their dry matter weights were determined. Harvest index (HI) was calculated by dividing the grain weight by the total above-ground biomass.
Analysis of variance (ANOVA) was performed using Statistical Analysis System (version 9.0) (SAS Institute Inc., Cary, NC, USA) to assess the main effects of cultivation year, water treatment, and their interactions. Means of growth and yield parameters were separated using the least significant difference test at p < 0.05 in Statistical Analysis System (version 9.0) (SAS Institute Inc., Cary, NC, USA).

3. Results

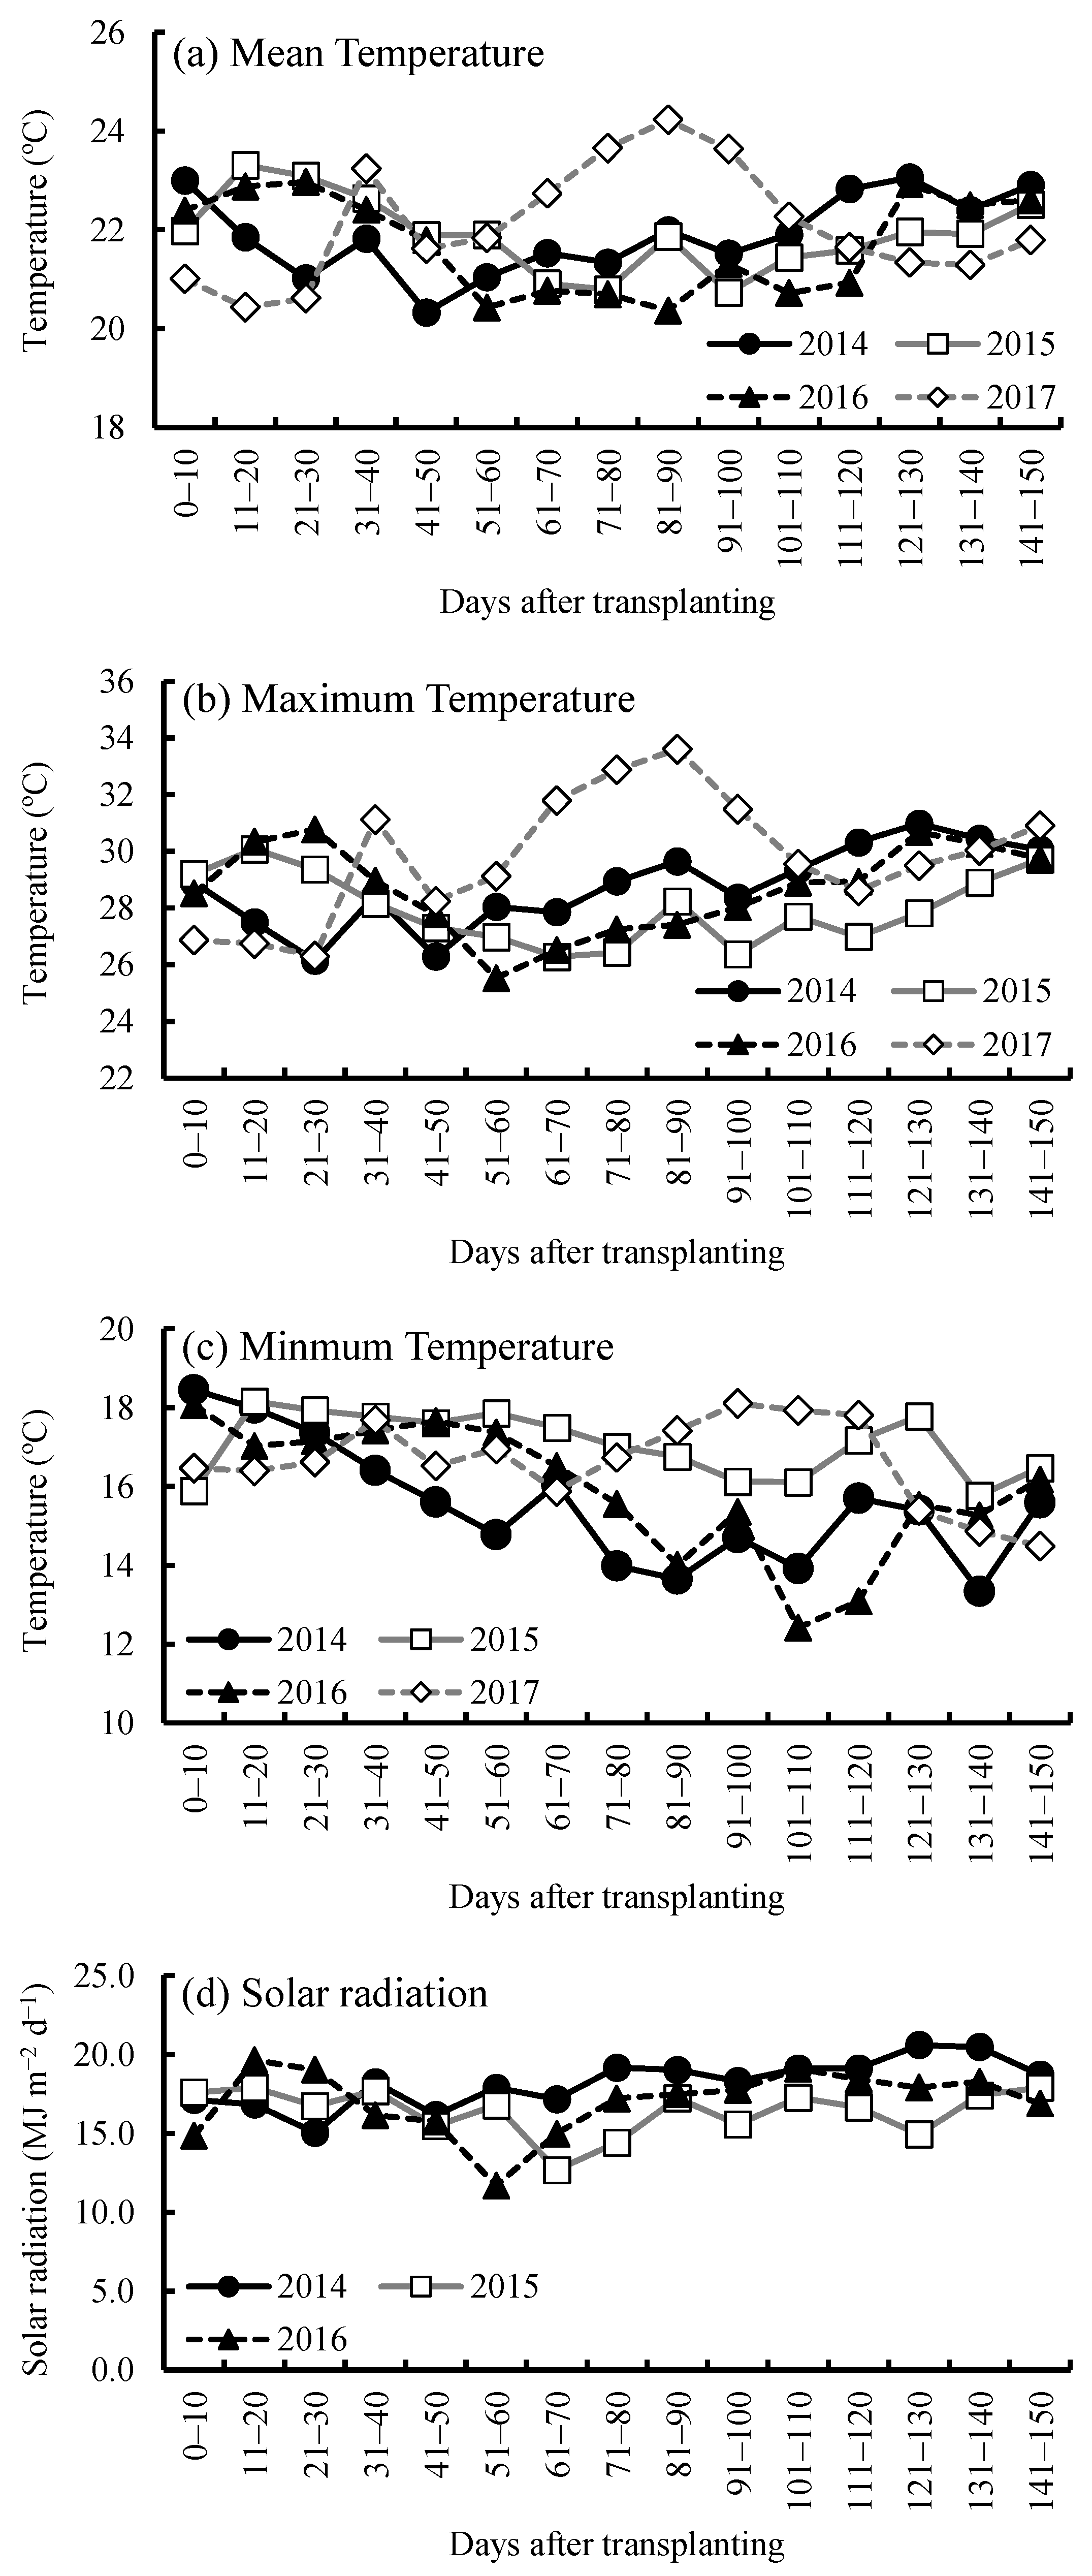
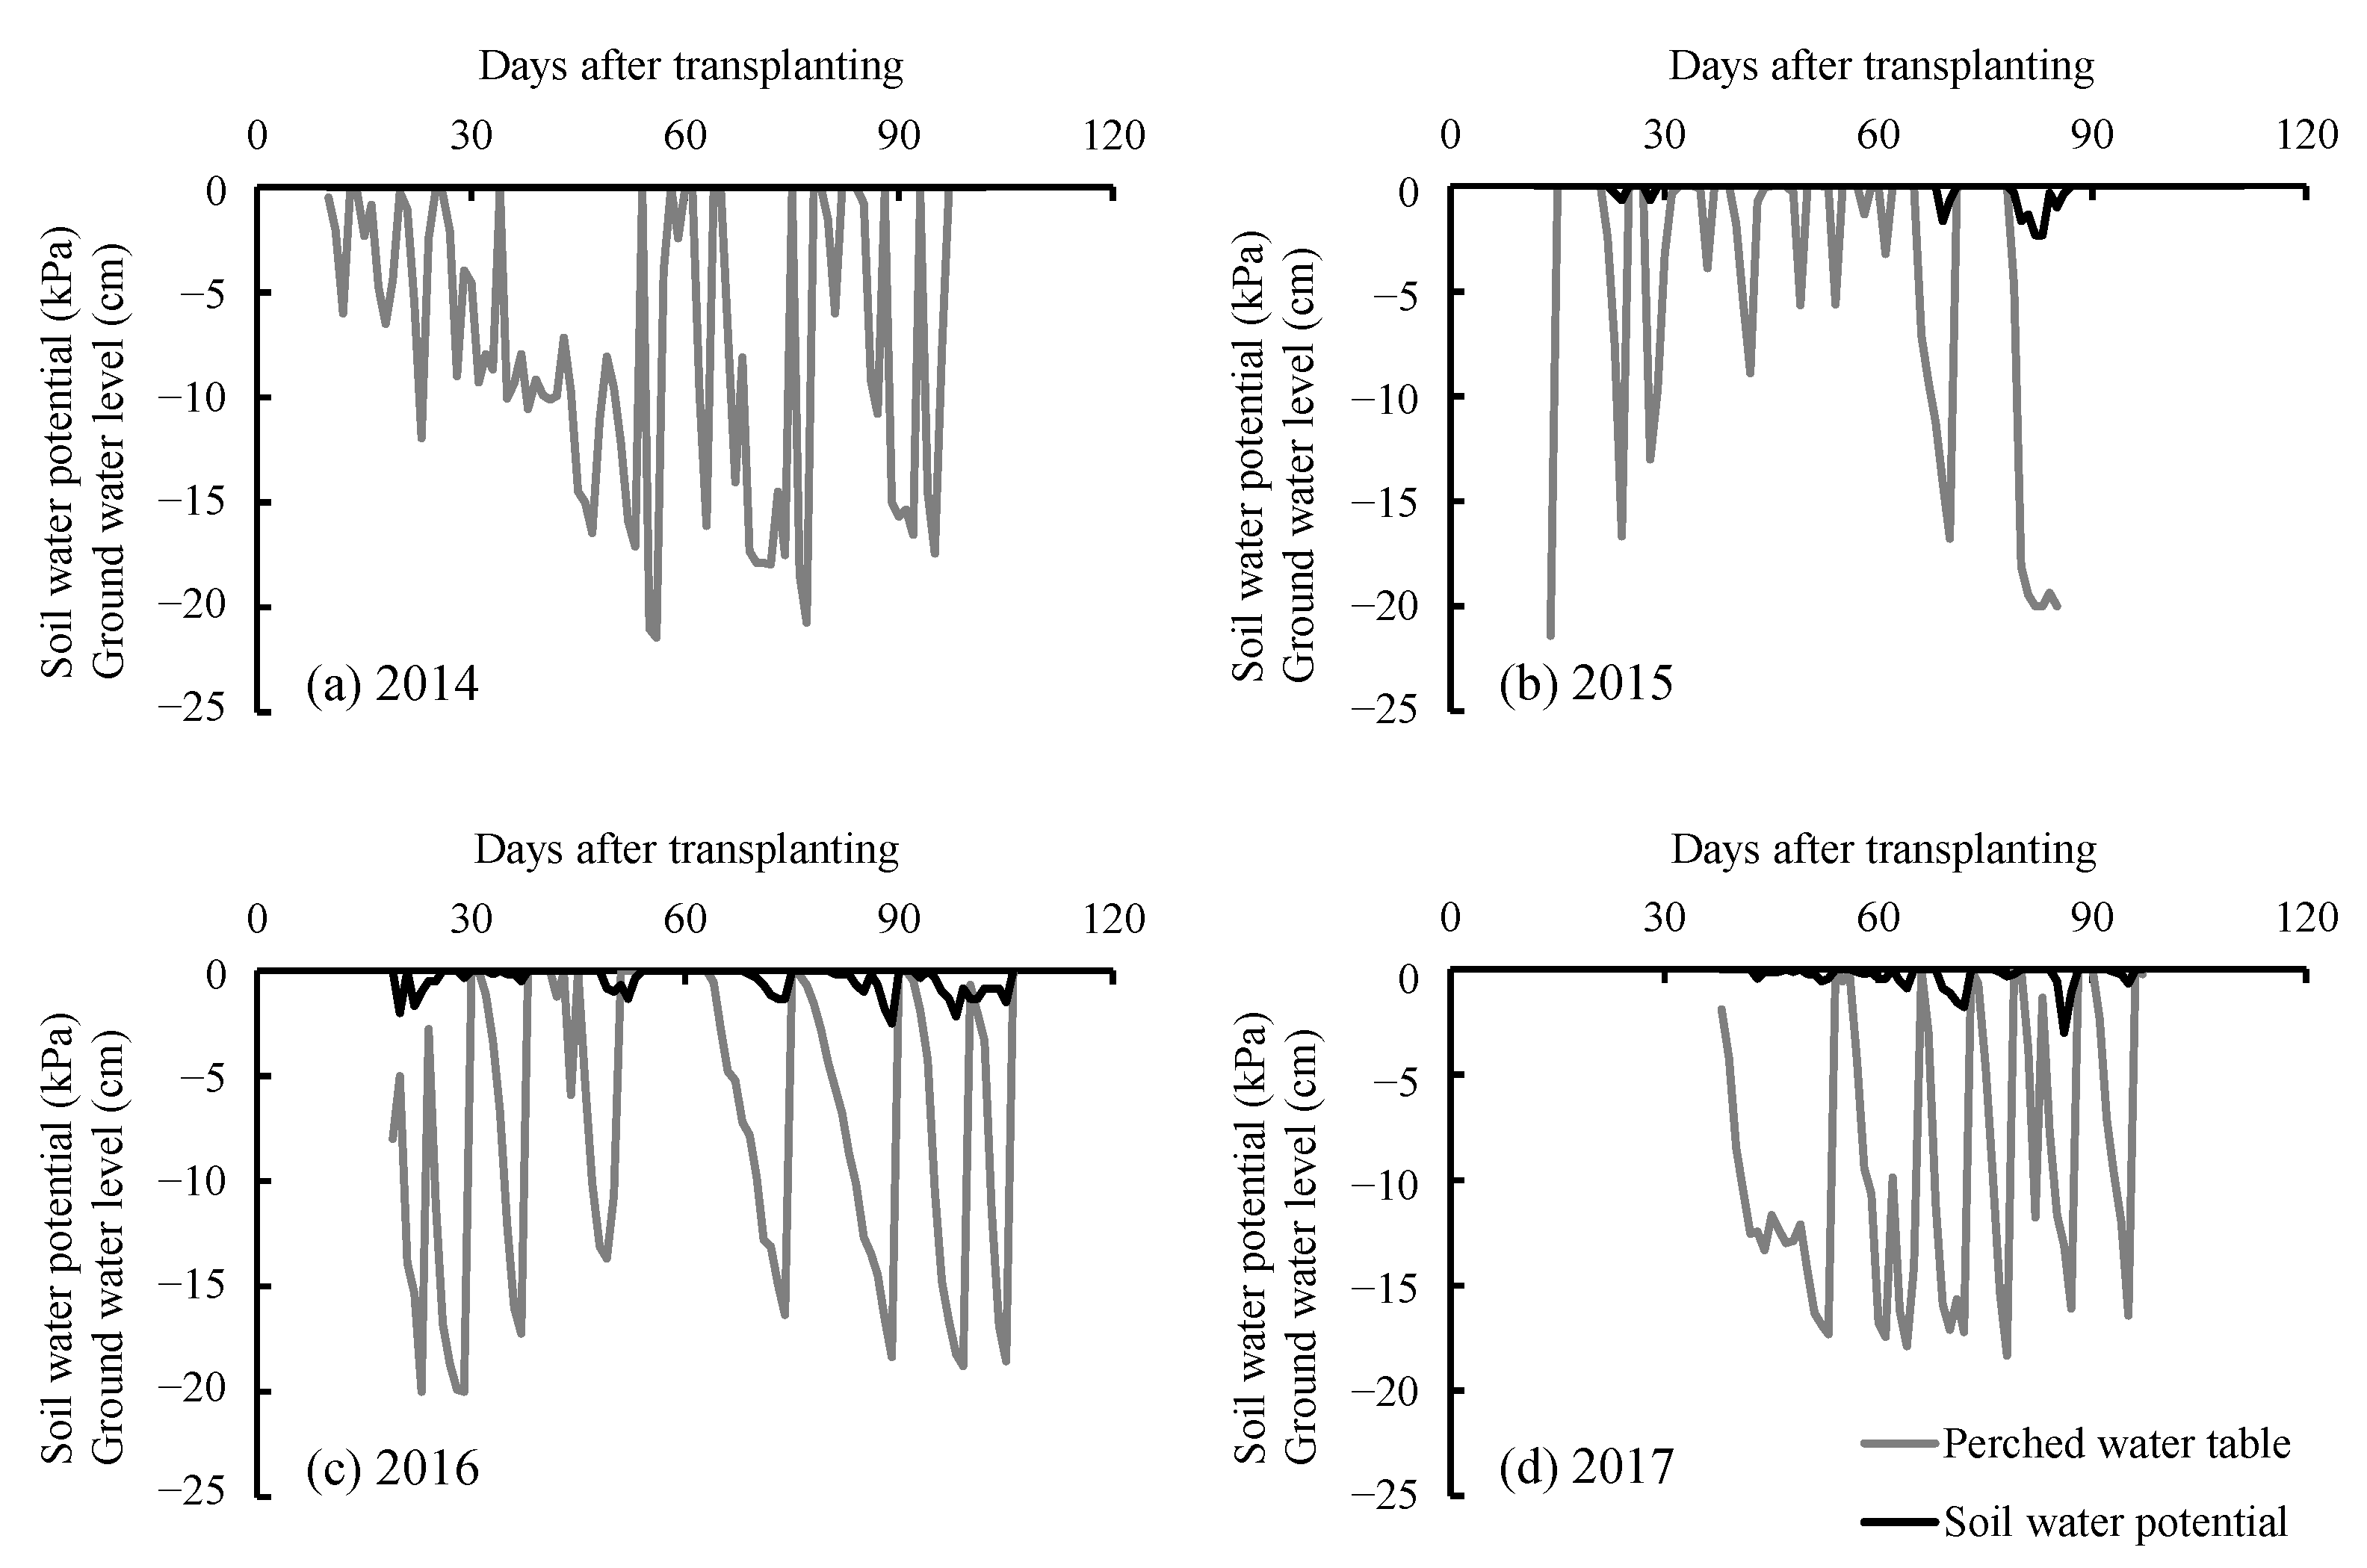
3.1. Weather Conditions and Soil Water Environment in the Experimental Field

Each year the average daily mean temperatures, during the rice growing season, were in the same range (21.8 °C in 2014, 21.9 °C in 2015, 21.5 °C in 2016, and 22.1 °C in 2017) (Figure 1). The difference in the average daily maximum temperatures were also small, except for 2017 (28.5 °C in 2014, 27.9 °C in 2015, 28.3 °C in 2016, and 29.7 °C in 2017). Average daily minimum temperature was slightly higher in 2015 (17.1 °C) and 2017 (16.8 °C) than in 2014 (15.7 °C) and 2016 (16.0 °C). Total rainfall during rice growing season was greater in 2015 and 2017 than in 2014 and 2016; 201 mm in 2014; 447 mm in 2015, 193 mm in 2016, and 430 mm in 2017. Solar radiation was in the range of 11.7 to 20.6 MJ m−2 d−1. The mean solar radiation during the period from transplanting to heading was 6.2% higher in 2014 than in 2015 and 2016 (Table 1). Soil water potential was more than −2.5 kPa in all the plots subjected to AWD during the growing season (Figure 2). The perched water table reached 15 cm below the soil surface 7–8 times during the 2014, 2016, and 2017 growth periods, but remained higher in 2015—reaching below 15 cm only four times—because of greater precipitation.
During the rice-growing period, soil temperature in AWD was comparable with that in CF, in all the years (Table 1). Soil EC under AWD was lower than that under CF, except in 2017. However, soil pH under AWD was slightly lower than that under CF in all years. Due to soil reduction under CF and aerobic conditions under AWD, the ORP under CF was lower than that under AWD.

3.2. Plant Growth, Yield, and Yield Components

There were no AWD-induced changes in plant length, the number of tillers, and SPAD value in all the years, except for the SPAD value in 2017 (Table 2). Water management did not alter the heading date, except that it was delayed 6 days by AWD in 2014 (Table 3).
Only the individual effect of year was significant for all factors (Table 4). Water management had significant effects on the number of grains per panicle and per square meter, filled grain ratio, above-ground biomass, and HI. The two-way ANOVA interaction between year and water management was significant for number of grains per square meter, filled grain ratio, grain yield, and HI.
No significant differences between CF and AWD in each year were observed for panicle number per plant, number of grains per panicle and 1000-grain weight, except number of grains per panicle in 2014. The number of grains per square meter was higher in CF than in AWD in 2014 and 2015; however, in 2016 and 2017, there was no significant difference between them. The filled grain ratio was significantly lower for CF than for AWD in both 2014 and 2016, whereas no significant difference among the treatments was observed in 2015 and 2017. Above-ground biomass in AWD was lower than that in CF. Grain yield in AWD was higher than that in CF in 2016, but lower in 2015. In 2014 and 2017, there was no significant difference in grain yield between AWD and CF. The HI showed a similar trend for the filled grain ratio.

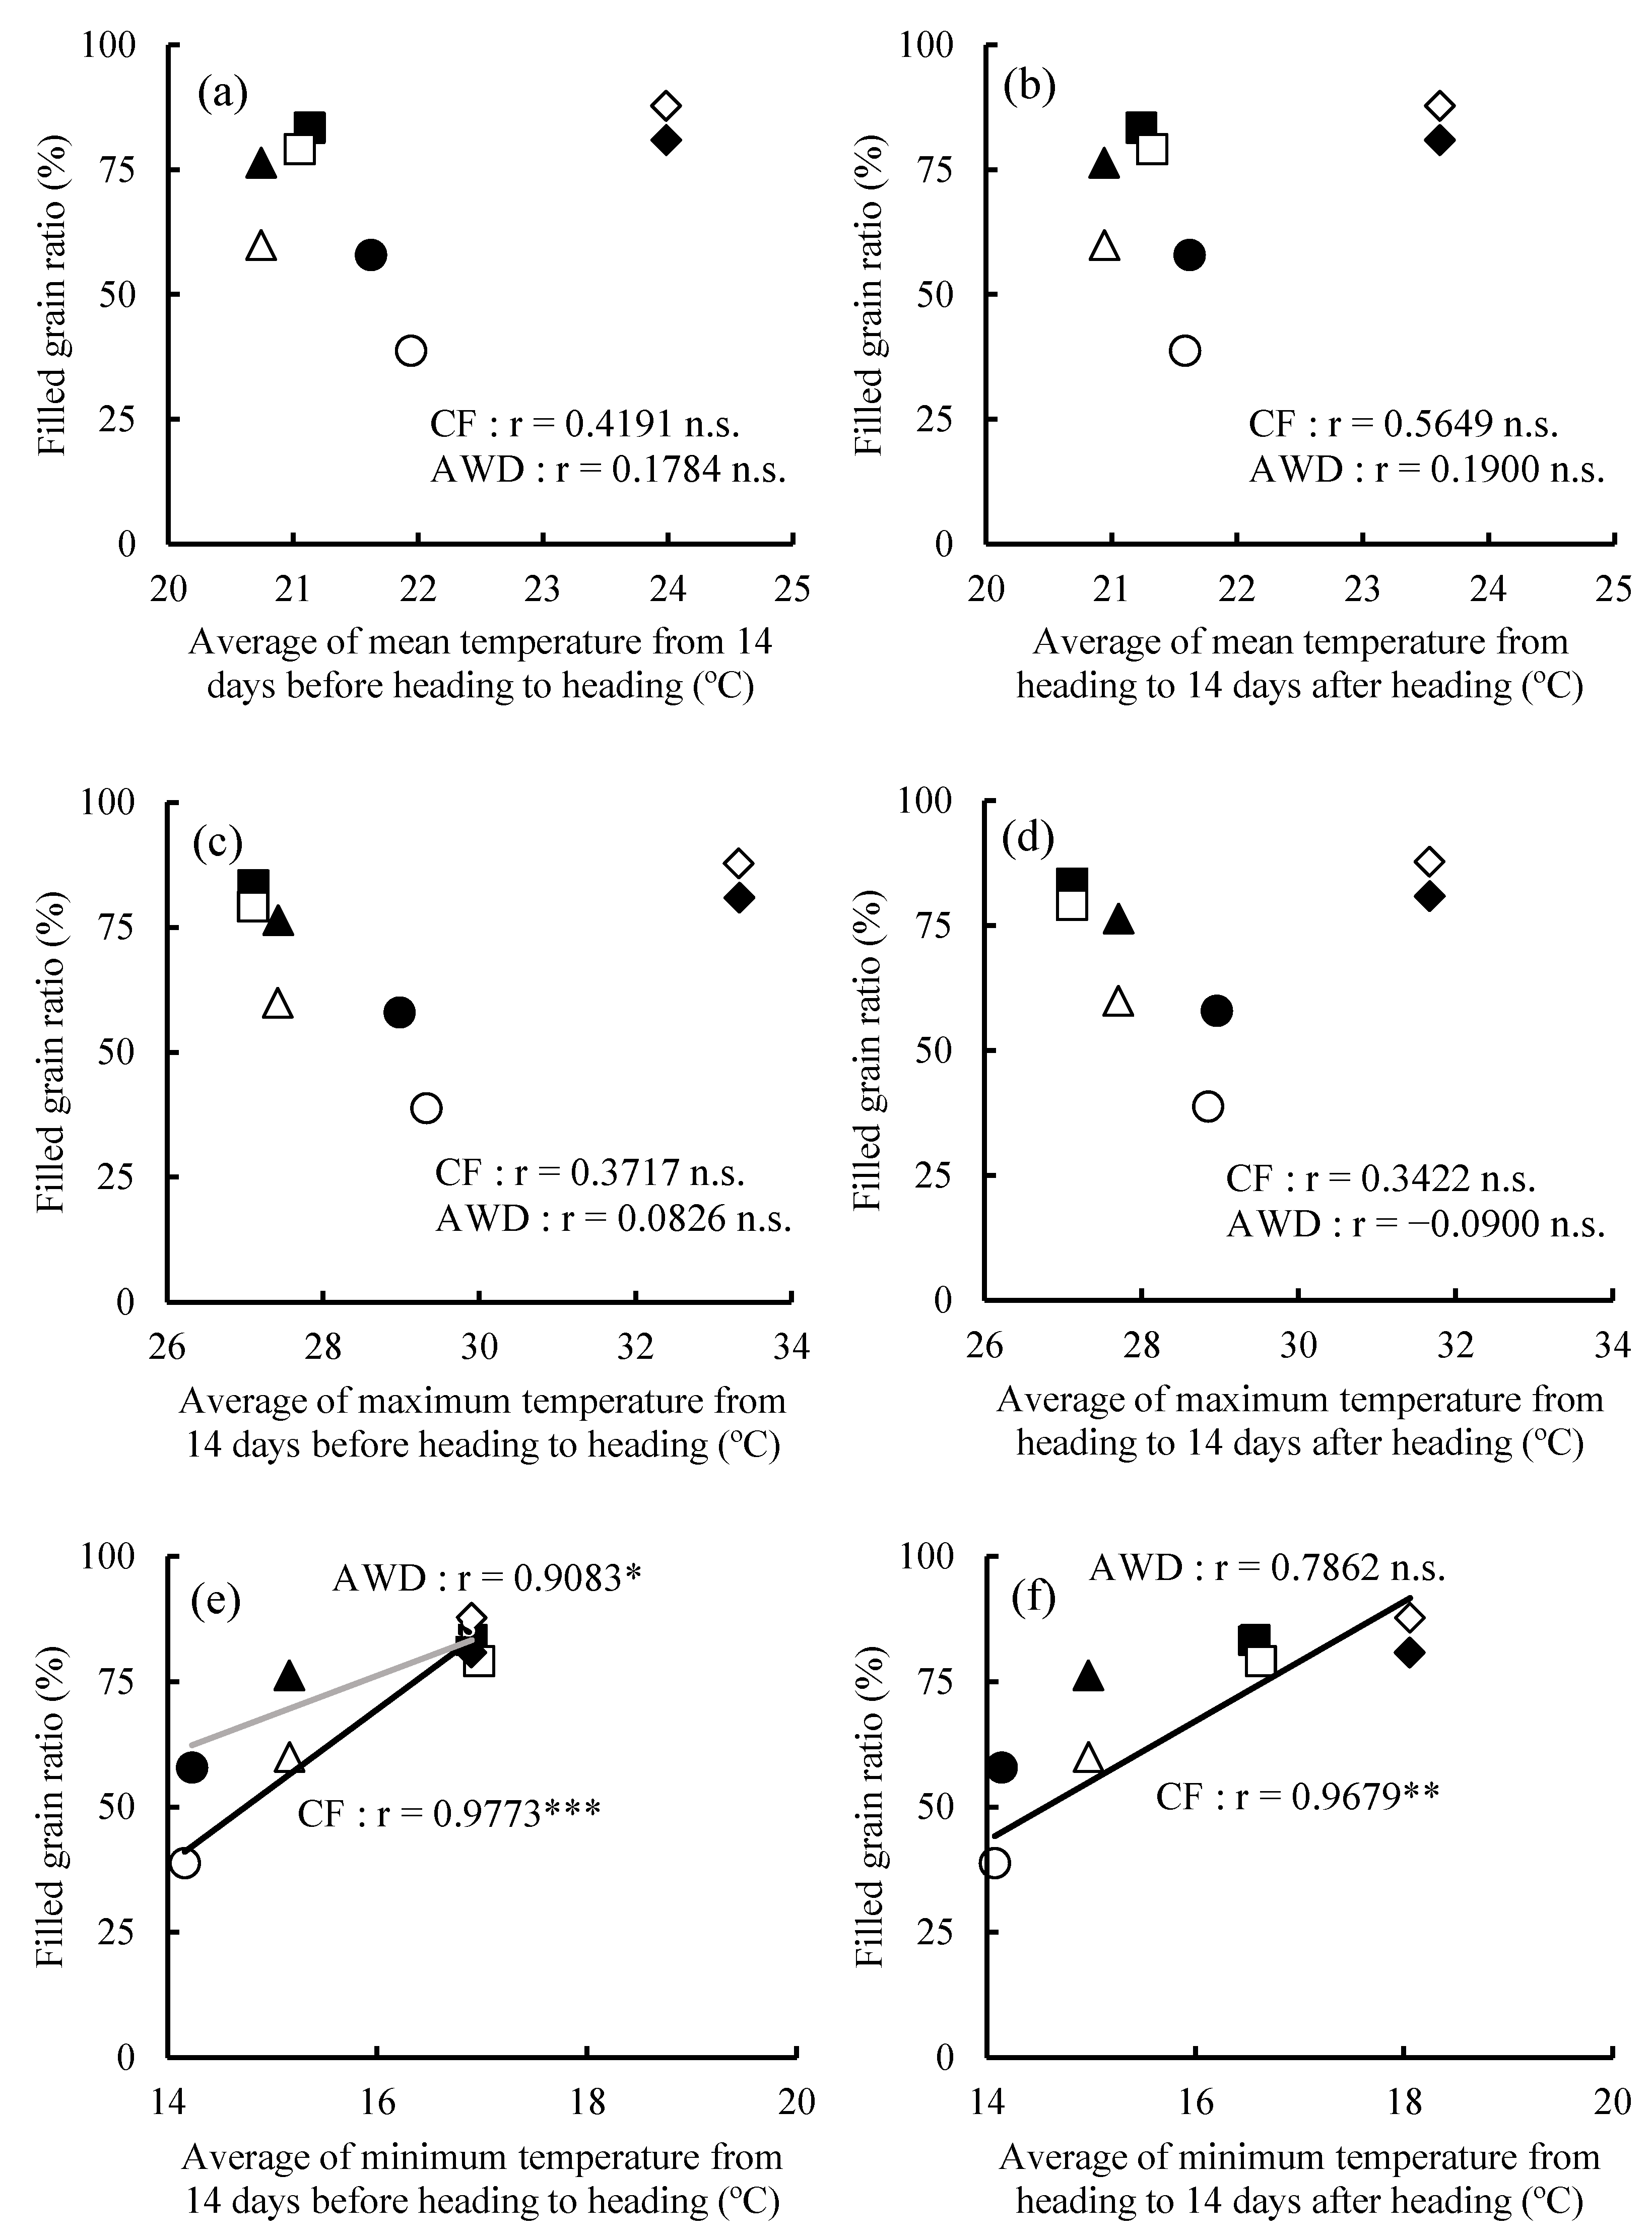
3.3. Analysis of Yield Determinants

Grain yield had the highest positive correlation with the filled grain ratio in both 2014 and 2016 (Table 5). Additionally, there was a strong positive correlation between grain yield and HI in 2016. In 2015 and 2017, grain yield had the highest positive correlation with number of grains per square meter and above-ground biomass. In 2015, grain yield was positively correlated with the panicle number and the number of grains per panicle. However, no statistically significant correlation was observed between grain yield and 1000-grain weight in any year.
Table 6 shows the average mean, maximum, and minimum temperatures from 14 days before heading to heading, and from heading to 14 days after heading, which greatly affected the filled grain ratio. In 2017, temperatures during the 14-day period before and after heading tended to be higher than other years, while in 2014 and 2016, the minimum temperatures during this period were lower than in 2015 and 2017, respectively, although the mean and maximum temperatures stayed the same as in other years.
For both under CF and AWD, filled grain ratio was positively and significantly correlated with the average minimum temperatures for the period from 14 days before heading to heading (Figure 3e). Moreover, a significant correlation was obtained between filled grain ratio and average minimum temperature during the period from heading to 14 days after heading under CF, but not under AWD (Figure 3f). However, there was no significant correlation between filled grain ratio and average daily mean and maximum temperature during the period of 14 days before and after heading (Figure 3a–d).

4. Discussion

The results of our trials revealed that AWD had negative effects on the above-ground biomass (Table 4). In terms of vegetative growth, Basmati 370—being a lowland variety—is considered to have been adapted to CF rather than AWD conditions. However, the grain yield responses to the water management varied depending on the year of cultivation (Table 4). Grain yield was affected by water management in all years, but the direction of the AWD-induced effect was completely different depending on the year. In 2015, AWD had a negative effect on grain yield, whereas it had a positive effect in 2016. In 2014 and 2017, AWD did not change grain yield. Thus, even though AWD tended to reduce dry matter production of this lowland rice variety in the Mwea region, the effect of AWD on grain yield was not consistent.
We have discussed the causes for the differential effect of AWD on grain yield. In general, under non-stressed conditions, grain yield of rice is mainly determined by above-ground biomass as source size, and number of grains per square meter as sink size [28,29]. In our study, the grain yield was determined by the source and sink size only in 2015 and 2017 (Table 5). The main determinant of grain yield in 2014 and 2016 was filled grain ratio, which was affected by the cultivation environment rather than the source and sink size.
Under unfavorable weather conditions, such as low temperature, the HI, which is a measure of the distribution efficiency of photosynthetic assimilates to grains, is strongly and positively correlated with grain yield [30]. The results of this experiment suggested that low temperature during the panicle initiation stage and ripening stage in 2014 and 2016 inhibited translocation and resulted in a lower filled grain ratio (Table 4, Table 5 and Table 6).
Njinju et al. [24] reported a reduction in the filled grain ratio of Basmati 370 due to inhibition of translocation under low temperature conditions in Mwea. In our trial, the decrease in filled grain ratio was not attributed to the average of mean temperatures between 14 days before heading and heading, but to the average of minimum temperatures recorded during the same period. Farrell et al. [31] reported that sharp drops in the nighttime temperatures can cause sterility, and even if the mean temperatures stay high, the effects of extremely low minimum temperatures will be irreversible. In 2014 and 2016, night temperatures were very low (14.2–15.2 °C), and the differences between the maximum and the minimum temperature during the period from 14 days before heading to heading were large (12.2–15.1 °C) (Table 6). Thus, the decrease in filled grain ratio may be due to the occurrence of sterility caused by the very low minimum temperature (Figure 3). However, the ripening process may also have been affected, because there was a positive and significant correlation between filled grain ratio and average minimum temperature for the period from heading to 14 days after heading under CF. These results suggested that the inhibition of translocation under CF in 2014 and 2016 was due to sterility at both flowering and ripening stages after heading.
In 2014 and 2016, the effect of low temperature on grain filling was more severe under CF than under AWD (Table 4). This demonstrates the mitigation effect of AWD on the decline in filled grain ratio when rice is exposed to low temperature during the reproductive and ripening stages. Under CF, the ORP decreased, as the paddy soil was under reduced condition (Table 1). Zhang et al. [32] reported that decreased root activity caused by reduced soil promotes cold-induced damage in rice. Under AWD conditions, rice can maintain high root activity [13,33]. Therefore, it was suggested that the mitigation effect of AWD on the decline in grain filling was related to the maintenance of higher root activity under aerobic conditions. In 2015 and 2017, rice was not exposed to low temperature during reproductive and ripening stages (Table 6). Hence, filled grain ratio did not decrease even under CF (Table 4). Accordingly, there was no mitigation effect of AWD on the decline in grain filling in 2015 and 2017. In the present study, Basmati 370, which is susceptible to cold stress [25], was studied for four years. However, large differences in various varieties have been observed in previous cold tolerance evaluations conducted in Mwea [25]. Therefore, further studies are needed to evaluate and validate the effect of AWD in tropical highlands using varieties with different cold tolerance abilities.
Generally, soil water potential in AWD should be kept higher than −30 kPa to avoid reduction of grain yield caused by water stress [34]. In our trial, soil water potential for the AWD plots did not drop below −10 kPa all year (Figure 2). Thus, it can be said that there was no severe water stress caused by the AWD. Total rainfall during the 2015 growth period was higher than 2014, 2016, and 2017, however, this difference in the annual precipitation rate should not have affected rice growth and yield, as the trials were conducted under irrigated paddy fields. Since variations in the solar radiation were relatively constant, this factor is unlikely to have accounted for the observed differences in yields under CF and AWD (Table 1). Similarly, differences in soil temperature, EC, and pH, between CF and AWD were equally minor, and therefore their influence on the yield responses can be considered negligible.

5. Conclusions

The results of this study indicate that AWD could mitigate the low temperature (below 15 °C)-induced decline in grain filling during the reproductive and ripening stages in Basmati 370, a cold susceptible variety, under tropical highland cultivation conditions. In the tropical highland of Kenya, adopting AWD for late sown Basmati 370 can decrease the risk of reduced filled grain ratio due to low temperatures during the reproductive stages. As this effect is highly temperature-dependent, weather patterns should not be underestimated, since they might be the reason behind the inconsistent reports on the effects of AWD. Therefore, further studies—on the physiological responses of rice under AWD, in relation to the mitigation effect on filled grain ratio—are needed.

Author Contributions

Conceptualization, D.M., T.K. and M.K.; methodology, D.M. and T.K.; formal analysis, T.K., D.M. and M.K.; investigation, T.K., D.M. and M.K.; resources, D.M.; data curation, T.K., D.M., M.K., D.M.M., E.W.G. and H.S.; writing—original draft preparation, T.K., M.K. and D.M.; writing—review and editing, D.M., T.K., M.K., D.M.M., E.W.G. and H.S.; visualization, T.K., M.K. and D.M.; supervision, D.M.; project administration, D.M.; funding acquisition, D.M. All authors have read and agreed to the published version of the manuscript.

Funding

This work was supported by Japan Science and Technology Agency (JST) and Japan International Cooperation Agency (JICA) as part of the Science and Technology Research Partnership for Sustainable Development (SATREPS), Japan Society for the Promotion of Science (JSPS) as part of the Core-to-Core Program, grant number JPJSCCB20180008, JST as part of the Accelerating Social Implementation for SDGs Achievement (aXis), grant number JPMJAS2007, and the RIKEN Cluster for Science, Technology and Innovation Hub (RCSTI).

Institutional Review Board Statement

Not applicable.

Informed Consent Statement

Not applicable.

Data Availability Statement

Data is contained within the article.

Conflicts of Interest

The authors declare no conflict of interest.

References

  1. Muthayya, S.; Sugimoto, J.D.; Montgomery, S.; Maberly, G.F. An overview of global rice production, supply, trade, and consumption. Ann. N. Y. Acad. Sci. 2014, 1324, 7–14. [Google Scholar] [CrossRef] [PubMed]
  2. Maclean, J.; Hardy, B.; Hettel, G. Rice Almanac: Source Book for One of the Most Important Economic Activities on Earth, 4th ed.; International Rice Research Institute: Los Baños, Philippines, 2013. [Google Scholar]
  3. Rosegrant, M.W.; Ringler, C.; Zhu, T. Water for Agriculture: Maintaining Food Security under Growing Scarcity. Annu. Rev. Environ. Resour. 2009, 34, 205–222. [Google Scholar] [CrossRef]
  4. Howell, K.R.; Shrestha, P.; Dodd, I.C. Alternate wetting and drying irrigation maintained rice yields despite half the irrigation volume, but is currently unlikely to be adopted by smallholder lowland rice farmers in Nepal. Food Energy Secur. 2015, 4, 144–157. [Google Scholar] [CrossRef] [PubMed] [Green Version]
  5. Maneepitak, S.; Ullah, H.; Paothong, K.; Kachenchart, B.; Datta, A.; Shrestha, R.P. Effect of water and rice straw management practices on yield and water productivity of irrigated lowland rice in the Central Plain of Thailand. Agric. Water Manag. 2019, 211, 89–97. [Google Scholar] [CrossRef]
  6. Price, A.H.; Norton, G.J.; Salt, D.E.; Ebenhoeh, O.; Meharg, A.A.; Meharg, C.; McNally, K.L. Alternate wetting and drying irrigation for rice in Bangladesh: Is it sustainable and has plant breeding something to offer? Food Energy Secur. 2013, 2, 120–129. [Google Scholar] [CrossRef] [Green Version]
  7. Rejesus, R.M.; Palis, F.G.; Rodriguez, D.G.P.; Lampayan, R.M.; Bouman, B.A.M. Impact of the alternate wetting and drying (AWD) water-saving irrigation technique: Evidence from rice producers in the Philippines. Food Policy 2011, 36, 280–288. [Google Scholar] [CrossRef]
  8. Ullah, H.; Mohammadi, A.; Datta, A. Growth, yield and water productivity of selected lowland Thai rice varieties under different cultivation methods and alternate wetting and drying irrigation. Ann. Appl. Biol. 2018, 173, 302–312. [Google Scholar] [CrossRef]
  9. Yang, J.; Liu, K.; Wang, Z.; Du, Y.; Zhang, J. Water-saving and high-yielding irrigation for lowland rice by controlling limiting values of soil water potential. J. Integr. Plant Biol. 2007, 49, 1445–1454. [Google Scholar] [CrossRef]
  10. Pan, S.G.; Cao, C.G.; Cai, M.L.; Wang, J.P.; Wang, R.H.; Zhai, J.; Huang, S.Q. Effects of irrigation regime and nitrogen management on grain yield, quality and water productivity in rice. J. Food Agric. Environ. 2009, 7, 559–564. [Google Scholar]
  11. Sriphirom, P.; Chidthaisong, A.; Towprayoon, S. Effect of Alternate Wetting and Drying Water Management on Rice Cultivation with Low Emissions and Low Water Used during Wet and Dry Season. J. Clean. Prod. 2019, 223, 980–988. [Google Scholar] [CrossRef]
  12. Ye, Y.; Liang, X.; Chen, Y.; Liu, J.; Gu, J.; Guo, R.; Li, L. Alternate wetting and drying irrigation and controlled-release nitrogen fertilizer in late-season rice: Effects on dry matter accumulation, yield, water and nitrogen use. Field Crop. Res. 2013, 144, 212–224. [Google Scholar] [CrossRef]
  13. Zhang, H.; Zhang, S.; Yang, J.; Zhang, J.; Wang, Z. Postanthesis moderate wetting drying improves both quality and quantity of rice yield. Agron. J. 2008, 100, 726–734. [Google Scholar] [CrossRef]
  14. Bouman, B.A.M.; Toung, T.P. Field water management to save water and increase its productivity in irrigated lowland rice. Agric. Water Manag. 2001, 49, 11–30. [Google Scholar] [CrossRef]
  15. Carrijo, D.R.; Lundy, M.E.; Linquist, B.A. Rice yields and water use under alternate wetting and drying irrigation: A meta-analysis. Field Crop. Res. 2017, 203, 173–180. [Google Scholar] [CrossRef]
  16. Rungrat, T.; Poothab, C. Short-term water deficit stress induces anthocyanin accumulation and changes in grain yield and yield components in colored rice grain. Agric. Nat. Resour. 2019, 53, 292–297. [Google Scholar]
  17. Mati, B.M.; Wanjogu, R.; Odongo, B.; Home, P.G. Introduction of the System of Rice Intensification in Kenya: Experiences from Mwea Irrigation Scheme. Paddy Water Environ. 2011, 9, 145–154. [Google Scholar] [CrossRef]
  18. FAO. Faostat. Available online: https://faostat.fao.org/ (accessed on 18 October 2019).
  19. Ministry of Agriculture (MoA), Republic of Kenya. National Rice Development Strategy (2008–2018); Ministry of Agriculture: Nairobi, Kenya, 2008.
  20. Ouma-Onyango, A. Promotion of Rice Production: A Likely Step to Making Kenya Food Secure. An Assessment of Current Production and Potential. Dev. Ctry. Stud. 2014, 4, 26–31. [Google Scholar]
  21. Kihoro, J.; Bosco, N.J.; Murage, H.; Ateka, E.; Makihara, D. Investigating the impact of rice blast disease on the livelihood of the local farmers in greater Mwea region of Kenya. SpringerPlus 2013, 2, 308. [Google Scholar] [CrossRef] [PubMed] [Green Version]
  22. Abdullahi, M.; Mizutani, M.; Tanaka, S.; Goto, A.; Matsui, H. Changes in water management practices in the Mwea Irrigation Scheme, Kenya from 1994 to 1998. Rural. Environ. Eng. 2003, 44, 60–67. [Google Scholar]
  23. Samejima, H.; Katsura, K.; Kikuta, M.; Njinju, S.M.; Kimani, J.M.; Yamauchi, A.; Makihara, D. Analysis of rice yield response to various cropping seasons to develop optimal cropping calendars in Mwea, Kenya. Plant Prod. Sci. 2020, 23, 297–305. [Google Scholar] [CrossRef] [Green Version]
  24. Njinju, S.M.; Samejima, H.; Katsura, K.; Kikuta, M.; Gweyi-Onyango, J.P.; Kimani, J.M.; Makihara, D. Grain yield responses of lowland rice varieties to increased amount of nitrogen fertilizer under tropical highland conditions in central Kenya. Plant Prod. Sci. 2018, 21, 59–70. [Google Scholar] [CrossRef]
  25. Samejima, H.; Kikuta, M.; Katura, K.; Menge, D.; Gichuhi, E.; Wainaina, C.; Kimani, J.; Inukai, Y.; Yamauchi, A.; Makihara, D. A method for evaluating cold tolerance in rice during reproductive growth stages under natural low-temperature conditions in tropical highlands in Kenya. Plant Prod. Sci. 2020, 23, 466–476. [Google Scholar] [CrossRef]
  26. Japan International Cooperation Agency (JICA). Joint Mid-Team Review Report on the Japanese Technical Cooperation for Rice-Based and Market-Oriented Agriculture Promotion Project in the Republic of Kenya. Available online: http://open_jicareport.jica.go.jp/pdf/12235024.pdf (accessed on 18 October 2019).
  27. Omwenga, K.G.; Mati, B.M.; Home, P.G. Determination of the effect of the system of rice intensification (SRI) on rice yields and water saving in Mwea irrigation scheme, Kenya. J. Water Resour. Prot. 2014, 6, 895–901. [Google Scholar] [CrossRef] [Green Version]
  28. Kikuta, M.; Makihara, D.; Arita, N.; Miyazaki, A.; Yamamoto, Y. Growth and yield responses of upland NERICAs to variable water management under field conditions. Plant Prod. Sci. 2017, 20, 36–46. [Google Scholar] [CrossRef]
  29. Yoshida, S. Fundamentals of Rice Crop Science; International Rice Research Institute: Los Baños, Philippines, 1981; p. 269. [Google Scholar]
  30. Kusutani, A. Studies on Productivity of Rice Plants Growing the North-Marginal Area in Japan: II. Influence of cool-weather damage on yield and harvest index. Jpn. J. Crop. Sci. 1985, 54, 120–126. [Google Scholar] [CrossRef] [Green Version]
  31. Farrell, T.C.; Fukai, S.; Williams, R.L. Minimizing cold damage during reproductive development among temperate rice genotypes: I. Avoiding low temperature with the use of appropriate sowing time and photoperiod-sensitive varieties. Aust. J. Agric. Res. 2006, 57, 75–88. [Google Scholar] [CrossRef]
  32. Zhang, Z.; Nakamura, T.; Nishiyama, I. Effects of the amount and activity of roots on the cool-weather resistance in rice plants. Jpn. J. Crop. Sci. 2001, 70, 84–91, (In Japanese with English Abstract). [Google Scholar] [CrossRef]
  33. Mishra, A.; Salokhe, V.M. Flooding stress: The effects of planting pattern and water regime on root morphology, physiology and grain yield of rice. J. Agron. Crop. Sci. 2010, 196, 368–378. [Google Scholar] [CrossRef]
  34. Lampayan, R.M.; Samoy-Pascual, K.C.; Sibayan, E.B.; Ella, V.B.; Jayag, O.P.; Cabangon, R.J.; Bouman, B.A.M. Effects of alternate wetting and drying (AWD) threshold level and plant seedling age on crop performance, water input, and water productivity of transplanted rice in Central Luzon, Philippines. Paddy Water Environ. 2015, 13, 215–227. [Google Scholar] [CrossRef]
Figure 1. Changes in the daily mean (a), maximum (b), and minimum (c) temperatures and in the daily average radiation (d) during the 2014, 2015, 2016, and 2017 seasons. Values on the Y-axis show the temperatures (°C), while X-axis indicates the days after transplantation. Each point represents the mean value of 10 days. Solar radiation in 2017 was not available.
Agronomy 11 02345 g001
Figure 2. Soil water potential and perched water table in plots with alternate wetting and drying (AWD) during the 2014 (a), 2015 (b), 2016 (c), and 2017 (d) seasons. Gray lines represent the perched water table, while black lines indicate the soil water potential. X-axis shows the days after transplanting.
Agronomy 11 02345 g002
Figure 3. Relationship between filled grain ratio and mean (a,b), maximum (c,d), and minimum (e,f) temperatures from 14 days before heading to heading (a,c,e) and from heading to 14 days after heading (b,d,f) in Basmati 370 grown under continuous flooding (CF) and alternate wetting and drying (AWD) conditions in 2014 (●, ○), 2015 (■, □), 2016 (▲, △), and 2017 (◆, ◇). Open symbols are CF. Closed symbols are AWD. The black lines represent data from CF, and the gray line represents AWD. *, **, and *** indicate significance at p < 0.05, p < 0.01, and p < 0.001, respectively. n.s. indicates not significant.
Agronomy 11 02345 g003
Table 1. Average solar radiation, soil temperature, electrical conductivity (EC), pH, and oxidation-reduction potential (ORP) from transplanting time to heading stage under continuous flooding (CF) and alternate wetting and drying (AWD), in 2014, 2015, 2016, and 2017.
2014201520162017
Solar radiation (mJ m−2)CF17.516.516.5-
AWD17.616.516.5-
Soil temperature (°C)CF-22.122.224.1
AWD-22.122.823.9
EC (mS cm−1)CF0.840.770.500.52
AWD0.580.700.450.52
pHCF5.775.455.475.48
AWD5.134.865.035.03
ORP (mV)CF−30.9−17.6−47.4−108.1
AWD210.7208.9254.8250.1
Table 2. Plant length, number of tillers, and Soil Plant Analysis Development (SPAD) values at heading stage in Basmati 370 rice plants, grown under continuous flooding (CF) and alternate wetting and drying (AWD) conditions, during the 2014, 2015, 2016, and 2017 season.
YearTreatmentPlant LengthTiller NumberSPAD
(cm)(per Plant)
2014CF106.5±5.1ab20.9±3.6e -
AWD96.7±3.0b21.7±1.2de -
2015CF108.8±11.3ab33.0±3.0bcd39.7±1.5a
AWD103.9±5.3ab30.1±2.5cde36.2±2.7a
2016CF136.8±2.3a44.1±2.3ab40.5±2.2a
AWD115.8±3.1ab36.4±5.9abc39.6±4.0a
2017CF108.3±2.2ab47.7±2.0a38.0±2.4a
AWD100.3±0.2ab46.0±0.9a27.5±1.2b
Data are shown as mean ± standard error of mean (S.E). Values followed by the same letter (within a column) are not significantly different at p < 0.05 (least significant test).
Table 3. Heading dates of the Basmati 370 rice plants grown under continuous flooding (CF) and alternate wetting and drying (AWD) conditions, during the 2014, 2015, 2016 and 2017 season.
CFAWD
201414 January 2015(85)20 January 2015(91)
20159 December 2015(84)8 December 2015(83)
201621 December 2016(86)21 December 2016(86)
201711 October 2017(86)11 October 2017(86)
Values in parenthesis indicate days after transplanting.
Table 4. Grain yield (g m−2), yield components (panicle number per square meter, number of grains per panicle, number of grains per square meter, filled grain ratio, 1000-grain weight), above-ground biomass, and harvest index of the Basmati 370 plants, grown under continuous flooding (CF) and alternate wetting and drying (AWD) conditions during the 2014, 2015, 2016, and 2017 season.
YearTreatPanicle NumberNumber of GrainsNumber of GrainsFilled Grain Ratio 1000-Grain WeightAbove-Ground BiomassGrain YieldHarvest Index
(per m2)(per Panicle)(per m2)(%)(g)(g m−2)(g m−2)(%)
2014CF439.4a148.2a65029a38.8c19.4d1790a468.5c0.27c
AWD397.3ab117.8b46289b58.0b19.1d1499bc510.9bc0.34b
2015CF345.2bc88.8de30637d79.1a19.8cd1446bc480.4c0.33b
AWD278.9c73.6e20303e83.4a20.3bc1034d345.9d0.34b
2016CF345.9bc109.2bc37755cd59.9b21.1ab1414bc464.9c0.33bc
AWD379.6ab93.9cd35225cd76.3a21.0ab1259cd560.9b0.45a
2017CF368.9ab101.0bcd37331cd87.7a21.4a1552ab697.3a0.45a
AWD375.2ab106.2bcd39440bc80.9a21.3a1531ab677.9a0.44a
Year*********************
Treatmentns*****ns**ns***
Year × Treatmentnsns***nsns***
Values followed by the same letter within a column are not significantly different at p < 0.05 (least significant test). *, **, and *** indicates significance at p < 0.05, p < 0.01, and p < 0.001. ns indicates not significant.
Table 5. Correlation coefficients obtained from the regression analyses between grain yield and different yield components in Basmati 370 grown under continuous flooding (CF) and alternate wetting and drying (AWD) during 2014, 2015, 2016, and 2017.
YearPanicle NumberNumber of GrainsNumber of GrainsFilled Grain Ratio 1000-Grain WeightAbove-Ground BiomassHarvest Index
(per m2)(per Panicle)(per m2)(%)(g)(g m−2)(%)
2014−0.497n.s.−0.620n.s.−0.7170.802*−0.483n.s.−0.281n.s.0.692n.s.
20150.7600.805*0.962**−0.228n.s.−0.427n.s.0.941**−0.023n.s.
2016−0.030n.s.−0.240n.s.−0.356n.s.0.854*−0.603n.s.−0.073n.s.0.846*
20170.549n.s.0.049n.s.0.713−0.117n.s.−0.409n.s.0.769−0.303n.s.
Note: †, *, and ** indicate significance at p < 0.1, p < 0.05, and p < 0.01, respectively. n.s. indicates not significant.
Table 6. The average mean, maximum, and minimum temperatures from 14 days before heading to heading and from heading to 14 days after heading in the Basmati 370 rice cultivar grown under continuous flooding (CF) and alternate wetting and drying (AWD) during 2014, 2015, 2016, and 2017.
YearTreatmentAverage Temperature from 14 Days before Heading to HeadingAverage Temperature from Heading to 14 Days after Heading
MeanMaxMinMeanMaxMin
2014CF21.929.314.221.628.914.1
AWD21.629.014.221.629.014.1
2015CF21.127.117.021.327.116.6
AWD21.127.116.921.227.116.6
2016CF20.727.415.220.927.715.0
AWD20.727.415.220.927.715.0
2017CF24.033.316.923.631.718.1
AWD24.033.316.923.631.718.1
Publisher’s Note: MDPI stays neutral with regard to jurisdictional claims in published maps and institutional affiliations.

