Article

Changes in Ultrastructure and Oxidation Resistance of Peel of Pear Cultivars during Shelf Life

1
Research Institute of Pomology, Chinese Academy of Agricultural Sciences, Xingcheng 125100, China
2
College of Horticulture and Landscape Architecture, Southwest University, Chongqing 400716, China
*
Author to whom correspondence should be addressed.
Agronomy 2021, 11(11), 2274; https://doi.org/10.3390/agronomy11112274
Submission received: 14 October 2021 / Revised: 4 November 2021 / Accepted: 5 November 2021 / Published: 10 November 2021
(This article belongs to the Special Issue Postharvest Physiology of Fruits and Vegetables)

Abstract

:
Postharvest period is a process of natural maturation and senescence. The peel structure and antioxidant capacity of pears are the most important factors that affect its postharvest quality. However, the changes in pear peel properties are still unclear during shelf life. In this study, transmission electron microscopy (TEM) and scanning electron microscopy (SEM) were used to investigate the ultrastructural characteristics of pear peel during shelf life, and to determine the changes in peel antioxidants, active oxygen scavenging enzymes, and antioxidant capacity. The results showed that after a 30-day shelf life, the peel cuticles of all tested varieties had varying degrees of color loss and withering, and the integrity of the cells of peel was also damaged, but the surface layer cells of Xuehuali (XH), Huangguan (HG), and Yali (YL) were smoother than Wonhwang (WH) and Housui (HS), and the integrity of the peel cells was also better. In this experiment, there were significant differences in the contents of total polyphenol and total flavonoids among different varieties, and also significant differences in the variation range and variation trends in the activities of peroxidase and catalase (p < 0.05). The total antioxidant capacity of YL pear peel was the highest (68.76 Ug−1), while that of WH pear peel was the lowest (26.37 Ug−1). In conclusion, YL and XH, the representative varieties of White Pear, have better skin structure stability and antioxidant capacity than Sand Pear varieties HS and WH. The overall results provide a theoretical basis for further structure and function investigation of pear peel.

1. Introduction

Pear (Pyrus L.) is one of the most important deciduous fruit trees in the world. China is the origin and diversity center and the largest producer of pear in the world [1]. White Pear, Sand Pear, Ussurian Pear, and Sinkiang Pear are the major cultivars in China. The White Pear and Sand Pear achieve significant development and their market share is greater than other varieties [2]. The peel is the first protection of the fruit, which is closely related to the appearance quality and storage ability of the fruit. Moreover, peel is a rich source of anthocyanins, flavan-3-ols, including polymeric procyanidins, and flavonols [3]. Research on pear peel structure and properties is critically important for achieving a comprehensive understanding and adequate control of their functions, which is crucially important for reducing fruit injury and other improved traits [4]. The pear peel comprises three parts: the cuticle that is composed of a cuticular layer, suberized cells, and a cellular sclerenchymatous layer [5]. The cuticle is a layer that protects the fruit from physiological and climatic injuries such as massive water loss and regulates gas exchange; it also provides protection against mechanical injury and pathogen invasion [6]. Buschhaus and Jetter (2011) found that the hydrophobic cuticle of the plant epidermis was close in structure to the polysaccharide cell wall, and the cuticle consisted of an upper epidermis wax layer and cutin, where wax is internally embedded. Upper epidermis crystals form with the constant buildup of this substance [7]. During storage, drastic changes can occur in the cuticle structure, including increased coarseness, arrangement mode alterations, and variations in the crack size, etc. Substantial differences were also found to exist among different cultivars in the cuticle structure [8]. For example, certain pear cultivars, such as “Jinfeng” “Pingguoli”, have cuticles with a compact structure, uniform thickness, and fewer fractures. These cultivars can be stored for a longer period. However, other cultivars, such as “Beurre Giffard” and “Aixiangli”, have cuticles with raised flakes, nonuniform thickness, and many fractures and are usually characterized by a shorter shelf life [9].
The storage properties of pear fruit are also affected by the chemical composition and biochemical properties of the peel. Previous studies have shown the peel effectively identifies pathogens and, prevents their invasion. Cutaneous monomers in the peel as the signal molecules were found to trigger defensive responses when suffering from invasion of pathogenic bacteria in plants [10,11]. In addition, oxidation resistance is critical to the maintenance of the structure and functions of the cytomembrane [12]. The peel has abundant antioxidants with strong activities, which contributes to the provision of resistance against the harmful of free radicals and reactive oxygen species, pathogen invasion [13], and influence nutritional value of fruit [14]. Because of the presence of bioactive compounds, pears possess anti-inflammatory, antitussive, diuretic, and anti-hyperglycemic activities [13], which have been used in folk medicine for over two thousand years. The oxidation resistance of pear peels not only exerts biological functions such as disease prevention and senility delay but is also closely associated with the processes of growth, development, senility, and apoptosis. However, the postharvest changes in pear peel properties are still unclear. In this study, we investigated the changes in the fine structure of the cuticle and epidermal cells and compared the chemical compositions and antioxidant capacities of five major pear cultivars. Analysis of the variations in pear peel properties during shelf life provides a theoretical basis for the assessment of the storability of pear cultivars, monitoring changes in nutrition and quality, and processing and utilization of peel.

2. Materials and Methods

2.1. Pear Fruit Samples

Experimental pear fruit (bagged) of five cultivars, Wonhwang (WH), Housui (HS), Xuehuali (XH), Huangguan (HG), and Yali (YL), were purchased from Great Wall Economic and Trade Co., Ltd., Jinzhou, China. Pears of a similar grade of maturity with even sizes and complete pedicels without disease, insect pests, and mechanical injury were picked at commercial maturity, delivered to the test site by 4 °C cold-chain transportation system.

2.2. Experimental Design and Methods

2.2.1. Experimental Design

The fruit of the aforementioned five pear cultivars (30 kg per cultivar) were taken out of the cool store and placed on a constant-temperature shelf at room temperature (20 °C ± 3 °C). The peels were collected and mixed from the sunny and shade of the fruit for determination of their antioxidant enzyme activity, content of bioactive compounds, and overall antioxidant capacity at an interval of 10 d during their shelf life of 30 d. The changes occurring in the peel ultrastructure were observed at the beginning and the end of the shelf-life period. Each of the above samples was taken randomly, and each index was determined more than three times.

2.2.2. Determination Method
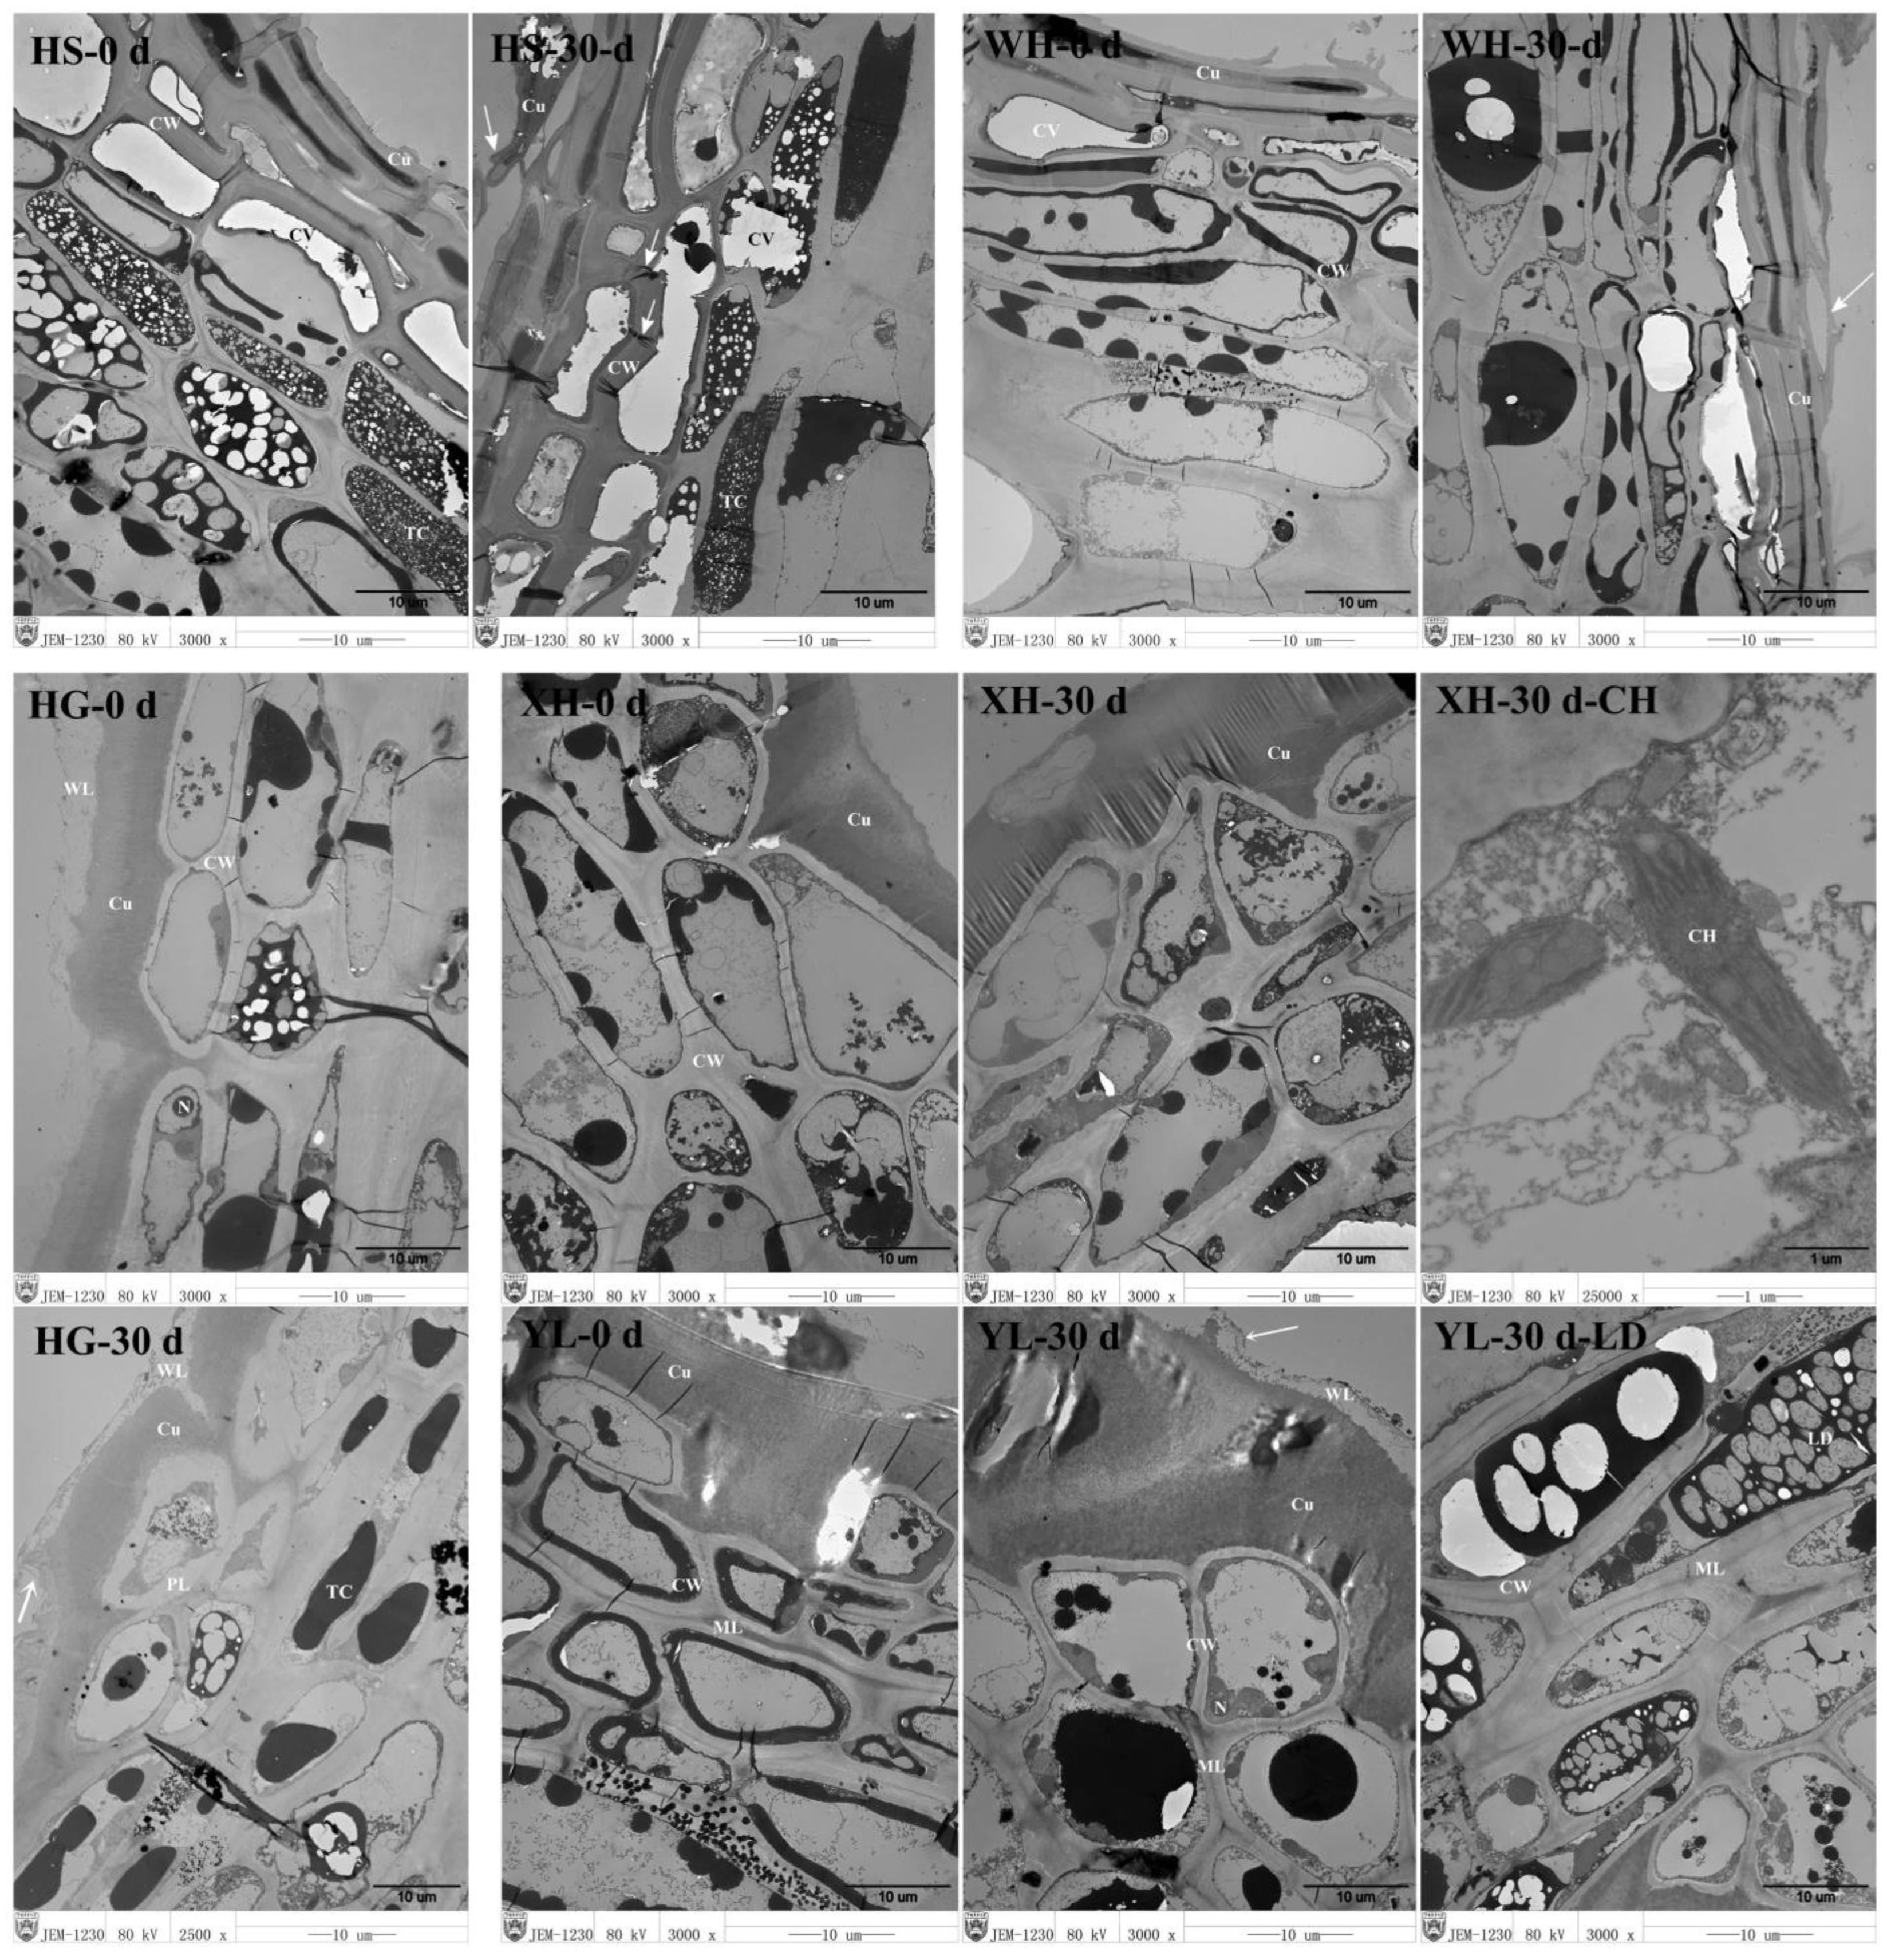
Peel Ultrastructure

Samples for scanning electron microscopy (SEM) were prepared and observed using the method described by Peng Yiben [15]. A double-edged blade was used to vertically cut the peel in slices with an approximate size of 3 mm × 3 mm. The peel and the pulp were separated 1.5–2 mm below the epidermis, and the slices were immediately fixed in 2.5% glutaraldehyde fixation solution, washed three times with 0.1 mL of phosphoric acid buffer solution, dehydrated using gradient ethanol solutions, dried with a LEICA EM CPD (LEICA, Wetzlar, Germany) critical point dryer. Then, they were metal-sprayed using an ion coater (Eiko IB-3, Eiko Engineering, Ibaraki, Japan), and observed under a scanning electron microscope (Hitachi S-3400N, Hitachi High-Tech Co., Tokyo, Japan) and photographed.
The samples for transmission electron microscopy were referring to the above methods. A piece of peel with dimensions of approximately 2 mm × 3 mm and a thickness of 1.5–2 mm was cut, immediately fixed in 2.5% glutaraldehyde fixation solution, washed three times with 0.1 mL of phosphoric acid buffer solution, and dehydrated with gradient acetone. Next, it was embedded with epoxy resin SPURR, polymerized at 68 °C, sectioned with a LEICA UC6 (LEICA, Germany) ultra-microtome, doubly stained with uranyl acetate and lead citrate, and observed under the JEM-1230 (JEOL, Tokyo, Japan) transmission electron microscope.

Determination of the Antioxidant Enzyme Activity and Total Polyphenol and Total Flavonoids Contents

The nitroblue tetrazolium (NBT) method was used to determine the changes in superoxide dismutase (SOD) activity [16]. Riboflavin can produce superoxide free radical anions under aerobic conditions. When NBT is added, a blue substance is finally generated under light conditions, which has the maximum absorption at the wavelength of 560 nm. The enzyme quantity when the relative percentage of SOD inhibiting NBT photoreduction was 50% was taken as an enzyme activity unit (U). Additionally, the guaiacol method was utilized to determine the changes in peroxidase (POD) activity [17]. In the presence of H2O2, POD oxidizes guaiacol to produce a brownish-brown substance with maximum absorption at 470 nm, which can be measured by a spectrophotometer. The ultraviolet absorption method was employed to establish the changes in catalase (CAT) activity [18]. H2O2 has strong absorption at the wavelength of 240 nm, and catalase can decompose hydrogen peroxide, so that the absorbance of the reaction solution decreases with the reaction time, 1 unit of CAT was taken as an absorbance change of 0.01 units per min.
The content of total polyphenol was measured by the Folin-Ciocalteu method [19]. A gallic acid solution served as a standard, and the standard curve was constructed using the formula Y = 0.2612X + 0.0127, R2 = 0.9993, where X is the concentration of gallic acid (mg L−1), Y is the absorbency at a wavelength of 765 nm. The total polyphenol content in the sample was expressed by the equivalent of gallic acid. The results were expressed in mg kg−1, dry weight.
The aluminum nitrate-sodium nitrite colorimetric method was adopted to determine the total flavonoids content [20]. Rutin served as a standard, and the standard curve was developed based on the equation Y = 0.7437X + 0.0428, R2 = 0.9914, where X is the concentration of rutin (mg L−1) and Y is the absorbency at a wavelength of 510 nm. The total flavonoids content in the sample was expressed by the equivalent of rutin. The results were expressed in mg kg−1, dry weight.

Total Antioxidant Capacity (T-AOC)

The ferric antioxidant power assay (FRAP) was employed to determine the total antioxidant capacity. The assay was determined as previously described by Benzie and Strain (1996) [21]. The reagent suitable for determining the total antioxidant capacity with the FRAP method was purchased from Shanghai Solarbio Bioscience & Technology Co., Ltd., Shanghai, China, using a Genesys10S UV Spectrophotometer (Thermo, Waltham, MA, USA). The results were expressed in U g−1.

2.3. Statistical Analysis of the Data

ANOVA was taken and the significant differences were detected by LSD. Statistical analyses and graphing were performed with Microsoft Excel 2019. We used the ‘Wu Kong’ platform (https://www.omicsolution.com/wkomics/main/, accessed on 8 November 2021) for principal component analysis (PCA) [22].

3. Results

3.1. Peel Ultrastructure of the Samples

The results of SEM show that the cuticle scaly wax crystals of HS and WH peel were arranged in a reticular manner, inlaid, and piled at the fruit dots (Figure 1, HS-0 d-1, WH-0 d-1). At the beginning of the shelf life, the wax was bright and smooth (Figure 1, HS-0 d-2, WH-0 d-2). However, after 30 days of shelf storage, the peel suffered from rupture and peeling off the cuticle wax crystals, color shading, and roughening of the wax crystal edge (Figure 1, HS-30 d-2, WH-30 d-2). Particularly severe were the peeling and rupture of the wax on the surface of the fruit dot (Figure 1, HS-30 d-1, WH-30 d-1).
HG, XH, and YL pear fruit have similar peel cuticle structures, and the fruit of these three varieties are different from those of HS and WH, in former cultivars a scaly wax crystal stacking structure only exists at the fruit dot of the surface, and the remaining portions have a flat and compact arrangement of cuticle cells (Figure 1, HG-0 d-1, XH-0 d-1, and YL-0 d-1), and a smooth surface with a few cracks connected with a filamentous substance (Figure 1, XH-0 d-2). Convex crystals formed by the wax around the cracks were observed under a high-power lens (×3000) (Figure 1, HG-0 d -2, and YL-0 d-2). Thirty days after expiration of the shelf life, the number and width of the cracks on the cuticle surface increased (Figure 1, HG-30 d-2, XH-30 d-2, and YL-30 d-1); the intercellular filamentous connection broke, and the density of the convex crystals increased (Figure 1, HG-30 d-2, XH-30 d-2). The outer surface of the peel became uneven and irregular due to the peeling off of the wax (Figure 1, HG-30 d-1, HG-30 d -2, and YL-30 d-2).
We found that the wax secreted by the peel had adhered to and had wrapped the attachment when observing the ultrastructure of the pear peel. The coagulated wax wrapped the fungal sporophore on the peel (Figure 1, WH-0 d-PH) and sporangium (Figure 1, WH-0 d-AN), thus deactivating them and protecting the fruit against invasion. In addition, the fungus hypha adhered to the peel surface (Figure 1, HG-30 d-MY), and unknown impurities, seemingly worm eggs, (Figure 1, HG-0 d-UN) were also wrapped by the wax.
TEM was used to observe the cell structure of the pear peel tissue. Among the fruit of the five cultivars, only those of the sand pears and HS and WH cultivars had a thin peel cell cuticle. The cuticle at some sites was even raised and ruptured, and wax could be hardly seen. The thick-wall cells close to the 1st–2nd layer of the cuticle died. The cell wall collapsed and flattened. The thick-walled cells of the 3rd–4th layer had ruptured vacuoles, lost cell sap, and were hollow with thin-walled cells with large vacuoles and vitality below them (Figure 2, HS-0 d, WH-0 d). When the 30 d shelf life expired, the cellular structure of the peel was severely damaged, and the cuticle was detached. Moreover, the cell wall of the thick-walled cells was broken, whereas the cell wall of the thin-walled cells and tannin cells started to degrade. The density of the electron cloud in the adhesive layer of the cell wall decreased (Figure 2, HS-30 d, WH-30 d).
The fruits of XH, YL, and the selected cultivar HG of Chinese white pear had a thicker cuticle than those of HS and WH pears. The outer layer of the cuticle was covered with a wax layer, and the cells close to the cuticle did not deform. The cells had many shapes, including oval, triangular, square, etc., while the cell wall was compact. The dark band of the intercellular layer was clear, but the cellular content degraded to different extents (Figure 2, HG-0 d, XH-0 d, and YL-0 d). When the 30 d shelf life expired, the peel cuticle of the XH pear was still compact, but there were cracks and some parts were lacking. The density of the electron cloud in the adhesive layer in the epidermis cells decreased (Figure 2, XH-30 d). The chloroplast of the complete structure was still captured in the cells (Figure 2, XH-30 d-C). Interestingly, the wax layer of the HG pear peeled off and cracked, and the density of the interlayer electron cloud of the superficial cells decreased. Furthermore, the cell wall and cytoplasm started to degrade, and the cytoplasm of some cells separated from the cell membrane. Severe degradation of the substance in the cell sap followed (Figure 2, HG-30 d). The density of the electron cloud in the epidermis cell wall of the YL pear diminished. The middle lamella was still identifiable, but the cytoplasm degraded severely (Figure 2, YL-30 d), and the plastid contained a large number of lipid droplets (Figure 2, YL-30 d-L).

3.2. The Changes in Total Polyphenol and Total Flavonoids Content

As depicted in Figure 3a, the changes in total polyphenol contents in the fruit of the five cultivars are different. The total polyphenol content in the WH peel changed from 2276.61 mg kg−1 to 1308.00 mg kg−1 and the content of YL changed from 2069.03 mg kg−1 to 1177.20 mg kg−1, which all decreased with the prolongation of the shelf life; while the total polyphenol content in HS, XH, and HG peel first increased and then decreased during the shelf life, and reached its maximum on 20 d.
The trends of the variations in the total flavonoids contents of the same cultivar have a strong resemblance to the variation tendencies in the total polyphenol contents (Figure 3b). The total polyphenol content of the same cultivar was found to be much higher than total flavonoids in the same period, as expected. The variation of the total flavonoids contents in HS, XH, and HG were within the ranges 1011.20–1696.69 mg kg−1, 771.51–961.92 mg kg−1, and 634.86–807.35 mg kg−1, respectively, which also reached its maximum on 20 d.
Statistical analyses revealed significant differences in the total polyphenol and total flavonoids contents among all tested cultivars, (p < 0.05, Table 1); but no significant differences were found between HS and WH, XH, and YL in total polyphenol and among XH, HG and YL in total flavonoids (Table 1).

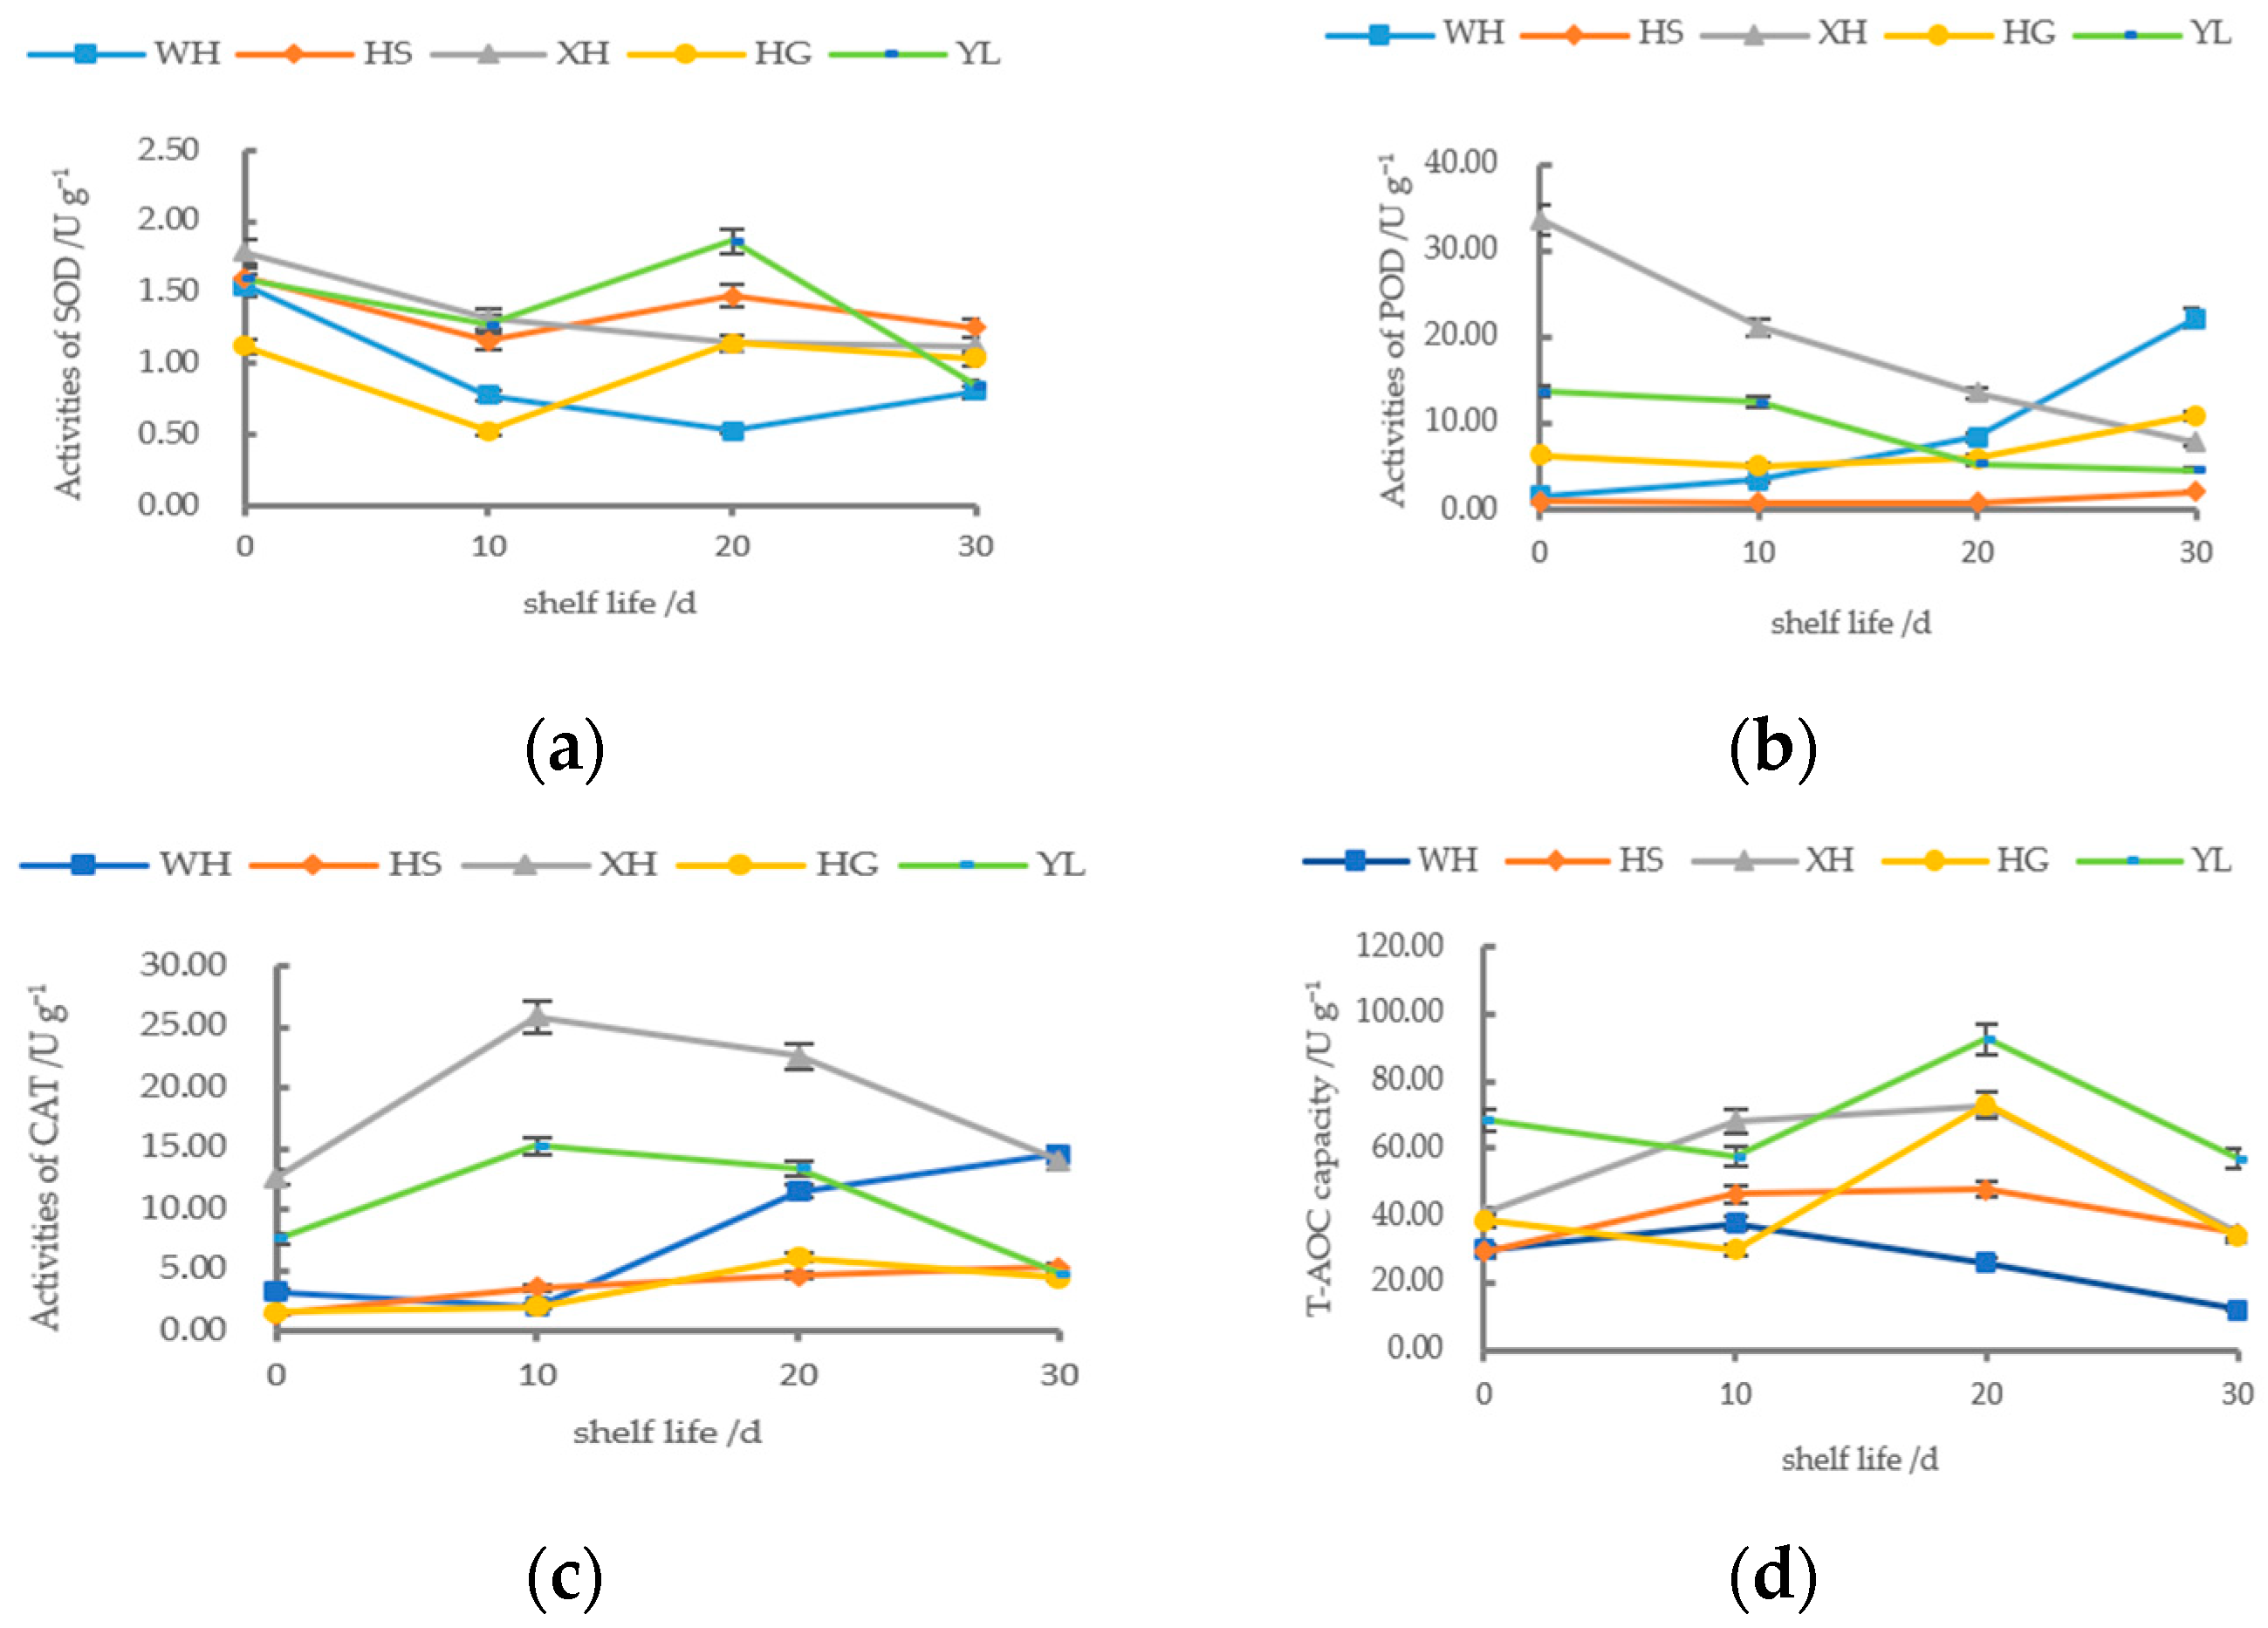
3.3. The Changes in Activity of the Antioxidant Enzyme

The changes in the activity of the three antioxidant enzymes (SOD, POD, and CAT) in the peel of the five tested cultivars during their shelf life are illustrated in Figure 4. With the extension of the shelf life, the activity of SOD in the peel of WH and XH gradually decreased, whereas that of SOD in the HS, YL, and HG pear peel was intensive, but started to decrease rapidly at 20 d. The contents of POD in the peels of WH and HS reached the maximum at the end of shelf life, whereas that of XH and YL exhibited a decreasing trend with the extension of the shelf life. The activity of CAT in WH, HS, and HG rose with the extension of the shelf life, but in the peels of XH and YL rose and then fell and reached its highest level at 10 d of shelf life. It was thus clear that significant differences occurred in the variation range and variation trends in the activities of POD and CAT (p < 0.05, Table 1), but no significant differences were found in SOD among the different pear cultivars (Table 1).

3.4. Analysis of the Total Antioxidant Capacity

The total antioxidant capacity (T-AOC) of the peels of the five pear cultivars during their shelf life was determined (Figure 4d). The average level of the antioxidant capacity of various cultivars was between 34.012 and 62.968 U g−1. During the shelf life, the peel of the YL pears had the largest average T-AOC value, whereas that of WH pears had the lowest average T-AOC value. Based on their antioxidant capacity, the cultivars can be arranged in descending order as follows: YL, XH, HG, HS, and WH. The antioxidant capacity of the peel of all pear cultivars tested displayed a single-peak variation, initially increasing and then decreasing. The total antioxidant capacities of the peels of those four cultivars, HS, XH, HG, and YL, reached their maximum values at 20 d of their shelf life. Additionally, the antioxidant capacity of the peel of WH fruit was high at 10 d of the shelf life.

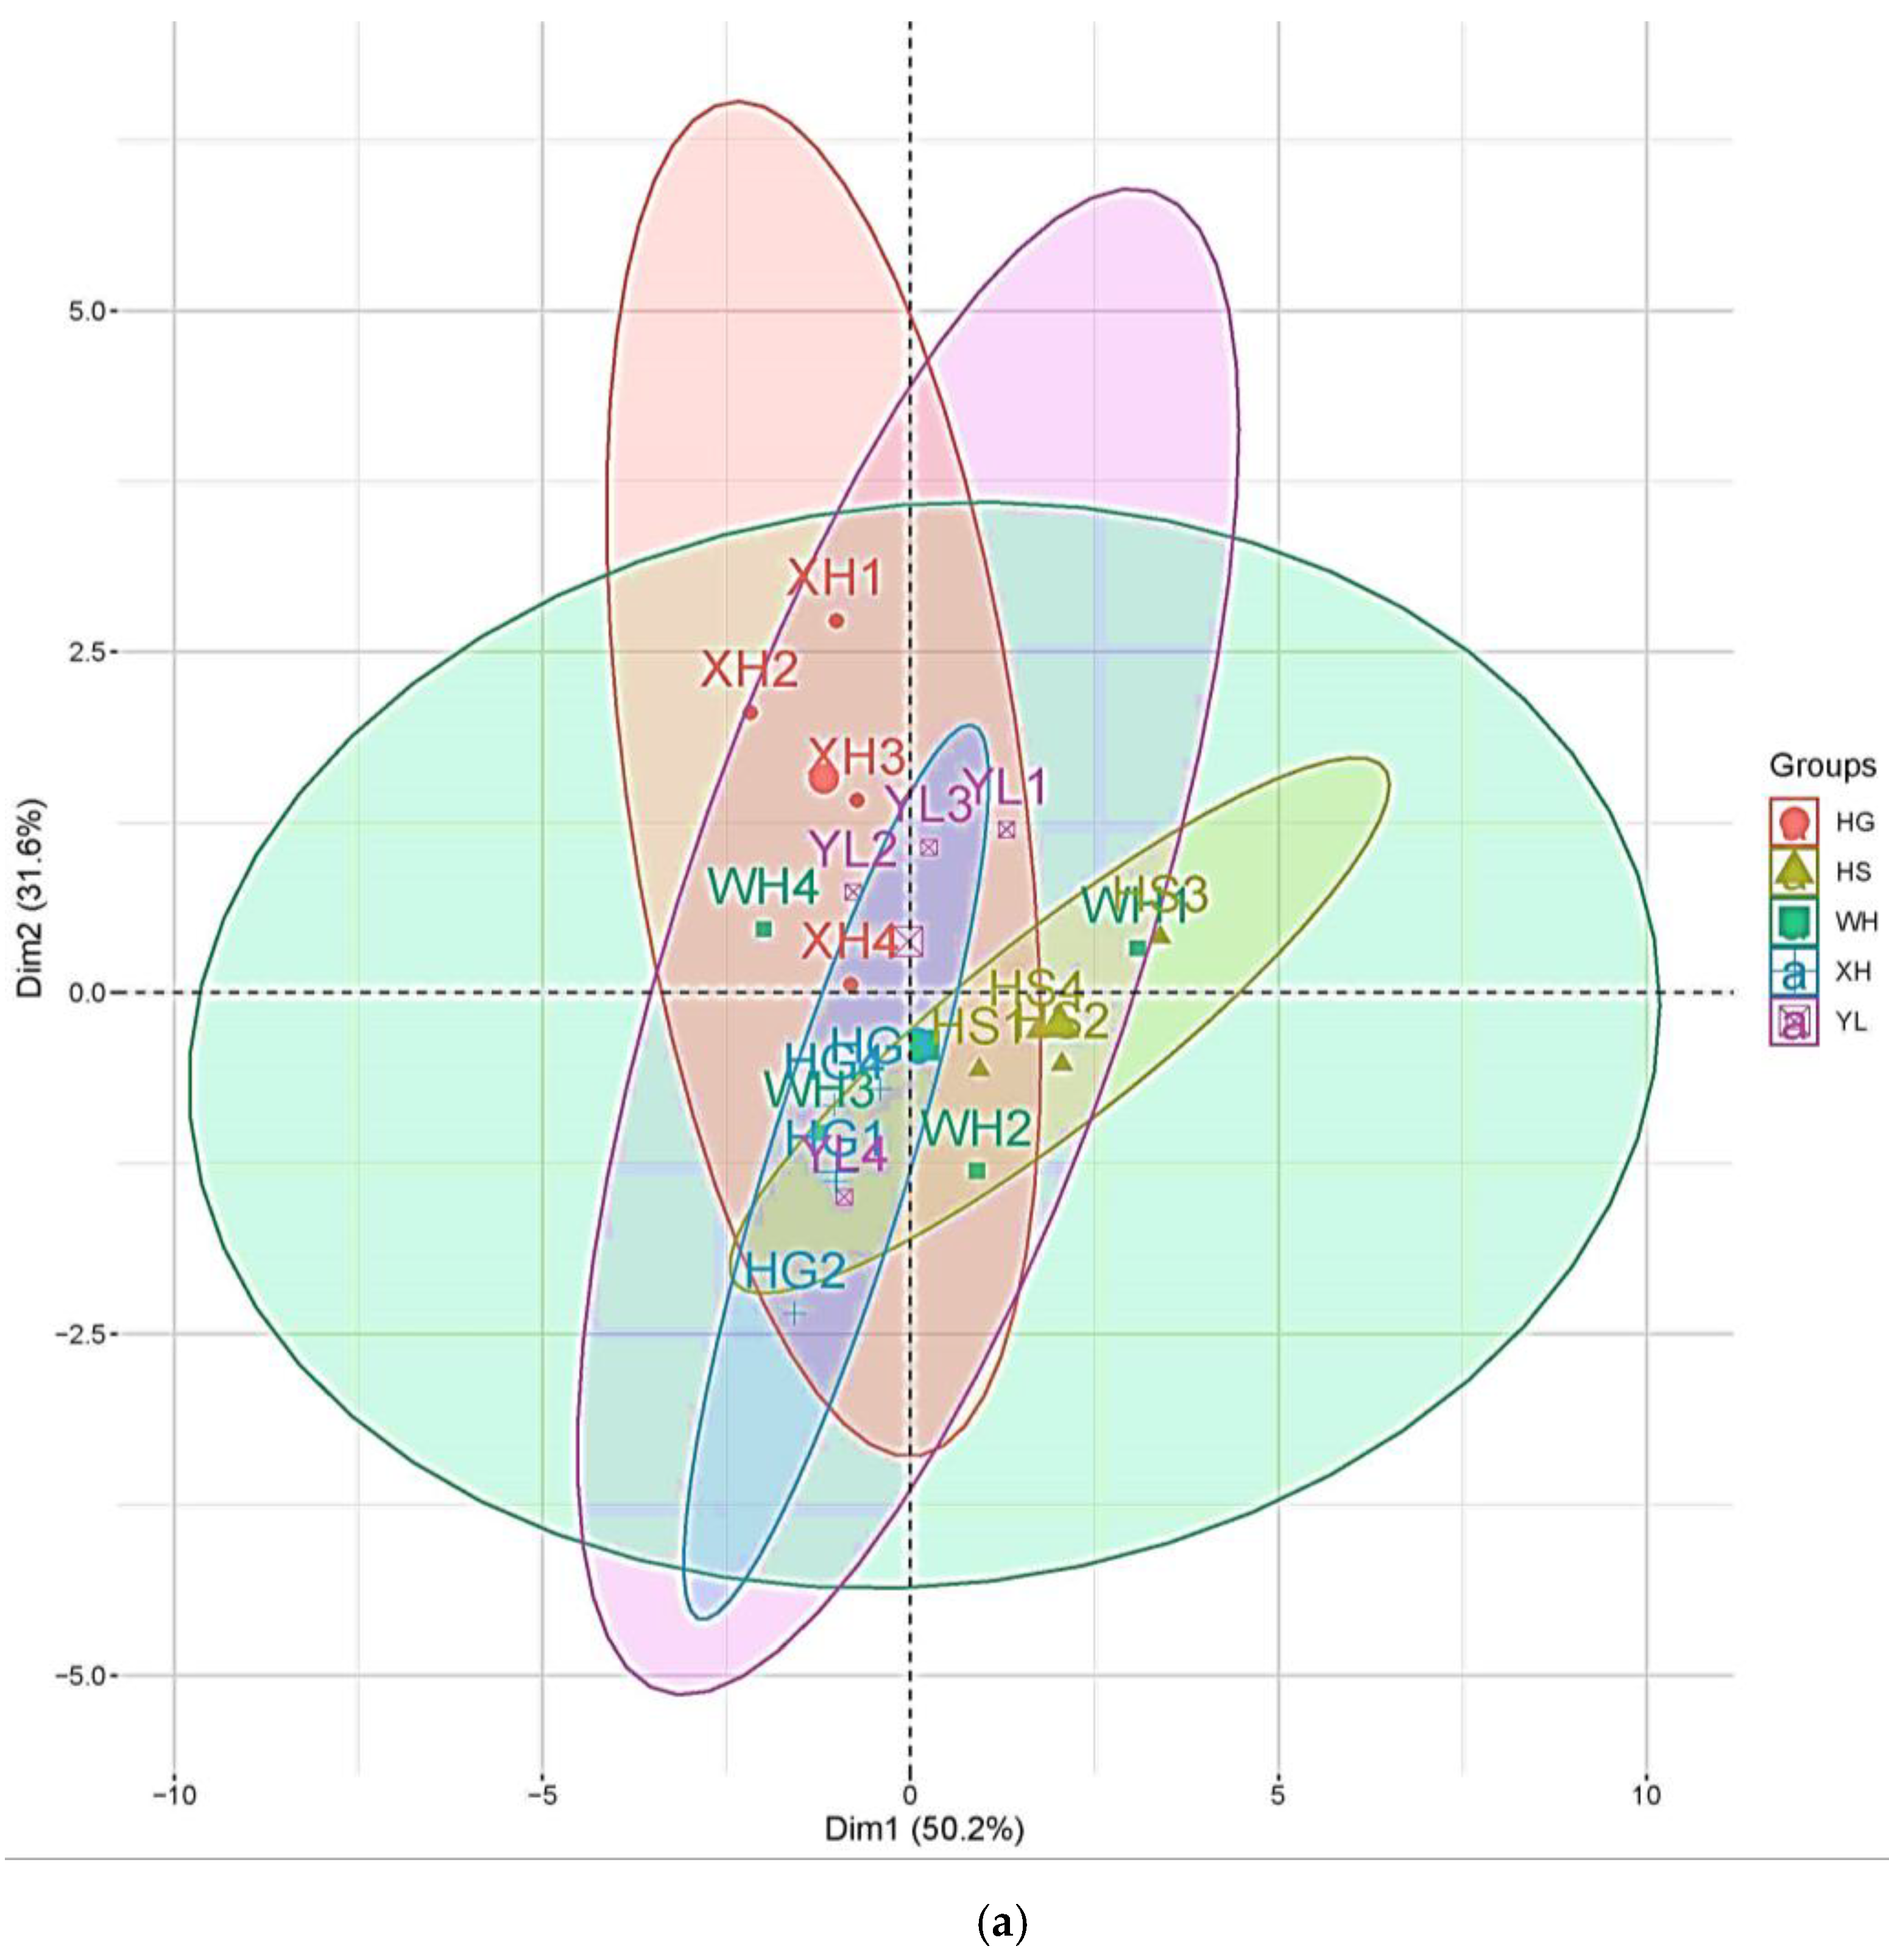
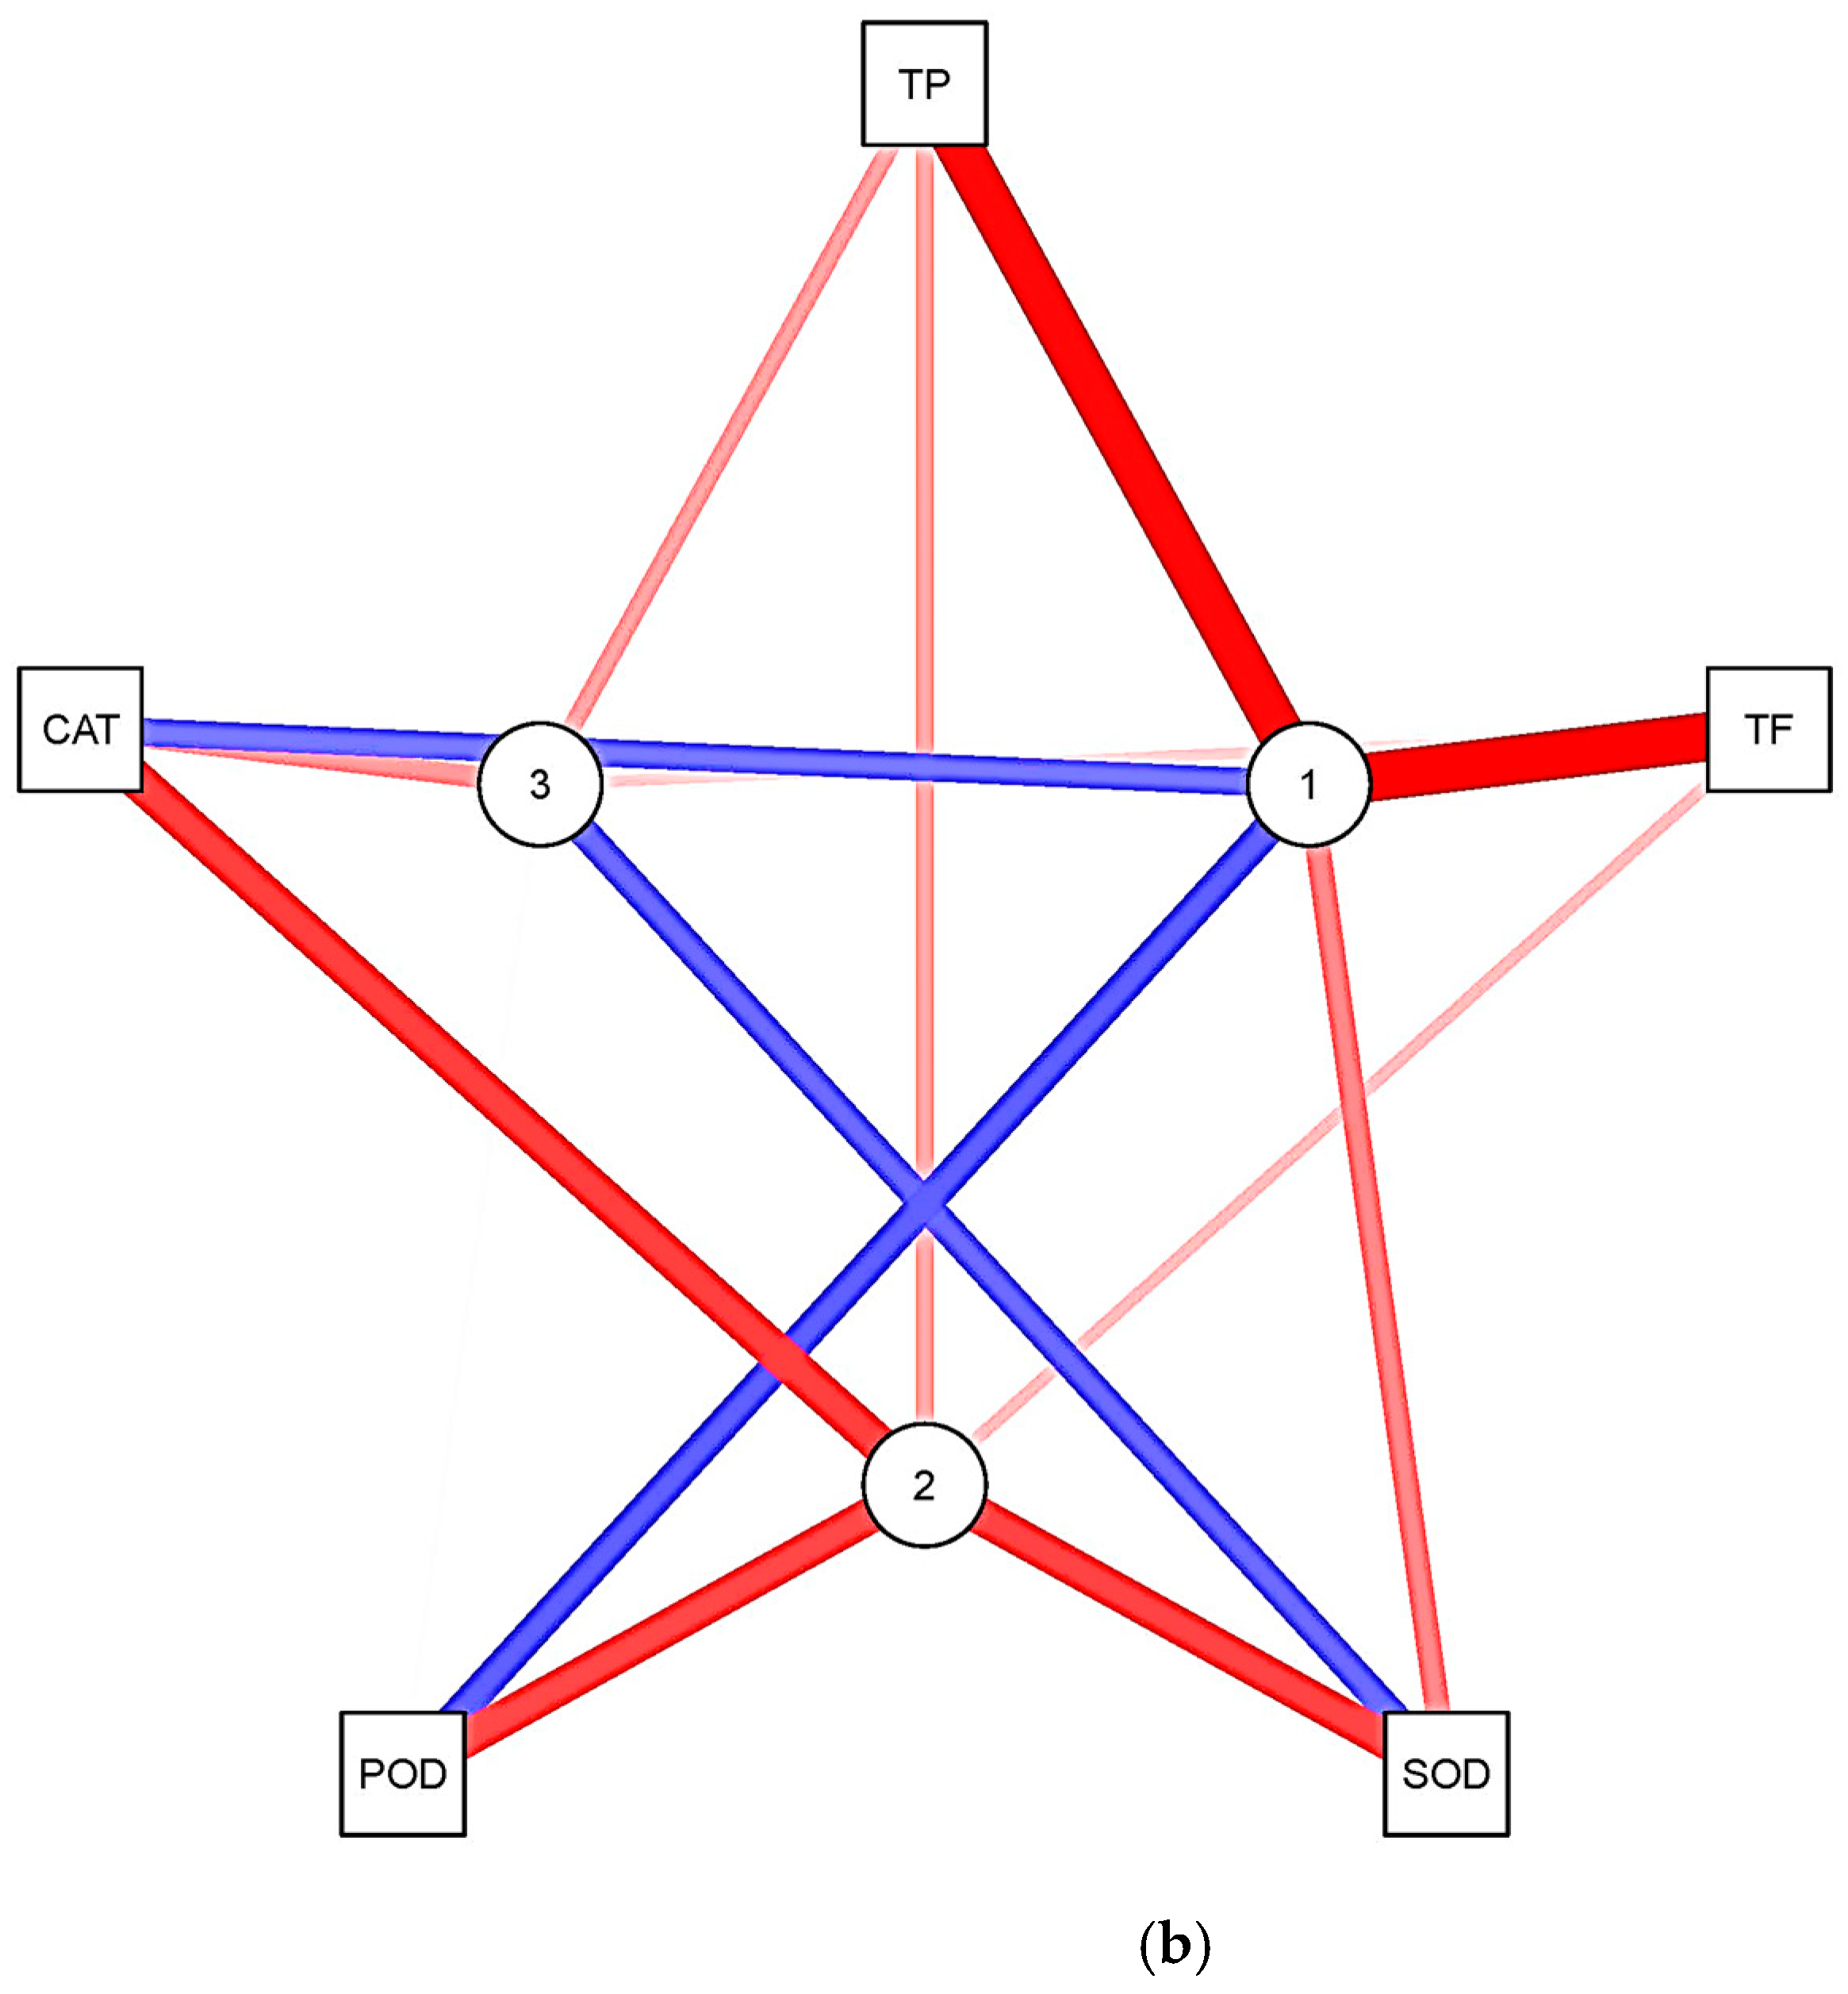
3.5. Principal Component Analysis

Our results obtained by principal component analysis are presented in Figure 5. The data of peel properties were used to establish the variations in the contents of bioactive compounds of samples. The loadings network diagram of PC1, PC2, and PC3 is shown in Figure 5b, and scores on PC1 versus PC2 are shown in Figure 5a. The first three components were chosen to examine the dataset, which explained 92.90% of the total variance. The first principal component (PC1) represented 50.20%, which was the most important component that was strongly related to the contents of total polyphenol and total flavonoids, whereas it was negatively correlated with POD activities. The second principal component (PC2) explained 31.60% was driven by the SOD, POD, and CAT activities, while the activity of SOD was the dominant variable in the third principal component (PC 3, accounting for 11.10% of the variance).
As can be seen in Figure 5a, the pear cultivars were separated by PCA based on their contents of chemical components. Nevertheless, no obvious distinction existed among Sand pear cultivars, HS and WH. Moreover, the HS has a large variation in different shelf life. HG and YL were characterized by positive values of PC1 and having higher antioxidant activities. XH was on the negative side of PC1 and PC2 and varied insignificantly in the different shelf-life durations.

4. Discussion

Peel is the major barrier between the pulp and the external environment and plays several important protective roles. In previous studies, the peel responded to stimulation in the external environment by changing its structure and components [23,24]. We observed that the outermost layer of the ultrastructure of the pear peel was the cuticle, below which was located in the thick-walled cellular layer. In addition, a wax membrane adhered to the outermost layer of the cuticle was also established earlier [25,26,27]. The results achieved in our observations are consistent with those obtained in research on the peel ultrastructure of apples, tomatoes, etc., conducted by predecessors. The wax of the peel cuticle of HS and WH was composed of a scaly wax crystal structure. The cells below the cuticle were regular in shape and arranged closely. The cuticle surface of the HG, XH, and YL pears was smooth and clean. Scaly pileup occurred only at the fruit dot. Intriguingly, the shapes of the cells below the cuticle varied considerably, and the intercellular space was large. We established that the intercellular space was filled with cutin, and the cell wall of the thick-walled cells exhibited an obvious bright-dark-bright zonal structure. The intercellular layer was thin and dark, with a high electron density. We also observed that the peel cuticle of all tested cultivars suffered from color shading of different degrees and the presence of incomplete shapes, bulges, cracks, and folds when the 30 d shelf life expired. The density of the electron cloud of the middle lamella decreased, and hence, there were significant differences in the size, shape, and arrangement of the peel cells among the different pear cultivars of or even within the same pear cultivar exposed to different storage periods or different environments. The peel ultrastructure dynamically changed along with the development, maturity, and senility of fruit [28].
Based on the research findings, we can conclude that the wax coagulated on the pear peel surface wraps the fungal spore, hypha, and unknown impurities on the peel surface, exerting the important functions of a barrier that protects the fruit. However, with the extension of the shelf life, the cellular wall and cellular contents of the epidermis cells continuously degraded, and the supporting function of the cytoskeleton and cellular physiological functions were lost. Then, the epidermis started to crack and the pulp to decay. Ruptures of the fruit epidermis may cause invasion and growth and reproduction of fungal hyphae that damage the palisade tissue, which is one of the causes of rapid putrefactive spoilage of fruit. Therefore, the peel ultrastructure and its stability of pears are objectively related to the susceptibility for fungal infection pre- and postharvest, and affected the shelf life of pear cultivar resources.
Fruit may suffer from oxidative stress that produces active oxygen species and free radicals with toxic effects and thus promote senility and apoptosis during storage. Bioactive compounds, mainly polyphenol, flavonoids, and the antioxidant enzyme, can prevent oxidative damage from harmful substances, such as active oxygen and free radicals. Moreover, the abundance of polyphenolic substances in the peel plays an important role in the prevention of fruit browning [29]. Nevertheless, certain differences exist in the contents of polyphenols and flavonoids among different cultivars or even in the fruit of the same cultivar exposed to different storage periods [30]. In the present study, HS pears had the highest average contents of total polyphenols and total flavonoids in its peel. Tannin cells were also found in the peel of HS fruit, as observed by the transmission electron microscope (Figure 2, HS). In addition, this level exhibited an increasing trend along with the prolongation of shelf life. In the next step, identification of polyphenolic and flavonoid compounds and their changes during storage would be necessary and important work.
Antioxidant enzymes are another class of bioactive compounds related to the oxidation resistance of the peel. We found that with shelf-life extension, the SOD showed no significant differences, while CAT and SOD activity showed significant differences among the different pear cultivars. In addition to participating in the removal of the harmful active oxygen, antioxidant enzymes are also involved in different physiological and biochemical reactions and are influenced by the presence and activities of other metabolic processes. Thus, the variation trends are not completely the same during the shelf life. The current research on the total antioxidant capacities of the peels of the five tested cultivars shows that the antioxidant capacity of peels from all pear cultivars tested exhibited a single-peak variation: first increasing and then decreasing. Therefore, we consider that the antioxidant capacity of the fruit increases gradually within a certain period for eliminating harmful free radicals, but the antioxidant capacity of fruit would decrease with metabolism retardation. The antioxidant capacity of the fruit is closely associated with the types and chemical structures of the bioactive compounds, the synergistic or antagonistic actions among them, and the environmental conditions. Nevertheless, the content or activity of a single antioxidant substance cannot represent the level of its antioxidant capacity [31]. Thus, a comprehensive analysis of non-enzymatic antioxidant components, antioxidant enzymes, and antioxidant capacity would facilitate a deeper and more precise evaluation of the antioxidant capacities of fruit and vegetables.

5. Conclusions

Investigating the properties of ultrastructure, chemical composition, and antioxidant activities enabled the determination of the differences in the physical and chemical characteristics of the peels in five pear cultivars during their shelf life. We observed the peel cuticles of all tested varieties had varying degrees of color loss and withering, and the integrity of the cells of peel was also damaged, but the surface layer cells of XH, HG, and YL were smoother than WH and HS, and the integrity of the peel cells was also better. It was thus clear that significant differences occurred in the variation range and variation trends in total polyphenol and total flavonoids content and the activities of POD and CAT among the different pear cultivars. The total antioxidant capacities of the peels of those four cultivars reached their maximum values at 20 d of their shelf life except WH. In conclusion, the present work provides important information for ultrastructural changes and antioxidant capacity. These results will contribute to further research on the potential protective functions in humans for fruits and the nutritive function of pear peel.

Author Contributions

H.H. and Y.C. planned and designed the experiments; methodology, H.H.; J.X. and X.D. performed and recorded data during the experiments; H.H. analyzed the data and wrote the manuscript; Z.Z., L.T., Y.Z., D.Q., C.L. and Y.C. reviewed and edited the final manuscript. All authors have read and agreed to the published version of the manuscript.

Funding

This research was supported by the China Agriculture Research System of MOF and MARA, and funded by the Agricultural Science and Technology Innovation Program (NO. CAAS-ASTIP-2016-RIP).

Institutional Review Board Statement

Not applicable.

Informed Consent Statement

Not applicable.

Data Availability Statement

Not applicable.

Acknowledgments

Thank Shisheng Wang (West China Hospital, Sichuan University) and Chengpin Shen (Omicsolution) for providing advice about data analysis and the “Wu Kong” platform (https://www.omicsolution.org/wkomics/main/, accessed on 8 November 2021) for relative principal component analysis.

Conflicts of Interest

The authors declare no conflict of interest.

References

  1. Cao, Y.F.; Zhang, Y.; Huo, H.L.; Tian, L.M.; Zhang, S.M. Analysis of leaf morphological diversity of pear (Pyrus L.) preserved in China. Acta Hortic. 2021, 1303, 55–62. [Google Scholar] [CrossRef]
  2. Li, X.G. Review on the development of pear industry in China in 30 years after the reform and opening-up policy. Fruit Yantai 2008, 4, 4–6. [Google Scholar]
  3. Kolniak-Ostek, J. Chemical composition and antioxidant capacity of different anatomical parts of pear (Pyrus communis L.). Food Chem. 2016, 203, 491–497. [Google Scholar] [CrossRef]
  4. Koch, K.; Ensikat, H.J. The hydrophobic coatings of plant surfaces: Epicuticular wax crystals and their morphologies, crystallinity and molecular self-assembly. Micron 2008, 39, 759–772. [Google Scholar] [CrossRef]
  5. Zhang, Y.X. Theory of Fruit Tree Cultivation (Northern Edition); Chinese Agriculture Press: Beijing, China, 2003; pp. 56–60. [Google Scholar]
  6. Heredia, A. Biophysical and biochemical characteristics of cutin, a plant barrier biopolymer. Biochim. Biophys. Acta 2003, 1620, 1–7. [Google Scholar] [CrossRef]
  7. Buschhaus, C.; Jetter, R. Composition differences between epicuticular and intracuticular wax substructures: How do plants seal their epid ermal surfaces. J. Exp. Bot. 2011, 62, 841–853. [Google Scholar] [CrossRef] [Green Version]
  8. Tang, Y. Effect of Cuticular Wax of Pingguoli Pear from Developing and Storage on Alternaria Alternata Pre-Penetration Process. Master’s Dissertation, Gansu Agricultural University, Lanzhou, China, 2016; pp. 1–78. [Google Scholar]
  9. Wang, J.Z. Xinpingli, a new late Chinese pear cultivar with long keep quality. J. Fruit Sci. 2004, 21, 391–392. [Google Scholar]
  10. Fric, F.; Wolf, G. Hydrolytic enzymes of ungerminated and germinated conidia of Erysiphe graminis DC. f. sp. Hordei Marchal. J. Phytopathol. 1994, 140, 1–10. [Google Scholar] [CrossRef]
  11. Fauth, M. Cutin monomers and surface wax constituents elicit H2O2 in conditioned cucumber hypocotyl segments and enhance the activity of other H2O2 elicitors. Plant Physiol. 1998, 117, 1373–1380. [Google Scholar] [CrossRef] [PubMed] [Green Version]
  12. Guo, W.L.; Guo, R.Z.; Li, X.Y.; Liu, C.L.; Kou, X.H. Effects of different coating treatments on antioxidant ability in postharvest pear. Food Sci. 2012, 33, 261–267. [Google Scholar]
  13. Li, X.; Wang, T.; Zhou, B.; Gao, W.; Cao, J.; Huang, L. Chemical composition and antioxidant and anti-inflammatory potential of peels and flesh from 10 different pear varieties (Pyrus spp.). Food Chem. 2014, 152, 531–538. [Google Scholar] [CrossRef] [PubMed]
  14. Galvis Sánchez, A.C.; Gil-Izquierdo, A.; Gil, M.I. Comparative study of six pear cultivars in terms of their phenolic and vitamin C contents and antioxidant capacity. J. Sci. Food Agric. 2003, 83, 995–1003. [Google Scholar] [CrossRef]
  15. Peng, F.; Yang, Y.D.; Cheng, C.H.; Xie, Y.; Liu, Y.L. Optimization of microwave-assisted extraction of total flavonoids from“An” pear (Pyrus ussuriensis Maxim) and components analysis. Food Sci. Technol. 2015, 40, 196–203. [Google Scholar]
  16. Zou, Q. Guidance of Plant Physiology and Biochemistry Experiment; China Agriculture Press: Beijing, China, 1995; pp. 59–99. [Google Scholar]
  17. Hammerschmidt, R.; Nuckles, E.M.; Kuć, J. Association of enhanced peroxidase activity with induced systemic resistance of cucumber to Colletotrichum lagenarium. Physiol. Plant Pathol. 1982, 20, 73–76. [Google Scholar] [CrossRef]
  18. Rajeswari, V.; Paliwal, K. Peroxidase and catalase changes during in vitro adventitious shoot organogenesis from hypocotyls of Albizia odoratissima L.f. (Benth). Acta Physiol. Plant. 2008, 30, 825–832. [Google Scholar] [CrossRef]
  19. Kerio, L.C.; Wachira, F.N.; Wanyoko, J.K.; Rotich, M.K. Total polyphenols, catechin profiles and antioxidant activity of tea products from purple leaf coloured tea cultivars. Food Chem. 2013, 136, 1405–1413. [Google Scholar] [CrossRef]
  20. Peng, Y.B.; Zhang, D.P. Ultrastructure of Epidermis and Flesh of the Developing Apple Fruit. Acta Bot. Sin. 2000, 42, 794–802. [Google Scholar]
  21. Benzie, I.; Strain, J.J. The Ferric Reducing Ability of Plasma (FRAP) as a Measure of “Antioxidant Power”: The FRAP Assay. Anal. Biochem. 1996, 239, 70–76. [Google Scholar] [CrossRef] [Green Version]
  22. Wang, S.; Zhu, H.; Zhou, H.; Cheng, J.; Yang, H. Mspectraai: A powerful platform for deciphering proteome profiling of multi-tumor mass spectrometry data by using deep neural networks. BMC Bioinform. 2020, 21, 439. [Google Scholar] [CrossRef]
  23. Schreiber, L.; Skrabs, M.; Hartmann, K.D.; Diamantopoulos, P.; Simanova, E.; Santrucek, J. Effect of humidity on cuticular water permeability of isolated cuticular membranes and leaf disks. Planta 2001, 214, 274–282. [Google Scholar] [CrossRef]
  24. Kunst, L.; Samuels, A.L. Biosynthesis and secretion of plant cuticular wax. Prog. Lipid. Res. 2003, 42, 51–80. [Google Scholar] [CrossRef]
  25. Curry, E. Ultrastructure of epicuticular wax aggregates during fruit development in apple (Malus domestica borkh.). J. Pomol. Hortic. Sci. 2005, 80, 668–676. [Google Scholar]
  26. Jeffree, C.E. The fine structure of the plant cuticle. In Biology of the Plant Cuticle; Riederer, M., Müller, C., Eds.; Blackwell Publishing: Oxford, UK, 2006; pp. 11–125. [Google Scholar]
  27. Segado, P.; Domã Nguez, E.; Heredia, A. Ultrastructure of the epidermal cell wall and cuticle of tomato fruit (Solanum lycopersicum L.) during development. Plant Physiol. 2016, 170, 935–946. [Google Scholar] [CrossRef] [PubMed] [Green Version]
  28. Riederer, M.; Schönherr, J. Development of plant cuticles: Fine structure and cutin composition of Clivia miniata Reg leaves. Planta 1988, 174, 127–138. [Google Scholar] [CrossRef]
  29. Zhang, X.S.; Zheng, Y.C.; Cao, Y.F.; Tian, L.M.; Dong, X.G.; Zhang, Y.; Qi, D.; Huo, H.L. The composition and content of polyphenols in 16 parts of ‘Zaosu’ and ‘Nanguoli’. Sci. Agric. Sin. 2017, 50, 545–555. [Google Scholar]
  30. Zeng, S.M.; Yang, J.; Wang, L.; Wang, S.K.; Li, X.G. Study on phenolics content and its antioxidant activity in the fruit of pear species. J. Fruit Sci. 2014, 31, 39–44. [Google Scholar]
  31. Stinco, C.M.; Baroni, M.V.; Naranjo, R.D.D.P.; Wunderlin, D.A.; Heredia, F.J.; Meléndez-Martínez, A.J. Hydrophilic antioxidant compounds in orange juice from different fruit cultivars: Composition and antioxidant activity evaluated by chemical and cellular based (saccharomyces cerevisiae) assays. J. Food Compos. Anal. 2015, 37, 1–10. [Google Scholar] [CrossRef]
Figure 1. Observations of the pear peel structure under the scanning electron microscope. 0 d: 0 d of shelf life, 30 d: 30 d of shelf life; PH: sporophore; AN: sporangium; MY: hypha; UN: unknown impurity.
Agronomy 11 02274 g001
Figure 2. Observations of the pear peel structure using the transmission electron microscope. Cu: cuticle; CW: cell wall; CV: hollow cells; WL: wax layer; N: cell nucleus; TC: tannin cells; PL: separation of cytoplasm and wall; CH: chloroplast; ML: middle lamella; LD: lipid droplet.
Agronomy 11 02274 g002
Figure 3. Changes in total polyphenol (a) and total flavonoids content (b).
Agronomy 11 02274 g003
Figure 4. T−AOC and activities of the antioxidant enzymes in the pear peel during the shelf life. (a) Activities of SOD, (b) Activities of POD, (c) Activities of CAT, (d) T-AOC capacity.
Agronomy 11 02274 g004
Figure 5. PCA of five pear cultivars. (a) Cultivars scores scatter plot. The number behind the cultivars name represents different shelf life, and 1–4 represents 0 d, 10 d, 20 d, 30 d, respectively. The ellipse size indicates the degree of variation within the group. (b) The loadings network diagram of PCA. The graph shows the magnitude of the principal component load in the form of a network diagram. TP: total polyphenol, TF: total flavonoids. The thickness of the line indicates the magnitude of the value. Red is positive and blue is negative.
Agronomy 11 02274 g005aAgronomy 11 02274 g005b
Table 1. Comparative differences in the chemical composition and antioxidant activities among samples.
CultivarsTotal Polyphenol mg kg−1Total Flavonoids mg kg−1SOD
U g−1
POD
U g−1
CAT
U g−1
T-AOC
U g−1
HS2085.82 b1362.34 b1.38 a1.12 a3.68 a39.48 ab
WH1800.12 b1039.76 ab0.91 a8.86 ab7.82 a26.37 a
XH1485.23 ab842.07 a1.34 a18.98 b18.77 b54.02 bc
HG1025.01 a712.70 a0.96 a7.03 a3.52 a43.81 ab
YL1556.53 ab939.52 a1.40 a8.97 ab10.23 a68.76 c
F-value3.6143.8781.8933.4307.0454.085
p-value of Cultivars0.0300.0230.1640.0350.0020.020
Different letters after the digital represent significant differences, shared letters represent no significant differences.
Publisher’s Note: MDPI stays neutral with regard to jurisdictional claims in published maps and institutional affiliations.

