Article

Comparative Physiological, Biochemical, and Proteomic Responses of Photooxidation-Prone Rice Mutant 812HS under High Light Conditions

by
Aisha Almakas
1,2,3,
Guoxiang Chen
1,
Fahad Masoud Wattoo
4,5,*,
Rashid Mehmood Rana
4,
Muhammad Asif Saleem
6,
Zhiping Gao
1,
Muhammad Waqas Amjid
7,
Muhammad Ishaq Asif Rehmani
8,*,
Abeer Hashem
9 and
Elsayed Fathi Abd_Allah
10
1
Jiangsu Key Laboratory of Biodiversity and Biotechnology, College of Life Sciences, Nanjing Normal University, Nanjing 210023, China
2
Key Laboratory of Biology and Genetics and Breeding for Soybean, Ministry of Agriculture, State Key Laboratory for Crop Genetics and Germplasm Enhancement, National Center for Soybean Improvement, Nanjing Agricultural University, Nanjing 210095, China
3
Department of Crops Science and Genetic Improvement, Faculty of Agriculture, Food and Environment, Sana’a University, Sana’a 19065, Yemen
4
Department of Plant Breeding and Genetics, PMAS-Arid Agriculture University, Rawalpindi 46300, Pakistan
5
National Center for Industrial Biotechnology, PMAS-Arid Agriculture University, Rawalpindi 46300, Pakistan
6
Department of Plant Breeding & Genetics, Bahauddin Zakariya University, Multan 60800, Pakistan
7
State Key Laboratory of Crop Genetics and Germplasm Enhancement, Cotton Germplasm Enhancement and Application Engineering Research Center (Ministry of Education), Nanjing Agricultural University, Nanjing 210095, China
8
Department of Agronomy, Ghazi University, Dera Ghazi Khan 32200, Pakistan
9
Botany and Microbiology Department, College of Science, King Saud University, P.O. Box 2460, Riyadh 11451, Saudi Arabia
10
Plant Production Department, College of Food and Agricultural Sciences, King Saud University, P.O. Box. 2460, Riyadh 11451, Saudi Arabia
*
Authors to whom correspondence should be addressed.
Agronomy 2021, 11(11), 2225; https://doi.org/10.3390/agronomy11112225
Submission received: 30 August 2021 / Revised: 4 October 2021 / Accepted: 11 October 2021 / Published: 3 November 2021

Abstract

:
Photosynthetic efficiency decreases as light energy surpasses the photosynthesis capacity. This study was designed to investigate the potential effects of high-intensity light on the photooxidation-prone mutant 812HS of rice and its wild-type 812S during yellow and recovering stages. Results showed that in the yellowing stage, light oxidation occurs due to the exposure of mutant 812HS leaves to the high sunlight, which causes yellowing of the leaves, leading to a reduction in the photochemical activities, physiological mechanisms, and protein contents in mutant 812HS. In the recovery stage, mutant 812HS leaves were exposed to the maximum high brightness, the mutant’s leaves were draped with a dark cover to decrease the exposure of leaves of the plants from direct sunlight, which leads to the restoration of the green color again to the mutant 812HS leaves, leading to improving the performance of the photochemical activities, physiological mechanisms, and protein contents in mutant 812HS. Exposing leaves of mutant 812HS to high light at the yellow stage also resulted in a decrease in the net photosynthetic rate (Pn) in carotenoids content and chlorophyll a and b. Similarly, chlorophyll fluorescence of mutant 812HS decreased in (O-I-J-I-P) curves, and the ATP content, Mg2+-ATPase, and Ca2+-ATPase activities also decreased. An increase in energy dissipation was observed, while ABS/RC, DI0/RC, and TR0/RC values in mutant 812HS at the yellow stage increased. During photooxidation, an increase in O2•– and H2O2 contents was observed in mutant 812HS. While O2•– and H2O2 contents were decreased in mutant 812HS at the recovery stage. The rate of thylakoid membrane protein content was significantly decreased in mutant 812HS at the yellow stage, while at the recovery stage, there was no significant decrease. Our findings showed that photooxidation prompted oxidative damages and lipid peroxidation that caused severe damages to the membranes of the cell, photosynthetic pigments degradation, protein levels, and photosynthesis inhibition in mutant 812HS.

1. Introduction

Rice (Oryza sativa L.) is a staple food crop for more than 50% of global population and is considered a primary source of dietary protein in many Asian countries [1]. Moreover, rice is a typical model crop for cereal crop research [2]. Among the several factors limiting crop productivity and growth temperature and light intensity are considered critical [3,4,5]. High light intensity causes irremediable impairment to the photosystem in the thylakoid membrane [6]. Plant requires a certain amount of light to carry out photosynthesis and the rate of photosynthesis increases by increasing light intensity. However, if light intensity exceeds the limit of photosynthetic capacity, it causes photooxidation [3].
In plants, photooxidative stress results in the accumulation of reactive oxygen species (ROS). Subsequently, ROS damage various biomolecules including photosynthetic pigments, lipids and proteins in the thylakoid membrane. Eventually, these damages cause malfunction of photosynthetic apparatus and reduced photosynthesis [7,8,9,10]. Likewise, prolonged photoinhibition during yellow stage triggers photooxidation and damages the photosystem. The photooxidation-induced oxidative stress results in the production of aldehyde as a result of lipid peroxidation. Photooxidation induced by high light intensity causes the disturbance of redox homeostasis by enhanced production of ROS. The ROS damage membrane lipids, nucleic acids, proteins and chlorophyll. These damages result in permanent impairment to photosynthetic apparatus and ruin photosynthetic pigments [11,12].
A comprehensive analysis was performed to reveal the extent of damage caused by photooxidation in japonica and indica rice (Oryza sativa) under photooxidation and shading conditions. The findings suggested that photooxidation had a pronounced effect on photooxidation-sensitive cultivars [3].
The leaf morphology variations have been due to adaptation to absorb irradiance more proficiently for better photosynthesis [13,14,15]. A two-line sterile rice wild-type 812S and mutant 812HS displayed photooxidation during yellow and recovery growth stages. After exposure to high lighting, target plants illustrated major differences in agronomic traits between wild-type 812S and mutant 812HS. It is speculated that the mutant gene may be related to the production of chlorophyll (Chl) and alpha-tocopherol. This mutant gene protects photooxidation and photodamages, which might be helpful to elucidate the mechanism of photooxidation in rice [16].
Due to the upsurge of light intensity in the field environment, the top leaves of the mutant 812HS lost greenery (yellowing) after half a month. However, the phenotype of wild-type 812S did not change much, while mutant 812HS exhibited significant phenotypical differences. The photosynthetic pigments variations, Chl fluorescence, and net photosynthetic rate of mutant 812HS and wild-type 812S during the yellow and recovery stages are investigated in this study. Further, alterations in ATP content, Mg2+-ATPase, and Ca2+-ATPase activities, as well as oxidative markers (O2•– and H2O2 content), and soluble protein contents by SDS-PAGE analysis, Western blot analysis, and BN-PAGE between mutant 812HS and wild-type 812S were also investigated.

2. Materials and Methods

2.1. Plant Material

Rice genotypes 812S (wild-type) and 812HS (mutant) were acquired from Jiangsu Academy of Agricultural Sciences and bred at the research area of the Xianlin Campus, Nanjing Normal University Nanjing, Jiangsu, China. The incidence of the yellow stage occurred from mid-July to the end of July 2018. The recovery stage was from the beginning of August to the middle of August of 2018. Temperatures ranged from 26.6 ± 0.11 °C, 34.1 ± 0.14 °C, to 19.25 ± 0.28 °C, respectively, with humid conditions (relative humidity 79.2 ± 0.85%). The application of nitrogen0 (N) fertilizer (3375 kg ha–1) in combination with a nitrogen–phosphorus–potassium ratio of 1:0.6:0.6 was applied. Plants were fertilized and watered regularly during the yellow and recovery stages. In the beginning, the leaf color was green in the mutant (812HS). After high illumination intensity, the leaves of mutants HS812 turned yellow during the yellow stage. Under the shading experiment, the leaves of mutants HS812 were covered by the black cover for attaining 65% of natural light at the rice canopy during the recovery stage. Separate plant leaves were collected and instantly iced up using liquid nitrogen and, then, preserved at −80 °C. Experiment was performed in triplicate.

2.2. Measurement of Chlorophyll Content

The determination of the Chl a and Chl b contents, and carotenoid contents, were determined as reported earlier [17]. The pigment contents were determined in mg g–1 fresh weight (WF).

2.3. Net Photosynthetic Content and Chlorophyll Fluorescence Determination

Photosynthesis related parameters were measured by the LI-6400 portable Infra-Red Gas Analyzer (Li-Cor Inc., Lincoln, NE 68504, USA) [18]. The intercellular CO2 concentration (Ci) for each plant leaf was also measured. Experiments were carried out from 10:00 to 12:00 pm in triplicates. Fifteen leaves were included in each replicate. For this purpose, topmost and fully developed leaves were selected. For the analysis of Chl fluorescence, a pocket fluorimeter (Handy PEA, Hansatech, UK) was used for the measurement of the fluorescence parameters of target leaves early in the morning. Continuous exposure of red light was used on flag leaves for illumination (peak at 650 nm) for 1 s at 3000 mol m−2 s−1 after 20 min of dark adaption to obtain an actual fluorescence intensity of maximum value (FM). Biolyzer HP3 software was used for the analysis of specific energy fluxes and energy pipeline models. According to JIP test formulae, the parameters of fluorescence were determined from the fast chlorophyll a (Chl a) fluorescence transient (OJIP) [19].

2.4. O2•– and H2O2 Estimation

Determination for O2•– was carried out by observing hydroxylamine conversion to nitrites with slight alterations [20]. Plant material (0.2 g) was homogenized using 3.0 mL of 65 mM K0 phosphate buffer (pH 7.8) and centrifuged (5000× g; 4 °C) for 10 min. Then, 675 µL of the previously made buffer of phosphate was mixed with the 750 µL of the supernatant obtained as a result of centrifugation, and 10 mM hydroxylamine chlorhydrate was also added. After that, incubation was carried out, and then, 17 mM sulfanilamide and 7 mM α-naphthylamine were added into the 500 µL of the mixture in the same quantity, and ether was also added in the same volume in that mixture. It was, then, incubated again. Subsequently, this mixture was centrifuged for 5 min at 1500× g, and as a result of this, all the estimated absorbance was observed to be 530 nm, and O2•– production was estimated by using a standard curve of NaNO2. The conclusion was given in µmol (nitrite) g–1 (FM).
Estimation of H2O2 was carried out by utilizing observing titanium sulfate levels [21]. A homogenized mixture of plant material (0.5 g) was made by adding 50 mM phosphate buffer 50 mM, 6.8 pH, and then, centrifugation was carried out. Subsequently, the addition of 0.1% w/v TiCl4 and v/v 20% H2SO4 in the supernatant was carried out, and then, centrifugation was carried out for 15 min at 6000× g. Consequently, the observed absorbance was about 410nm when the spectrophotometer (Cintra 1010, GBC Scientific Equipment, Melbourne, Australia) was utilized, and H2O2 reading was completed according to standard.

2.5. Ca2+-ATPase, ATP Content, and Mg2+-ATPase Activities

The isolation of chloroplast was carried out according to reported methods [22,23]. Five grams of plant material were ground in the medium containing 10 mM NaCl, 5 mM MgCl2, 50 mM Tris-HCl, 0.4 M sucrose, and 0.1% bovine serum albumin (BSA, pH 7.6). Centrifugation of the homogenized mixture was done for 2 min at 1000× g. Subsequently, the obtained supernatant was centrifuged again (2 min at 2000× g). After removal of supernatant, the extraction medium was added to the precipitate, then, obtained tubes were revolved slightly on ice blocks to attain a constant chloroplast suspension. Afterward, the suspension material was kept in dark conditions on ice for the following measures. The bioluminescence method [24] was utilized for the measurement of the ATP content and expressed as μmol (ATP) mg–1 (Chl). Ca2+-ATPase and Mg2+-ATPase activities were measured as described earlierVallejos, et al. [25], and enzyme activity was (μmol (Pi) mg–1 (Chl) h–1) was recorded.

2.6. SDS-PAGE

The extraction of proteins was carried out in cool medium (Tris–HCl 50 mM, 7.6 pH, 5 MgCl2 5 mM, 10 mM NaCl, 0.1 percent BSA, and 0.4 M sucrose) and combined with an equal volume of sodium dodecyl sulphate loading buffer (SDS) (ten percent (w/v) glycerol, 5.0 percent (v/v) mercaptoethanol, SDS 2.3 percent, Tris–HCl 6.25 mM (pH 6.8), and 0.01% bromophenol blue (w/v)). Identical amounts of protein were put into a 12 percent polyacrylamide gel, after boiling the obtained samples for 5 min. Coomassie Brilliant Blue R-250 staining was utilized to highlight protein bands on the gel, which was run at 120 V.

2.7. Western Blot Analysis

For Western blot analysis, a solution containing the thylakoid membrane was made, and then, the thylakoid solution that was isolated was treated beforehand with a buffer loading that contained the following constituents 5% sucrose, 0.02% bromophenol blue, 5% SDS, 2 mM EDTA, mercaptoethanol 30mM, and tris-HCL 125 mM (pH 6.8), and after that, it was boiled for almost 5 min. For the detection of antibodies, an instrument called a chemiluminescence detection system (ECL, Qiagen, Shanghai, China) was used, and immunoblot analysis was utilized for protein. Samples of thylakoid protein containing a similar amount of Chl were initially isolated using 12% PAGE-SDS, which were, then, shifted to PVDF membranes for immunoblotting with antibodies of various types (Agrisera, Sweden).

2.8. Blue Native PAGE

The thylakoid membrane constituents are solubilized and separated according to a previously established protocol [26]. Before performing centrifugation for the separation of particles, namely, proteins based on their shape and size at 4 °C at 15,000× g for 30 min, membrane constituents, particularly the proteins, were first solubilized by utilizing 4% Dodecyl-b-d-maltoside DM for 30 min at 4 °C. Subsequently, the treatment of supernatant was carried out with Coomassie-blue solution 10mL (5%, w/v) Serva blue G in aminocaproic acid (750 mM) and was, then, laden in the BN-PAGE slot. Two types of gels are used: one separating gel containing a gradient of 12% acrylamide and another stacking gel containing 4% acrylamide. Every streak contained an equal amount of supernatant, and afterward, gel electrophoresis was performed at 4 °C. When the electrophoresis was completed, the protein complexes could, then, be seen in the BN gel.

3. Results and Discussion

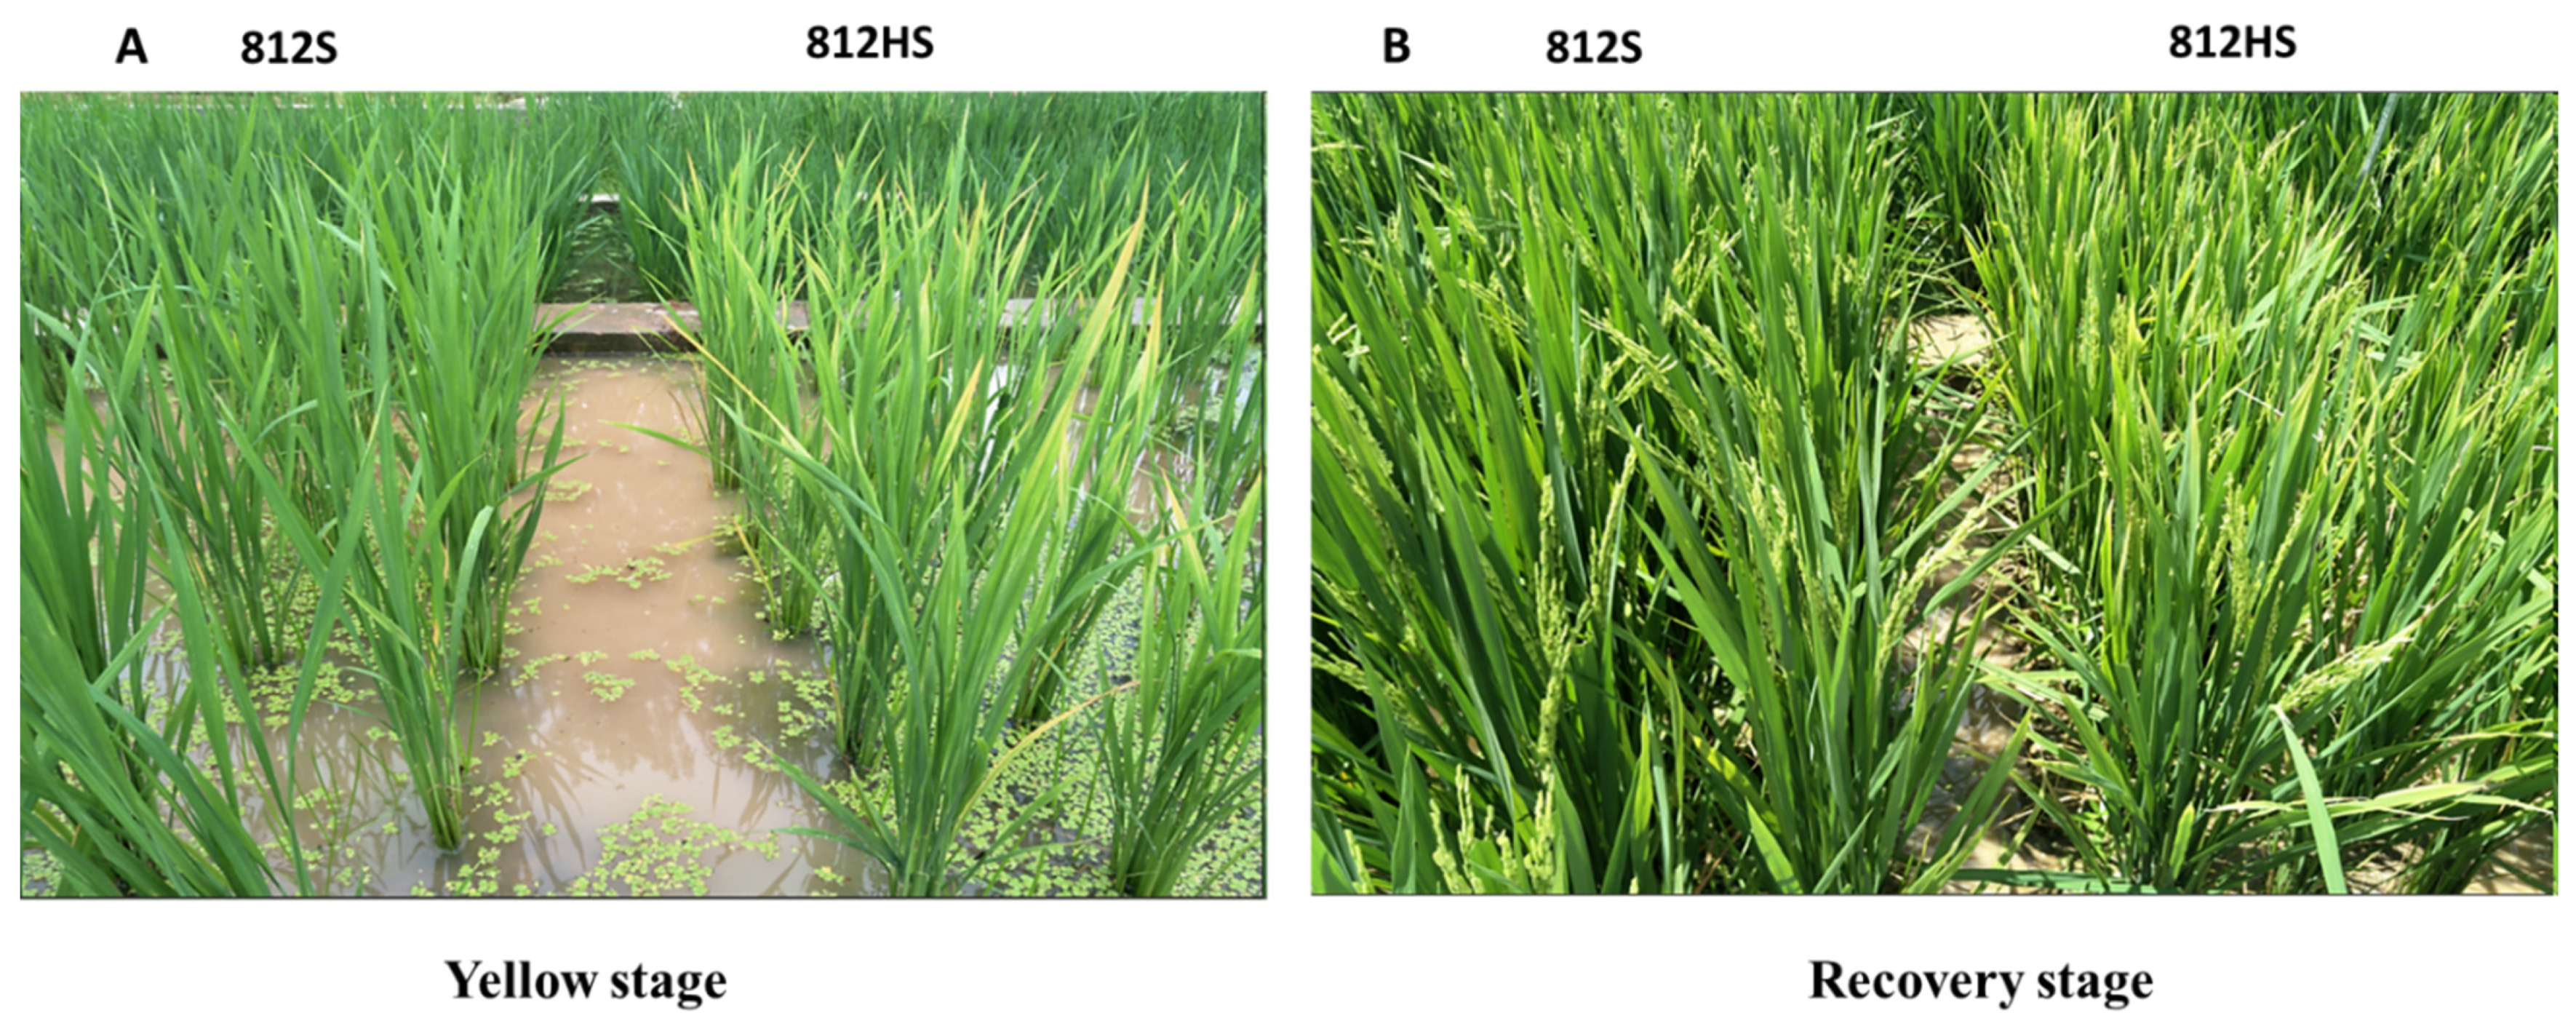
3.1. Assessment Based on Leaf Color

Rice plants exhibited significant changes in 812HS and 812S leaves during the yellow and recovery stages. At the exposure to high intensity of light, the mutant 812HS plant’s flag leaf began to start yellowing, gradually, which started from the youngest leaves to down oldest leaves during the yellow stage. In contrast, the wild-type 812S plant retained its normal green appearance (Figure 1A). While in the recovery phase, the green color was recovered in 812HS plants, by covering the mutant 812HS plants by attaching a black cover to reduce the intensity of illumination on the leaves where the green color of the leaves was restored; therefore, no major differences were noticed in leaf color between wild-type and 812HS mutant. (Figure 1B).

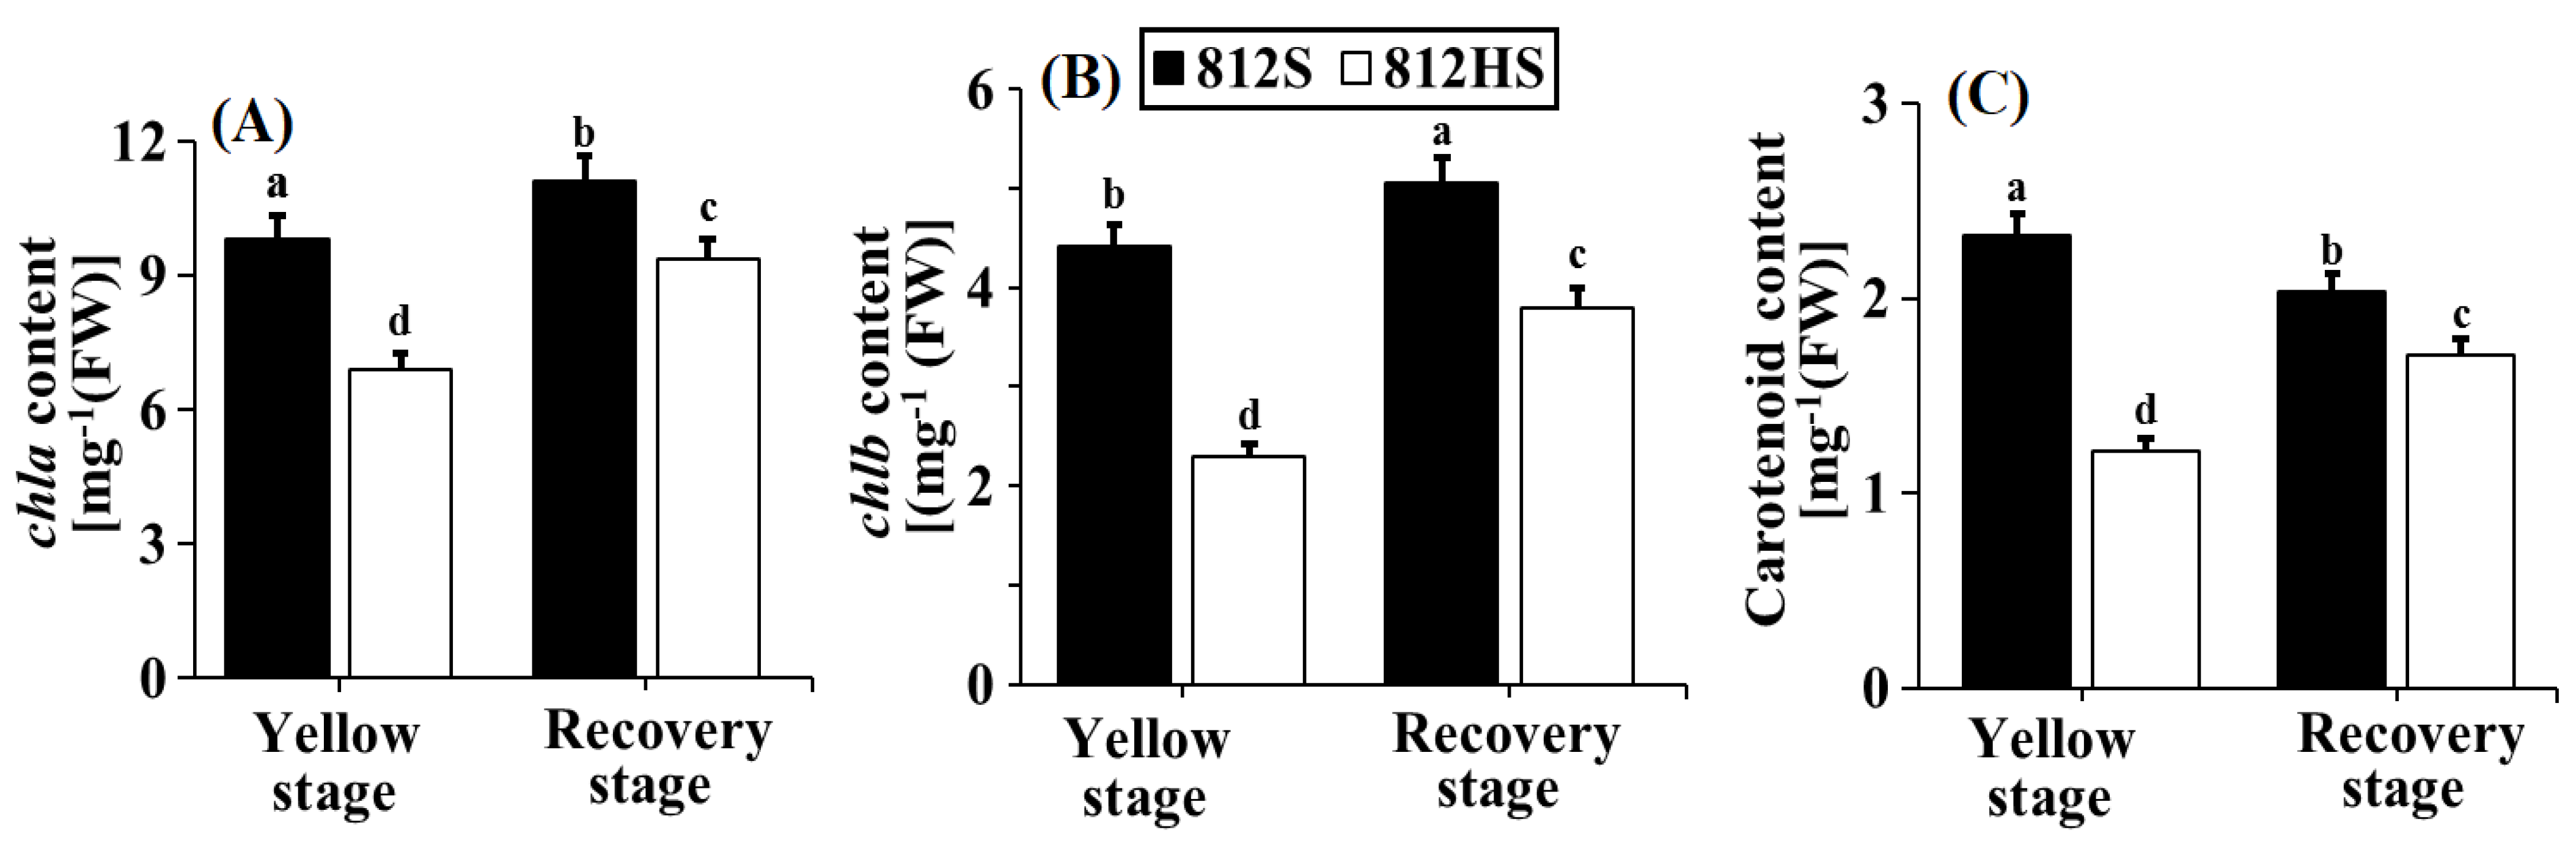
3.2. Pigment Content

Photosynthetic pigments are considered potential and sensitive biomarkers under stress conditions [27]. Leaf carotenoid, and Chl a and Chl b contents were drastically reduced in mutant 812HS as compared to that of wild-type 812S during the yellow stage (Figure 2A–C), while at the recovery stage, there was an increase in Chl a and Chl b and carotenoid constituents for the plants of mutant 812HS compared with the yellow stage. Photooxidation may lead to a decrease in Chl levels by inhibiting the biosynthesis of Chl [28] or affecting the enzymes employed in Chl biosynthesis pathways [29].

3.3. Net Photosynthetic Rate

Photosynthesis provides energy to plants that are needed for their growth. In this study, the net photosynthetic ratio was rapidly decreased in the mutant 812HS leaves and significantly lower than wild-type 812S leaves during the yellow stage (Figure 3). At the recovery stage, an increased net photosynthetic rate (Pn) was recorded for the leaves of mutant 812HS (Figure 3). The increase in Ci values means that the carboxylation ability of CO2 was decreased. Then, the carboxylation ability of CO2 was decreased, which indicated that the photosynthesis rate was greatly affected.

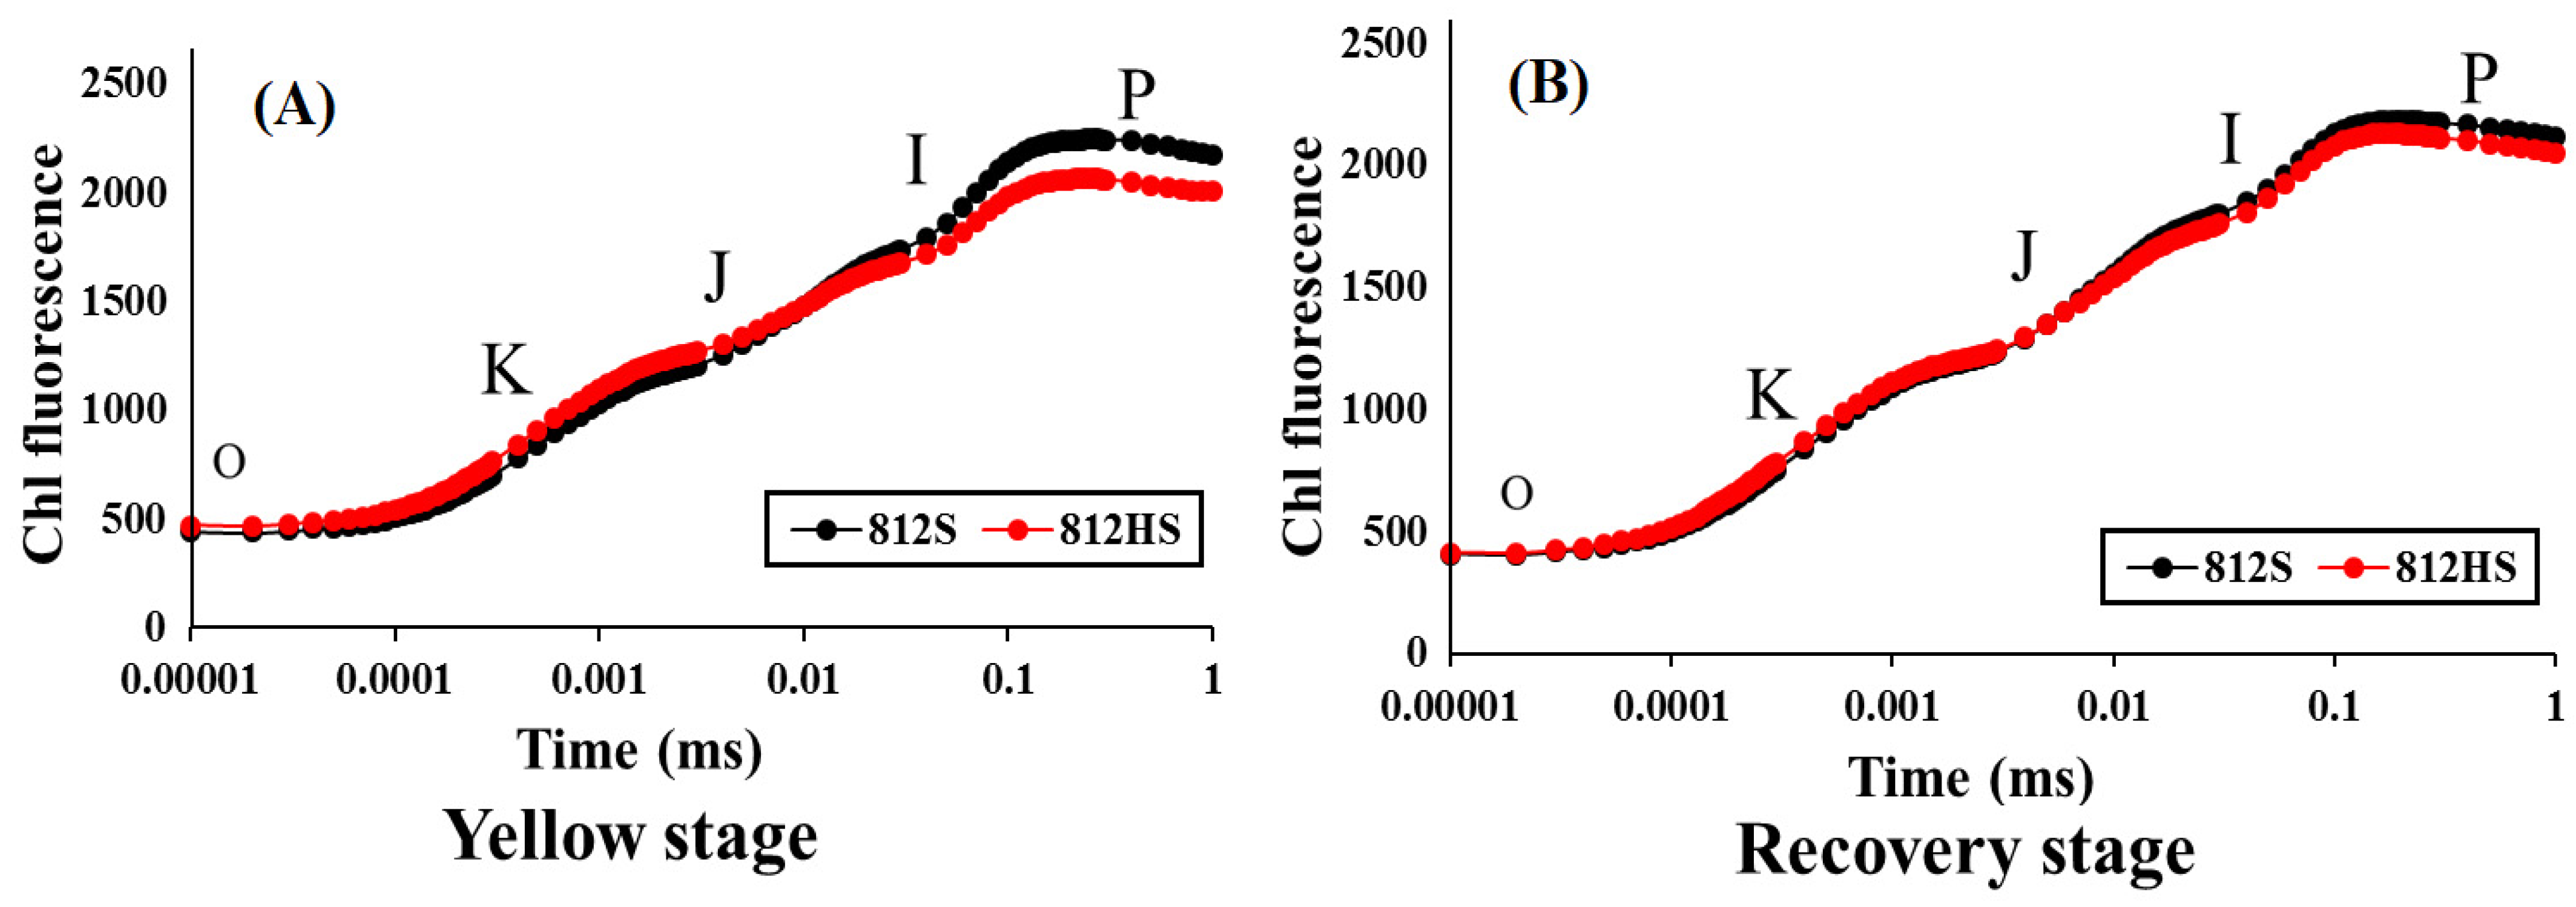
3.4. Induction of Kinetics of Chlorophyll Fluorescence

Fluorescence data are converted into biophysical parameters with the OJIP test for the quantification of PSII performance [24,30]. The results of the OJIP test presented no distinct alterations in the wild-type 812S leaves and mutant 812HS at the recovery stage (Figure 4B). A difference will be insignificant if observed at the yellow stage of mutant 812HS with the increasing light intensity. Significant photooxidation effects in the leaves of mutant 812HS were mostly seen in the O-I-J-I-P curves, especially IP, according to fluorescence transient analysis (Figure 4A). Under photooxidation circumstances, a decline in Chl a content was found in the leaves of mutant 812HS plants, which could have an impact on the fluorescence peak at the yellow stage in mutant 812HS. Simultaneously, the disruption of the (OEC) oxygen-evolving complex resulted in prevention in PSII electron transfer [31].

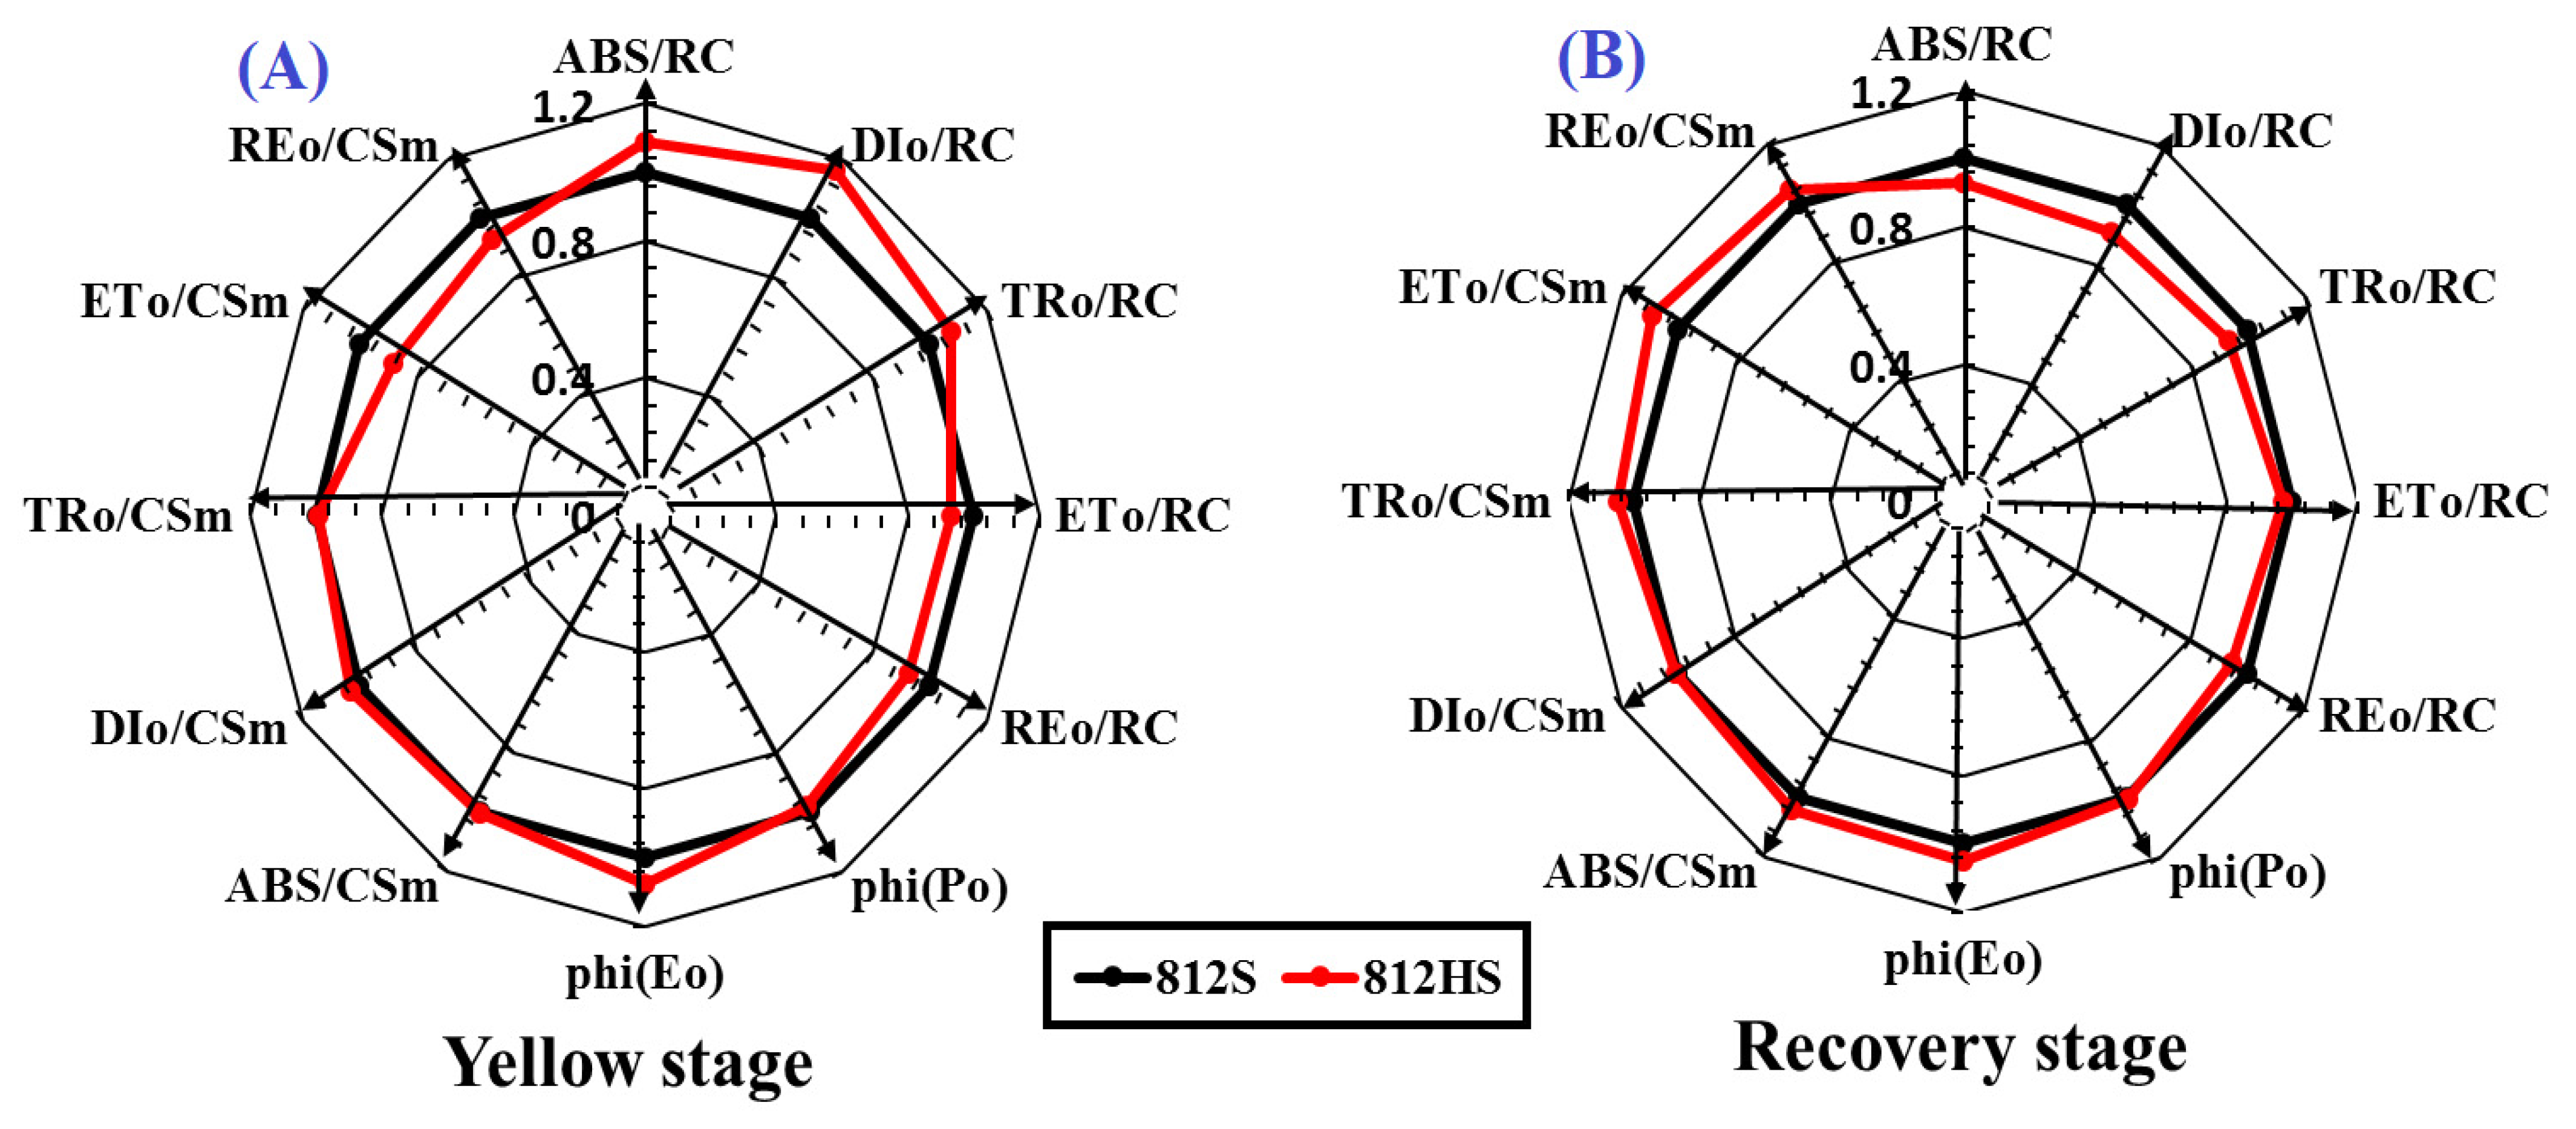
3.5. PSII Efficiency and Excitation Energy Dissipation

RE0/CSm, ET0/CSm, ET0/RC, and RE0/RC values decreased in 812HS compared with 812S at the yellow stage. However, RE0/CSm and ET0/CSm increased in 812HS at the recovery stage (Figure 5). It was established that PSII in0812HS encountered severe injury in energy absorption and flow of electrons during photooxidation. In the meantime, the light absorption value flux per reaction center (ABS/RC) increased in 812HS at the yellow stage, possibly because the ostensible antenna size improved was inactivated. An increase in dissipation indices (TR0/RC and DI0/RC) verified these alterations. To guard the leaves against photodamage, energy dissipation was increased, resulting in a reduction in ET0/RC in mutant 812HS at the yellow stage (Figure 5A). This suggested a strategy of photo-protection for prevention over a reduction in rice electron transport chain [32]. In the interim, it can endorse the release of energy surplus and curtail the photooxidative injury in rice plants [33].

3.6. Ca2+-ATPase, ATP Content, and Mg2+-ATPase Activities

Optical photophosphorylation is mainly caused by ATP synthase on the chloroplast membrane for the production of ATP and the transformation of light energy into a chemical energy reaction [27]. To further elucidate the photochemical reaction, the isolated chloroplast was used to analyze Ca2+-ATPase activity, Mg2+-ATPase activity, and ATP content. The ATP content decreased in mutant 812HS at the yellow stage (Figure 6A). At the recovery stage, ATP content and activity of Ca2+-ATPase and Mg2+-ATPase were significantly increased (Figure 6B,C). By the variation in Ca2+-ATPase, ATP content, and Mg2+-ATPase activities and abiotic stressors such as photooxidation these, changes were confirmed [34].

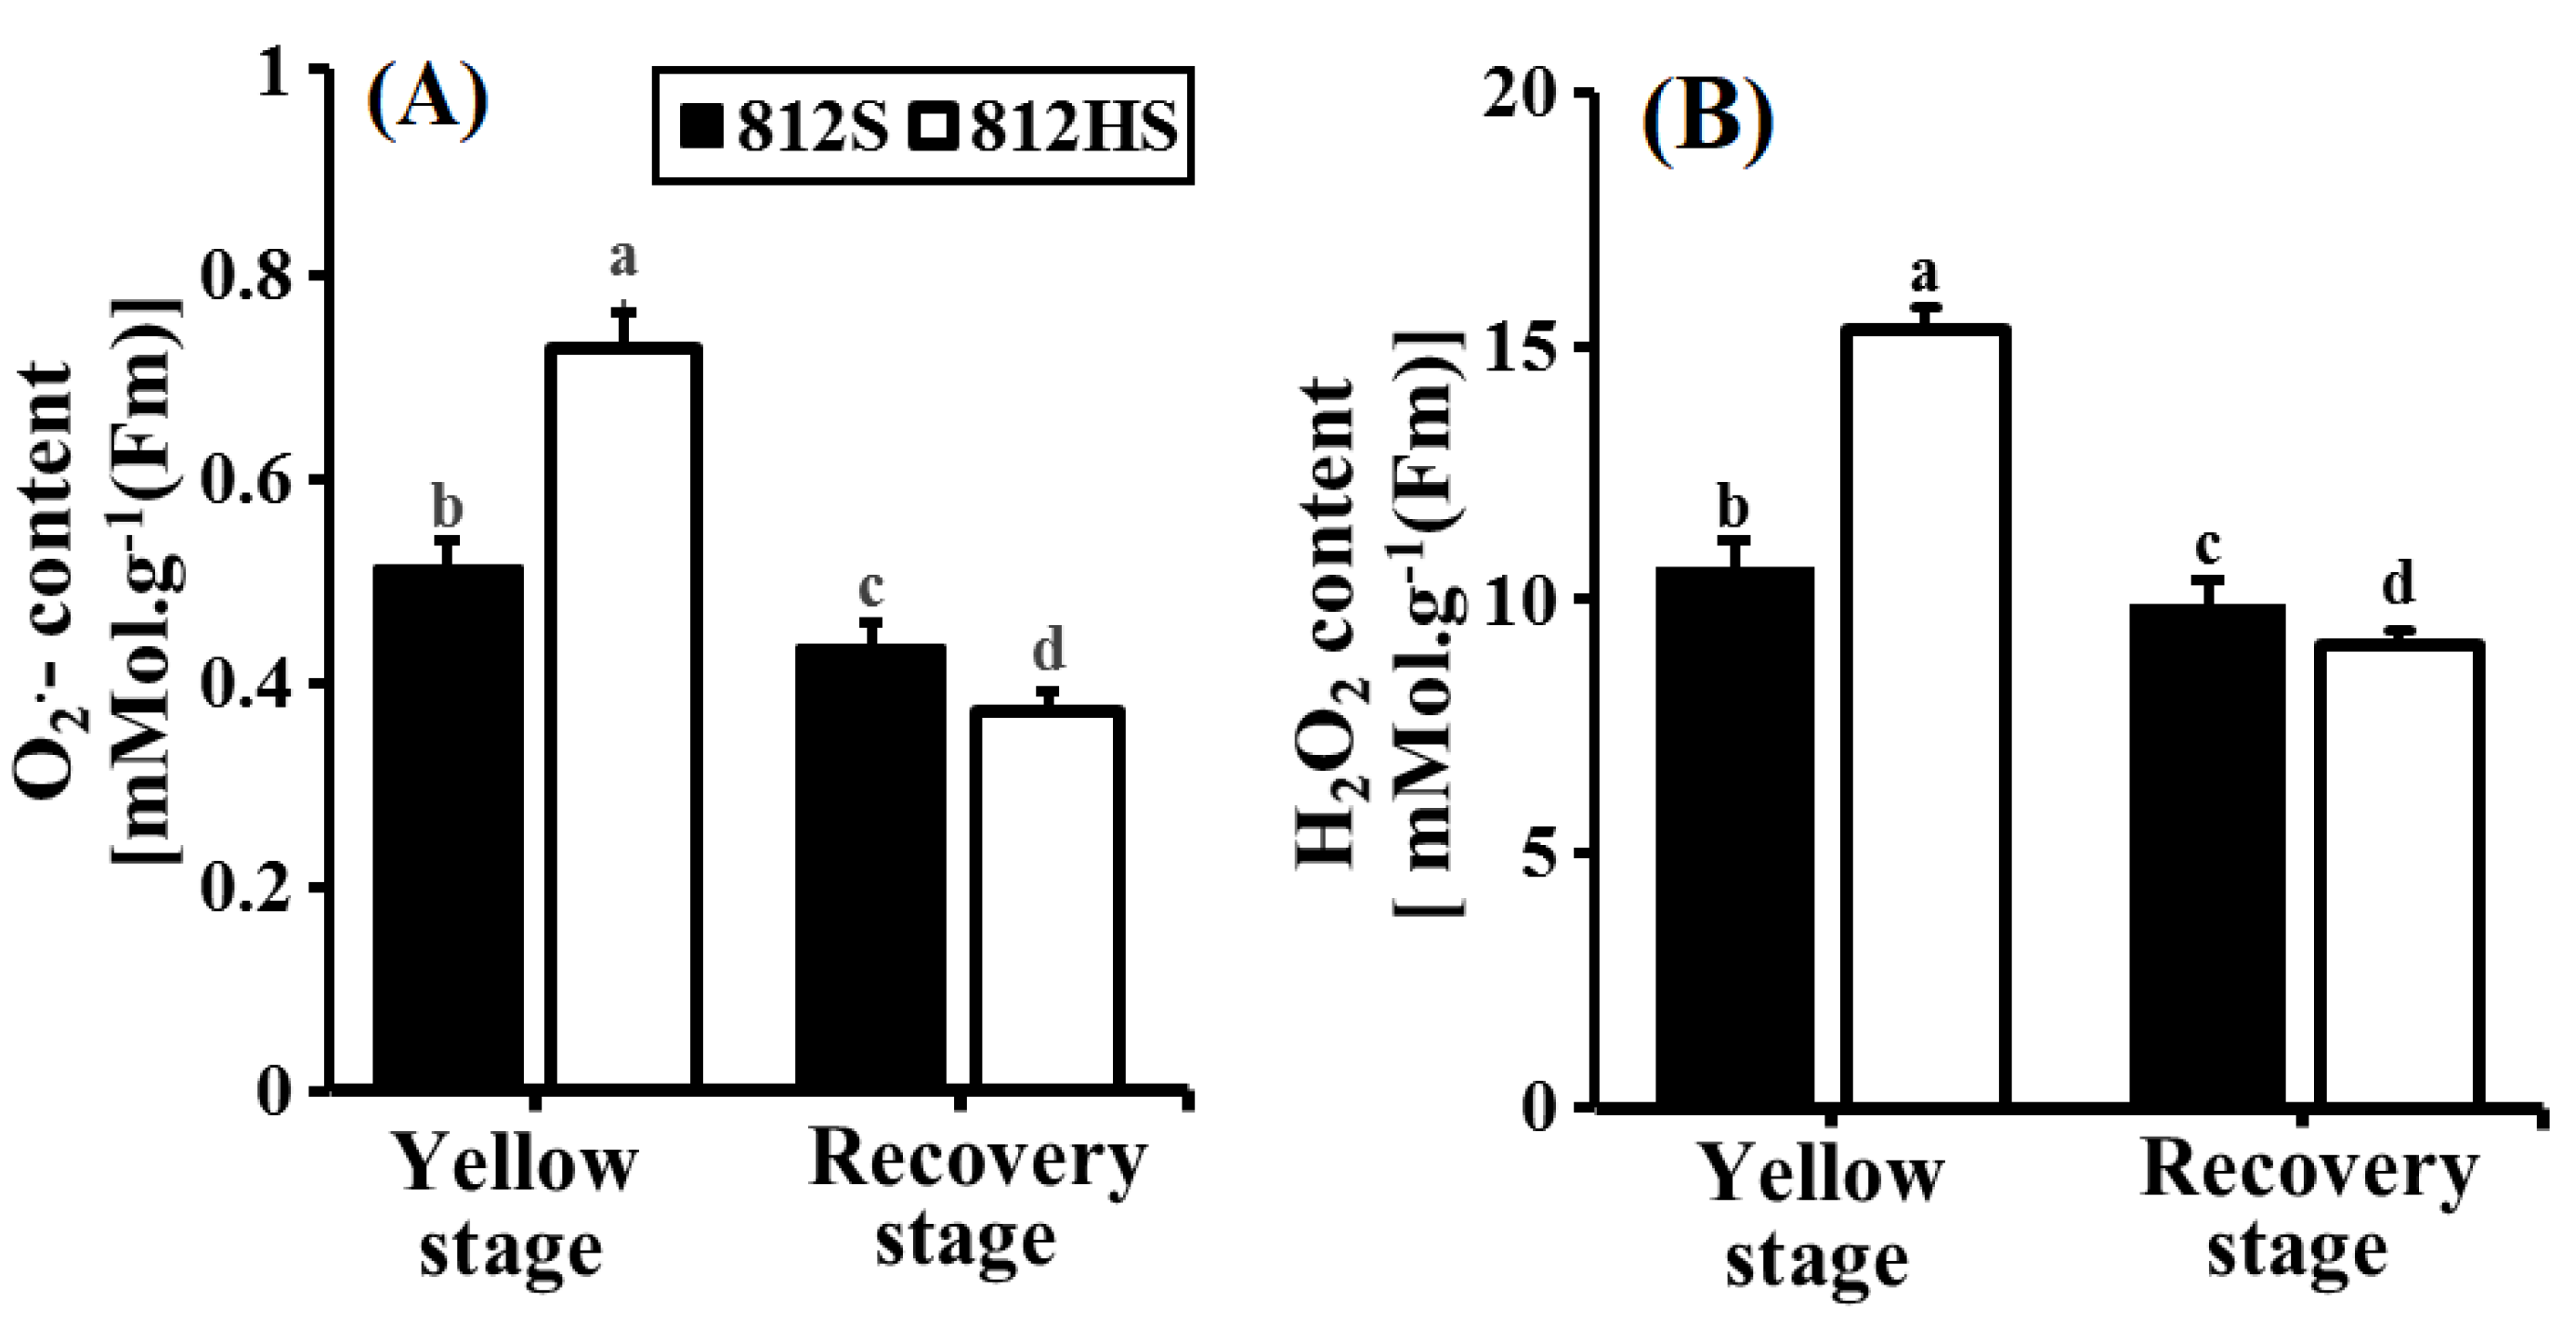
3.7. Contents of O2•– and H2O2 in the Leaves
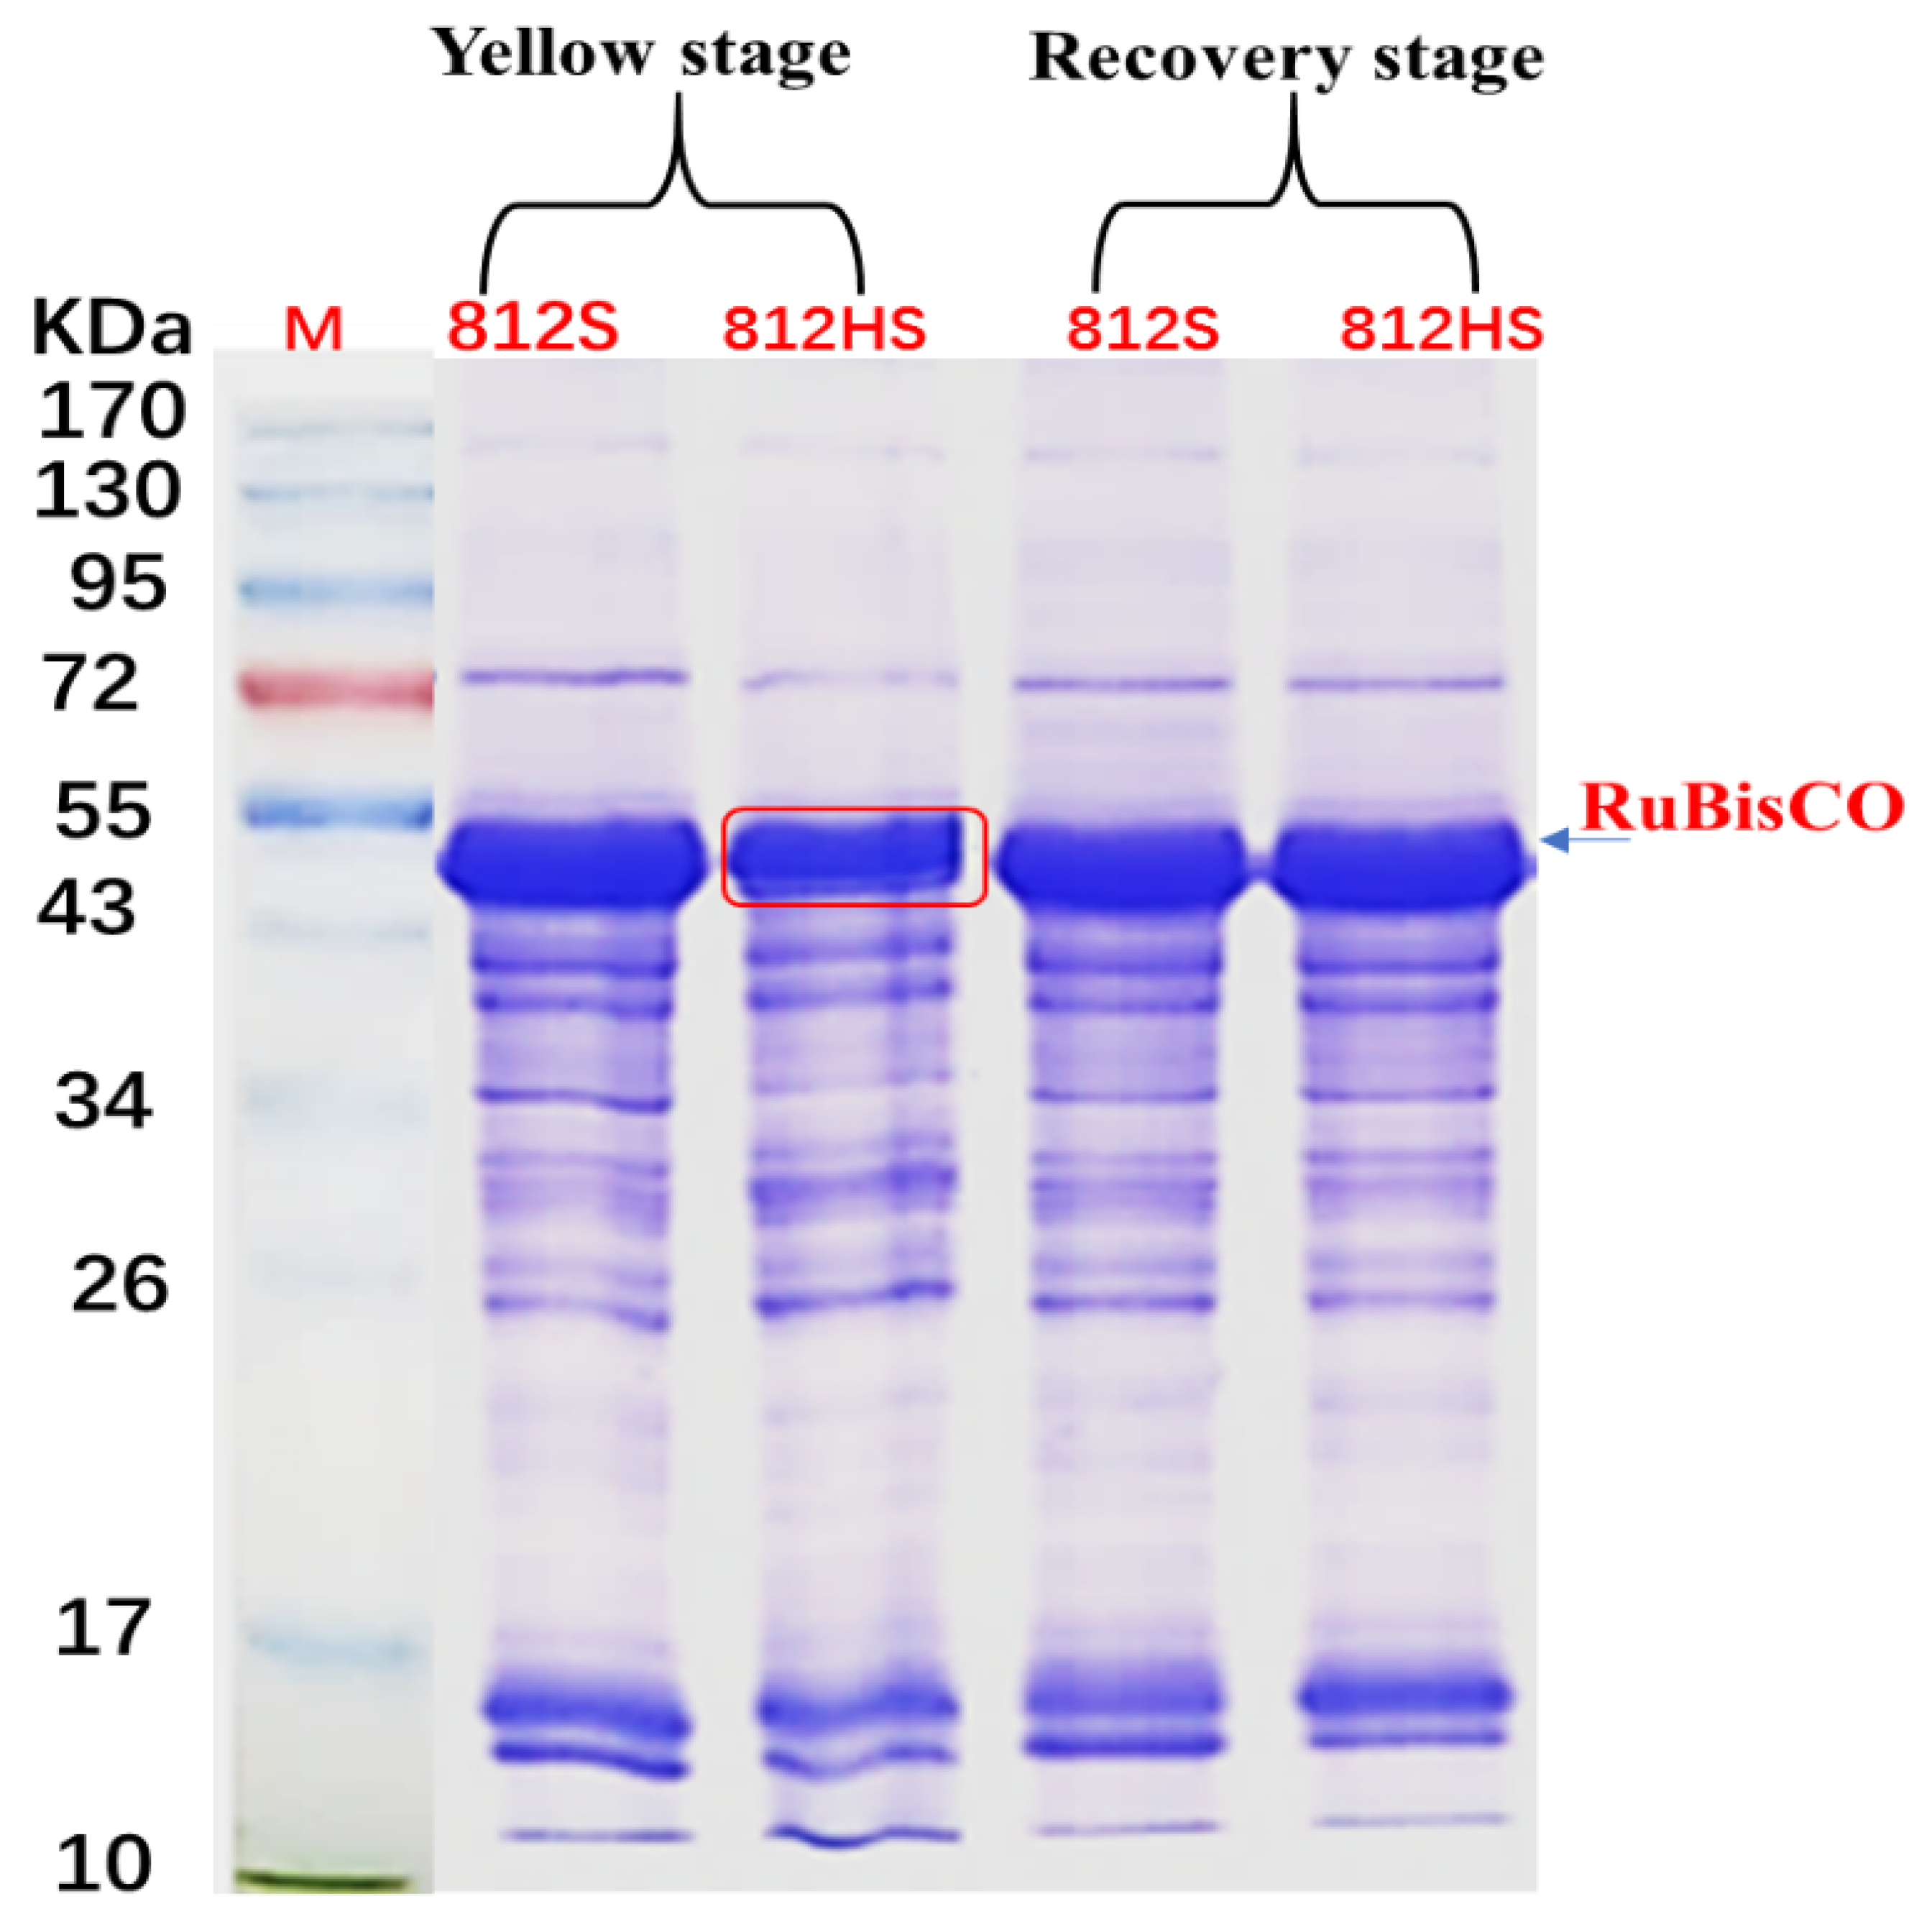
H2O2 among the ROS is a harmful by-product of normal plant metabolism potentially producing oxidative stress when present in the presence of peroxidase [35]. The spectrophotometer results showed an increase in O2•– content (Figure 6A) and H2O2 contents (Figure 7B). This may be because PSII of 812HS was sensitive to the accumulation of high-intensity light in the plants of mutant 812HS at the yellow stage. While the content O2•– and H2O2 were decreased in the recovery stage, there were no noteworthy differences observed in mutant 812HS compared with wild-type 812S. (Figure 7A,B).

3.8. SDS-PAGE

The total protein content of wild-type 812S and mutant 812HS leaves revealed that photooxidation caused a significant loss in protein content throughout the yellowing stage. (Figure 8). The four polypeptides contents, apparently with the molecular mass of 17, 33, 50, and 72 kDa, were relentlessly reduced in photooxidation’s reaction. At the recovery stage both plant types, mutant 812HS, and wild-type 812S, resulted in non-significant differences in protein contents. In the current investigation, the contents of protein were diminished drastically in the leaves of mutant 812HS at the yellowing stage. To avoid energy imbalance against strong light, SDS-PAGE demonstrated that photooxidation reduced the number of proteins (Figure 8). It could be because of protease activity increment, resulting in protein content decrease [36].

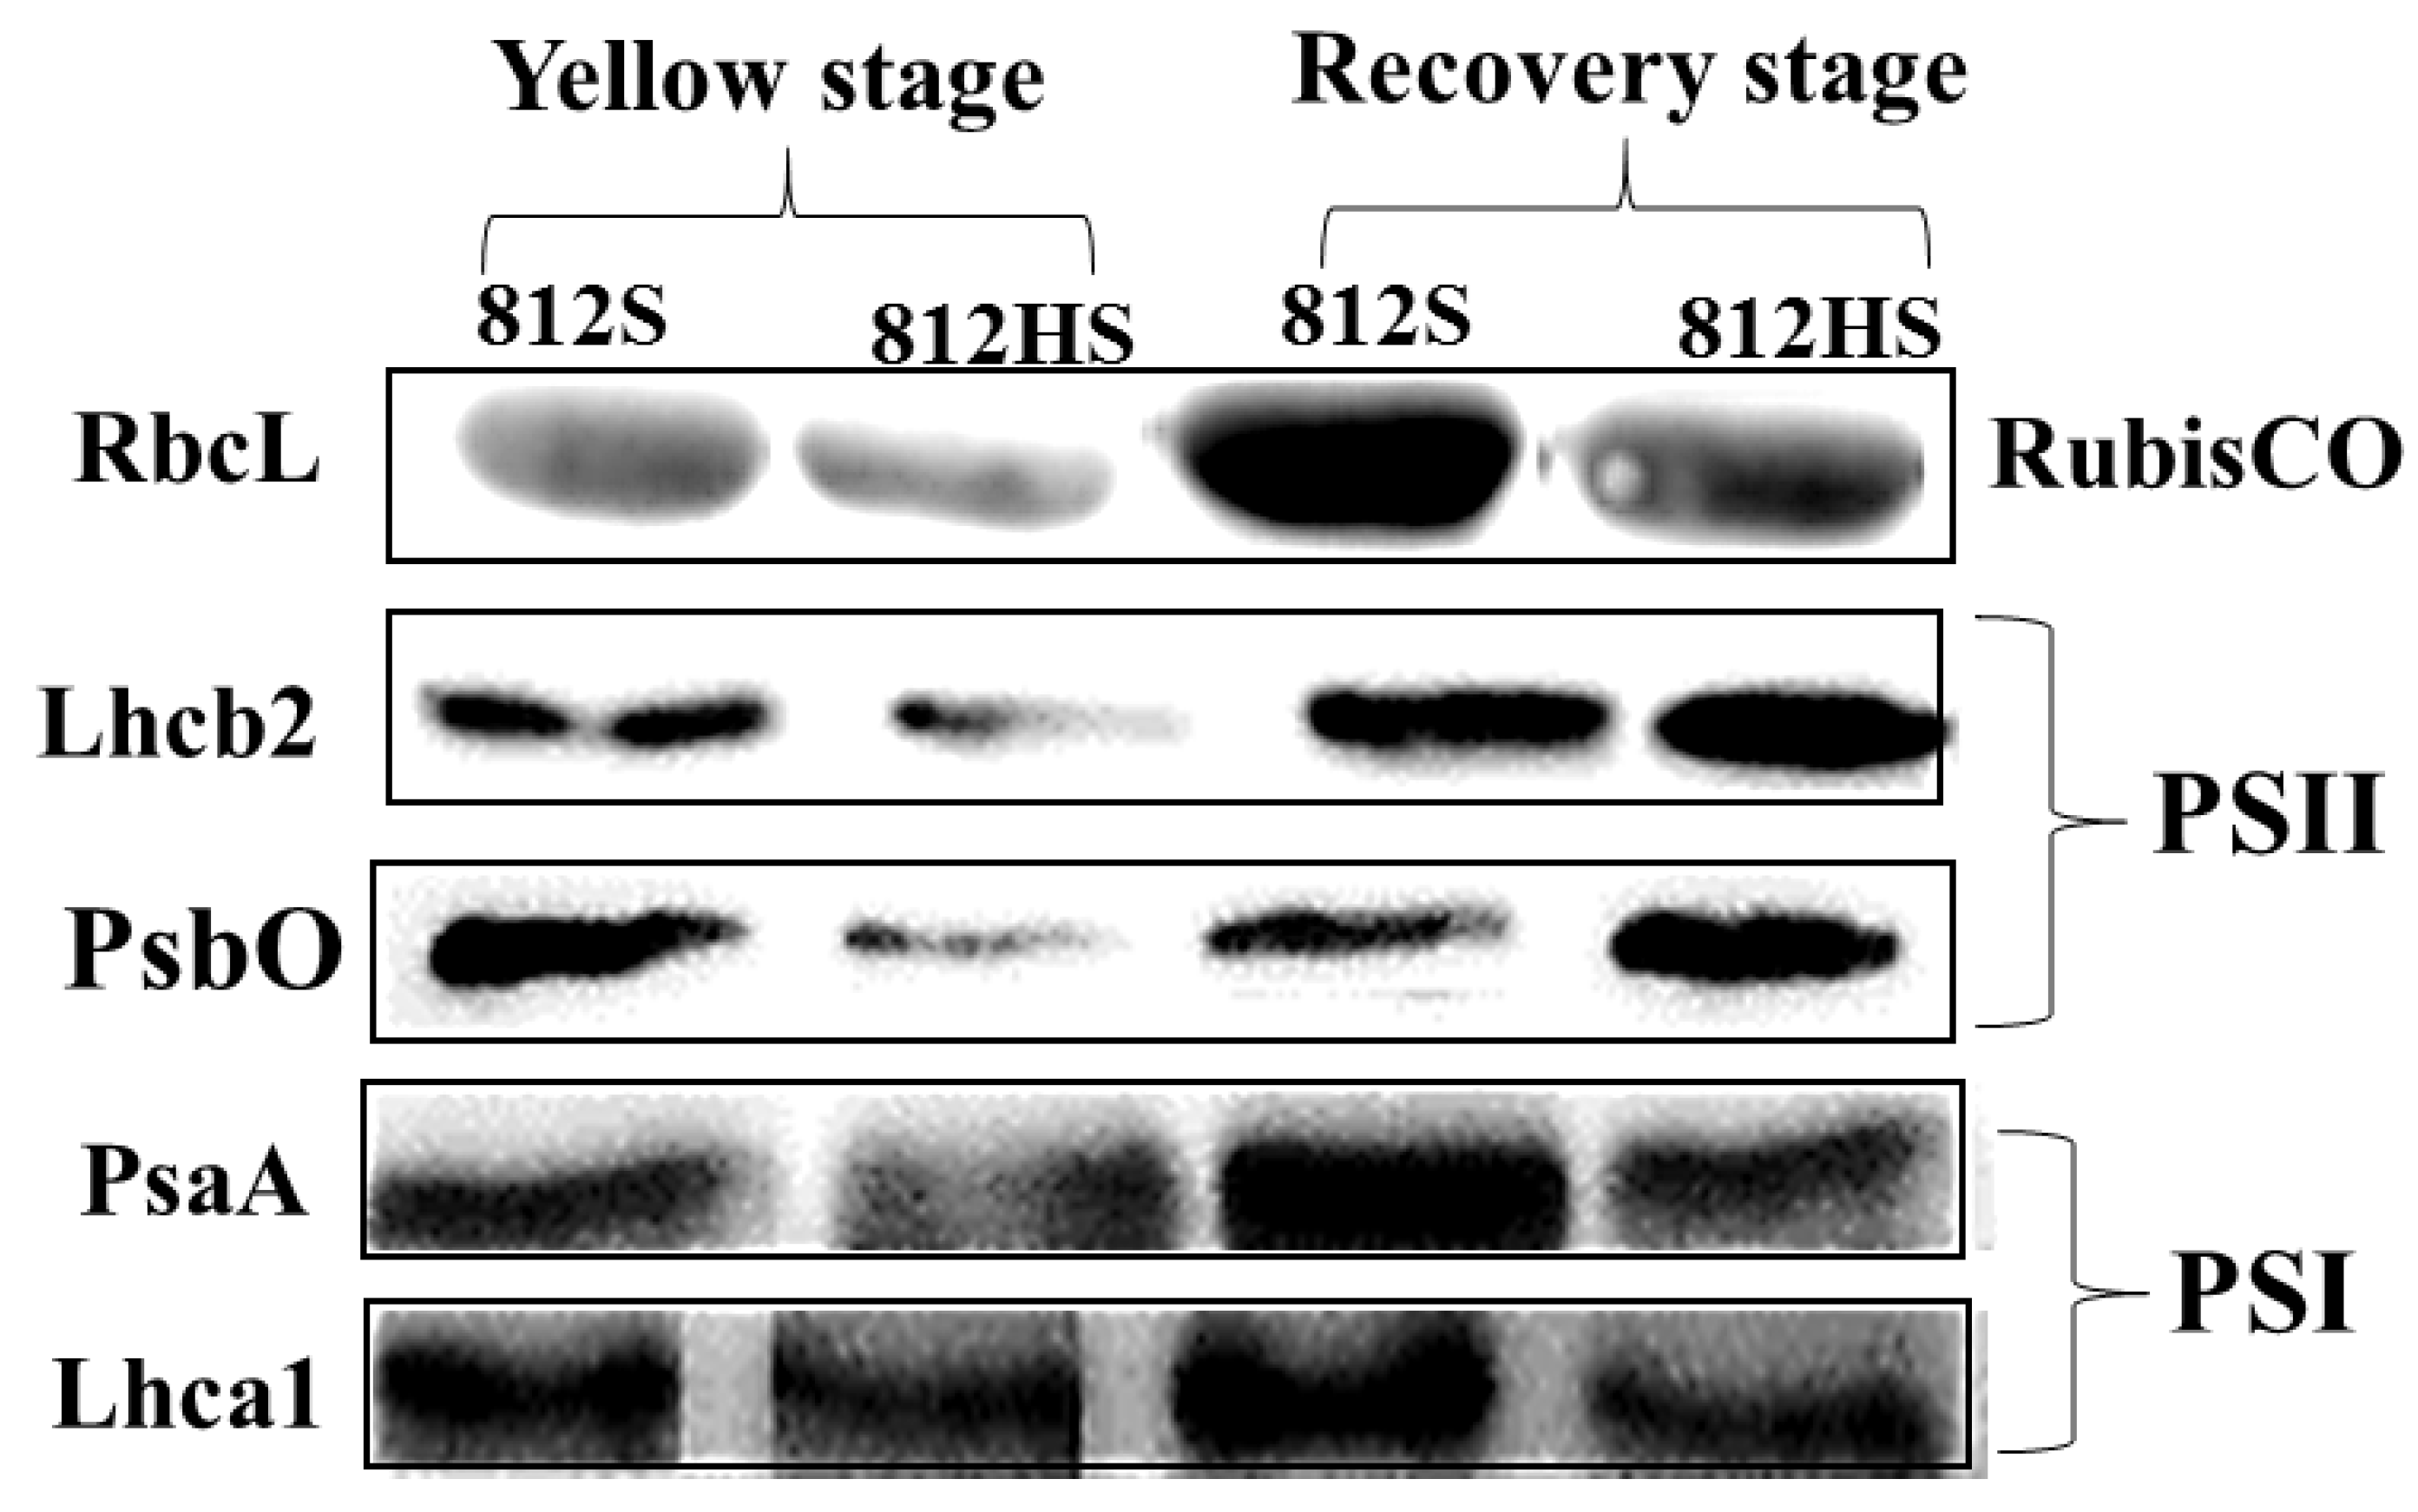
3.9. Western Blot Analysis

The results of the protein Western blot test showed that the content of PSII (hcb2 and psbo) reaction centers was reduced at the yellowing stage in mutant 812HS, the contents of RuBisCO large subunits were also significantly decreased, and the PSI (Lhca1 and psaA) reaction center complex was slightly decreased (Figure 9). In contrast, no significant differences were noticed in protein contents between the mutant 812HS and wild-type 812S0 at the recovery stage. To withstand energy imbalance caused by photooxidation, plants down-regulated the protein contents related to photosynthetic light energy capture to minimize the light absorption. The decrease in protein level indicated that mutant 812HS was seriously damaged, promoting heat dissipation and avoiding further photodamage by excess light energy [37].

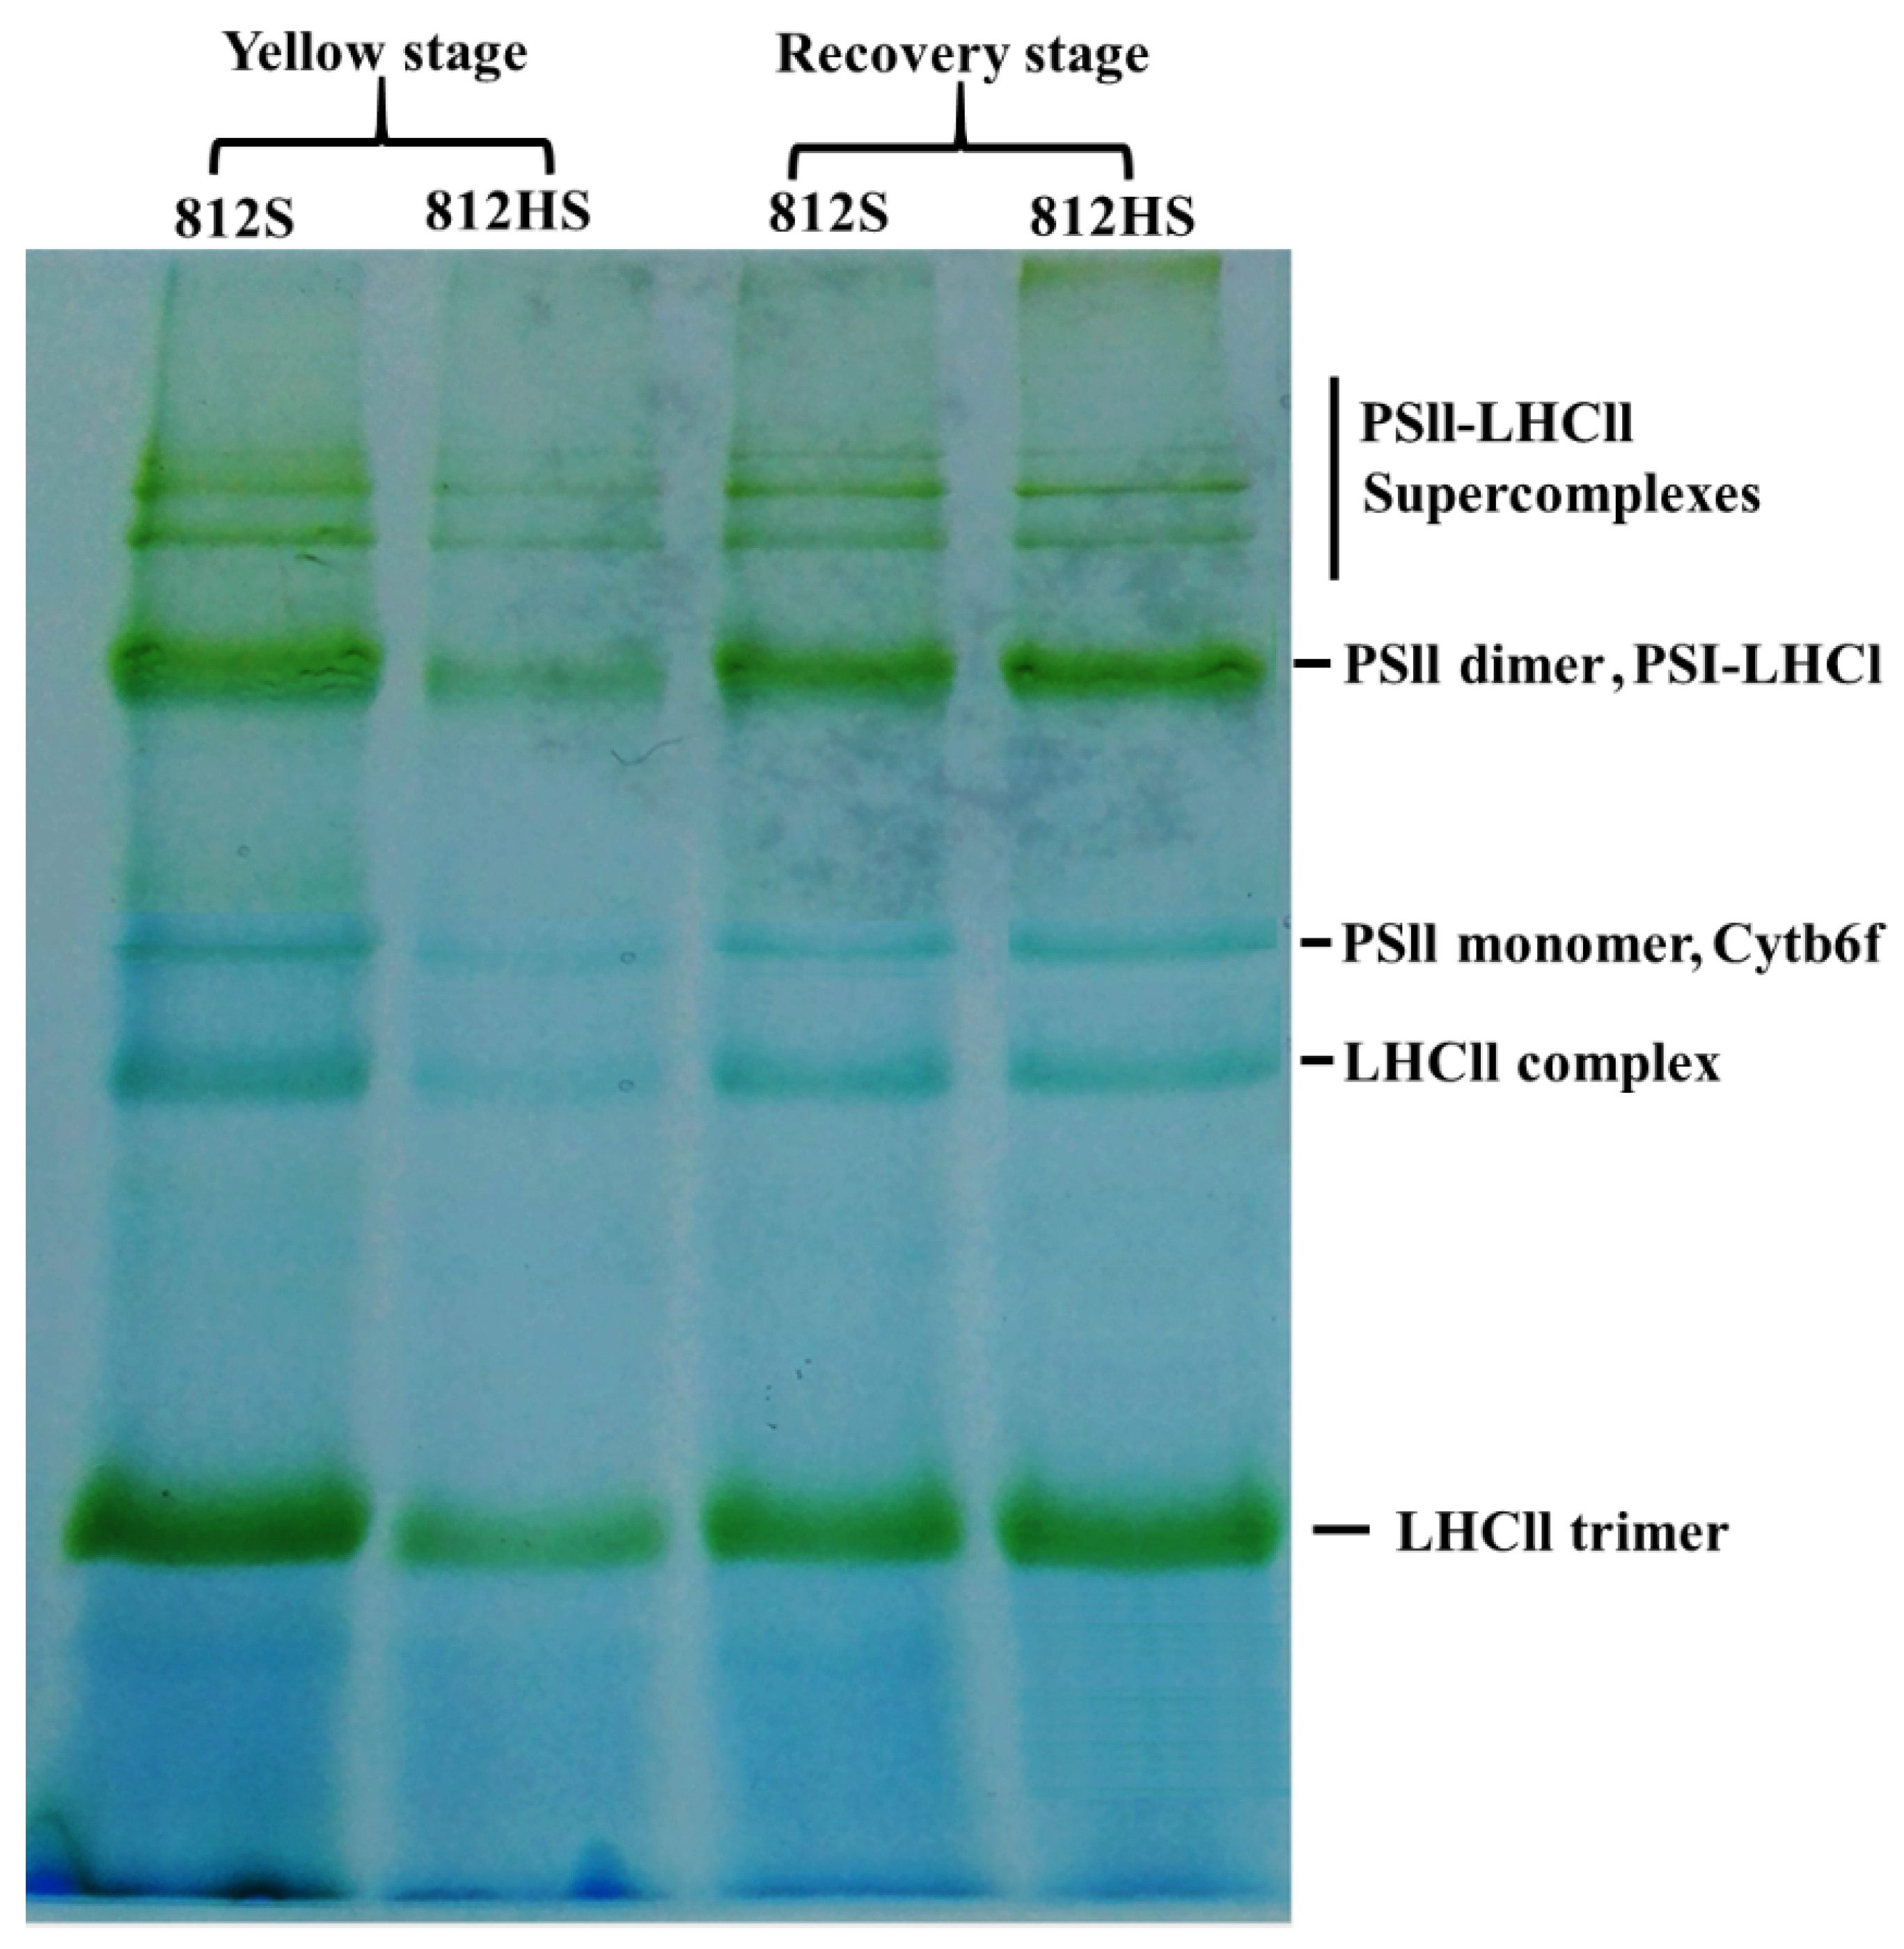
3.10. Blue Native PAGE

In the current study, blue-green gel technology was used to extract the thylakoid membrane protein complexes [38] of 812HS mutant and wild-type 812S thylakoid membrane protein complex content. The protein content of the wild-type 812S of rice was not significantly changed at both stages and was 100%. Results showed that the PSII–LHCII super complexes in mutant 812HS were significantly decreased compared to the wild-type 812S at the yellow stage, which was PSII dimer, PSI–LHCI, and LHCII trimer 74.7%, 75.5%, and 70.3%, respectively. Additionally, a decrease in the PSII monomer, Cytb6f, and LHCII complex was 64.5% and 65.2%, respectively, in mutant 812HS at the yellow stage (Figure 10). At the recovery stage, no significant decrease was found in thylakoid membrane protein complexes between wild-type 812S and mutant 812HS. Both the trimeric light-capturing complex II and the monomer light-capturing complex II of the mutant 812HS were degraded to different degrees that certainly affect the conversion efficiency of the leaves to light energy. The light system I core complex is an important part of the light system I. Light system I catalyzes the formation of electrons from plastid blue pigment through a series of electron transferors to ferredoxin Fd cytochrome b6/f complex, which is an essential protein complex for light energy electron transfer.

4. Conclusions

In summary, the reduction in thylakoid membrane protein content complexes reflects a reduction in the photosynthetic efficiency of this 812HS mutant of rice. The results concluded that the increased production of some reactive toxic oxygen species was triggered by excessive energy, which results in liquid peroxidation in this rice mutant. Oxidative damages caused excessive cell damage to different cell constituents including protein levels and cell membranes photosynthetic pigments and, consequently, impaired their photosynthetic efficiency.

Author Contributions

Conceptualization, A.A. and G.C.; methodology, A.A. and F.M.W.; validation and formal analysis, A.A.; investigation, A.A., R.M.R., and Z.G.; resources, G.C. and Z.G.; data curation, A.A. and M.A.S.; writing—original draft preparation, A.A., R.M.R., and F.M.W. writing—review and editing, F.M.W., M.I.A.R., A.H., E.F.A., M.W.A., and G.C.; Supervision; G.C. All authors have read and agreed to the published version of the manuscript.

Funding

The Agricultural independent innovation Foundation (AIIF) from the province Jiangsu (Grant No. CX73022) associated with Priority Academic Program Development (PAPD) of Jiangsu higher education institution and National Natural Science Foundation of China supported this research project. (Grant No. 31271621). The authors would like to extend their sincere appreciation to the Researchers Supporting Project Number (RSP-2021/356), King Saud University, Riyadh, Saudi Arabia.

Institutional Review Board Statement

Not applicable.

Informed Consent Statement

Not applicable.

Data Availability Statement

Data is available on request.

Acknowledgments

The Agricultural independent innovation Foundation (AIIF) from the province Jiangsu (Grant No. CX73022) associated with Priority Academic Program Development (PAPD) of Jiangsu higher education institution and National Natural Science Foundation of China supported this research project. (Grant No. 31271621). The authors would like to extend their sincere appreciation to the Researchers Supporting Project Number (RSP-2021/356), King Saud University, Riyadh, Saudi Arabia.

Conflicts of Interest

The authors declare no conflict of interest.

References

  1. Zhao, M.; Lin, Y.; Chen, H. Improving nutritional quality of rice for human health. Theor. Appl. Genet. 2020, 133, 1397–1413. [Google Scholar] [CrossRef]
  2. Goff, S.A. Rice as a model for cereal genomics. Curr. Opin. Plant Biol. 1999, 2, 86–89. [Google Scholar] [CrossRef]
  3. Lv, C.; Ma, J.; Yuan, Z.; Wang, Y.; Chen, G.; Gao, Z.; Lv, C. Proteomics analysis of the photo-oxidation mutant 812HS rice (Oryza sativa L.) exposed to high light intensity. Plant Omics 2016, 9, 304–310. [Google Scholar] [CrossRef]
  4. Rehmani, M.I.A.; Ding, C.; Li, G.; Ata-Ul-Karim, S.T.; Hadifa, A.; Bashir, M.A.; Hashem, M.; Alamri, S.; Al-Zubair, F.; Ding, Y. Vulnerability of rice production to temperature extremes during rice reproductive stage in Yangtze River Valley, China. J. King Saud Univ. Sci. 2021, 33, 101599. [Google Scholar] [CrossRef]
  5. Rehmani, M.I.A.; Wei, G.; Hussain, N.; Ding, C.; Li, G.; Liu, Z.; Wang, S.; Ding, Y. Yield and quality responses of two indica rice hybrids to post-anthesis asymmetric day and night open-field warming in lower reaches of Yangtze River delta. Field Crops Res. 2014, 156, 231–241. [Google Scholar] [CrossRef]
  6. Kirchhoff, H. Structural changes of the thylakoid membrane network induced by high light stress in plant chloroplasts. Philos. Trans. R. Soc. B Biol. Sci. 2014, 369, 20130225. [Google Scholar] [CrossRef] [Green Version]
  7. Foyer, C.H. Reactive oxygen species, oxidative signaling and the regulation of photosynthesis. Environ. Exp. Bot. 2018, 154, 134–142. [Google Scholar] [CrossRef]
  8. Guidi, L.; Tattini, M. Antioxidant Defenses in Plants: A Dated Topic of Current Interest. Antioxidants 2021, 10, 855. [Google Scholar] [CrossRef]
  9. Soares, C.; Carvalho, M.E.A.; Azevedo, R.A.; Fidalgo, F. Plants facing oxidative challenges—A little help from the antioxidant networks. Environ. Exp. Bot. 2019, 161, 4–25. [Google Scholar] [CrossRef]
  10. Khorobrykh, S.; Havurinne, V.; Mattila, H.; Tyystjärvi, E. Oxygen and ROS in Photosynthesis. Plants 2020, 9, 91. [Google Scholar] [CrossRef] [PubMed] [Green Version]
  11. Ma, J.; Lv, C.; Zhang, B.; Wang, F.; Shen, W.; Chen, G.; Gao, Z.; Lv, C. Comparative analysis of ultrastructure, antioxidant enzyme activities, and photosynthetic performance in rice mutant 812HS prone to photooxidation. Photosynthetica 2017, 55, 568–578. [Google Scholar] [CrossRef]
  12. Szymańska, R.; Ślesak, I.; Orzechowska, A.; Kruk, J. Physiological and biochemical responses to high light and temperature stress in plants. Environ. Exp. Bot. 2017, 139, 165–177. [Google Scholar] [CrossRef]
  13. Hussain, S.; Nanda, S.; Zhang, J.; Rehmani, M.I.A.; Suleman, M.; Li, G.; Hou, H. Auxin and Cytokinin Interplay during Leaf Morphogenesis and Phyllotaxy. Plants 2021, 10, 1732. [Google Scholar] [CrossRef]
  14. Zheng, L.; Van Labeke, M.-C. Effects of different irradiation levels of light quality on Chrysanthemum. Sci. Hortic. 2018, 233, 124–131. [Google Scholar] [CrossRef]
  15. Zhang, Y.; Dong, H.; Song, S.; Su, W.; Liu, H. Morphological and Physiological Responses of Cucumber Seedlings to Supplemental LED Light under Extremely Low Irradiance. Agronomy 2020, 10, 1698. [Google Scholar] [CrossRef]
  16. Lai, D.; Xia, S.; Wei, X.; Liu, S.; Zhang, B.; Liao, H.; Yan, W.; Zong, S.; Zhang, Q. Mapping of a leaf photo-oxidation gene LPO1 (t) in rice. Jiangsu J. Agric. Sci. 2012, 28, 1212–1217. [Google Scholar]
  17. Alamin, M.; Zeng, D.-D.; Sultana, M.H.; Qin, R.; Jin, X.-L.; Shi, C.-H. Photosynthesis, cellulose contents and ultrastructure changes of mutant rice leading to screw flag leaf. Plant Growth Regul. 2018, 85, 1–13. [Google Scholar] [CrossRef]
  18. Liao, S.; Li, J.; Yang, H.; Gan, X.; Liang, S. Diurnal changes of net photosynthetic rate and influencing environmental factors of Bauhinia championii. J. Guangxi Norm. Univ. Nat. Sci. Ed. 2010, 28, 61–65. [Google Scholar]
  19. Strasser, R.J.; Tsimilli-Michael, M.; Srivastava, A. Analysis of the chlorophyll a fluorescence transient. In Chlorophyll a Fluo-Rescence; Springer: Berlin/Heidelberg, Germany, 2004; pp. 321–362. [Google Scholar]
  20. Wang, A.-G. Quantitative relation between the reaction of hydroxylamine and superoxi-de anion radicals in plants. Plant Physiol. Commun. 1990, 26, 55–57. [Google Scholar]
  21. Hossain, M.A.; Fujita, M. Evidence for a role of exogenous glycinebetaine and proline in antioxidant defense and methylglyoxal detoxification systems in mung bean seedlings under salt stress. Physiol. Mol. Biol. Plants 2010, 16, 19–29. [Google Scholar] [CrossRef] [PubMed] [Green Version]
  22. Ketcham, S.R.; Davenport, J.W.; Warncke, K.; McCarty, R.E. Role of the gamma subunit of chloroplast coupling factor 1 in the light-dependent activation of photophosphorylation and ATPase activity by dithiothreitol. J. Biol. Chem. 1984, 259, 7286–7293. [Google Scholar] [CrossRef]
  23. Wang, Y.; Xu, C.; Lv, C.; Wu, M.; Cai, X.; Liu, Z.; Song, X.; Chen, G.; Lv, C. Chlorophyll a fluorescence analysis of high-yield rice (Oryza sativa L.) LYPJ during leaf senescence. Photosynthetica 2016, 54, 422–429. [Google Scholar] [CrossRef]
  24. Wang, L.; Gao, M.; Chen, J.; Yang, Z.; Sun, J.; Wang, Z.; Huang, X.; Yuan, T.; Shen, X.; Xian, S. Resveratrol Ameliorates Pressure Overload–induced Cardiac Dysfunction and Attenuates Autophagy in Rats. J. Cardiovasc. Pharmacol. 2015, 66, 376–382. [Google Scholar] [CrossRef]
  25. Vallejos, R.; Arana, J.; Ravizzini, R. Changes in activity and structure of the chloroplast proton ATPase induced by illumination of spinach leaves. J. Biol. Chem. 1983, 258, 7317–7321. [Google Scholar] [CrossRef]
  26. Kügler, M.; Jansch, L.; Kruft, V.; Schmitz, U.K.; Braun, H.-P. Analysis of the chloroplast protein complexes by blue-native polyacrylamide gel electrophoresis (BN-PAGE). Photosynth. Res. 1997, 53, 35–44. [Google Scholar] [CrossRef]
  27. Ma, J.; Lv, C.; Xu, M.; Chen, G.; Lv, C.; Gao, Z. Photosynthesis performance, antioxidant enzymes, and ultrastructural analyses of rice seedlings under chromium stress. Environ. Sci. Pollut. Res. 2016, 23, 1768–1778. [Google Scholar] [CrossRef] [PubMed]
  28. Ranjbarfordoei, A.; Samson, R.; Van Damme, P.J.P. Photosynthesis performance in sweet almond [Prunus dulcis (Mill) D. Webb] exposed to supplemental UV-B radiation. Photosynthetica 2011, 49, 107. [Google Scholar] [CrossRef] [Green Version]
  29. Singh, S.; Eapen, S.; D’Souza, S. Cadmium accumulation and its influence on lipid peroxidation and antioxidative system in an aquatic plant, Bacopa monnieri L. Chemosphere 2006, 62, 233–246. [Google Scholar] [CrossRef] [PubMed]
  30. Faiza, S.; Hafiz, N.A.; Zain, M.; Amina, H.; Naqshe, Z.; Rizwan, A.; Muhammad, A.A. Role of endomycorrhizae, rhizobacteria and compost to improve phosphorus availability in onion. Asian J. Agric. Biol. 2020, 8, 194–200. [Google Scholar]
  31. Song, Y.G.; Liu, B.; Wang, L.F.; Li, M.H.; Liu, Y. Damage to the oxygen-evolving complex by superoxide anion, hydrogen peroxide, and hydroxyl radical in photoinhibition of photosystem II. Photosynth. Res. 2006, 90, 67–78. [Google Scholar] [CrossRef]
  32. Fang, J.; Chai, C.; Qian, Q.; Li, C.; Tang, J.; Sun, L.; Huang, Z.; Guo, X.; Sun, C.; Liu, M. Mutations of genes in synthesis of the carotenoid precursors of ABA lead to pre-harvest sprouting and photo-oxidation in rice. Plant J. 2008, 54, 177–189. [Google Scholar] [CrossRef] [PubMed] [Green Version]
  33. Ma, J.; Lv, C.; Xu, M.; Hao, P.; Wang, Y.; Shen, W.; Gao, Z.; Chen, G.; Lv, C. Analysis of chlorophyll a fluorescence and proteomic differences of rice leaves in response to photooxidation. Acta Physiol. Plant. 2017, 39, 46. [Google Scholar] [CrossRef]
  34. Zeng, S.; Li, M. Changes of Ca2+-ATPase activities in cell of rice seedlings during the enhancement of chilling resistance induced by cold and salt pretreatment. Acta Bot. Sin. 1999, 41, 156–160. [Google Scholar]
  35. Krishnamurthy, A.; Rathinasabapathi, B.J.P.S. Oxidative stress tolerance in plants: Novel interplay between auxin and reactive oxygen species signaling. Plant Signal. Behav. 2013, 8, e25761. [Google Scholar] [CrossRef] [Green Version]
  36. Xu, Q.; Hu, J.; Xie, K.; Yang, H.; Du, K.; Shi, G. Accumulation and acute toxicity of silver in Potamogeton crispus L. J. Hazard. Mater. 2010, 173, 186–193. [Google Scholar] [CrossRef]
  37. Li, X.-G.; Meng, Q.-W.; Jiang, G.-Q.; Zou, Q. The Susceptibility of Cucumber and Sweet Pepper to Chilling Under Low Irradiance is Related to Energy Dissipation and Water-Water Cycle. Photosynthetica 2003, 41, 259–265. [Google Scholar] [CrossRef]
  38. Peltier, J.-B.; Ytterberg, A.J.; Sun, Q.; van Wijk, K.J. New Functions of the Thylakoid Membrane Proteome of Arabidopsis thaliana Revealed by a Simple, Fast, and Versatile Fractionation Strategy. J. Biol. Chem. 2004, 279, 49367–49383. [Google Scholar] [CrossRef] [Green Version]
Figure 1. The phenotypic analysis of the rice wild-type 812S and mutant 812HS in the field during yellow stage (A) and recovery stage (B).
Agronomy 11 02225 g001
Figure 2. Effect of photooxidation on (A) Chl a (B) Chl b (C) carotenoid content in the rice mutant 812HS. Different letters indicate significant variation (p < 0.05).
Agronomy 11 02225 g002
Figure 3. Effects of photooxidation on the net photosynthetic rate in leaves of 812HS and 812S. Different letters indicate significant variation (p < 0.05).
Agronomy 11 02225 g003
Figure 4. Dark-adapted chlorophyll fluorescence induction (OJIP) in 812HS and 812S leaves conducted on the yellow stage (A) and recovery stage (B). The time scale is plotted on a logarithmic (0.01 ms to 10 ms).
Agronomy 11 02225 g004
Figure 5. Fluorescence transient parameters characterized energy fluxes and flux ratios in leaves of 812HS and 812S in the yellow stage (A) and recovery stage (B).
Agronomy 11 02225 g005
Figure 6. Effects of photooxidation on ATP content (A), Ca2+-ATPase activity (B), and Mg2+-ATPase activity (C) in leaves of 812HS and 812S. Data are mean ± SD (n = 3). Different letters indicate significant variation (p < 0.05).
Agronomy 11 02225 g006
Figure 7. Effects of photooxidation of O2•– content (A) and H2O2 content (B) in the leaves of rice mutant 812HS and its wild-type 812S. Data are mean ± SD (n = 3). Different small letters indicate significant differences. p < 0.05, using the t-test.
Agronomy 11 02225 g007
Figure 8. Effects of photooxidation on the protein of leaves in 812S and 812HS by SDS-PAGE.
Agronomy 11 02225 g008
Figure 9. Effects of photooxidation on leaf proteins in wild-type 812S and mutant 812HS by Western blot.
Agronomy 11 02225 g009
Figure 10. Effects of photooxidation of thylakoid membrane from mutant 812HS and wild-type 812S by BN-PAGE analysis.
Agronomy 11 02225 g010
Publisher’s Note: MDPI stays neutral with regard to jurisdictional claims in published maps and institutional affiliations.

