
Impact of El Niño on Oil Palm Yield in Malaysia

 ,
,
Abstract
:1. Introduction
2. Materials and Methods
2.1. Study Area
2.2. The New Fresh Fruit Bunch Index (FFBI) Model
2.3. Correlation Test between Malaysian Oil Palm Yields and Oceanic Niño Index (ONI)
2.4. Time Series Forecasting
2.5. Mann-Kendall Trend Test and Sen’s Slope
2.6. Opportunity Loss Modelling of El Niño Events
3. Results
3.1. Predictive Ability of Fresh Fruit Bunch Index (FFBI) Model
3.1.1. Correlation with Oceanic Niño Index (ONI)
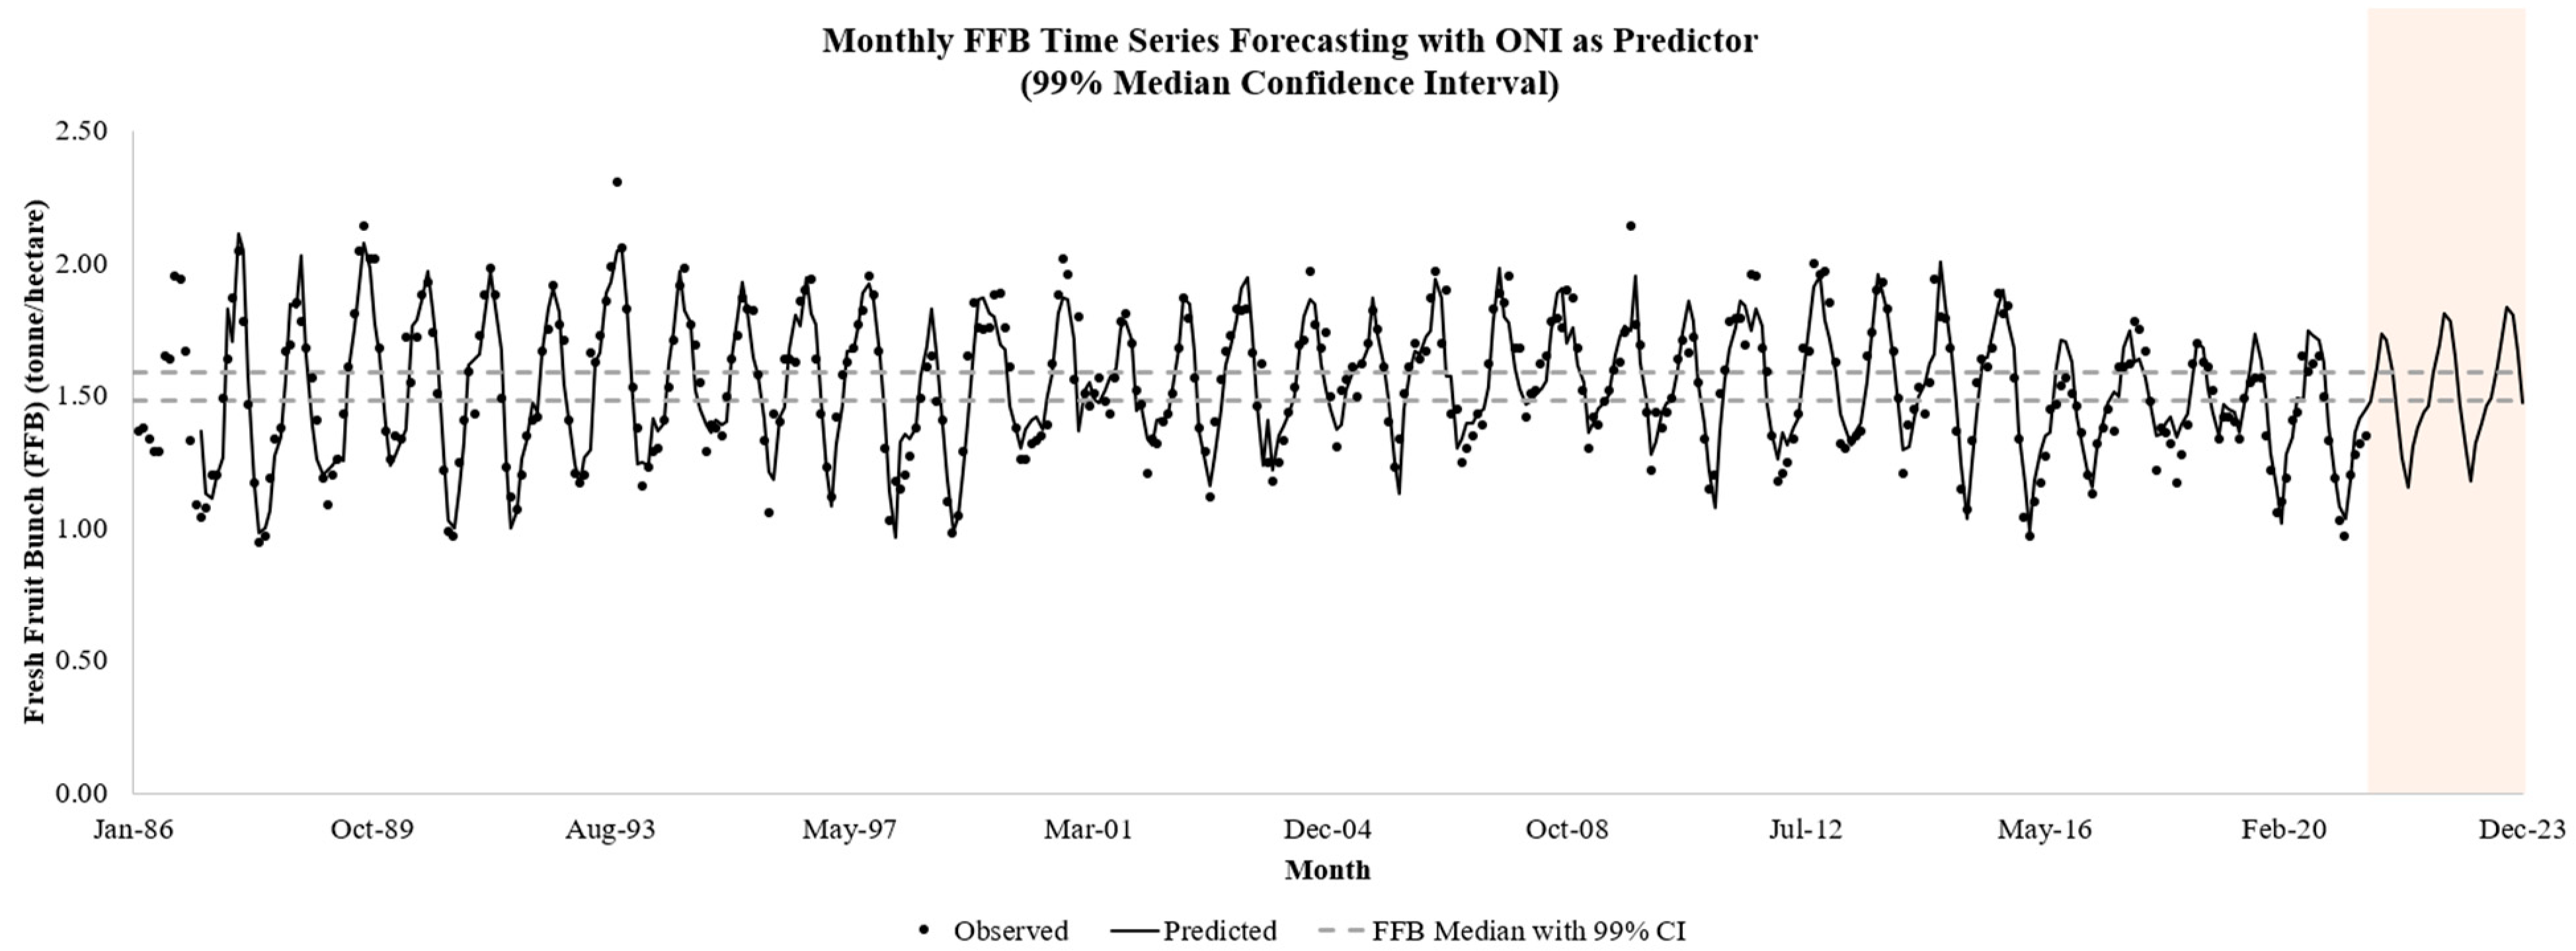
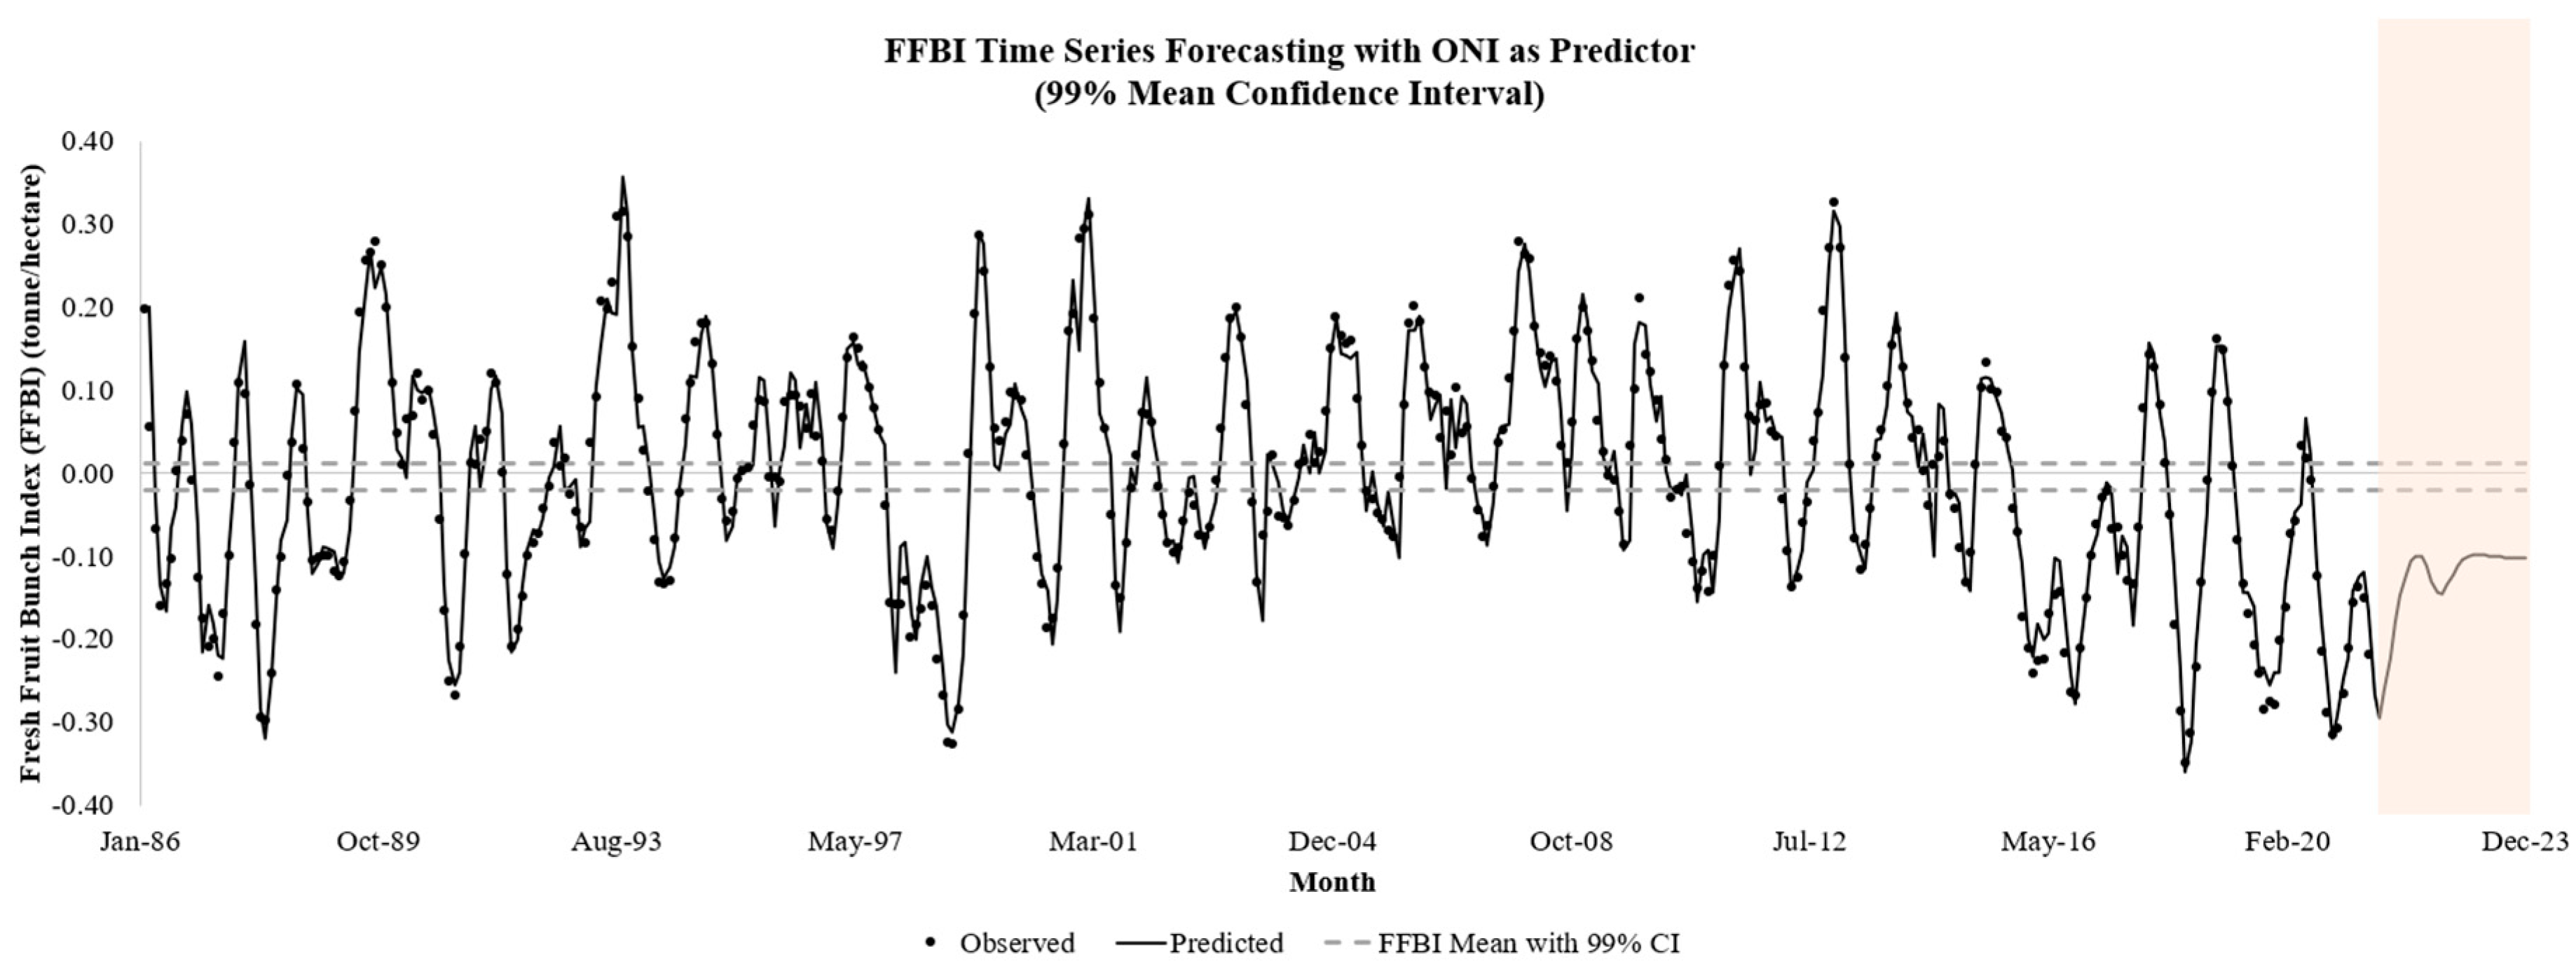
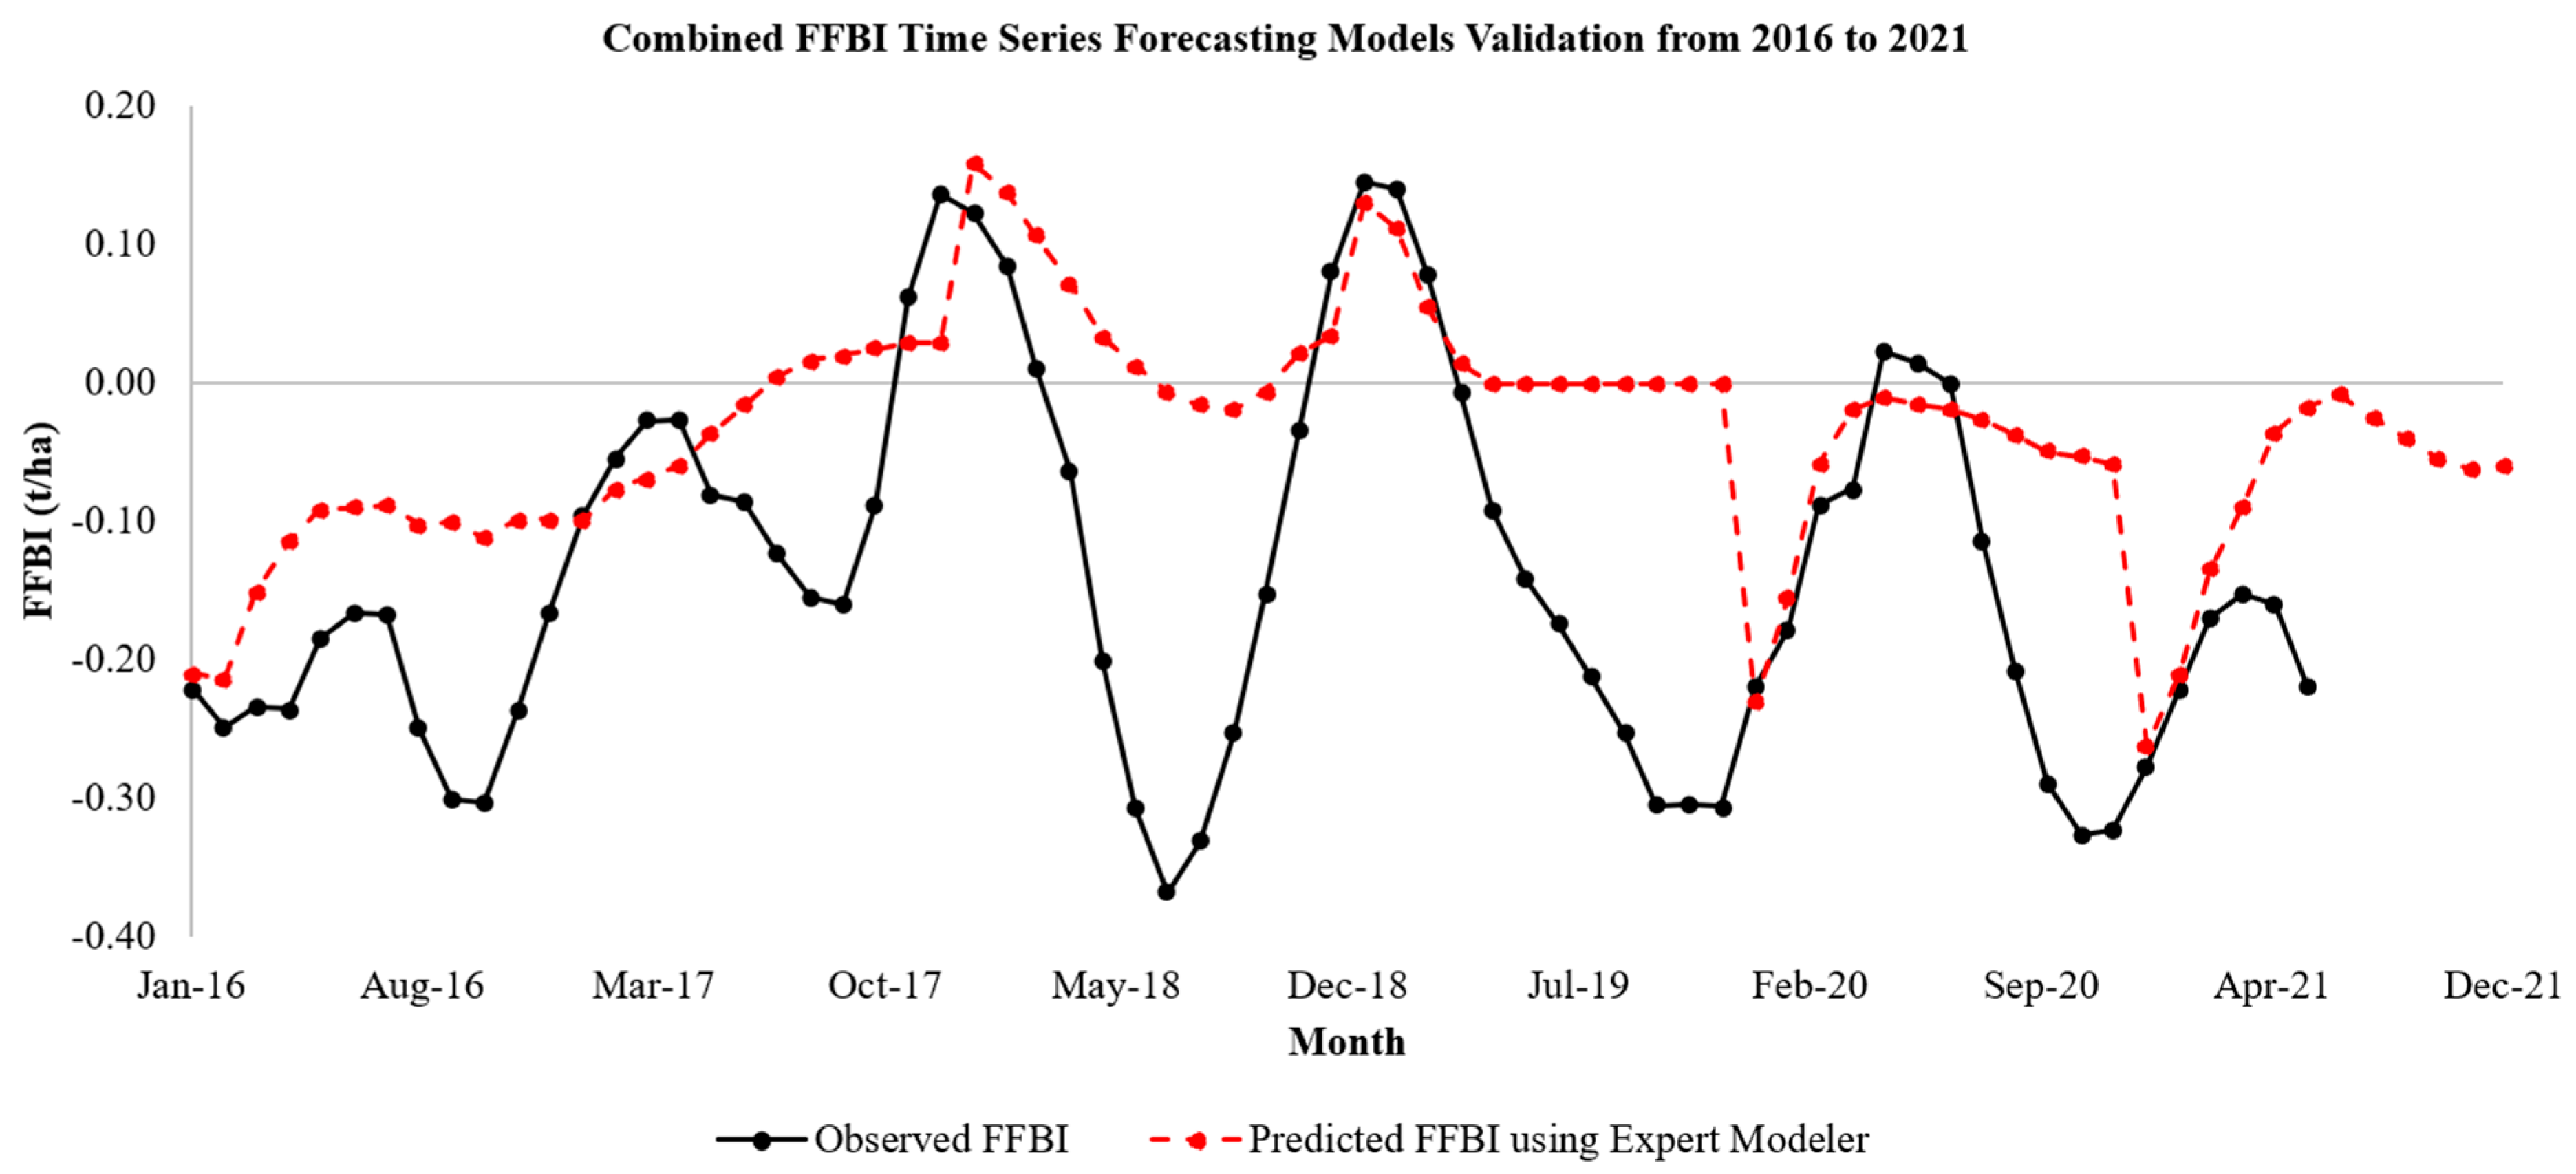
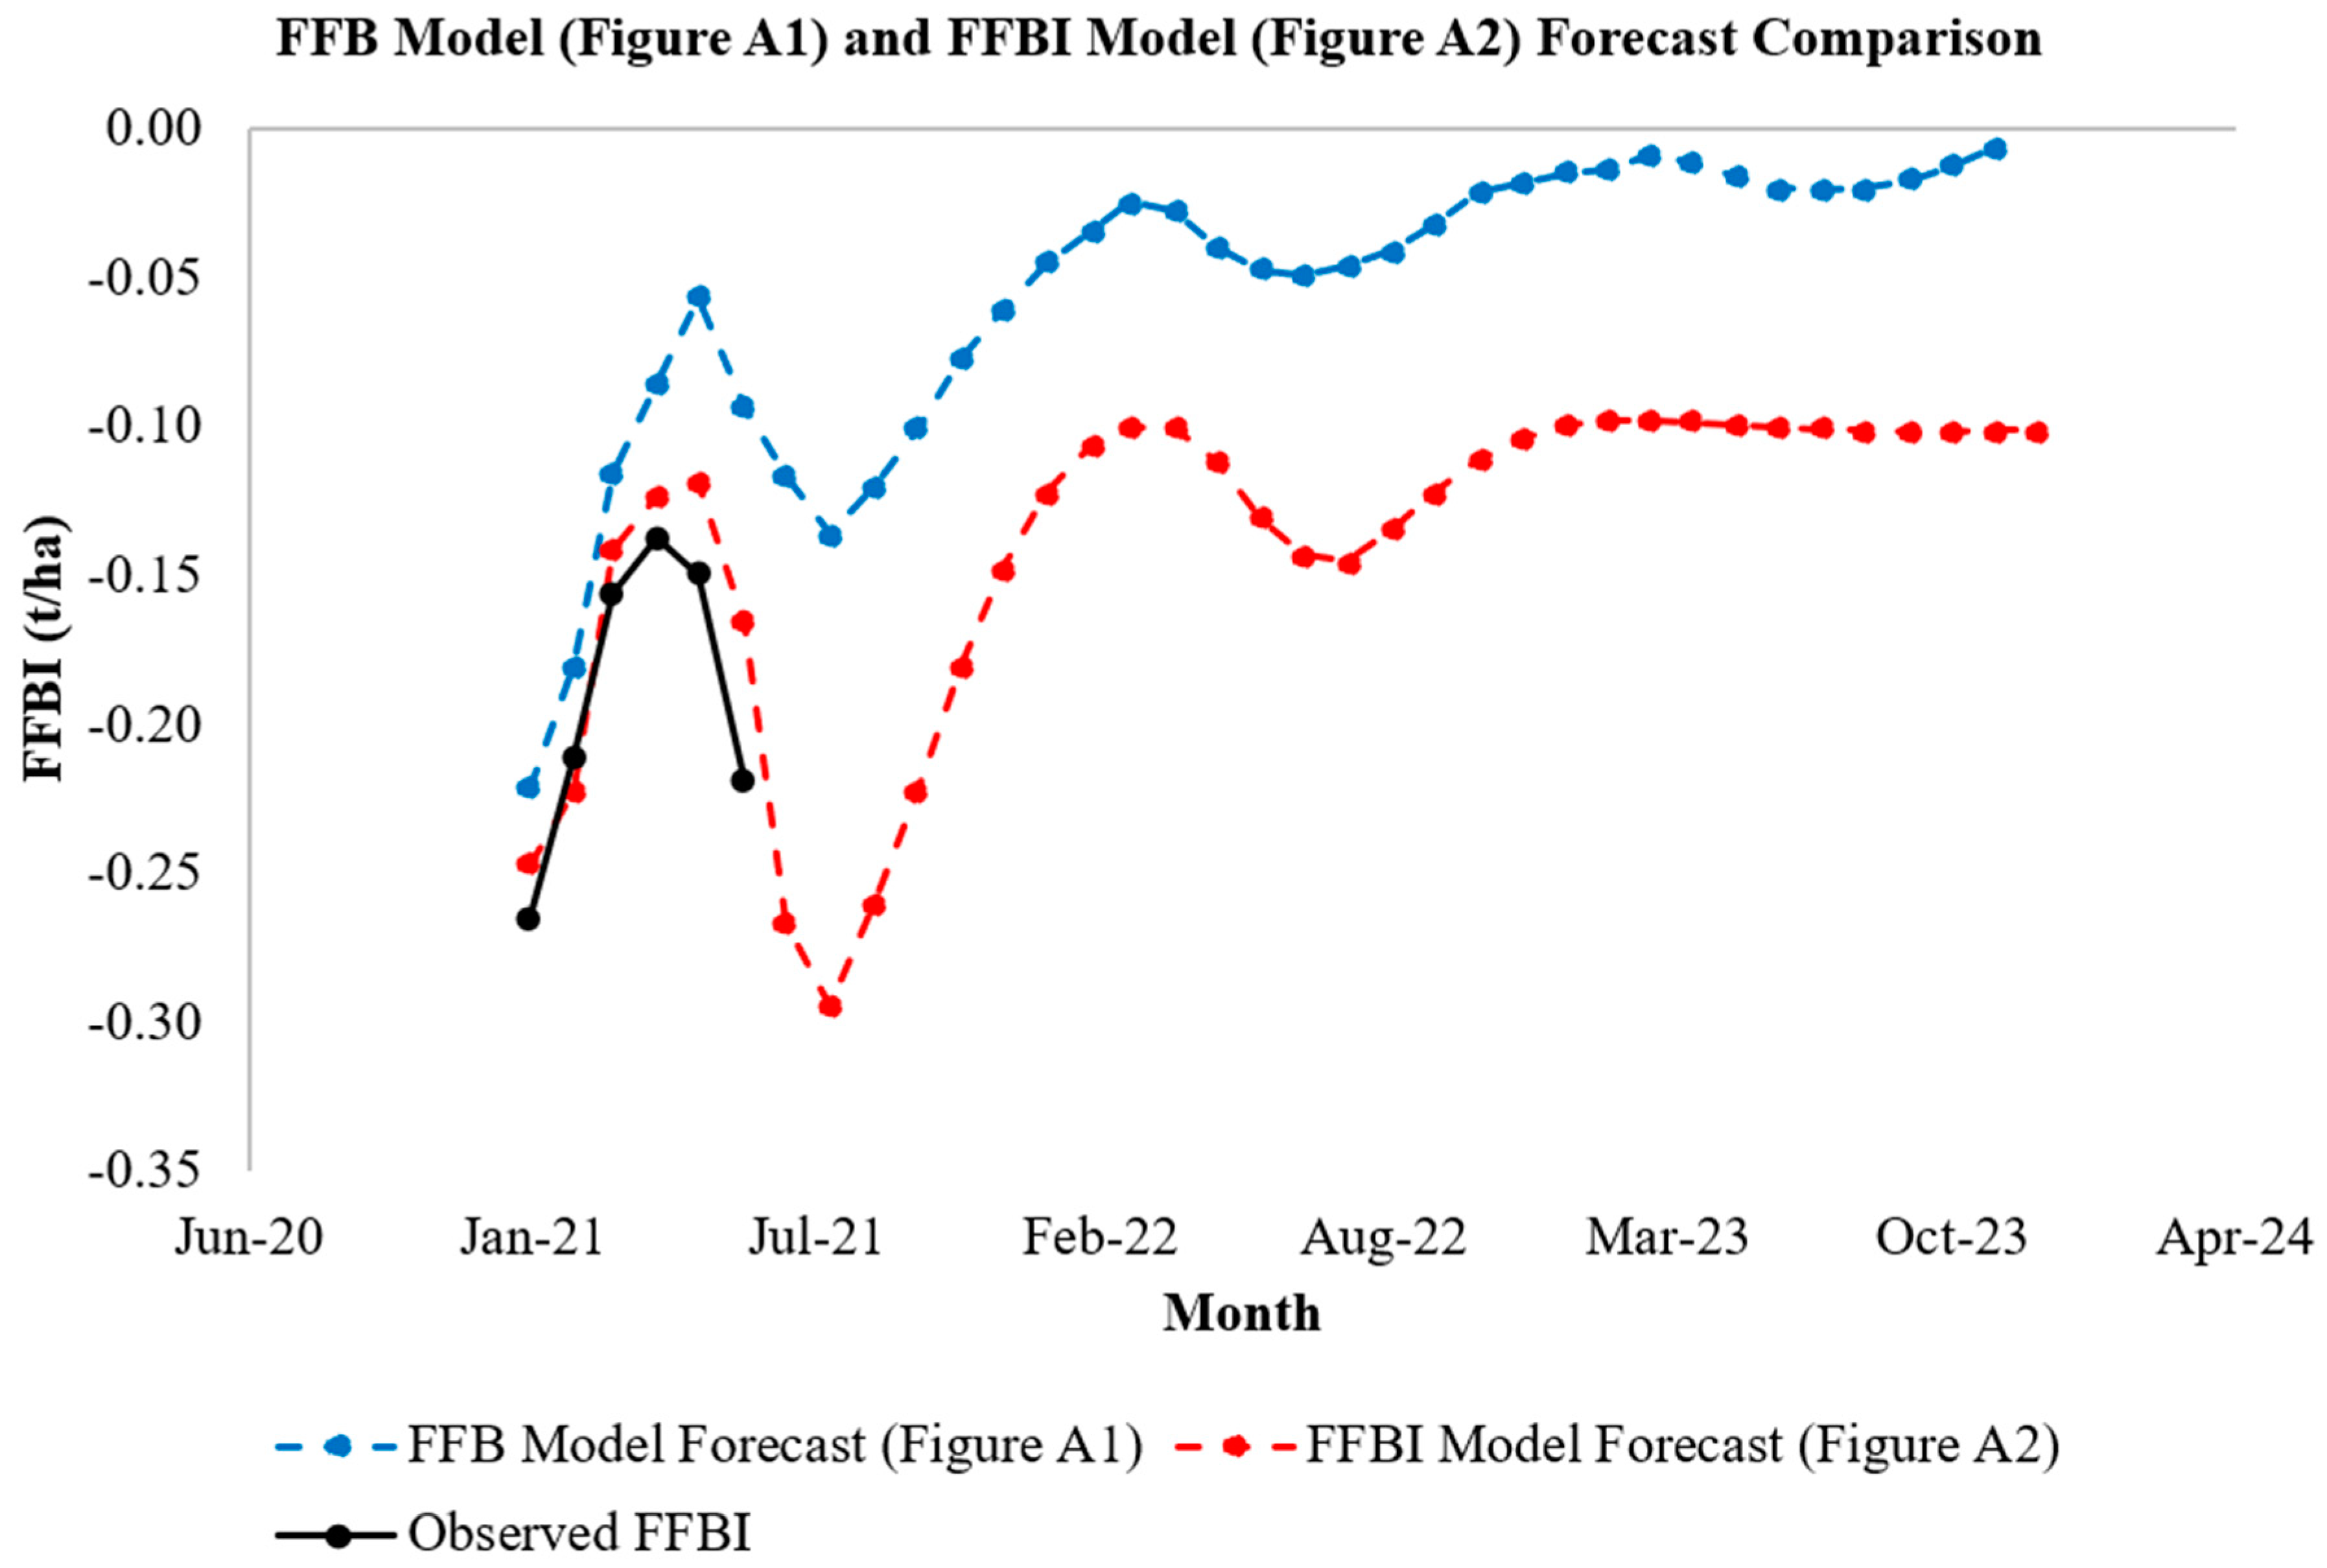
3.1.2. Time Series Forecasting
3.2. Production, Financial and Economical Loss in the Malaysian Oil Palm Industry due to El Niño
4. Discussion
4.1. Predictive Ability of the New Fresh Fruit Bunch Index (FFBI)
4.2. Trends of Oil Palm Yields during El Niño Events
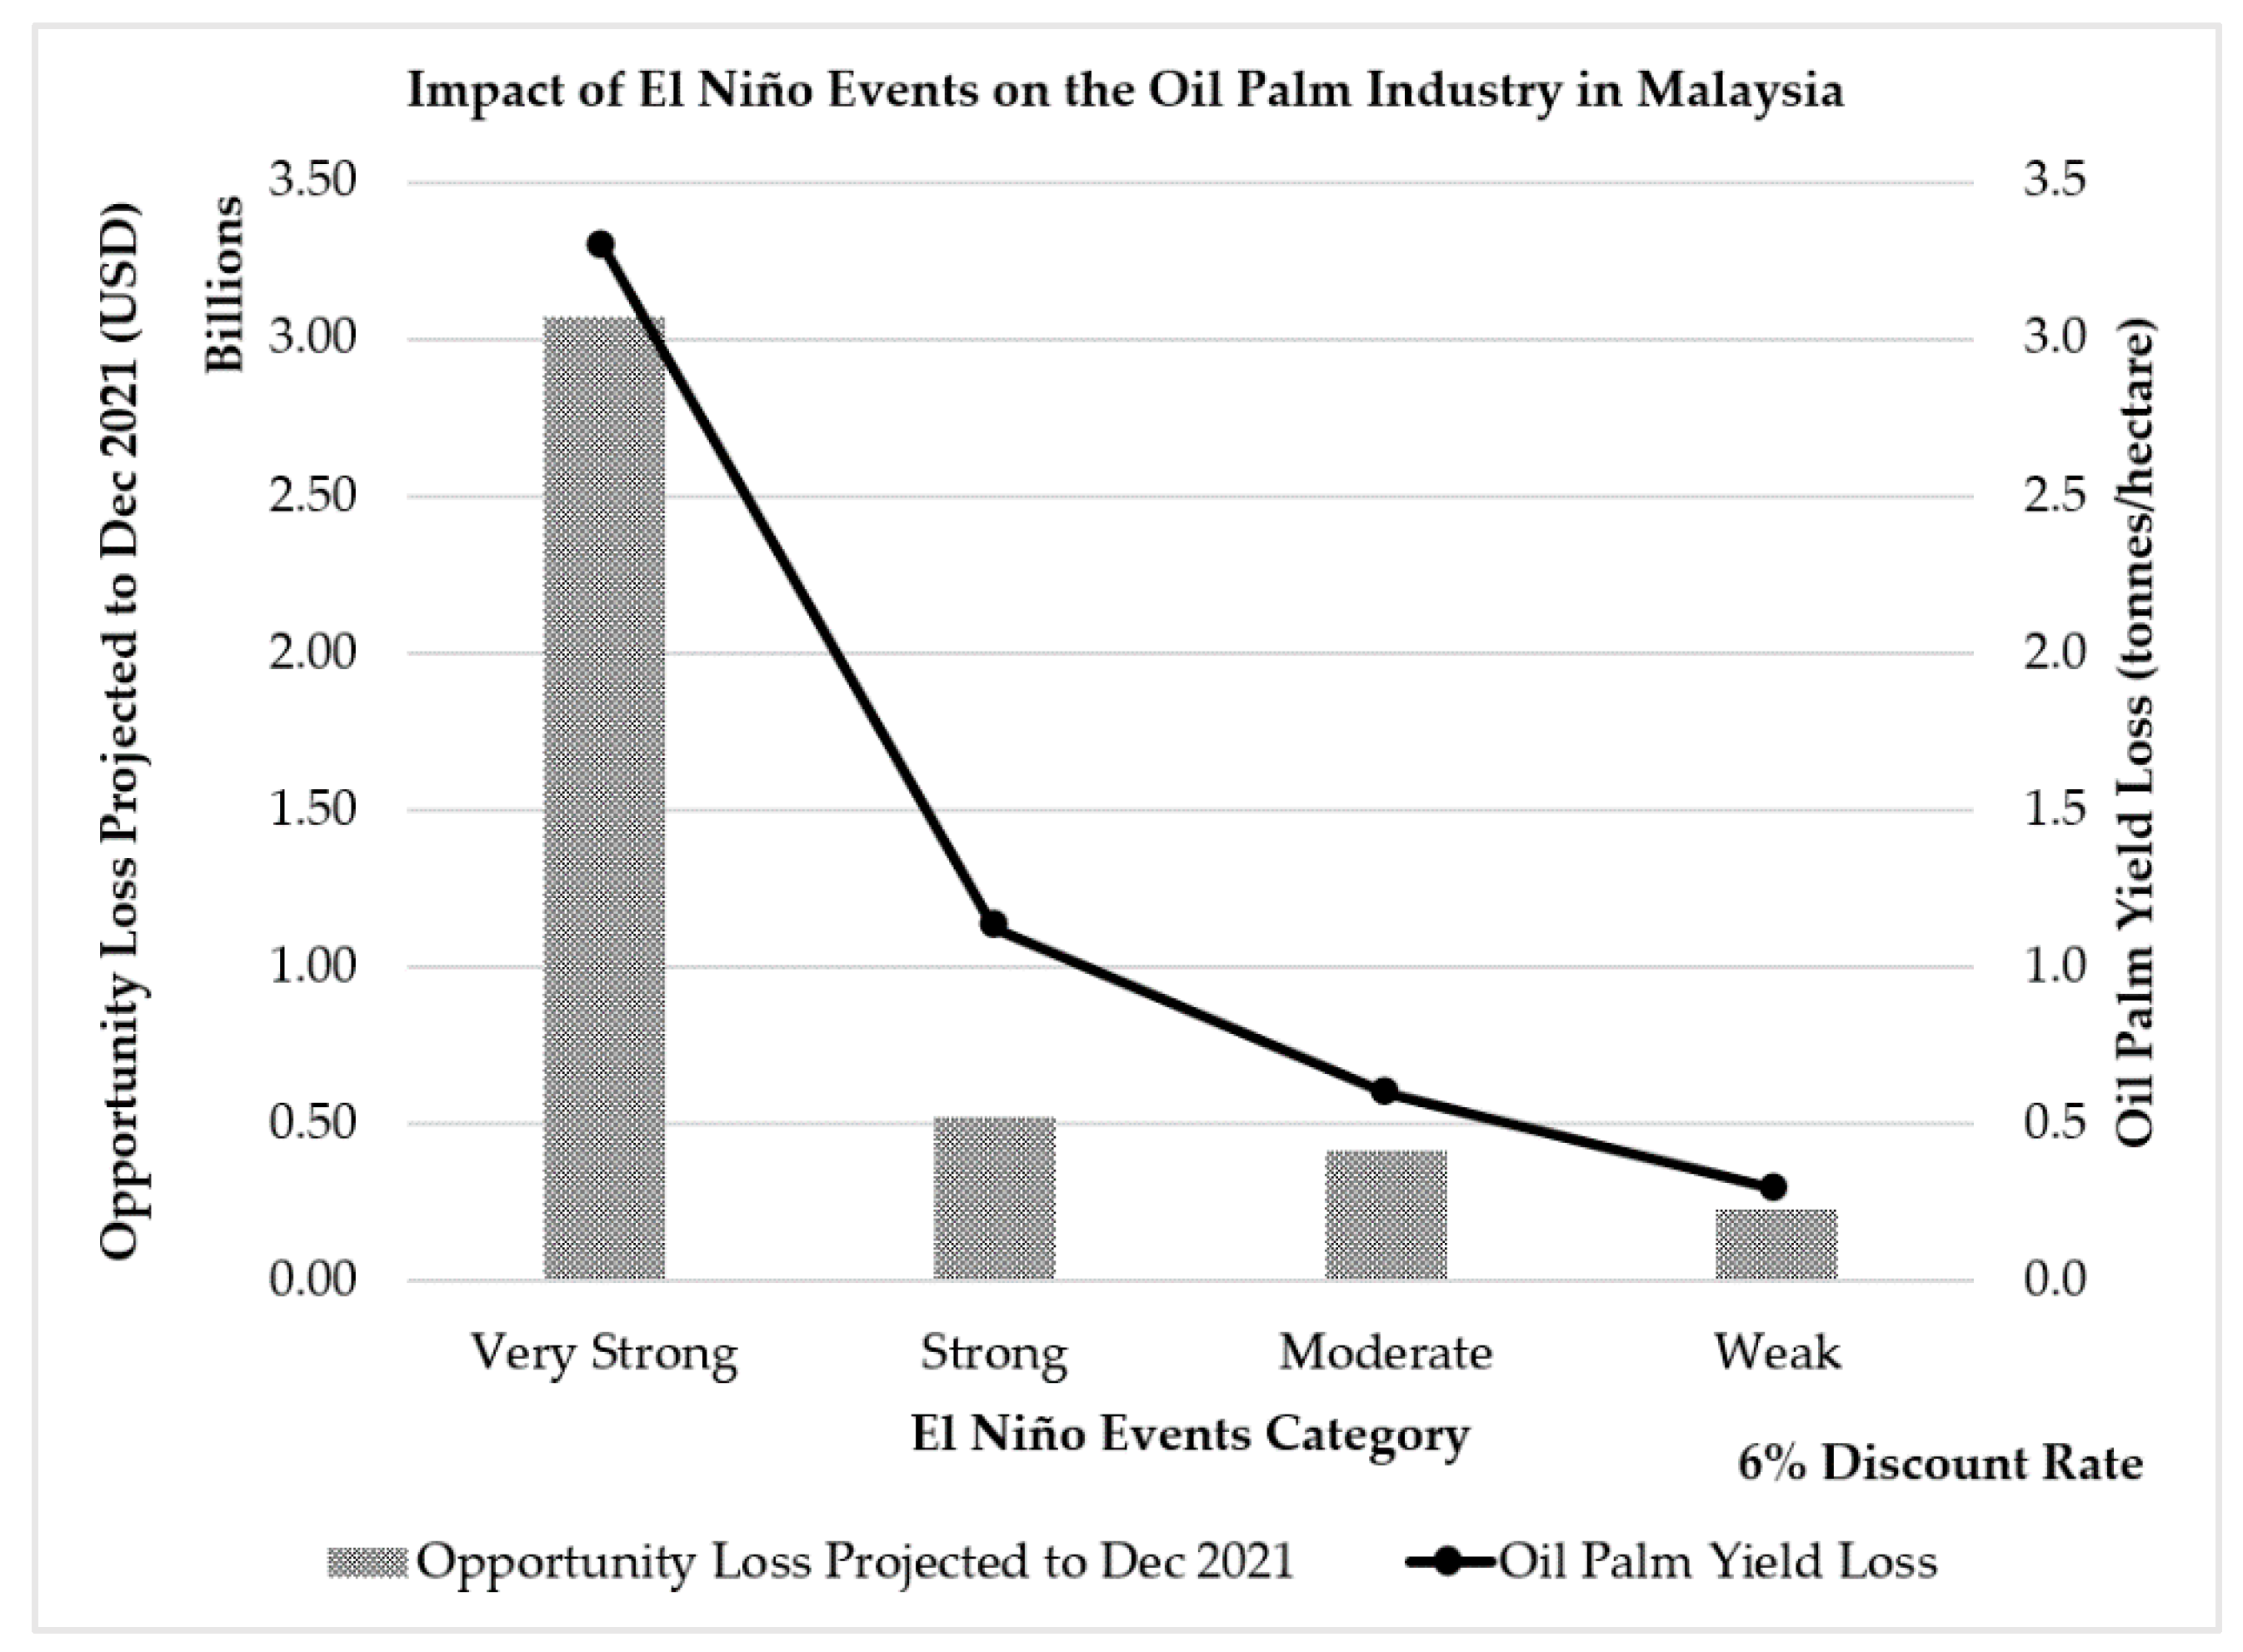
4.3. Impact of El Niño Events on the Malaysian Oil Palm Industry
4.4. Global Applicability of FFBI
5. Conclusions
Author Contributions
Funding
Institutional Review Board Statement
Informed Consent Statement
Data Availability Statement
Conflicts of Interest
Appendix A

| Year | CPO Yield (t/ha) | CPKO Yield (t/ha) | Year | CPO Yield (t/ha) | CPKO Yield (t/ha) |
|---|---|---|---|---|---|
| 1975 | 3.66 | 0.17 | 2000 | 3.46 | 0.41 |
| 1976 | 3.48 | 0.16 | 2001 | 3.66 | 0.44 |
| 1977 | 3.54 | 0.18 | 2002 | 3.59 | 0.40 |
| 1978 | 2.95 | 0.17 | 2003 | 3.75 | 0.43 |
| 1979 | 3.65 | 0.21 | 2004 | 3.73 | 0.42 |
| 1980 | 3.78 | 0.22 | 2005 | 3.80 | 0.45 |
| 1981 | 3.76 | 0.22 | 2006 | 3.93 | 0.47 |
| 1982 | 3.83 | 0.28 | 2007 | 3.83 | 0.44 |
| 1983 | 3.43 | 0.29 | 2008 | 4.08 | 0.47 |
| 1984 | 4.25 | 0.32 | 2009 | 3.93 | 0.45 |
| 1985 | 4.33 | 0.35 | 2010 | 3.69 | 0.42 |
| 1986 | 4.41 | 0.36 | 2011 | 4.01 | 0.43 |
| 1987 | 3.39 | 0.34 | 2012 | 3.84 | 0.43 |
| 1988 | 3.47 | 0.34 | 2013 | 3.85 | 0.43 |
| 1989 | 3.88 | 0.38 | 2014 | 3.84 | 0.42 |
| 1990 | 3.64 | 0.41 | 2015 | 3.78 | 0.40 |
| 1991 | 3.48 | 0.37 | 2016 | 3.21 | 0.34 |
| 1992 | 3.43 | 0.37 | 2017 | 3.53 | 0.39 |
| 1993 | 3.78 | 0.42 | 2018 | 3.42 | 0.39 |
| 1994 | 3.43 | 0.41 | 2019 | 3.47 | 0.39 |
| 1995 | 3.50 | 0.41 | 2020 | 3.33 | 0.38 |
| 1996 | 3.55 | 0.41 | Average: | 3.66 | 0.36 |
| 1997 | 3.63 | 0.40 | |||
| 1998 | 3.02 | 0.36 | |||
| 1999 | 3.58 | 0.40 |
Appendix B
| January | February | March | April | May | June | July | August | September | October | November | December | |
|---|---|---|---|---|---|---|---|---|---|---|---|---|
| 1986 | 1.68 | 1.37 | 1.38 | 1.34 | 1.29 | 1.29 | 1.65 | 1.64 | 1.95 | 1.94 | 1.67 | 1.33 |
| 1987 | 1.09 | 1.04 | 1.08 | 1.20 | 1.20 | 1.49 | 1.64 | 1.87 | 2.05 | 1.78 | 1.47 | 1.17 |
| 1988 | 0.95 | 0.97 | 1.19 | 1.34 | 1.38 | 1.67 | 1.69 | 1.85 | 1.78 | 1.68 | 1.57 | 1.41 |
| 1989 | 1.19 | 1.09 | 1.20 | 1.26 | 1.43 | 1.61 | 1.81 | 2.05 | 2.14 | 2.02 | 2.02 | 1.68 |
| 1990 | 1.37 | 1.26 | 1.35 | 1.34 | 1.72 | 1.55 | 1.72 | 1.88 | 1.93 | 1.74 | 1.51 | 1.22 |
| 1991 | 0.99 | 0.97 | 1.25 | 1.41 | 1.59 | 1.43 | 1.73 | 1.88 | 1.98 | 1.88 | 1.49 | 1.23 |
| 1992 | 1.12 | 1.07 | 1.20 | 1.35 | 1.41 | 1.42 | 1.67 | 1.75 | 1.92 | 1.77 | 1.71 | 1.41 |
| 1993 | 1.21 | 1.17 | 1.20 | 1.66 | 1.63 | 1.73 | 1.86 | 1.99 | 2.31 | 2.06 | 1.83 | 1.53 |
| 1994 | 1.38 | 1.16 | 1.23 | 1.29 | 1.30 | 1.41 | 1.53 | 1.71 | 1.92 | 1.98 | 1.77 | 1.69 |
| 1995 | 1.55 | 1.29 | 1.39 | 1.38 | 1.35 | 1.50 | 1.64 | 1.73 | 1.87 | 1.83 | 1.82 | 1.58 |
| 1996 | 1.33 | 1.06 | 1.43 | 1.40 | 1.64 | 1.64 | 1.63 | 1.86 | 1.90 | 1.94 | 1.64 | 1.43 |
| 1997 | 1.23 | 1.12 | 1.42 | 1.58 | 1.63 | 1.68 | 1.77 | 1.82 | 1.95 | 1.88 | 1.67 | 1.30 |
| 1998 | 1.03 | 1.18 | 1.15 | 1.20 | 1.27 | 1.38 | 1.49 | 1.61 | 1.65 | 1.48 | 1.41 | 1.10 |
| 1999 | 0.98 | 1.05 | 1.29 | 1.65 | 1.85 | 1.76 | 1.75 | 1.76 | 1.88 | 1.89 | 1.76 | 1.61 |
| 2000 | 1.38 | 1.26 | 1.26 | 1.32 | 1.33 | 1.35 | 1.39 | 1.62 | 1.88 | 2.02 | 1.96 | 1.56 |
| 2001 | 1.80 | 1.51 | 1.46 | 1.51 | 1.57 | 1.48 | 1.43 | 1.57 | 1.78 | 1.81 | 1.70 | 1.52 |
| 2002 | 1.47 | 1.21 | 1.34 | 1.32 | 1.40 | 1.43 | 1.51 | 1.68 | 1.87 | 1.79 | 1.57 | 1.38 |
| 2003 | 1.29 | 1.12 | 1.40 | 1.56 | 1.67 | 1.73 | 1.83 | 1.82 | 1.83 | 1.66 | 1.46 | 1.62 |
| 2004 | 1.25 | 1.18 | 1.25 | 1.33 | 1.44 | 1.53 | 1.69 | 1.71 | 1.97 | 1.77 | 1.68 | 1.74 |
| 2005 | 1.50 | 1.31 | 1.52 | 1.56 | 1.61 | 1.50 | 1.62 | 1.70 | 1.82 | 1.75 | 1.61 | 1.40 |
| 2006 | 1.23 | 1.34 | 1.51 | 1.61 | 1.70 | 1.64 | 1.67 | 1.87 | 1.97 | 1.70 | 1.90 | 1.43 |
| 2007 | 1.45 | 1.25 | 1.30 | 1.35 | 1.43 | 1.39 | 1.62 | 1.83 | 1.89 | 1.85 | 1.95 | 1.68 |
| 2008 | 1.68 | 1.42 | 1.51 | 1.52 | 1.62 | 1.65 | 1.78 | 1.79 | 1.76 | 1.90 | 1.87 | 1.68 |
| 2009 | 1.52 | 1.30 | 1.42 | 1.39 | 1.48 | 1.52 | 1.60 | 1.63 | 1.74 | 2.14 | 1.77 | 1.69 |
| 2010 | 1.44 | 1.22 | 1.44 | 1.38 | 1.44 | 1.49 | 1.64 | 1.71 | 1.66 | 1.72 | 1.55 | 1.34 |
| 2011 | 1.15 | 1.20 | 1.51 | 1.60 | 1.78 | 1.79 | 1.79 | 1.69 | 1.96 | 1.95 | 1.68 | 1.59 |
| 2012 | 1.35 | 1.18 | 1.21 | 1.25 | 1.34 | 1.43 | 1.68 | 1.67 | 2.00 | 1.96 | 1.97 | 1.85 |
| 2013 | 1.63 | 1.32 | 1.30 | 1.33 | 1.35 | 1.37 | 1.65 | 1.74 | 1.90 | 1.93 | 1.83 | 1.67 |
| 2014 | 1.49 | 1.21 | 1.39 | 1.45 | 1.53 | 1.43 | 1.55 | 1.94 | 1.80 | 1.79 | 1.68 | 1.37 |
| 2015 | 1.15 | 1.07 | 1.33 | 1.55 | 1.64 | 1.61 | 1.68 | 1.89 | 1.81 | 1.84 | 1.57 | 1.34 |
| 2016 | 1.04 | 0.97 | 1.10 | 1.17 | 1.27 | 1.45 | 1.47 | 1.54 | 1.57 | 1.51 | 1.46 | 1.36 |
| 2017 | 1.20 | 1.13 | 1.32 | 1.38 | 1.45 | 1.37 | 1.61 | 1.61 | 1.62 | 1.78 | 1.75 | 1.67 |
| 2018 | 1.48 | 1.22 | 1.38 | 1.36 | 1.32 | 1.17 | 1.28 | 1.39 | 1.62 | 1.70 | 1.63 | 1.61 |
| 2019 | 1.52 | 1.34 | 1.42 | 1.42 | 1.40 | 1.34 | 1.49 | 1.55 | 1.57 | 1.57 | 1.35 | 1.22 |
| 2020 | 1.06 | 1.10 | 1.19 | 1.41 | 1.44 | 1.65 | 1.59 | 1.62 | 1.65 | 1.50 | 1.33 | 1.19 |
| 2021 | 1.03 | 0.97 | 1.20 | 1.28 | 1.32 | 1.35 | 1.30 |
Appendix C
| January | February | March | April | May | June | July | August | September | October | November | December | |
|---|---|---|---|---|---|---|---|---|---|---|---|---|
| 1986 | NULL | 0.20 | 0.06 | −0.07 | −0.16 | −0.13 | −0.10 | 0.00 | 0.04 | 0.07 | −0.01 | −0.13 |
| 1987 | −0.17 | −0.21 | −0.20 | −0.24 | −0.17 | −0.10 | 0.04 | 0.11 | 0.10 | −0.01 | −0.18 | −0.29 |
| 1988 | −0.30 | −0.24 | −0.14 | −0.10 | 0.00 | 0.04 | 0.11 | 0.03 | −0.03 | −0.10 | −0.10 | −0.10 |
| 1989 | −0.10 | −0.12 | −0.12 | −0.11 | −0.03 | 0.07 | 0.19 | 0.26 | 0.27 | 0.28 | 0.25 | 0.20 |
| 1990 | 0.11 | 0.05 | 0.01 | 0.07 | 0.07 | 0.12 | 0.09 | 0.10 | 0.05 | −0.05 | −0.16 | −0.25 |
| 1991 | −0.27 | −0.21 | −0.10 | 0.01 | 0.01 | 0.04 | 0.05 | 0.12 | 0.11 | 0.00 | −0.12 | −0.21 |
| 1992 | −0.19 | −0.15 | −0.10 | −0.08 | −0.07 | −0.04 | −0.02 | 0.04 | 0.01 | 0.02 | −0.02 | −0.05 |
| 1993 | −0.06 | −0.08 | 0.04 | 0.09 | 0.21 | 0.20 | 0.23 | 0.31 | 0.32 | 0.29 | 0.15 | 0.09 |
| 1994 | 0.03 | −0.02 | −0.08 | −0.13 | −0.13 | −0.13 | −0.08 | −0.02 | 0.07 | 0.11 | 0.16 | 0.18 |
| 1995 | 0.18 | 0.13 | 0.05 | −0.03 | −0.06 | −0.05 | −0.01 | 0.00 | 0.01 | 0.06 | 0.09 | 0.09 |
| 1996 | 0.00 | 0.00 | −0.01 | 0.09 | 0.09 | 0.09 | 0.08 | 0.05 | 0.10 | 0.05 | 0.02 | −0.06 |
| 1997 | −0.07 | −0.02 | 0.07 | 0.14 | 0.16 | 0.15 | 0.13 | 0.10 | 0.08 | 0.05 | −0.04 | −0.16 |
| 1998 | −0.16 | −0.16 | −0.13 | −0.20 | −0.18 | −0.16 | −0.14 | −0.16 | −0.22 | −0.27 | −0.32 | −0.33 |
| 1999 | −0.28 | −0.17 | 0.02 | 0.19 | 0.29 | 0.24 | 0.13 | 0.05 | 0.04 | 0.06 | 0.10 | 0.09 |
| 2000 | 0.09 | 0.02 | −0.03 | −0.10 | −0.13 | −0.19 | −0.18 | −0.11 | 0.04 | 0.17 | 0.19 | 0.28 |
| 2001 | 0.30 | 0.31 | 0.19 | 0.11 | 0.05 | −0.05 | −0.14 | −0.15 | −0.08 | −0.02 | 0.02 | 0.07 |
| 2002 | 0.07 | 0.06 | −0.02 | −0.05 | −0.08 | −0.10 | −0.09 | −0.06 | −0.02 | −0.04 | −0.07 | −0.08 |
| 2003 | −0.06 | −0.01 | 0.05 | 0.14 | 0.19 | 0.20 | 0.16 | 0.08 | −0.03 | −0.13 | −0.07 | −0.05 |
| 2004 | 0.02 | −0.05 | −0.05 | −0.06 | −0.03 | 0.01 | 0.01 | 0.05 | 0.01 | 0.03 | 0.08 | 0.15 |
| 2005 | 0.19 | 0.17 | 0.16 | 0.16 | 0.09 | 0.03 | −0.02 | −0.03 | −0.05 | −0.05 | −0.07 | −0.08 |
| 2006 | 0.00 | 0.08 | 0.18 | 0.20 | 0.18 | 0.13 | 0.10 | 0.09 | 0.04 | 0.08 | 0.02 | 0.10 |
| 2007 | 0.05 | 0.06 | −0.01 | −0.04 | −0.08 | −0.06 | −0.02 | 0.04 | 0.05 | 0.12 | 0.17 | 0.28 |
| 2008 | 0.27 | 0.26 | 0.18 | 0.15 | 0.13 | 0.14 | 0.11 | 0.03 | 0.01 | 0.06 | 0.16 | 0.20 |
| 2009 | 0.17 | 0.14 | 0.06 | 0.03 | 0.00 | −0.01 | −0.05 | −0.09 | 0.03 | 0.10 | 0.21 | 0.14 |
| 2010 | 0.12 | 0.09 | 0.04 | 0.02 | −0.03 | −0.02 | −0.02 | −0.07 | −0.11 | −0.14 | −0.12 | −0.14 |
| 2011 | −0.10 | 0.01 | 0.13 | 0.23 | 0.26 | 0.24 | 0.13 | 0.07 | 0.06 | 0.08 | 0.09 | 0.05 |
| 2012 | 0.05 | −0.03 | −0.09 | −0.14 | −0.13 | −0.06 | −0.04 | 0.04 | 0.07 | 0.20 | 0.27 | 0.33 |
| 2013 | 0.27 | 0.14 | 0.01 | −0.08 | −0.12 | −0.09 | −0.04 | 0.02 | 0.05 | 0.11 | 0.16 | 0.17 |
| 2014 | 0.13 | 0.09 | 0.04 | 0.05 | 0.00 | −0.04 | 0.01 | 0.02 | 0.04 | −0.02 | −0.04 | −0.09 |
| 2015 | −0.13 | −0.09 | 0.01 | 0.10 | 0.13 | 0.10 | 0.10 | 0.05 | 0.04 | −0.04 | −0.07 | −0.17 |
| 2016 | −0.21 | −0.24 | −0.23 | −0.22 | −0.17 | −0.15 | −0.14 | −0.22 | −0.26 | −0.27 | −0.21 | −0.15 |
| 2017 | −0.10 | −0.06 | −0.03 | −0.02 | −0.07 | −0.07 | −0.10 | −0.13 | −0.13 | −0.06 | 0.08 | 0.14 |
| 2018 | 0.13 | 0.08 | 0.01 | −0.05 | −0.18 | −0.29 | −0.35 | −0.31 | −0.23 | −0.13 | −0.01 | 0.10 |
| 2019 | 0.16 | 0.15 | 0.09 | 0.01 | −0.08 | −0.13 | −0.17 | −0.21 | −0.24 | −0.28 | −0.27 | −0.28 |
| 2020 | −0.20 | −0.16 | −0.07 | −0.06 | 0.03 | 0.02 | −0.01 | −0.12 | −0.21 | −0.29 | −0.31 | −0.31 |
| 2021 | −0.26 | −0.21 | −0.16 | −0.14 | −0.15 | −0.22 | NULL |
Appendix D
| January | February | March | April | May | June | July | August | September | October | November | December | |
|---|---|---|---|---|---|---|---|---|---|---|---|---|
| 1983 | 2.2 | 1.9 | 1.5 | 1.3 | 1.1 | 0.7 | 0.3 | −0.1 | −0.5 | −0.8 | −1.0 | −0.9 |
| 1984 | −0.6 | −0.4 | −0.3 | −0.4 | −0.5 | −0.4 | −0.3 | −0.2 | −0.2 | −0.6 | −0.9 | −1.1 |
| 1985 | −1.0 | −0.8 | −0.8 | −0.8 | −0.8 | −0.6 | −0.5 | −0.5 | −0.4 | −0.3 | −0.3 | −0.4 |
| 1986 | −0.5 | −0.5 | −0.3 | −0.2 | −0.1 | 0.0 | 0.2 | 0.4 | 0.7 | 0.9 | 1.1 | 1.2 |
| 1987 | 1.2 | 1.2 | 1.1 | 0.9 | 1.0 | 1.2 | 1.5 | 1.7 | 1.6 | 1.5 | 1.3 | 1.1 |
| 1988 | 0.8 | 0.5 | 0.1 | −0.3 | −0.9 | −1.3 | −1.3 | −1.1 | −1.2 | −1.5 | −1.8 | −1.8 |
| 1989 | −1.7 | −1.4 | −1.1 | −0.8 | −0.6 | −0.4 | −0.3 | −0.3 | −0.2 | −0.2 | −0.2 | −0.1 |
| 1990 | 0.1 | 0.2 | 0.3 | 0.3 | 0.3 | 0.3 | 0.3 | 0.4 | 0.4 | 0.3 | 0.4 | 0.4 |
| 1991 | 0.4 | 0.3 | 0.2 | 0.3 | 0.5 | 0.6 | 0.7 | 0.6 | 0.6 | 0.8 | 1.2 | 1.5 |
| 1992 | 1.7 | 1.6 | 1.5 | 1.3 | 1.1 | 0.7 | 0.4 | 0.1 | −0.1 | −0.2 | −0.3 | −0.1 |
| 1993 | 0.1 | 0.3 | 0.5 | 0.7 | 0.7 | 0.6 | 0.3 | 0.3 | 0.2 | 0.1 | 0.0 | 0.1 |
| 1994 | 0.1 | 0.1 | 0.2 | 0.3 | 0.4 | 0.4 | 0.4 | 0.4 | 0.6 | 0.7 | 1.0 | 1.1 |
| 1995 | 1.0 | 0.7 | 0.5 | 0.3 | 0.1 | 0.0 | −0.2 | −0.5 | −0.8 | −1.0 | −1.0 | −1.0 |
| 1996 | −0.9 | −0.8 | −0.6 | −0.4 | −0.3 | −0.3 | −0.3 | −0.3 | −0.4 | −0.4 | −0.4 | −0.5 |
| 1997 | −0.5 | −0.4 | −0.1 | 0.3 | 0.8 | 1.2 | 1.6 | 1.9 | 2.1 | 2.3 | 2.4 | 2.4 |
| 1998 | 2.2 | 1.9 | 1.4 | 1.0 | 0.5 | −0.1 | −0.8 | −1.1 | −1.3 | −1.4 | −1.5 | −1.6 |
| 1999 | −1.5 | −1.3 | −1.1 | −1.0 | −1.0 | −1.0 | −1.1 | −1.1 | −1.2 | −1.3 | −1.5 | −1.7 |
| 2000 | −1.7 | −1.4 | −1.1 | −0.8 | −0.7 | −0.6 | −0.6 | −0.5 | −0.5 | −0.6 | −0.7 | −0.7 |
| 2001 | −0.7 | −0.5 | −0.4 | −0.3 | −0.3 | −0.1 | −0.1 | −0.1 | −0.2 | −0.3 | −0.3 | −0.3 |
| 2002 | −0.1 | 0.0 | 0.1 | 0.2 | 0.4 | 0.7 | 0.8 | 0.9 | 1.0 | 1.2 | 1.3 | 1.1 |
| 2003 | 0.9 | 0.6 | 0.4 | 0.0 | −0.3 | −0.2 | 0.1 | 0.2 | 0.3 | 0.3 | 0.4 | 0.4 |
| 2004 | 0.4 | 0.3 | 0.2 | 0.2 | 0.2 | 0.3 | 0.5 | 0.6 | 0.7 | 0.7 | 0.7 | 0.7 |
| 2005 | 0.6 | 0.6 | 0.4 | 0.4 | 0.3 | 0.1 | −0.1 | −0.1 | −0.1 | −0.3 | −0.6 | −0.8 |
| 2006 | −0.9 | −0.8 | −0.6 | −0.4 | −0.1 | 0.0 | 0.1 | 0.3 | 0.5 | 0.8 | 0.9 | 0.9 |
| 2007 | 0.7 | 0.2 | −0.1 | −0.3 | −0.4 | −0.5 | −0.6 | −0.8 | −1.1 | −1.3 | −1.5 | −1.6 |
| 2008 | −1.6 | −1.5 | −1.3 | −1.0 | −0.8 | −0.6 | −0.4 | −0.2 | −0.2 | −0.4 | −0.6 | −0.7 |
| 2009 | −0.8 | −0.8 | −0.6 | −0.3 | 0.0 | 0.3 | 0.5 | 0.6 | 0.7 | 1.0 | 1.4 | 1.6 |
| 2010 | 1.5 | 1.2 | 0.8 | 0.4 | −0.2 | −0.7 | −1.0 | −1.3 | −1.6 | −1.6 | −1.6 | −1.6 |
| 2011 | −1.4 | −1.2 | −0.9 | −0.7 | −0.6 | −0.4 | −0.5 | −0.6 | −0.8 | −1.0 | −1.1 | −1.0 |
| 2012 | −0.9 | −0.7 | −0.6 | −0.5 | −0.3 | 0.0 | 0.2 | 0.4 | 0.4 | 0.3 | 0.1 | −0.2 |
| 2013 | −0.4 | −0.4 | −0.3 | −0.3 | −0.4 | −0.4 | −0.4 | −0.3 | −0.3 | −0.2 | −0.2 | −0.3 |
| 2014 | −0.4 | −0.5 | −0.3 | 0.0 | 0.2 | 0.2 | 0.0 | 0.1 | 0.2 | 0.5 | 0.6 | 0.7 |
| 2015 | 0.5 | 0.5 | 0.5 | 0.7 | 0.9 | 1.2 | 1.5 | 1.9 | 2.2 | 2.4 | 2.6 | 2.6 |
| 2016 | 2.5 | 2.1 | 1.6 | 0.9 | 0.4 | −0.1 | −0.4 | −0.5 | −0.6 | −0.7 | −0.7 | −0.6 |
| 2017 | −0.3 | −0.2 | 0.1 | 0.2 | 0.3 | 0.3 | 0.1 | −0.1 | −0.4 | −0.7 | −0.8 | −1.0 |
| 2018 | −0.9 | −0.9 | −0.7 | −0.5 | −0.2 | 0.0 | 0.1 | 0.2 | 0.5 | 0.8 | 0.9 | 0.8 |
| 2019 | 0.7 | 0.7 | 0.7 | 0.7 | 0.5 | 0.5 | 0.3 | 0.1 | 0.2 | 0.3 | 0.5 | 0.5 |
| 2020 | 0.5 | 0.5 | 0.4 | 0.2 | −0.1 | −0.3 | −0.4 | −0.6 | −0.9 | −1.2 | −1.3 | −1.2 |
| 2021 | −1.0 | −0.9 | −0.8 | −0.7 | −0.5 | −0.4 |
Appendix E

Appendix F

Appendix G
| Modelled Period | 1986–2015 | 1987–2016 | 1988–2017 | 1989–2018 | 1990–2019 | 1991–2020 |
|---|---|---|---|---|---|---|
| Model | ARIMA (1,1,5) (0,0,1) | ARIMA (0,0,4) (0,0,0) | ARIMA (3,1,3) (0,0,1) | ARIMA (0,0,4) (0,0,0) | ARIMA (0,0,4) (0,0,1) | ARIMA (3,1,3) (0,0,1) |
| R−Squared | 0.9285 | 0.9164 | 0.9281 | 0.9198 | 0.9238 | 0.9354 |
| Adjusted R−Squared | 0.9283 | 0.9162 | 0.9279 | 0.9196 | 0.9236 | 0.9352 |
| Residual Skewness | −0.5314 | −0.1992 | −0.7146 | −0.3753 | −0.5032 | −0.7131 |
| Residual Range | 0.2310 | 0.3372 | 0.2288 | 0.2741 | 0.2405 | 0.2265 |
| Residual Median | 0.0001 | −0.0002 | 0.0001 | 0.0020 | 0.0015 | 0.0036 |
| (BCa 99% CI) | [−0.0044, 0.0063] | [−0.0058, 0.0083] | [−0.0052, 0.0063] | [−0.0039, 0.0064] | [−0.0048, 0.0081] | [−0.0028, 0.0079] |
| Residual Standard Deviation | 0.0342 | 0.0375 | 0.0345 | 0.0374 | 0.0367 | 0.0343 |
| (BCa 99% CI) | [0.0304, 0.0382] | [0.0331, 0.043] | [0.0303, 0.0387] | [0.0333, 0.0415] | [0.0326, 0.0408] | [0.0305, 0.0382] |
| Residual Variance | 0.0012 | 0.0014 | 0.0012 | 0.0014 | 0.0013 | 0.0012 |
| (BCa 99% CI) | [0.0009, 0.0015] | [0.0011, 0.0018] | [0.0009, 0.0015] | [0.0011, 0.0017] | [0.0011, 0.0017] | [0.0009, 0.0015] |
Appendix H

Appendix I

Appendix J
| January | February | March | April | May | June | July | August | September | October | November | December | |
|---|---|---|---|---|---|---|---|---|---|---|---|---|
| 1986 | 637 | 476 | 653 | 553 | 589 | 573 | 504 | 448 | 504 | 723 | 718 | 712 |
| 1987 | 900 | 750 | 748 | 690 | 725 | 751 | 678 | 721 | 800 | 760 | 883 | 1093 |
| 1988 | 1068 | 895 | 906 | 916 | 1017 | 1220 | 1011 | 981 | 979 | 1073 | 985 | 967 |
| 1989 | 955 | 942 | 903 | 922 | 904 | 810 | 668 | 699 | 779 | 787 | 633 | 659 |
| 1990 | 696 | 683 | 695 | 705 | 700 | 710 | 701 | 708 | 707 | 752 | 863 | 896 |
| 1991 | 848 | 850 | 770 | 775 | 755 | 768 | 867 | 791 | 807 | 883 | 884 | 914 |
| 1992 | 888 | 891 | 905 | 848 | 848 | 859 | 826 | 841 | 868 | 917 | 938 | 953 |
| 1993 | 960 | 968 | 933 | 875 | 851 | 820 | 847 | 852 | 780 | 787 | 857 | 992 |
| 1994 | 970 | 943 | 974 | 1089 | 1107 | 1086 | 1185 | 1278 | 1404 | 1478 | 1647 | 1580 |
| 1995 | 1449 | 1551 | 1489 | 1311 | 1296 | 1345 | 1419 | 1321 | 1355 | 1417 | 1392 | 1354 |
| 1996 | 1185 | 1178 | 1214 | 1250 | 1188 | 1077 | 1099 | 1238 | 1142 | 1181 | 1207 | 1255 |
| 1997 | 1296 | 1264 | 1258 | 1281 | 1230 | 1157 | 1163 | 1305 | 1573 | 1709 | 1784 | 2075 |
| 1998 | 2392 | 2117 | 2145 | 2295 | 2292 | 2323 | 2428 | 2499 | 2234 | 2333 | 2302 | 2156 |
| 1999 | 1854 | 1563 | 1523 | 1586 | 1355 | 1232 | 988 | 1310 | 1239 | 1235 | 1245 | 1176 |
| 2000 | 1133 | 1040 | 1196 | 1149 | 1035 | 1030 | 1033 | 1003 | 901 | 852 | 822 | 804 |
| 2001 | 780 | 751 | 880 | 766 | 764 | 865 | 1236 | 1069 | 940 | 990 | 1097 | 1146 |
| 2002 | 1155 | 1150 | 1152 | 1204 | 1426 | 1355 | 1502 | 1470 | 1361 | 1510 | 1588 | 1644 |
| 2003 | 1619 | 1594 | 1433 | 1355 | 1416 | 1408 | 1280 | 1339 | 1460 | 1762 | 1737 | 1774 |
| 2004 | 1778 | 1947 | 1937 | 1888 | 1610 | 1550 | 1419 | 1515 | 1413 | 1438 | 1425 | 1387 |
| 2005 | 1274 | 1403 | 1461 | 1429 | 1412 | 1408 | 1377 | 1370 | 1460 | 1445 | 1391 | 1415 |
| 2006 | 1443 | 1507 | 1437 | 1481 | 1444 | 1491 | 1641 | 1578 | 1559 | 1661 | 1940 | 1995 |
| 2007 | 1900 | 1960 | 2070 | 2214 | 2581 | 2427 | 2608 | 2420 | 2644 | 2880 | 2930 | 3050 |
| 2008 | 3232 | 4005 | 3395 | 3395 | 3498 | 3598 | 3050 | 2620 | 2090 | 1515 | 1632 | 1695 |
| 2009 | 1779 | 1895 | 2000 | 2595 | 2560 | 2230 | 2189 | 2370 | 2105 | 2208 | 2472 | 2663 |
| 2010 | 2445 | 2595 | 2556 | 2558 | 2436 | 2373 | 2517 | 2570 | 2730 | 3061 | 3412 | 3788 |
| 2011 | 3809 | 3472 | 3326 | 3270 | 3393 | 3072 | 3096 | 3009 | 2905 | 2938 | 3018 | 3175 |
| 2012 | 3078 | 3270 | 3433 | 3471 | 3101 | 3020 | 2980 | 3019 | 2546 | 2496 | 2370 | 2438 |
| 2013 | 2557 | 2397 | 2378 | 2286 | 2397 | 2344 | 2236 | 2404 | 2320 | 2593 | 2654 | 2659 |
| 2014 | 2559 | 2800 | 2634 | 2623 | 2423 | 2426 | 2257 | 1929 | 2217 | 2306 | 2172 | 2266 |
| 2015 | 2146 | 2305 | 2165 | 2102 | 2216 | 2229 | 2120 | 1991 | 2375 | 2363 | 2344 | 2485 |
| 2016 | 2443 | 2548 | 2725 | 2593 | 2620 | 2353 | 2316 | 2526 | 2636 | 2763 | 3073 | 3109 |
| 2017 | 3029 | 2770 | 2646 | 2508 | 2499 | 2459 | 2675 | 2706 | 2695 | 2815 | 2603 | 2503 |
| 2018 | 2492 | 2559 | 2425 | 2362 | 2429 | 2326 | 2194 | 2248 | 2174 | 2150 | 2040 | 2121 |
| 2019 | 2299 | 2121 | 2106 | 2095 | 2069 | 1951 | 2070 | 2234 | 2135 | 2485 | 2744 | 3052 |
| 2020 | 2604 | 2319 | 2402 | 2088 | 2292 | 2297 | 2677 | 2738 | 2714 | 3011 | 3305 | 3600 |
| 2021 | 3490 | 3742 | 3612 | 3868 | 3919 | 3599 |
Appendix K
| Year | Matured Area (ha) | OER (%) | FFB Yield (t/ha) |
|---|---|---|---|
| 1986 | 1,360,579 | 19.62 | 22.15 |
| 1987 | 1,373,147 | 19.87 | 17.10 |
| 1988 | 1,530,906 | 19.87 | 17.52 |
| 1989 | 1,672,096 | 19.78 | 19.57 |
| 1990 | 1,746,054 | 19.64 | 18.53 |
| 1991 | 1,826,267 | 19.47 | 17.85 |
| 1992 | 1,890,268 | 19.21 | 17.83 |
| 1993 | 2,020,516 | 18.67 | 20.26 |
| 1994 | 2,144,080 | 18.63 | 18.42 |
| 1995 | 2,243,065 | 18.51 | 18.93 |
| 1996 | 2,353,147 | 18.71 | 18.95 |
| 1997 | 2,513,183 | 19.03 | 19.10 |
| 1998 | 2,638,020 | 18.91 | 15.98 |
| 1999 | 2,856,701 | 18.60 | 19.26 |
| 2000 | 2,941,791 | 18.86 | 18.33 |
| 2001 | 3,005,267 | 19.22 | 19.14 |
| 2002 | 3,188,307 | 19.91 | 17.97 |
| 2003 | 3,303,133 | 19.75 | 18.99 |
| 2004 | 3,450,960 | 20.03 | 18.60 |
| 2005 | 3,631,440 | 20.15 | 18.88 |
| 2006 | 3,703,254 | 20.04 | 19.60 |
| 2007 | 3,764,389 | 20.13 | 19.03 |
| 2008 | 3,915,924 | 20.21 | 20.18 |
| 2009 | 4,075,702 | 20.49 | 19.20 |
| 2010 | 4,202,213 | 20.45 | 18.03 |
| 2011 | 4,281,837 | 20.35 | 19.69 |
| 2012 | 4,352,872 | 20.35 | 18.89 |
| 2013 | 4,526,089 | 20.25 | 19.02 |
| 2014 | 4,689,321 | 20.62 | 18.63 |
| 2015 | 4,859,397 | 20.46 | 18.48 |
| 2016 | 5,001,438 | 20.18 | 15.91 |
| 2017 | 5,110,713 | 19.72 | 17.89 |
| 2018 | 5,189,344 | 19.95 | 17.16 |
| 2019 | 5,216,822 | 20.21 | 17.19 |
| 2020 | 5,231,743 | 19.92 | 16.73 |
References
- Mielke, T. Global supply, demand and price outlook of oils and fats in 2018/19. In Proceedings of the GLOBOIL, Mumbai, India, 28 September 2018. [Google Scholar]
- Oettli, P.; Behera, S.K.; Yamagata, T. Climate based predictability of oil palm tree yield in Malaysia. Sci. Rep. 2018, 8, 2271. [Google Scholar] [CrossRef] [Green Version]
- Malaysian Palm Oil Industry. Available online: http://www.palmoilworld.org/about_malaysian-industry.html (accessed on 17 August 2021).
- World Energy Council. Biofuels: Policies, Standards and Technologies; World Energy Council: London, UK, 2010. [Google Scholar]
- Palm Oil Registration & Licensing Authority (PORLA). PORLA Palm Oil Statistics; PORLA: Kelana Jaya, Malaysia, 1986–1999. [Google Scholar]
- Malaysian Palm Oil Board (MPOB). Malaysian Oil Palm Statistics; MPOB: Bangi, Malaysia, 2000–2020. [Google Scholar]
- Economics and Industry Development Division. Available online: https://bepi.mpob.gov.my/index.php/en/ (accessed on 17 August 2021).
- Wicke, B.; Sikkema, R.; Dornburg, V.; Junginger, M.; Faaij, A. Drivers of Land Use Changes and the Role of Palm Oil Production in Indonesia and Malaysia; Universiteit Utrecht Copernicus Institute: Utrecht, The Netherlands, 2008. [Google Scholar]
- Ling, A.H. Global palm oil trade—Prospects and outlook. In Proceedings of the Malaysian-China Business Forum, Kuala Lumpur, Malaysia, 4 March 2019. [Google Scholar]
- Barcelos, E.; Rios, S.D.A.; Cunha, R.N.V.; Lopes, R.; Motoike, S.Y.; Babiychuk, E.; Skirycz, A.; Kushnir, S. Oil palm natural diversity and the potential for yield improvement. Front. Plant. Sci. 2015, 6, 190. [Google Scholar] [CrossRef] [PubMed]
- World Development Indicators. Available online: https://databank.worldbank.org/reports.aspx?source=2&country=MYS# (accessed on 25 August 2021).
- Covert 1 US Dollar to Malaysian Ringgit. Available online: https://www.xe.com/currencyconverter/convert/?Amount=1&From=USD&To=MYR (accessed on 25 August 2021).
- Overview of the Malaysian Oil Palm Industry 2020. Available online: https://bepi.mpob.gov.my/images/overview/Overview_of_Industry_2020.pdf (accessed on 28 August 2021).
- Which Countries Produce the Most Palm Oil? Available online: https://www.statista.com/chart/23097/amount-of-palm-oil-produced-in-selected-countries/ (accessed on 25 October 2021).
- What is El Niño-Southern Oscillation (ENSO)? Available online: https://www.weather.gov/mhx/ensowhat (accessed on 17 August 2021).
- What are El Niño and La Niña? Available online: https://oceanservice.noaa.gov/facts/ninonina.html (accessed on 25 October 2021).
- El Niño. Available online: https://www.nationalgeographic.org/encyclopedia/el-nino/ (accessed on 25 October 2021).
- Cold & Warm Episodes by Season. Available online: https://origin.cpc.ncep.noaa.gov/products/analysis_monitoring/ensostuff/ONI_v5.php (accessed on 25 October 2021).
- El Niño and La Niña Years and Intensities. Available online: https://ggweather.com/enso/oni.htm (accessed on 17 August 2021).
- Shanmuganathan, S.; Narayanan, A. Modelling the climate change effects on Malaysia’s oil palm yield. In Proceedings of the 2012 IEEE Symposium on e-Learning, e-Management and e-Services (IS3e 2012), Kuala Lumpur, Malaysia, 21–24 October 2012. [Google Scholar]
- Tawang, A.; Tengku Ahmad, T.A.; Abdullah, M.Y. Stabilization of Upland Agriculture under El Nino Induced Climatic Risk: Impact Assessment and Mitigation Measures in Malaysia; United Nation: New York, NY, USA, 2001. [Google Scholar]
- Kamil, N.N.; Omar, S.F. Climate variability and its impact on the palm oil industry. Oil Palm Ind. Econ. J. 2016, 16, 18–30. [Google Scholar]
- Wójtowicz, M.; Wójtowicz, A. The effect of climate change on linolenic fatty acid in oilseed rape. Agronomy 2020, 10, 2003. [Google Scholar] [CrossRef]
- Sobko, O.; Stahl, A.; Hahn, V.; Zikeli, S.; Claupein, W.; Gruber, S. Environmental effects on soybean (Glyciune Max (L.) Merr) production in Central and South Germany. Agronomy 2020, 10, 1847. [Google Scholar] [CrossRef]
- Kamil, N.N.; Omar, S.F. The impact of El Niño and La Niña on Malaysian palm oil industry. Oil Palm Bull. 2017, 74, 1–6. [Google Scholar]
- Harun, M.H.; Mohammad, A.T.; Noor, M.R.M.; Din, A.K.; Latiff, J.; Sani, A.R.A.; Abdullah, R. Impact of El Niño occurrence on oil palm yield in Malaysia. Planter 2010, 86, 837–852. [Google Scholar]
- Shanmuganathan, S.; Narayanan, A.; Mohamed, M.; Ibrahim, R.; Khalid, H. A hybrid approach to modelling the climate change effects on Malaysia’s oil palm yield at the regional scale. In Recent Advances on Soft Computing and Data Mining; Herawan, T., Ghazali, R., Deris, M., Eds.; Springer: Basel, Switzerland, 2014; pp. 335–345. [Google Scholar]
- Puah, P.W.; Sidik, M.J. Impacts of rainfall, temperature and recent El Niños on fisheries and agricultural products in the west coast of Sabah [2000–2010]. Borneo Sci. 2011, 28, 73–85. [Google Scholar]
- Rahman, A.K.A.; Abdullah, R.; Balu, N.; Shariff, F.M. The impact of La Niña and El Niño events on crude palm oil prices: An econometric analysis. Oil Palm Ind. Econ. J. 2013, 13, 38–51. [Google Scholar]
- Malaysia. Available online: https://www.nationsonline.org/oneworld/malaysia.htm (accessed on 25 October 2021).
- Land Area (sq. km)—Malaysia. Available online: https://data.worldbank.org/indicator/AG.LND.TOTL.K2?locations=MY (accessed on 25 October 2021).
- GeoRSPO—RSPO Mapbuilder App. Available online: https://rspo.org/members/georspo (accessed on 25 October 2021).
- Ling, L.; Yusop, Z.; Yap, W.S.; Tan, W.L.; Chow, M.F.; Ling, J.L. A calibrated, watershed-specific SCS-CN method: Application to Wangjiaqiao watershed in the three gorges area. China. Water 2019, 12, 60. [Google Scholar] [CrossRef] [Green Version]
- Conduct and Interpret a Spearman Rank Correlation. Available online: https://www.statisticssolutions.com/free-resources/directory-of-statistical-analyses/spearman-rank-correlation/ (accessed on 27 August 2021).
- Artusi, R.; Verderio, P.; Marubini, E. Bravais-Pearson and Spearman correlation coefficients: Meaning, test of hypothesis and confidence interval. Int. J. Biol. Mark. 2002, 17, 148–151. [Google Scholar] [CrossRef]
- Downloading IBM SPSS Statistics 26. Available online: https://www.ibm.com/support/pages/downloading-ibm-spss-statistics-26 (accessed on 27 August 2021).
- Difference between Adjusted R-squared and R-squared. Available online: https://www.listendata.com/2014/08/adjusted-r-squared.html (accessed on 28 August 2021).
- Adjusted R2/Adjusted R-Squared: What is it Used for? Available online: https://www.statisticshowto.com/probability-and-statistics/statistics-definitions/adjusted-r2/ (accessed on 27 August 2021).
- Ling, L.; Yusop, Z.; Chow, M.F. Urban flood depth estimate with a new calibrated curve number runoff prediction model. IEEE Access 2020, 8, 10915–10923. [Google Scholar] [CrossRef]
- Ling, L.; Yusop, Z.; Ling, J.L. Statistical and Type II Error Assessment of a Runoff Predictive Model in Peninsula Malaysia. Mathematics 2021, 9, 812. [Google Scholar] [CrossRef]
- Ali, R.; Kuriqi, A.; Abubaker, S.; Kisi, O. Long-term trends and seasonality detection of the observed flow in Yangtze River using Mann-Kendall and Sen’s innovative trend method. Water 2019, 11, 1855. [Google Scholar] [CrossRef] [Green Version]
- MAKESENS-Application for Trend Calculation. Available online: https://en.ilmatieteenlaitos.fi/makesens (accessed on 20 June 2021).
- Foreign Agricultural Service (FAS). Commodity Intelligence Report—Malaysia: Stagnating Palm Oil Tields Impede Growth; United States Department of Agriculture (USDA): Washington, DC, USA, 2012. [Google Scholar]
- Malaysia’s Palm Oil Yield to Continue Declining on Labour Shortage. Available online: https://www.theedgemarkets.com/article/malaysias-palm-oil-yield-continue-declining-labour-shortage (accessed on 28 August 2021).
- Palm Oil Analyst Raises 2019 Malaysia Output Forecast to 20m Tonnes. Available online: https://www.thestar.com.my/business/business-news/2019/04/30/palm-oil-analyst-raises-2019-malaysia-output-forecast-to-20mil-tonnes (accessed on 28 August 2021).
- IOI Group Oil Palm Plantations Malaysia 2020 by Age. Available online: https://www.statista.com/statistics/1097997/ioi-group-oil-palm-plantations-in-malaysia-by-age/ (accessed on 28 August 2021).
- Organisation for Economic Co-operation and Development (OECD)/Food and Agriculture Organization (FAO). OECD-FAO Agricultural Outlook 2019–2028; OECD/FAO: Paris, France, 2019. [Google Scholar]
- Banks and Palm Oil. Available online: https://www.banktrack.org/campaign/banks_and_palm_oil (accessed on 25 October 2021).
- Indonesia. Available online: https://climateknowledgeportal.worldbank.org/country/indonesia/climate-data-historical (accessed on 25 October 2021).
- Climate—Thailand. Available online: https://www.climatestotravel.com/climate/thailand (accessed on 25 October 2021).
- Malaysia Information. Available online: https://www.malaysia.gov.my/portal/content/144 (accessed on 25 October 2021).
- Palm Oil. Available online: https://tradingeconomics.com/commodity/palm-oil (accessed on 25 October 2021).


| Crop | Oil Yield (t/ha) |
|---|---|
| Palm Oil | 3.82 |
| Palm kernel | 0.45 |
| Palm + Palm kernel oil | 4.27 |
| Rapeseed | 0.69 |
| Sunflower | 0.52 |
| Groundnut | 0.45 |
| Coconut | 0.34 |
| Cottonseed | 0.19 |
| Soybean | 0.38 |
| Corn | 0.15 |
| Very Strong | Strong | Moderate | Weak |
|---|---|---|---|
| 1997/98 | 1987/88 | 1986/87 | 2004/05 |
| 2015/16 | 1991/92 | 1994/95 | 2006/07 |
| 2002/03 | 2014/15 | ||
| 2009/10 | 2018/19 |
| Month | Average FFB Yield (t/ha) |
|---|---|
| January | 1.3194 |
| February | 1.1903 |
| March | 1.3234 |
| April | 1.4049 |
| May | 1.4829 |
| June | 1.5109 |
| July | 1.6329 |
| August | 1.7420 |
| September | 1.8543 |
| October | 1.8146 |
| November | 1.6746 |
| December | 1.4743 |
| Variable | p-Value | Normality |
|---|---|---|
| FFB | 0.0103 (<0.05) | Non-normal |
| FFBI | 0.1922 (>0.05) | Normal |
| ONI | 0.0000 (<0.05) | Non-normal |
| Lag Period (Months) | FFB & ONI | FFBI & ONI | ||
|---|---|---|---|---|
| Spearman’s rho Coefficient | p-Value | Spearman’s rho Coefficient | p-Value | |
| 0 | −0.027 | 0.578 | −0.064 | 0.188 |
| 1 | −0.029 | 0.557 | −0.087 | 0.074 |
| 2 | −0.030 | 0.540 | −0.106 | 0.029 * |
| 3 | −0.034 | 0.479 | −0.125 | 0.010 ** |
| 4 | −0.049 | 0.317 | −0.154 | 0.001 ** |
| 5 | −0.079 | 0.104 | −0.197 | 0.000 ** |
| 6 | −0.120 | 0.013 * | −0.254 | 0.000 ** |
| 7 | −0.165 | 0.001 ** | −0.313 | 0.000 ** |
| 8 | −0.200 | 0.000 ** | −0.364 | 0.000 ** |
| 9 | −0.217 | 0.000 ** | −0.394 | 0.000 ** |
| 10 | −0.211 | 0.000 ** | −0.399 | 0.000 ** |
| 11 | −0.188 | 0.000 ** | −0.381 | 0.000 ** |
| 12 | −0.159 | 0.001 ** | −0.348 | 0.000 ** |
| 13 | −0.128 | 0.008 ** | −0.303 | 0.000 ** |
| 14 | −0.095 | 0.050 | −0.248 | 0.000 ** |
| 15 | −0.060 | 0.214 | −0.183 | 0.000 ** |
| 16 | −0.030 | 0.542 | −0.112 | 0.021 * |
| 17 | −0.007 | 0.878 | −0.039 | 0.424 |
| 18 | 0.009 | 0.849 | 0.023 | 0.642 |
| Dependent Variable | FFB (tons/Hectare) | New FFBI (tons/Hectare) |
|---|---|---|
| Predictor | ONI | ONI |
| Modelled Period | Feb 1986–Jun 2021 (N = 425) | Feb 1986–Jun 2021 (N = 425) |
| Forecasted Period | Jul 2021–Dec 2023 (N = 30) | Jul 2021–Dec 2023 (N = 30) |
| Model | ARIMA (2,0,2) (1,1,1) | ARIMA (3,1,3) (0,0,1) |
| Adjusted R-Squared | 0.8274 | 0.9312 |
| Residual Sum of Squares (RSS) | 4.6876 | 0.5459 |
| Residual Skewness | −0.6903 | −0.4162 |
| Residual Range | 0.7644 | 0.2790 |
| Residual Median | 0.0077 | 0.0051 |
| Residual Median (BCa 99% CI) | [−0.0076, 0.0258] | [−0.0001, 0.0096] |
| Residual Standard Deviation | 0.1067 | 0.0359 |
| Residual Standard Deviation (BCa 99% CI) | [0.0941, 0.1192] | [0.0320, 0.0396] |
| Residual Variance | 0.0114 | 0.0013 |
| Residual Variance (BCa 99% CI) | [0.0088, 0.0142] | [0.0010, 0.0016] |
| Category | El Niño Events | MK Trend of FFBI | Sen’s Slope |
|---|---|---|---|
| Very Strong | 1997/98 | Decreasing *** | −0.0348 |
| 2015/16 | Decreasing *** | −0.0438 | |
| Strong | 1987/88 | Decreasing ** | −0.0986 |
| 1991/92 | Decreasing * | −0.0970 | |
| Moderate | 1986/87 | Decreasing ** | −0.0479 |
| 1994/95 | Decreasing * | −0.0527 | |
| 2002/03 | No Trend | ||
| 2009/10 | Decreasing *** | −0.0379 | |
| Weak | 2004/05 | Decreasing *** | −0.0267 |
| 2006/07 | Decreasing * | −0.0360 | |
| 2014/15 | No Trend | ||
| 2018/19 | Decreasing *** | −0.0439 |
| Category | El Niño Events | Lag | Negative FFBI Period | Oil Palm Yield Loss | Opportunity Loss | Projected to December 2021 |
|---|---|---|---|---|---|---|
| (Months) | (Months) | (t/ha) | (USD) | (USD) | ||
| Very Strong | 1997/98 | 0 | 16 | 3.0739 | 799,512,628.04 | 3,118,809,718.44 |
| 2015/16 | 2 | 25 | 3.5197 | 2,223,629,847.24 | 3,026,040,134.75 | |
| Strong | 1987/88 | 4 | 8 | 1.2702 | 86,205,737.87 | 621,682,504.89 |
| 1991/92 | 3 | 9 | 0.9798 | 74,237,749.64 | 422,833,751.88 | |
| Moderate | 1986/87 | 1 | 8 | 1.2279 | 59,553,760.49 | 451,416,000.07 |
| 1994/95 | 3 | 4 | 0.1373 | 17,843,504.29 | 83,902,729.92 | |
| 2002/03 | 3 | 6 | 0.2844 | 68,135,456.56 | 206,588,187.64 | |
| 2009/10 | 4 | 9 | 0.7400 | 484,337,375.58 | 925,974,111.78 | |
| Weak | 2004/05 | 6 | 7 | 0.3016 | 74,053,854.49 | 189,770,606.98 |
| 2006/07 | 3 | 5 | 0.2035 | 89,253,638.73 | 208,552,751.05 | |
| 2014/15 | 0 | 5 | 0.3808 | 197,547,898.49 | 296,149,942.22 | |
| 2018/19 | 4 | 12 | 2.1576 | 1,308,607,860.03 | 1,481,072,202.50 |
| Category | Lag | Negative FFBI Period | Oil Palm Yield Loss | Opportunity Loss | Projected to December 2021 |
|---|---|---|---|---|---|
| (Months) | (Months) | (t/ha) | (USD) | (USD) | |
| Very Strong | 1.0 | 20.5 | 3.2968 | 1,511,571,237.64 | 3,072,424,926.59 |
| Strong | 3.5 | 8.5 | 1.1250 | 80,221,743.75 | 522,258,128.39 |
| Moderate | 2.8 | 6.8 | 0.5974 | 157,467,524.23 | 416,970,257.35 |
| Weak | 3.0 | 5.7 | 0.2953 | 120,285,130.57 | 231,491,100.09 |
Publisher’s Note: MDPI stays neutral with regard to jurisdictional claims in published maps and institutional affiliations. |
© 2021 by the authors. Licensee MDPI, Basel, Switzerland. This article is an open access article distributed under the terms and conditions of the Creative Commons Attribution (CC BY) license (https://creativecommons.org/licenses/by/4.0/).
Share and Cite
Khor, J.F.; Ling, L.; Yusop, Z.; Tan, W.L.; Ling, J.L.; Soo, E.Z.X. Impact of El Niño on Oil Palm Yield in Malaysia. Agronomy 2021, 11, 2189. https://doi.org/10.3390/agronomy11112189
Khor JF, Ling L, Yusop Z, Tan WL, Ling JL, Soo EZX. Impact of El Niño on Oil Palm Yield in Malaysia. Agronomy. 2021; 11(11):2189. https://doi.org/10.3390/agronomy11112189
Chicago/Turabian StyleKhor, Jen Feng, Lloyd Ling, Zulkifli Yusop, Wei Lun Tan, Joan Lucille Ling, and Eugene Zhen Xiang Soo. 2021. "Impact of El Niño on Oil Palm Yield in Malaysia" Agronomy 11, no. 11: 2189. https://doi.org/10.3390/agronomy11112189
APA StyleKhor, J. F., Ling, L., Yusop, Z., Tan, W. L., Ling, J. L., & Soo, E. Z. X. (2021). Impact of El Niño on Oil Palm Yield in Malaysia. Agronomy, 11(11), 2189. https://doi.org/10.3390/agronomy11112189