Article

Responses of Soil Cadmium Desorption under Different Saline Environments and Its Controlling Factors

1
College of Water Sciences, Beijing Normal University, Beijing 100875, China
2
Faculty of Architecture Civil and Transportation Engineering, Beijing University of Technology, Beijing 100081, China
*
Author to whom correspondence should be addressed.
Agronomy 2021, 11(11), 2175; https://doi.org/10.3390/agronomy11112175
Submission received: 30 August 2021 / Revised: 20 October 2021 / Accepted: 27 October 2021 / Published: 28 October 2021
(This article belongs to the Special Issue Environmental Ecological Remediation and Farming Sustainability)

Abstract

:
Heavy metal pollution of soil restricts the sustainable use of land and poses risks to human health throughout the world. Changes in the physicochemical properties of soil may increase the mobility of heavy metals in the soil ecosystem and lead to groundwater pollution. In this study, the effects of different salt solutions (NaCl, CaCl2, NaNO3, MgCl2, Na2SO4, and mixed salts) on the release of Cd from soil were investigated by batch desorption tests and the Freundlich isothermal sorption model. Increased concentrations of the salts, except for NaNO3, significantly promoted Cd release (R2 > 0.9, p < 0.01). Under the salt stress, Cd release from the test soils was promoted more by CaCl2 and MgCl2 than by the other salts, and the average desorption rates of eight soil samples at 3.5% salt concentration were 11.15% and 10.80%, respectively, which were much higher than those of NaCl (4.05%), Na2SO4 (0.41%), and NaNO3 (0.33%). Ca2+ and Mg2+ showed better ion exchange capacity than Na+ to promote Cd release; for anions, Cl formed hydrophilic Cd chloride complexes with Cd in soil. In addition, principal component analysis results revealed that Cd release was mainly influenced by soil texture, cation exchange capacity, and iron–manganese oxide content of the soil. The Cd release level for different soil samples was most closely related to the proportion of fine particles in the soil. The higher the clay content was, the higher the Cd desorption rate.

Graphical Abstract

1. Introduction

Heavy metal pollution of soil is an important problem that poses risks to human and environmental health throughout the world. Heavy metals have serious negative effects on soil microorganisms, plant roots, and groundwater and can also negatively affect human activities and health [1,2,3]. Rapid industrial development around the world has led to the release of large amounts of heavy metals from industrial plants into the natural environment, thereby causing various environmental problems [4,5,6]. For example, Cd pollution has caused serious problems around the world [7], and this is particularly severe in China [8,9], where serious Cd contamination affects 0.5% of contaminated land and ~13,300 ha of arable land [10]. The accumulation of Cd in soil needs to be addressed carefully to prevent negative effects on soil ecosystems, plant growth, crop outputs, and human health [11], prolonged exposure Cd can generate kidney disease and anemia or even serious disability by its toxic effect [4,12].
Soil is the basis of plant growth and microbial communities [13]. Surface runoff, leaching, and filtration can cause metals in surface soils to migrate and diffuse downward through soil pores. Heavy metals may chelate [14], form complexes [15], or be adsorbed [16,17] through interactions with organic matter and inorganic colloids in soil. These processes affect the soil and groundwater ecosystem [18]. Moreover, researchers found that toxic inorganic elements such as Cd were desorbed or released if the physical and chemical conditions were changed, for example, by addition of acid or alkali [16,19,20]. In China, most arid and semiarid regions and some heavy industrial cities along the coast, the salt content in the soil has increased significantly due to salinization or seawater intrusion [21,22]. This could provide favorable conditions for the desorption and release of heavy metals from regional soils [23], leading to Cd pollution and posing a detriment to human health. For this reason, research on the release of Cd from soils under salt stress has become increasingly urgent. Additionally, the impacts of soil physicochemical properties, such as soil texture, cation exchange capacity (CEC), and organic matter contents, on Cd migration and release from soil have been investigated and quantified in numerous studies [24,25,26,27]. Most previous studies have focused on assessing interactions between different heavy metals (e.g., competitive sorption of Cd, Cu, Cr, Mn, Ni, Pb, and Zn) using the Freundlich model, Langmuir model, D-R model, and data analysis methods [16,28,29]. They have shown that other metals tend to outcompete Cd for sorption sites when competitive sorption occurs, particularly in soil, in which Cd is markedly more readily desorbed and becomes more mobile than other heavy metals [30,31]. However, these researches without in-depth studies on the desorption of a single heavy metal under different salt conditions and environments.
In this study, we investigated Cd desorption and release in soil in the presence of solutions of NaCl, CaCl2, NaNO3, MgCl2, Na2SO4, and mixed salts with different salt stresses (i.e., different salt types and concentrations). In view of the fact that we are studying common salt types, their effects on soil Cd desorption have relatively extensive reference significance. Moreover, we explored the relationship between soil parameters and cadmium desorption level under salt stress. The results are expected to be a useful reference for managing and controlling Cd pollution in soil, especially for the ecological safety in coastal areas or salinized areas.

2. Materials and Methods

2.1. Soil Sampling and Testing

Soil samples were collected in the later spring of 2020 in Northern China (Long. 106°36′5′′–106°36′17′′ E, Lat. 41°17′4′′–41°17′16′′ N), where is less precipitation in this area, facing severe salinization challenge. We collected soil samples from the surface soil layer (0–30 cm deep) to monitor the level of cadmium content in this area, chose eight sites with large differences in physical and chemical parameters, and labeled them (S1–S8).
Various physicochemical properties of the soil samples were determined. The pH and Eh were determined using composite electrodes (HI8424, HANNA, Woonsocket, RI, USA). The electrical conductivity (EC) was measured using a conductivity meter (using a 1:5 soil:extractant ratio, CD-5021A, As One, Osaka, Japan). The organic matter content of the soil (SOM) was determined using the potassium dichromate oxidation method. The iron-manganese oxide content of the soil (SIO) was determined using the ammonium oxalate extraction method. The cation exchange capacity (CEC) was determined using the ammonium acetate exchange method. The soil particle size distribution was determined using a laser particle size meter (Mastersizer 3000E, Malvern Panalytical, Malvern, UK). The specific surface area was determined using a Brunauer-Emmett-Teller surface area system (3H-2000PS2, Beishide Instrument Technology, Beijing, China). The results are shown in Table 1.
To ensure accuracy and quality, the glassware used in the experiments was soaked in 2 mol/L HNO3 for more than 24 h. The water used in the analysis was ultrapure water, and the heavy metal content was determined using GSS-12 as the quality control sample. The reagents used in the test were AR (analytical reagent) grade, the acid used was GR (guaranteed reagent), all samples were tested with three parallel experiments, and a reagent blank test was also set up. The recovery efficiencies of the analyzed metals varied between 95.7% and 99.3%, meeting the measurement requirements.

2.2. Batch Desorption Tests

Batch desorption tests were performed to assess Cd release from the soil samples. The solid-to-liquid ratio used in the tests was 1:5. Then, a 5 g aliquot of soil and 25 mL of salt solution (each salt at different concentrations, separately) were added to a centrifuge tube. The tube was shaken at 200 rpm for 24 h at room temperature to ensure that the contents were mixed well and that the soil and salt solution had reacted thoroughly. The tube was then centrifuged at 7000 rpm for 30 min (TDL-5-A, Anke, Shenzhen, China), and the supernatant was passed through a 0.45 µm filter membrane.
The Cd concentration in the solution was then determined using a SPECTRO ARCOS inductively coupled plasma atomic emission spectroscopy instrument (SPECTRO Analytical Instruments, Kleve, Germany). One-component salt solutions were prepared at five concentrations (0.5%, 1%, 2%, 3%, and 3.5%). The mixed salt solution simulating seawater was prepared by dissolving 24 g of NaCl, 4.20 g of MgCl2·6H2O, 1.362 g of CaCl2·2H2O, and 3 g of Na2SO4 in 500 mL of distilled water and then diluting the mixed salt solution to give solutions with concentrations equal to those of the salts used in the tests described above. Three parallel samples and one blank sample were used as controls in each experiment to assess the accuracy of the results. The amount of Cd released was calculated using the equations:
q e = 1000 C e V m
r = C e V m C × 100 %
And:
Q e = C ( 1 r )
where qe is the amount of desorption per unit mass of soil (µg/kg), V is the volume of salt solution (mL), Ce is the Cd concentration at adsorption equilibrium (µg/mL), m is the soil mass (g), r is the Cd desorption rate, Qe is the amount of adsorption that occurred, and C is the heavy metal content (mg/kg).
The soil–solution distribution coefficients Kd (L/g) for the different test samples were calculated as follows:
K d = q e C e
Different amounts of Cd were released in response to different degrees of salt stress, so the Freundlich adsorption isotherm model was used to explore the kinetics and mechanism of Cd desorption from soil. The equations used and the model parameters were previously published by Zhao et al. [30].

2.3. Statistical Analyses

Statistical analyses of the soil parameters and Cd concentrations were performed using Excel 2016. Origin 2018 (OriginLab Corporation, Northampton, MA, USA) was used to visualize the data. SPSS 19.0 (SPSS Inc., Chicago, IL, USA) was used to perform principal component analysis (PCA) to analyze the changes in Cd release rates at different degrees of salt stress and explore the relationships between the Cd release rates, salt types and concentrations, and physicochemical properties of the soil.

3. Results

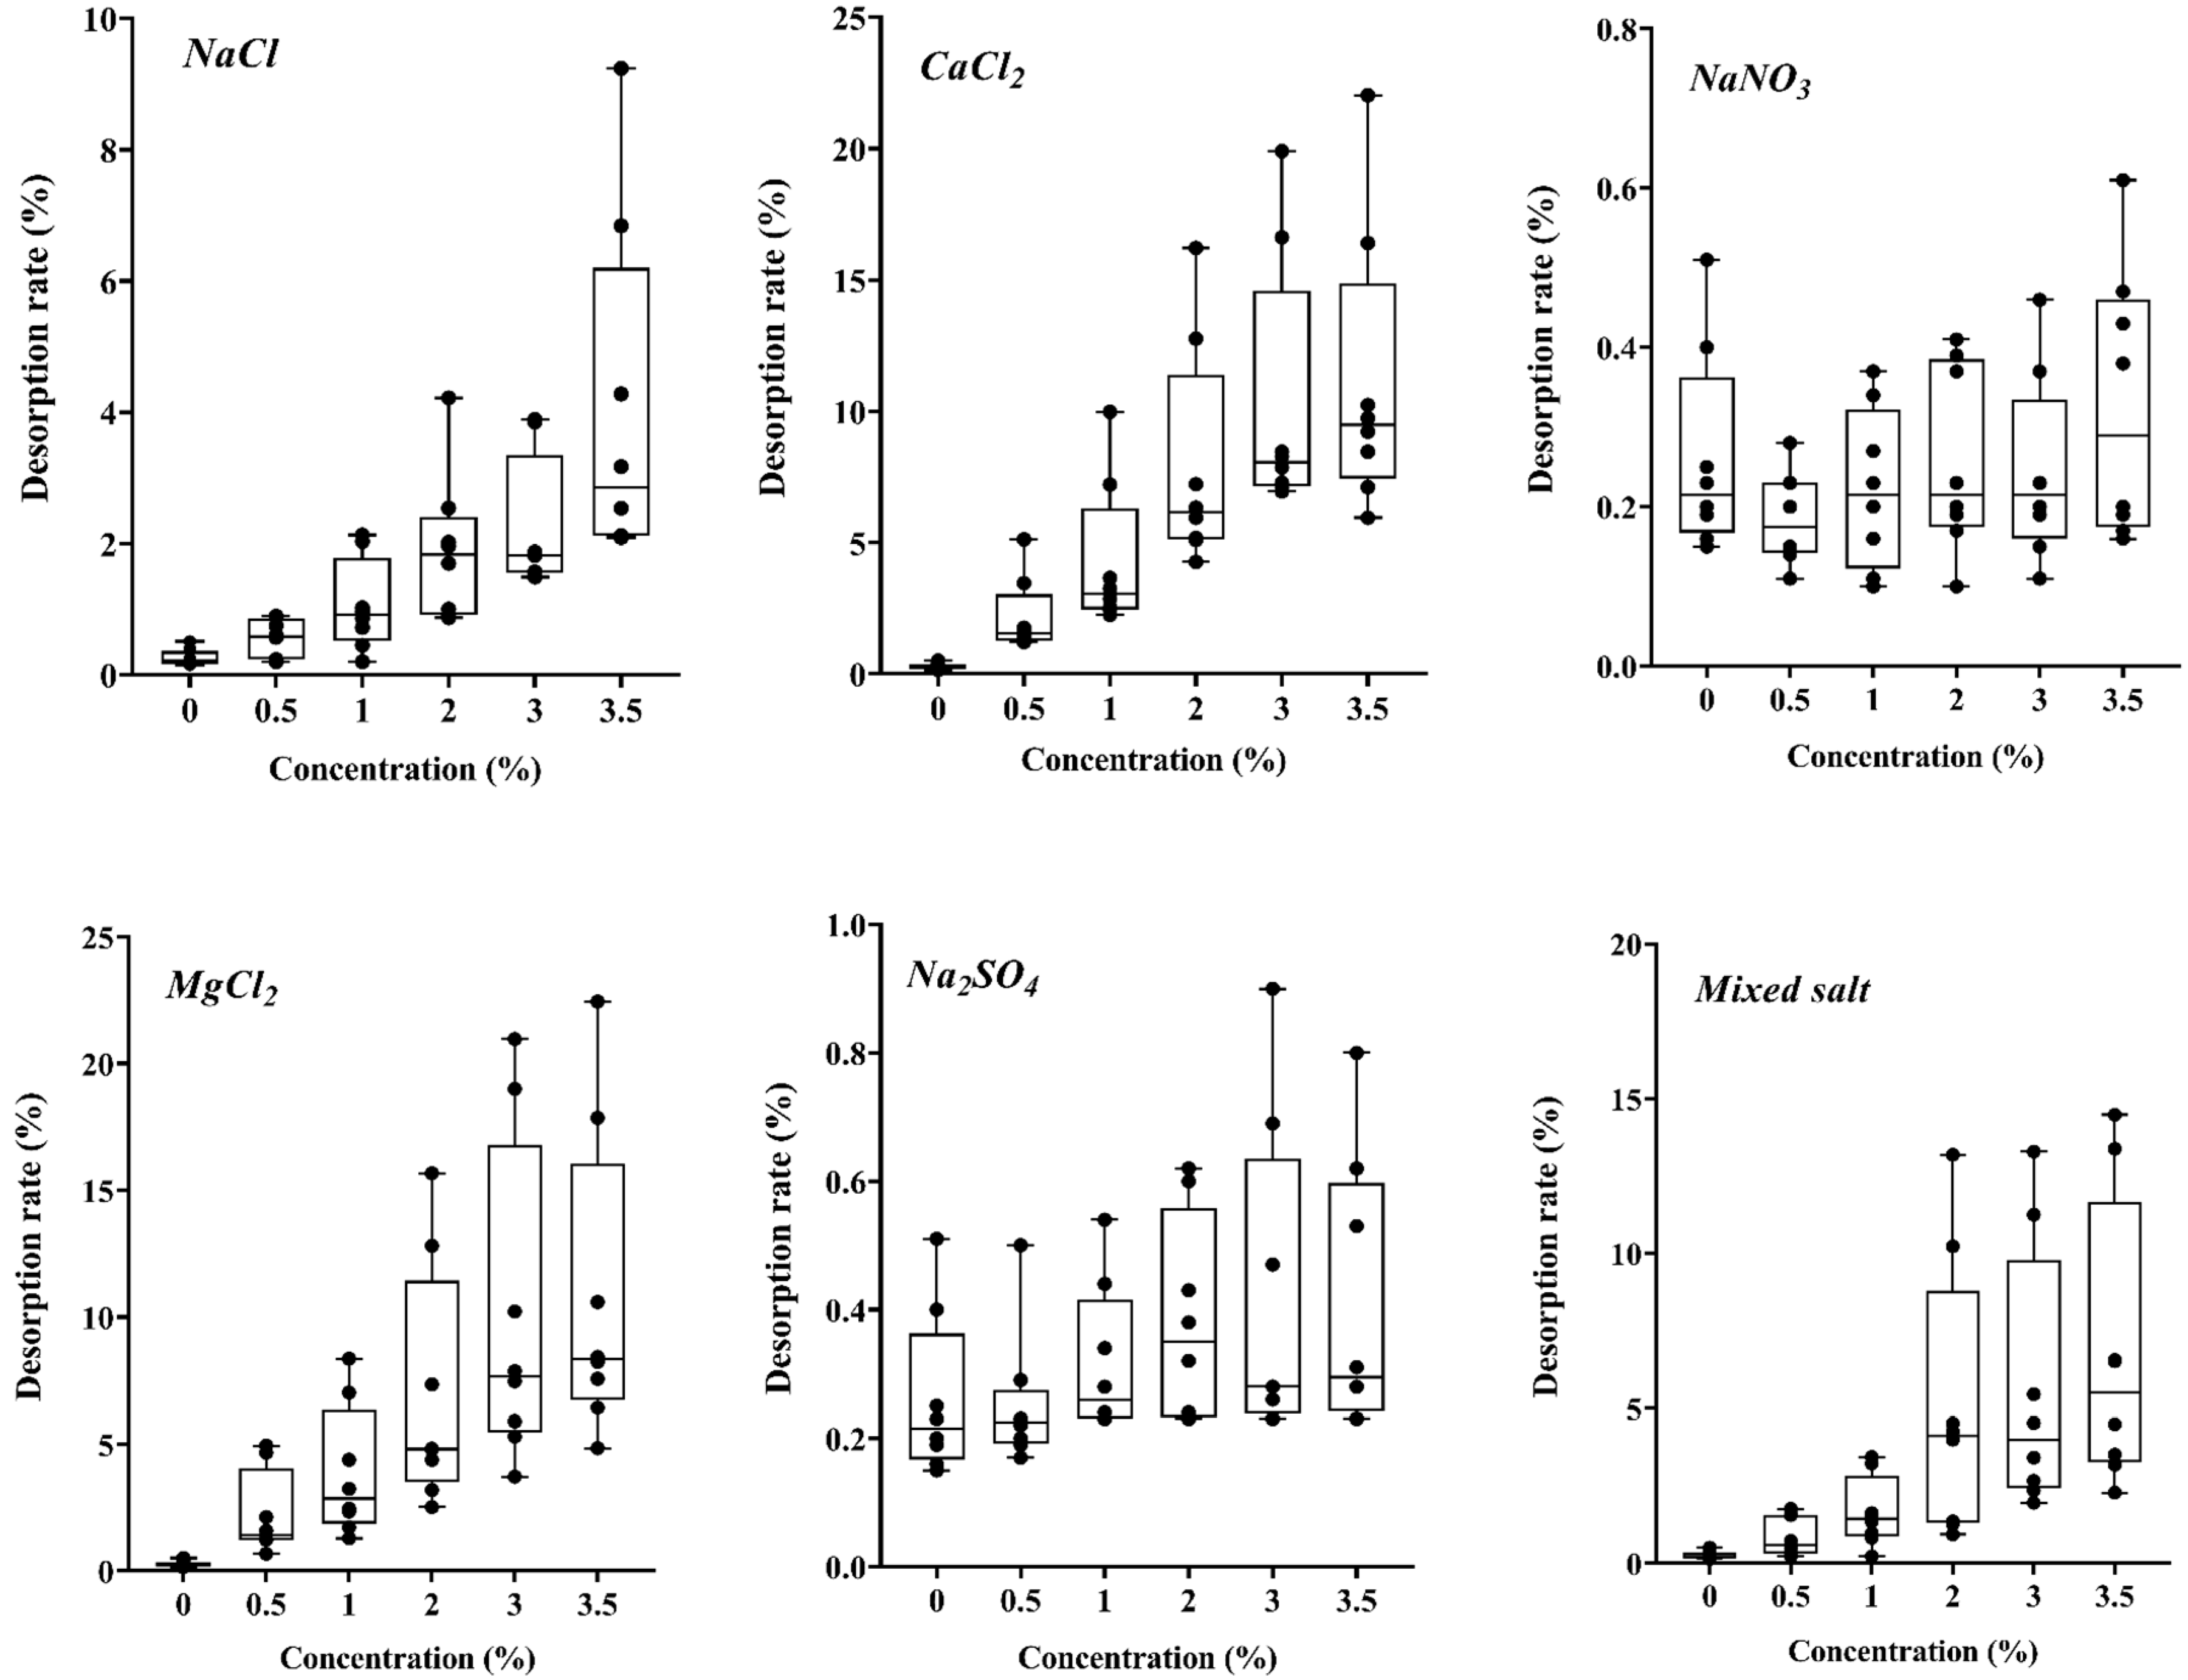
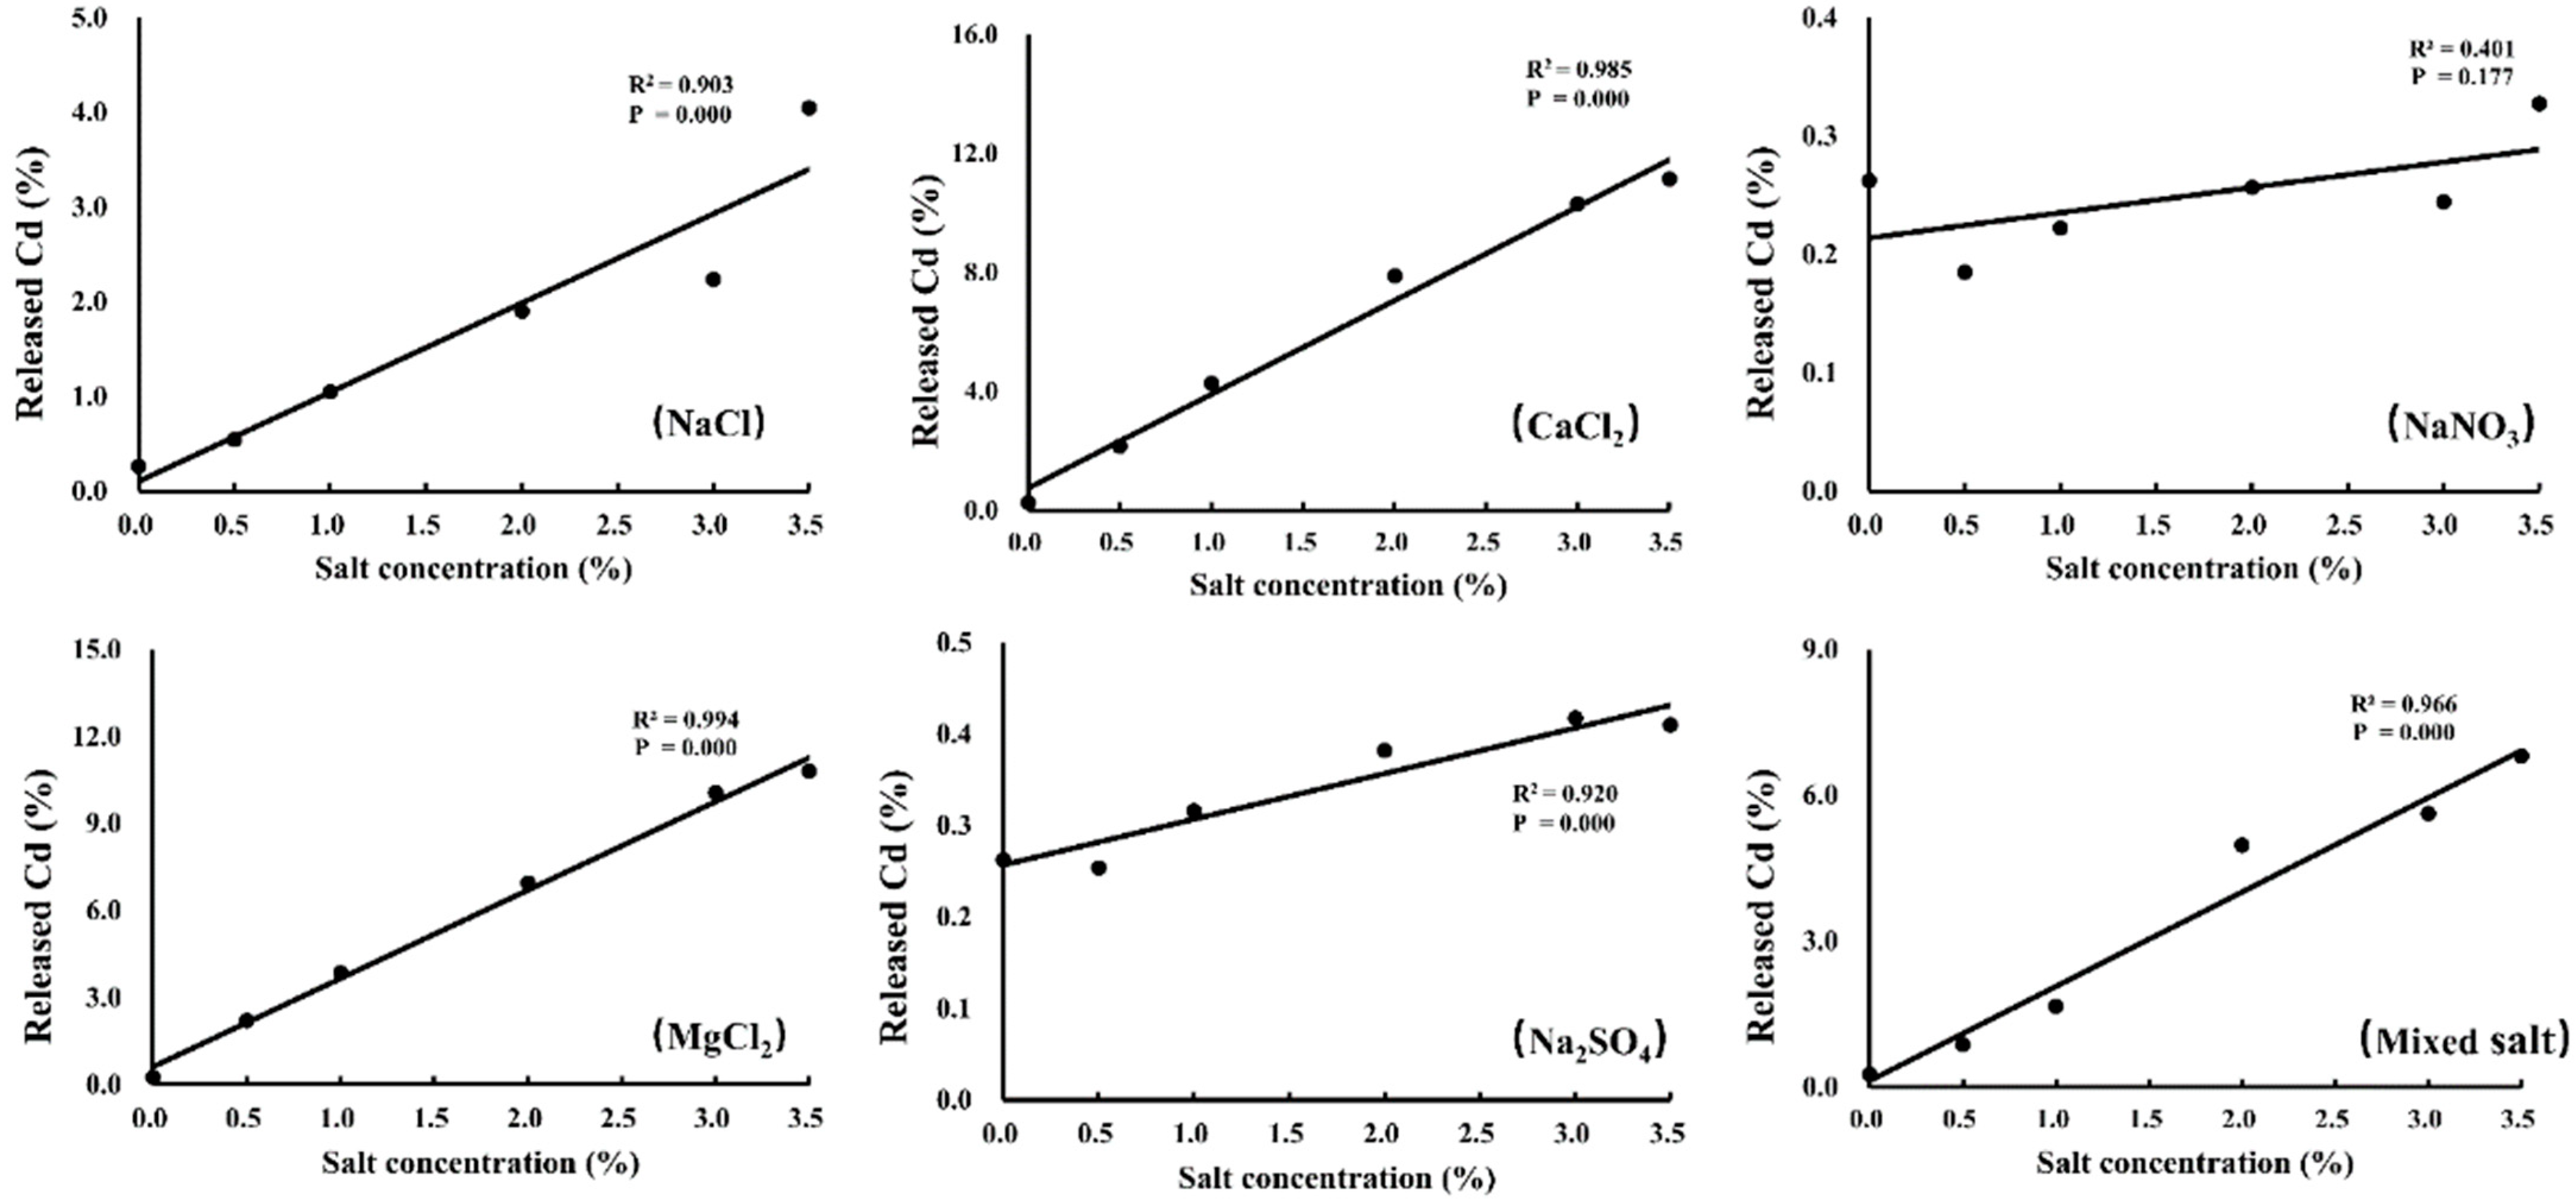
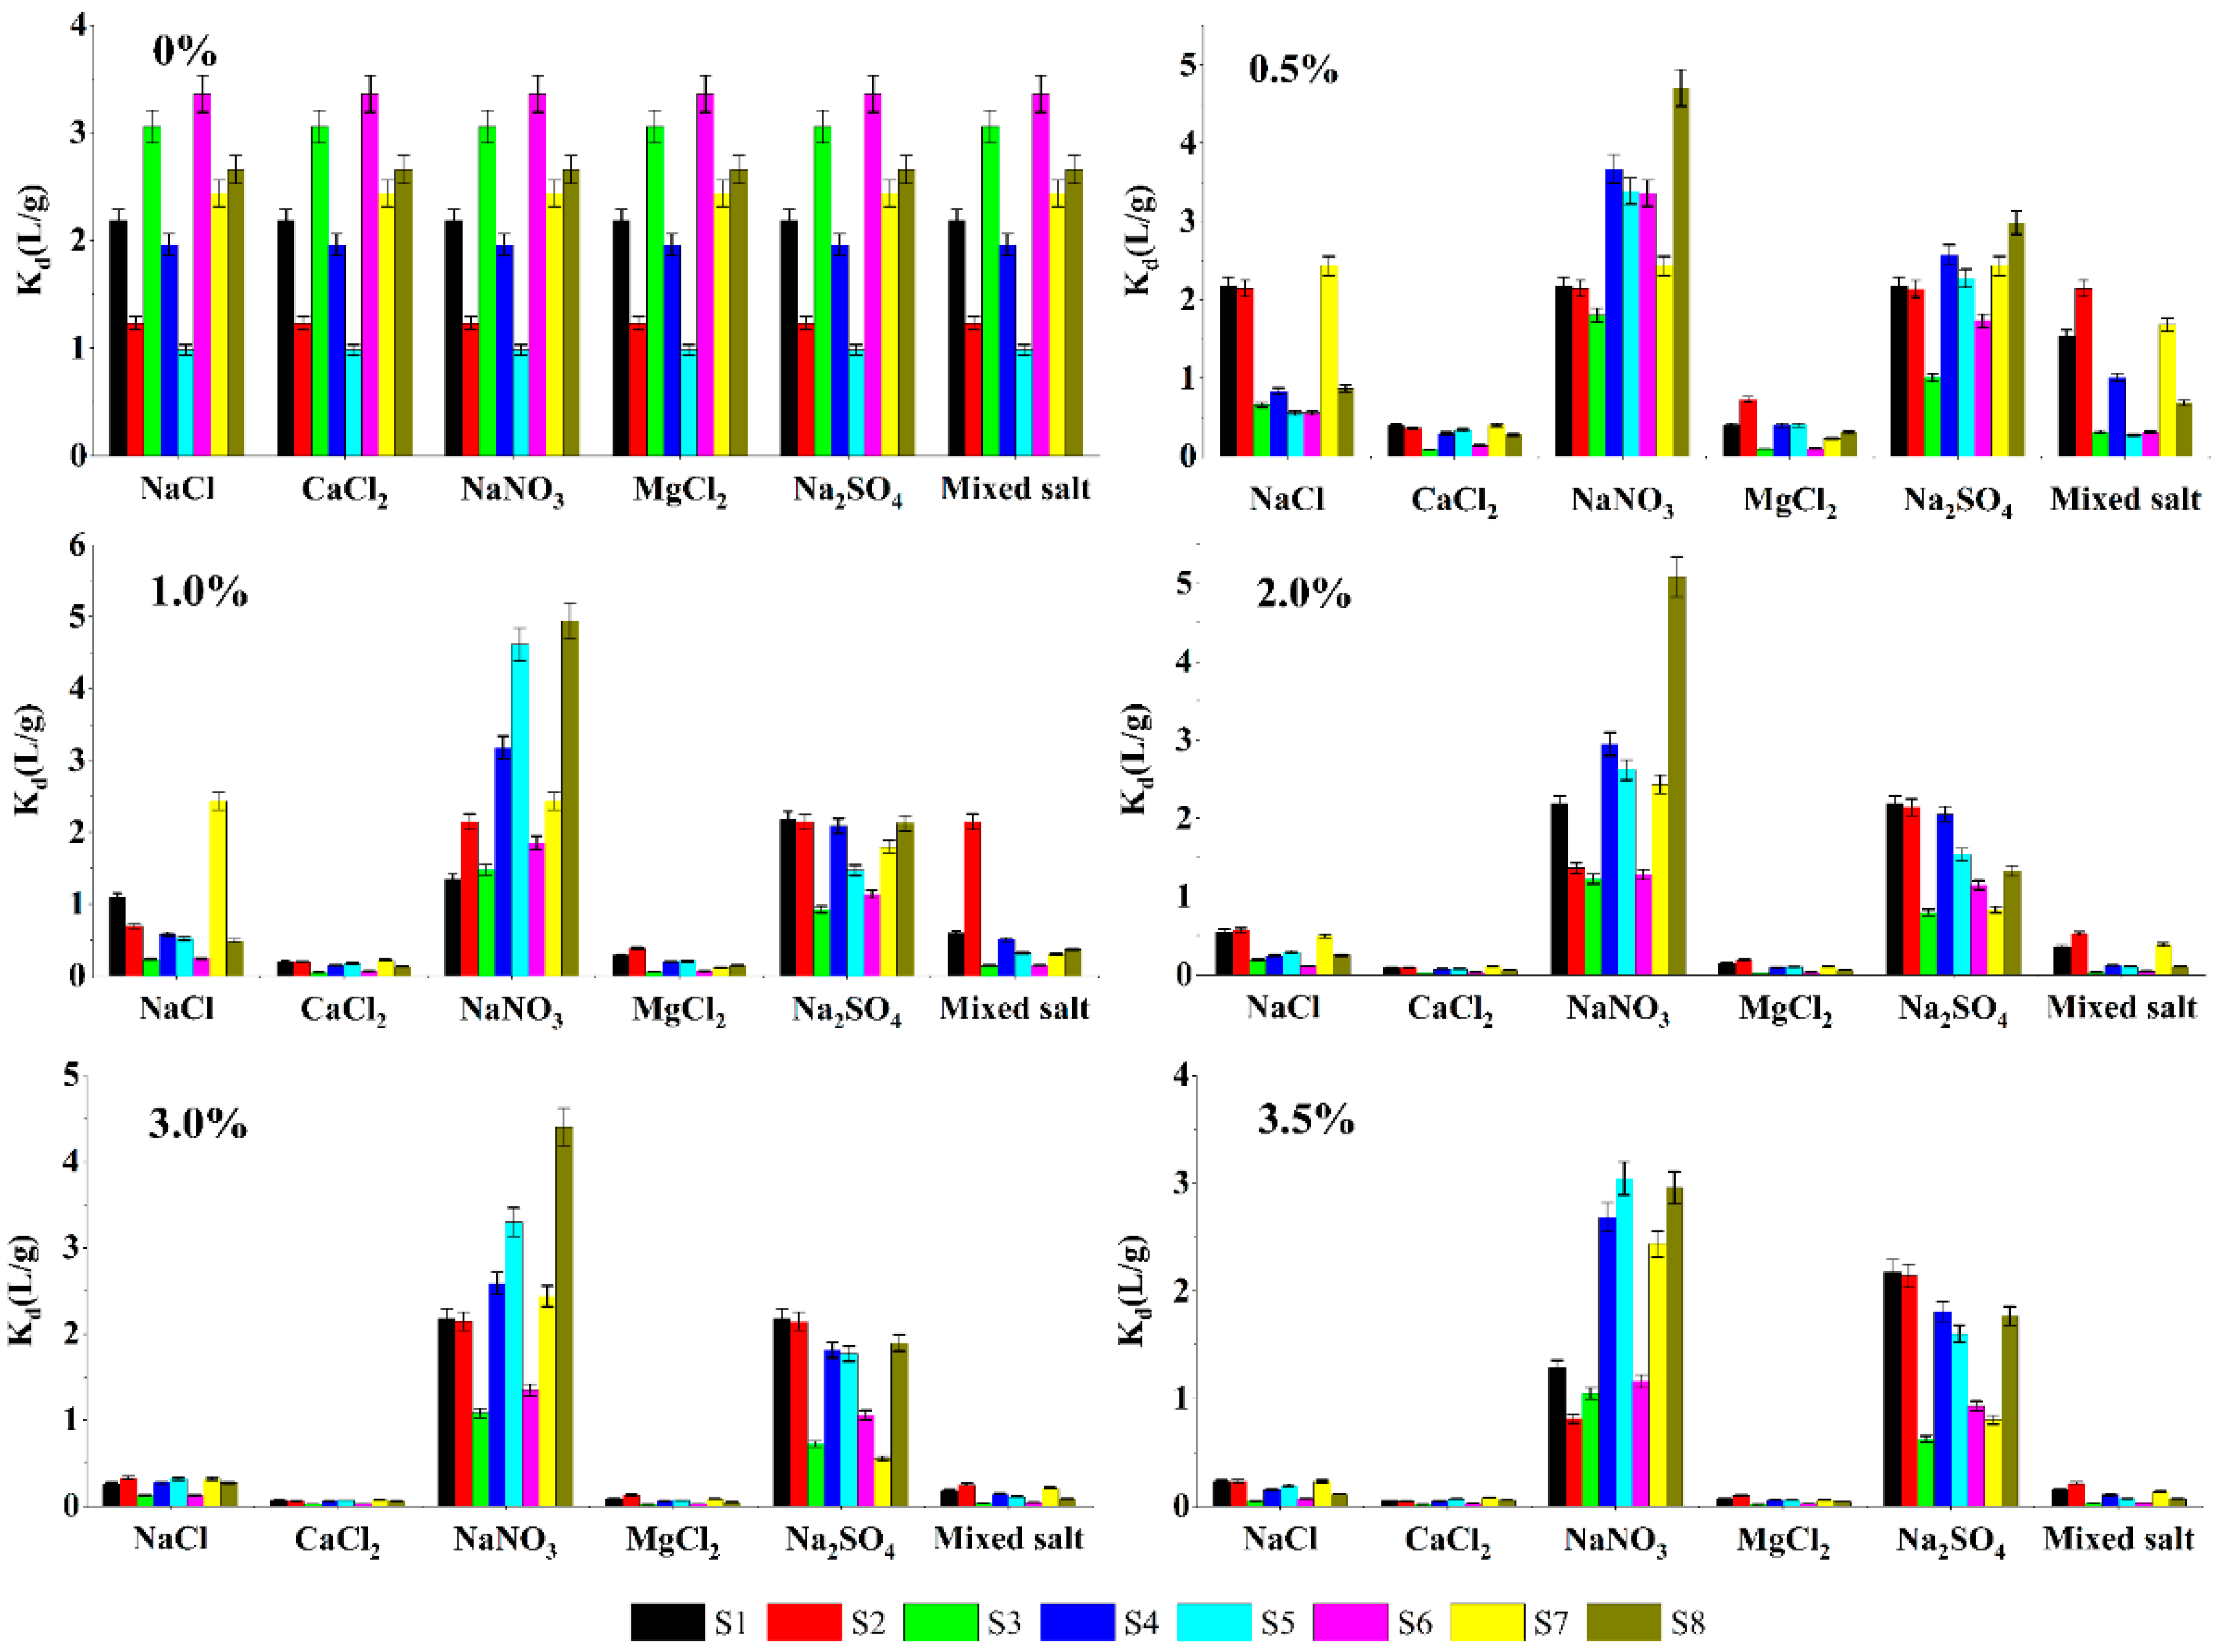
3.1. Effects of Different Salts on Cd Release

The NaCl, CaCl2, MgCl2, and mixed salt solutions, but not the NaNO3 and Na2SO4 solutions, strongly affected the release of Cd from the soil, as shown in Figure 1.
The desorption rates of all samples under different concentrations of salt stress were calculated. For all the soil samples, the desorption rates corresponding to each salt concentration gradient were 0.26% (0%), 1.04% (0.5%), 1.89% (1%), 3.72% (2%), 4.81% (3%), and 5.59% (3.5%). However, different soil samples had different sensitivities to salt stress. Taking MgCl2 as an example, the highest Cd desorption rate at a salt concentration of 0.5% for the eight soil samples was 4.95%, and the lowest was 0.68%. At a salt concentration of 3.5%, the highest and lowest Cd desorption rates were 22.45% and 4.84%, respectively. The average desorption rates at salt concentrations of 0%, 0.5%, 1%, 2%, 3%, and 3.5% were 0.36%, 4.27%, 7.06%, 13.14%, 17.25%, and 17.61%, respectively. The differences between the maximum and minimum release for the soil samples increased as the salt concentrations increased. The calculation result showed the mean of cadmium release rate under the stress of Na2SO4 solution was higher than that of NaNO3. In general, high salt stress showed a positive effect on soil release, which was especially confirmed for CaCl2, NaCl, and the mixed salt solutions for all soil samples but this was not the case for NaNO3. The Cd release level fluctuated irregularly as the concentration of NaNO3 increased, and the desorption rates for all soil samples at different salt concentrations were relatively similar. As for NaCl, CaCl2, and MgCl2, the desorption intensity of soil Cd increased almost linearly with the increase of concentration, especially for NaCl. However, when the concentration exceeded 3%, the variance of desorption rate of different soil samples almost remained unchanged or even decreased for CaCl2 and MgCl2 solutions.
Furthermore, according to our preliminary soil particle size test results and the U.S. Department of Agriculture (USDA) soil texture classification standards, S1, S3, S6, and S7 are silty loams; S2, S4, and S5 are loams; and S8 is sandy loam. After systematic calculation, differences were identified among these soil samples. The average desorption rate was calculated for each soil texture type, and we further analyzed the effects of different salt stresses at different concentrations on Cd release, as shown in Figure 2.
Remarkable differences were found among the Cd release levels for the different salts. CaCl2 and MgCl2 caused the release of more Cd from the soil samples than the other salts. For example, Figure 2 shows that at the same salt concentration, the Cd desorption rate was much higher for CaCl2 and MgCl2 than for the other salts. At salt concentrations of 0.5%, CaCl2 and MgCl2 gave mean Cd desorption rates of 2.16% and 2.22%, respectively, the mixed salt solution led to a mean desorption rate of 0.87%, and NaNO3 and Na2SO4 exhibited mean desorption rates of only 0.18% and 0.25%, respectively. At salt concentrations of 3.5%, CaCl2, MgCl2, and the mixed salts gave mean release rates of 11.15%, 10.80%, and 6.80%, respectively, and NaNO3 and Na2SO4 gave much lower release rates of 0.33% and 0.41%, respectively. For soils with different textures, Cd desorption levels varied for different salt solutions, and even for CaCl2 and MgCl2, the gap still remained. For loam, CaCl2 promoted desorption of more Cd than over MgCl2 did, but for sandy loam, the impacts of these two salts were reversed. However, for silty loam or the average behavior of all samples, the two salts behaved very similarly, and the capacity to facilitate the release of cadmium from soils was followed by the mixed salts and NaCl.
The effects of salt stress on Cd release from soil (neglecting differences between the soil samples) were investigated further by identifying correlations between the Cd release rates and salt concentrations, as shown in Figure 3. Significant positive correlations (R2 > 0.9, p < 0.01) were found between the Cd desorption rates and the concentrations of the salts, except NaNO3, indicating that for salts other than NaNO3, salt stress strongly affected Cd release. For CaCl2 and MgCl2, the mean Cd release rates increased dramatically from 2.16% and 2.22% at 0.0% salt concentration to 11.15% and 10.80% at 3.5% salt concentration, respectively.

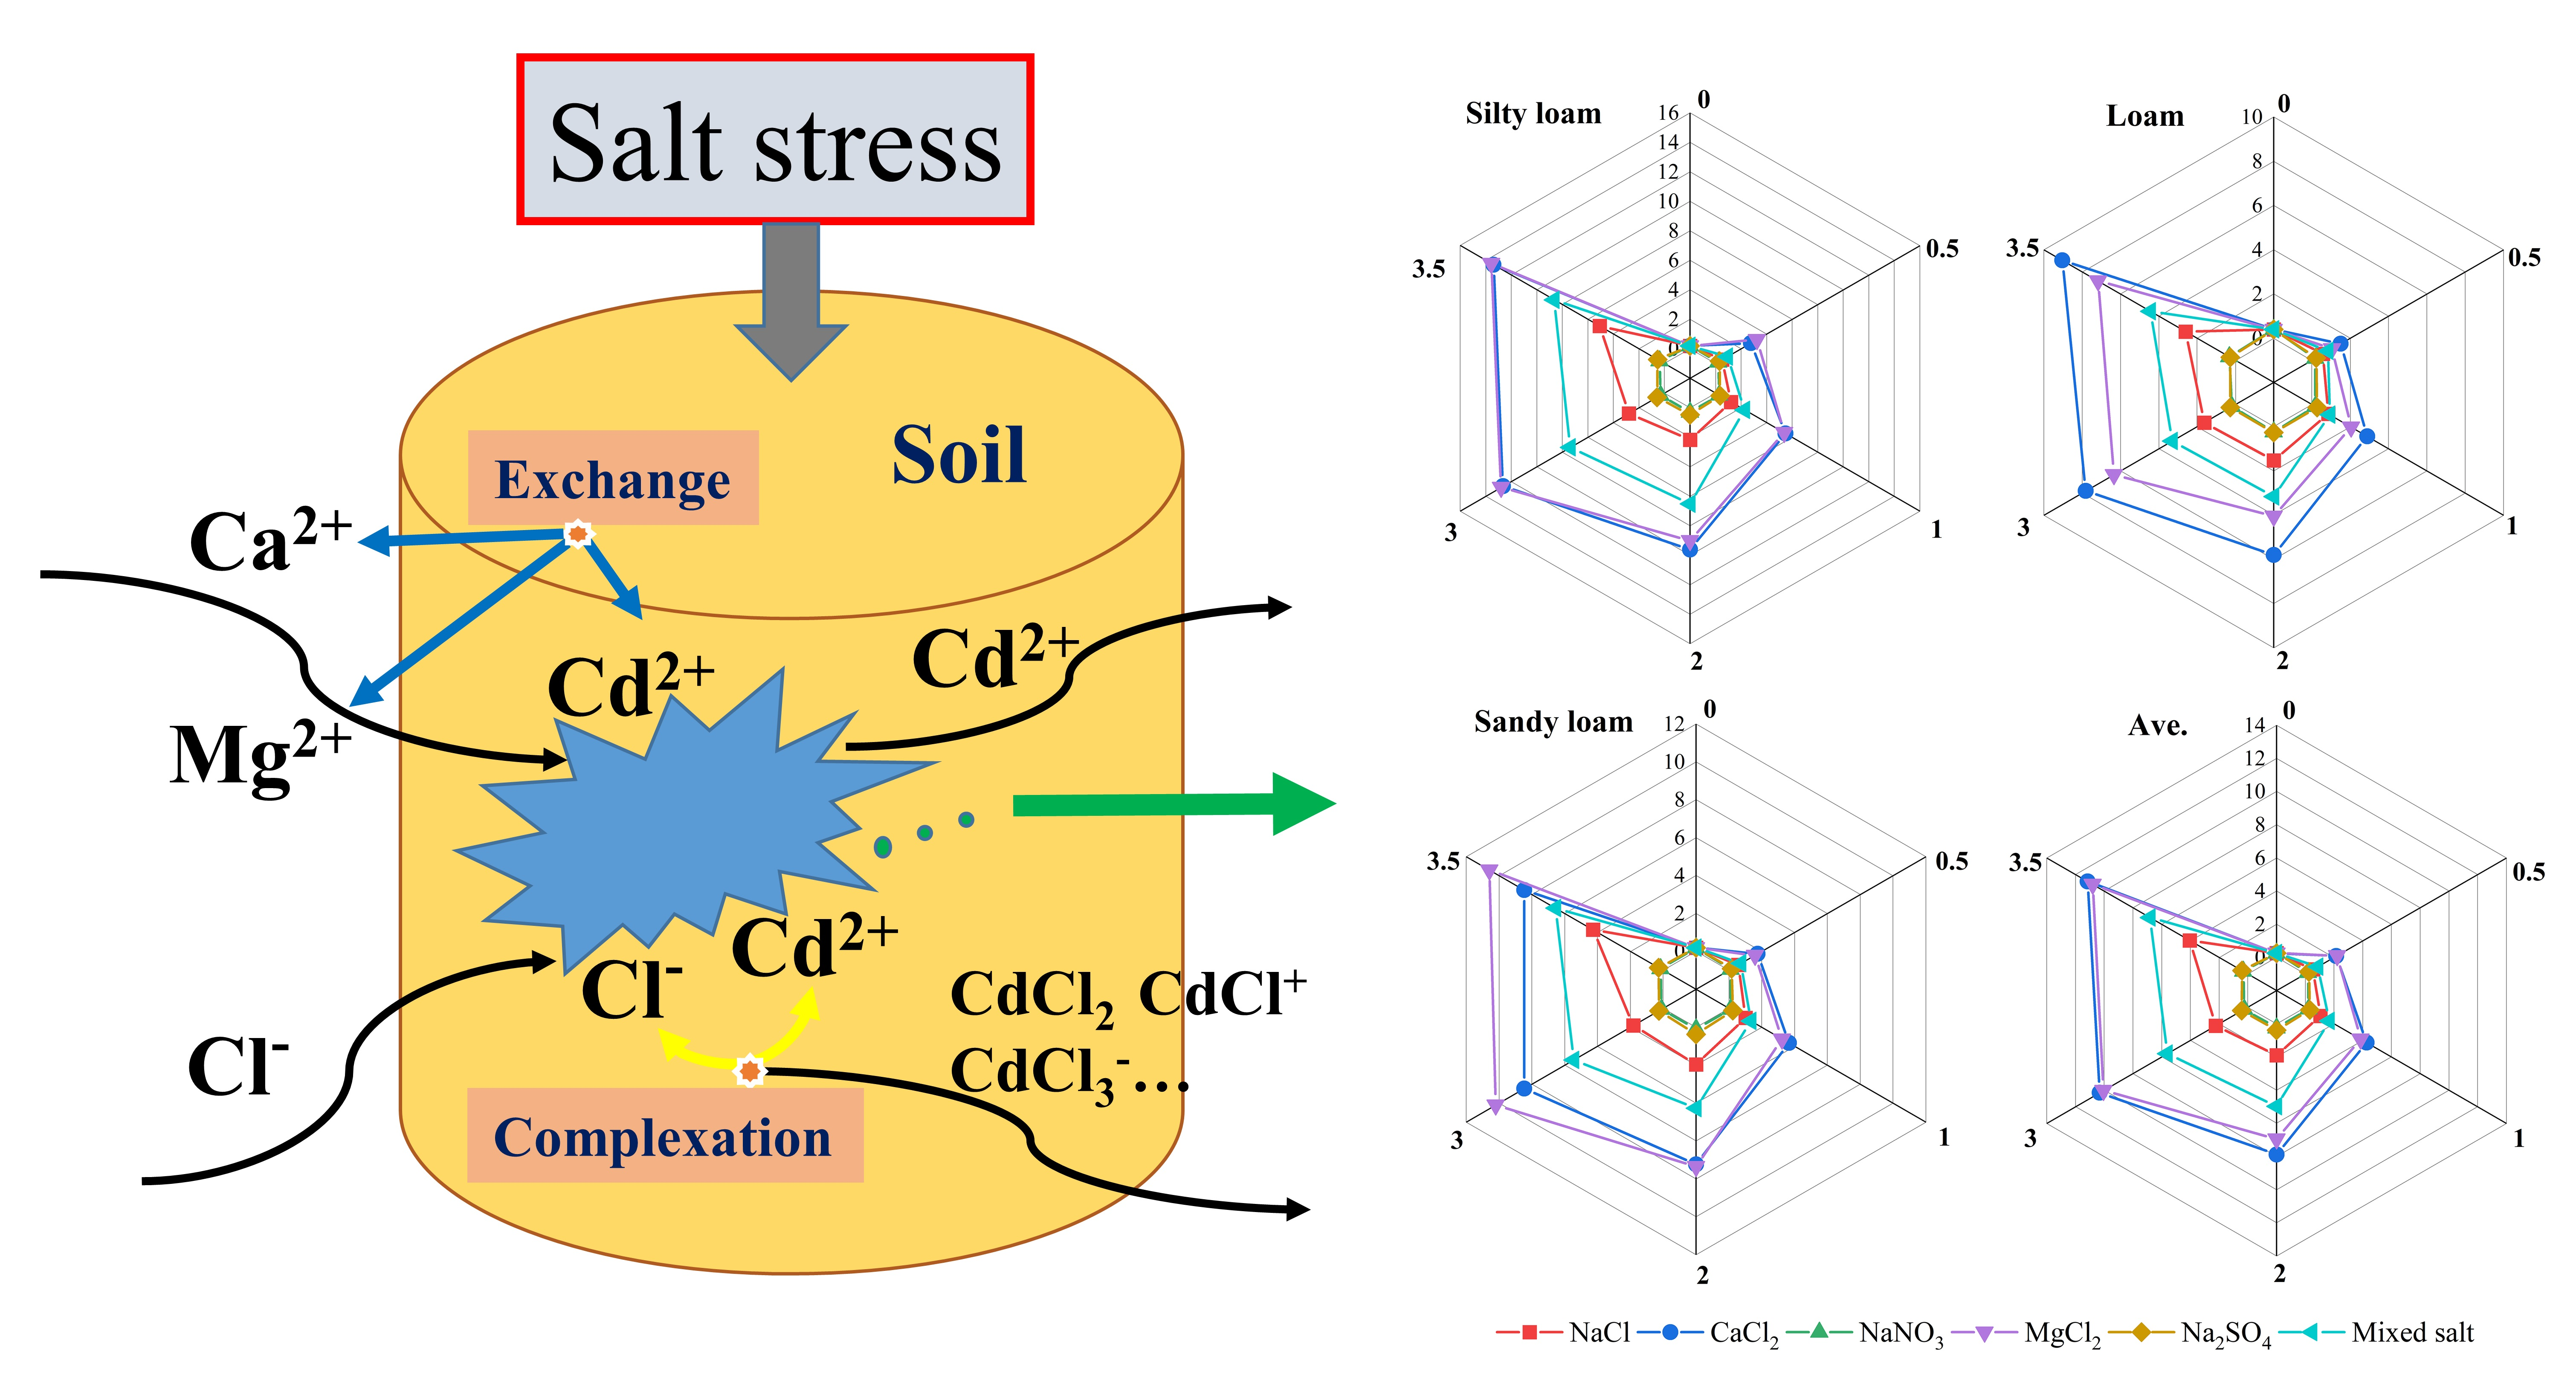
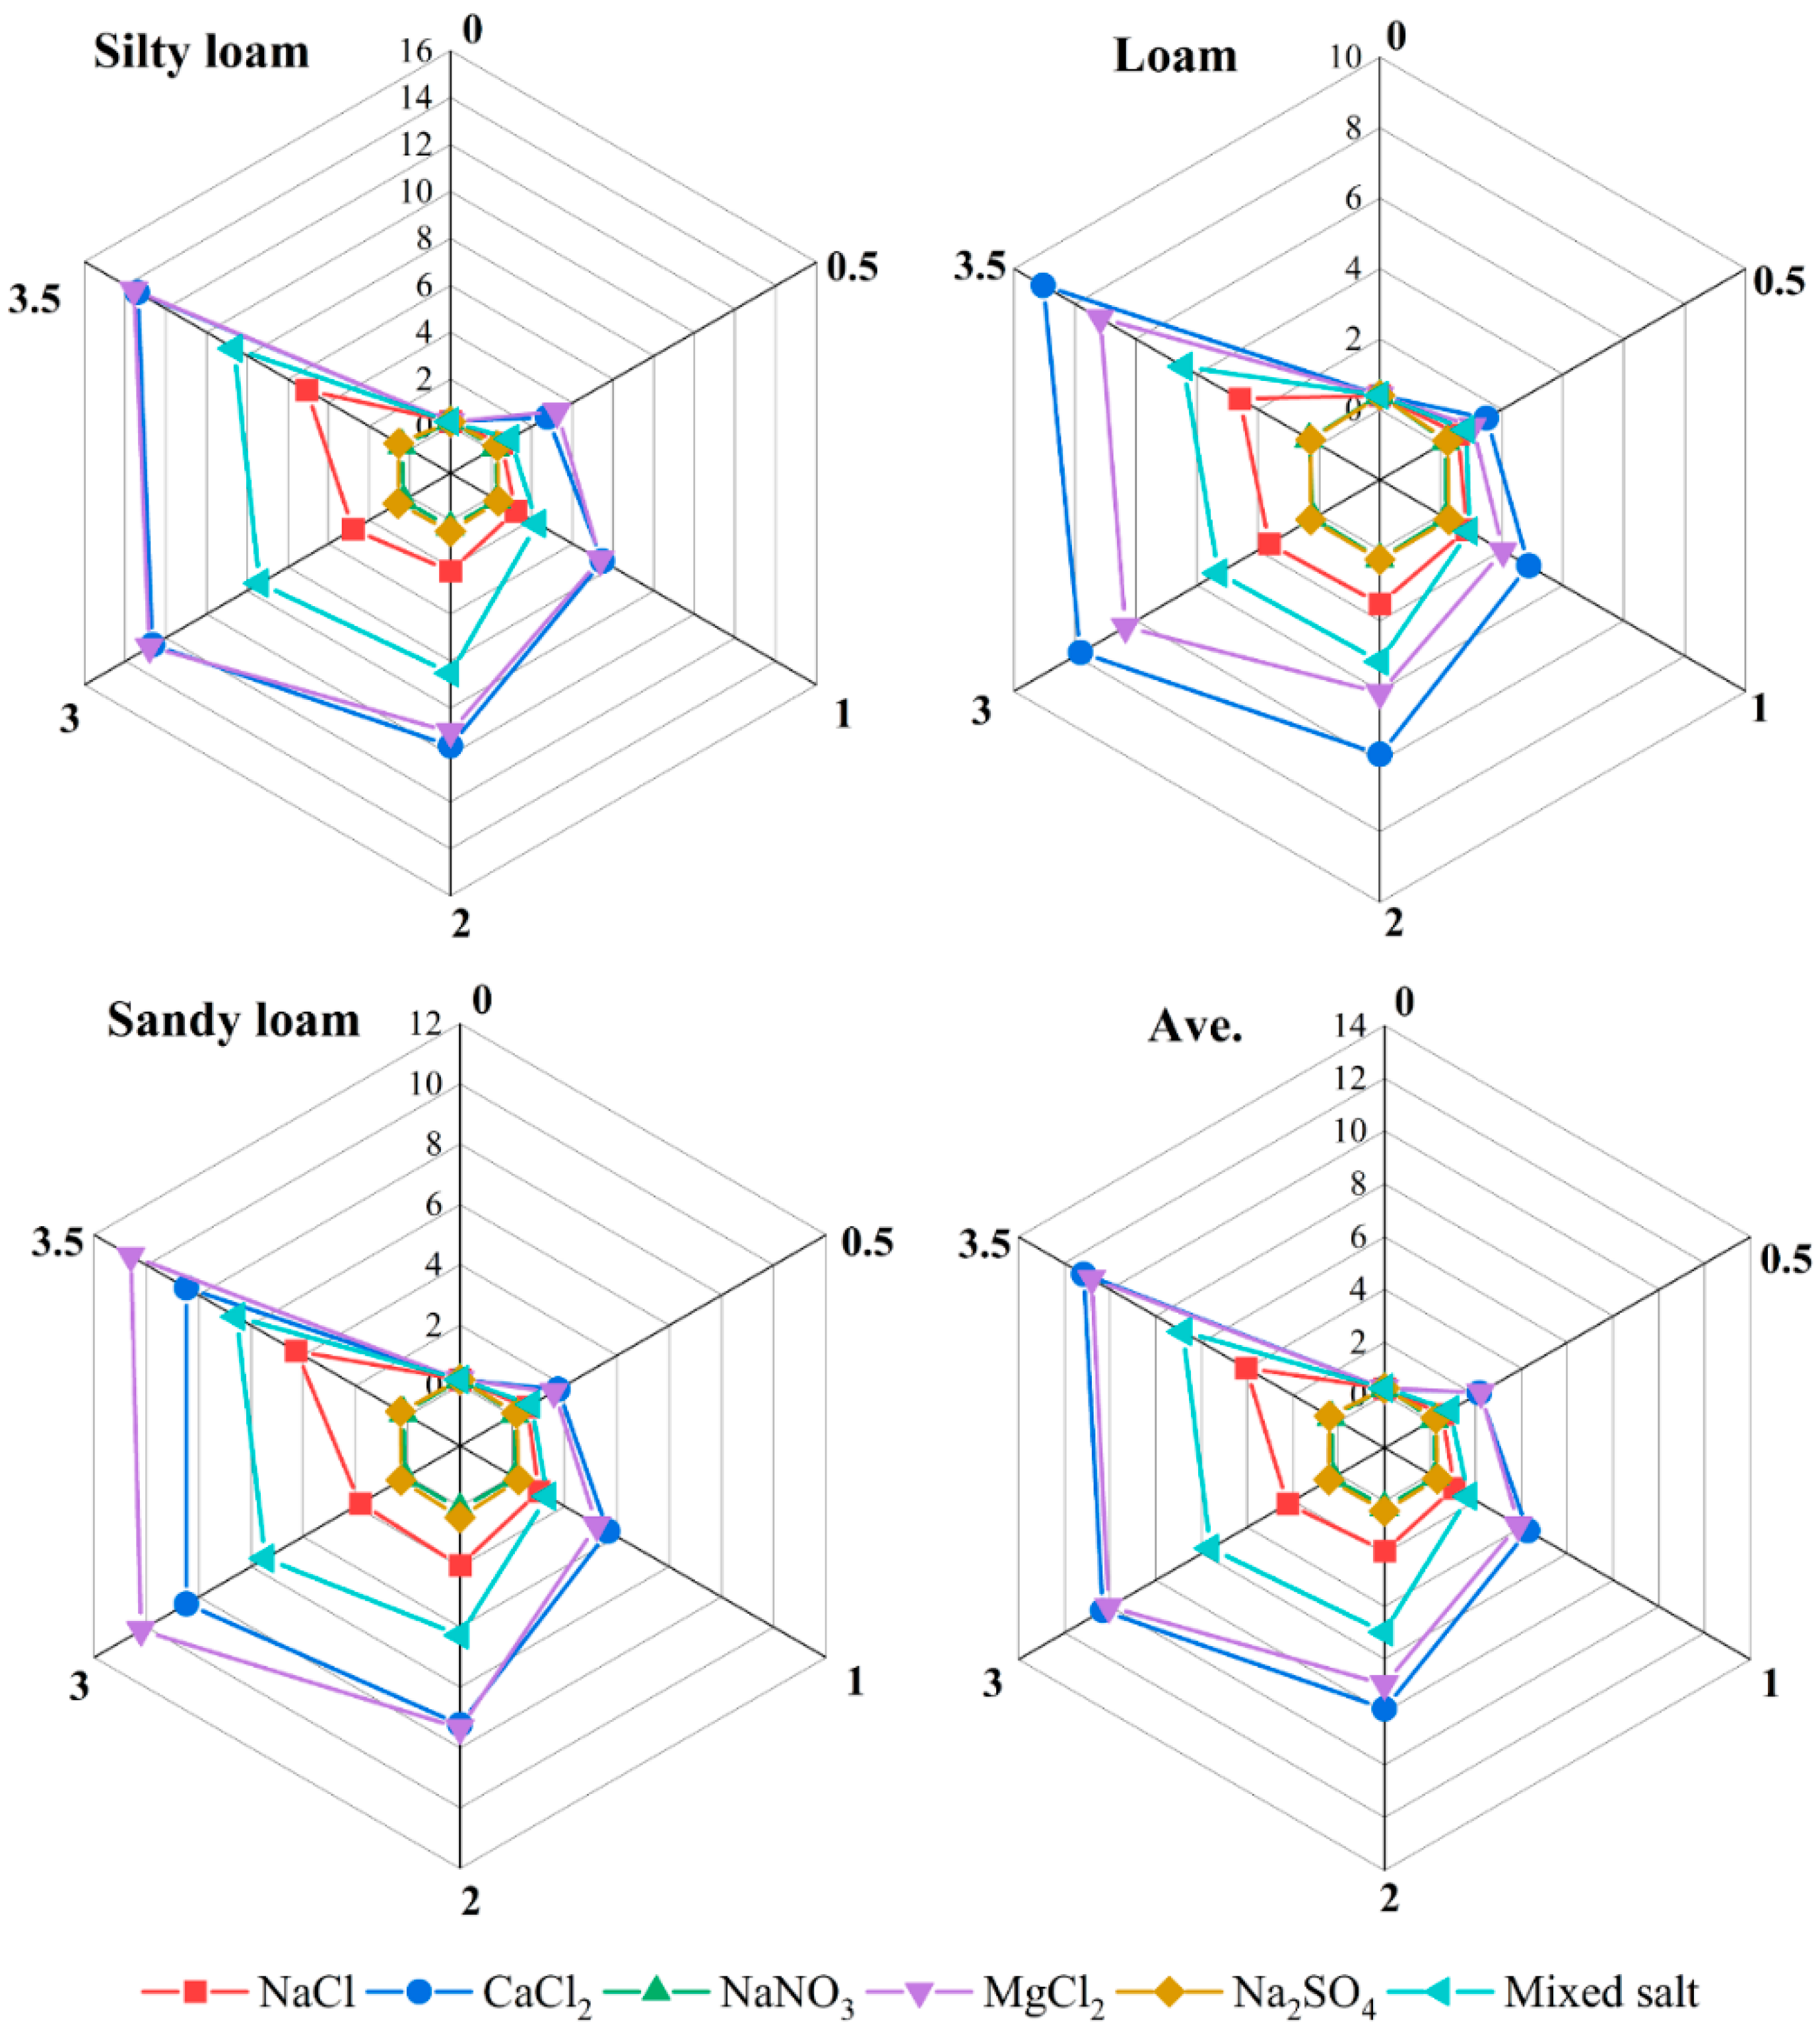
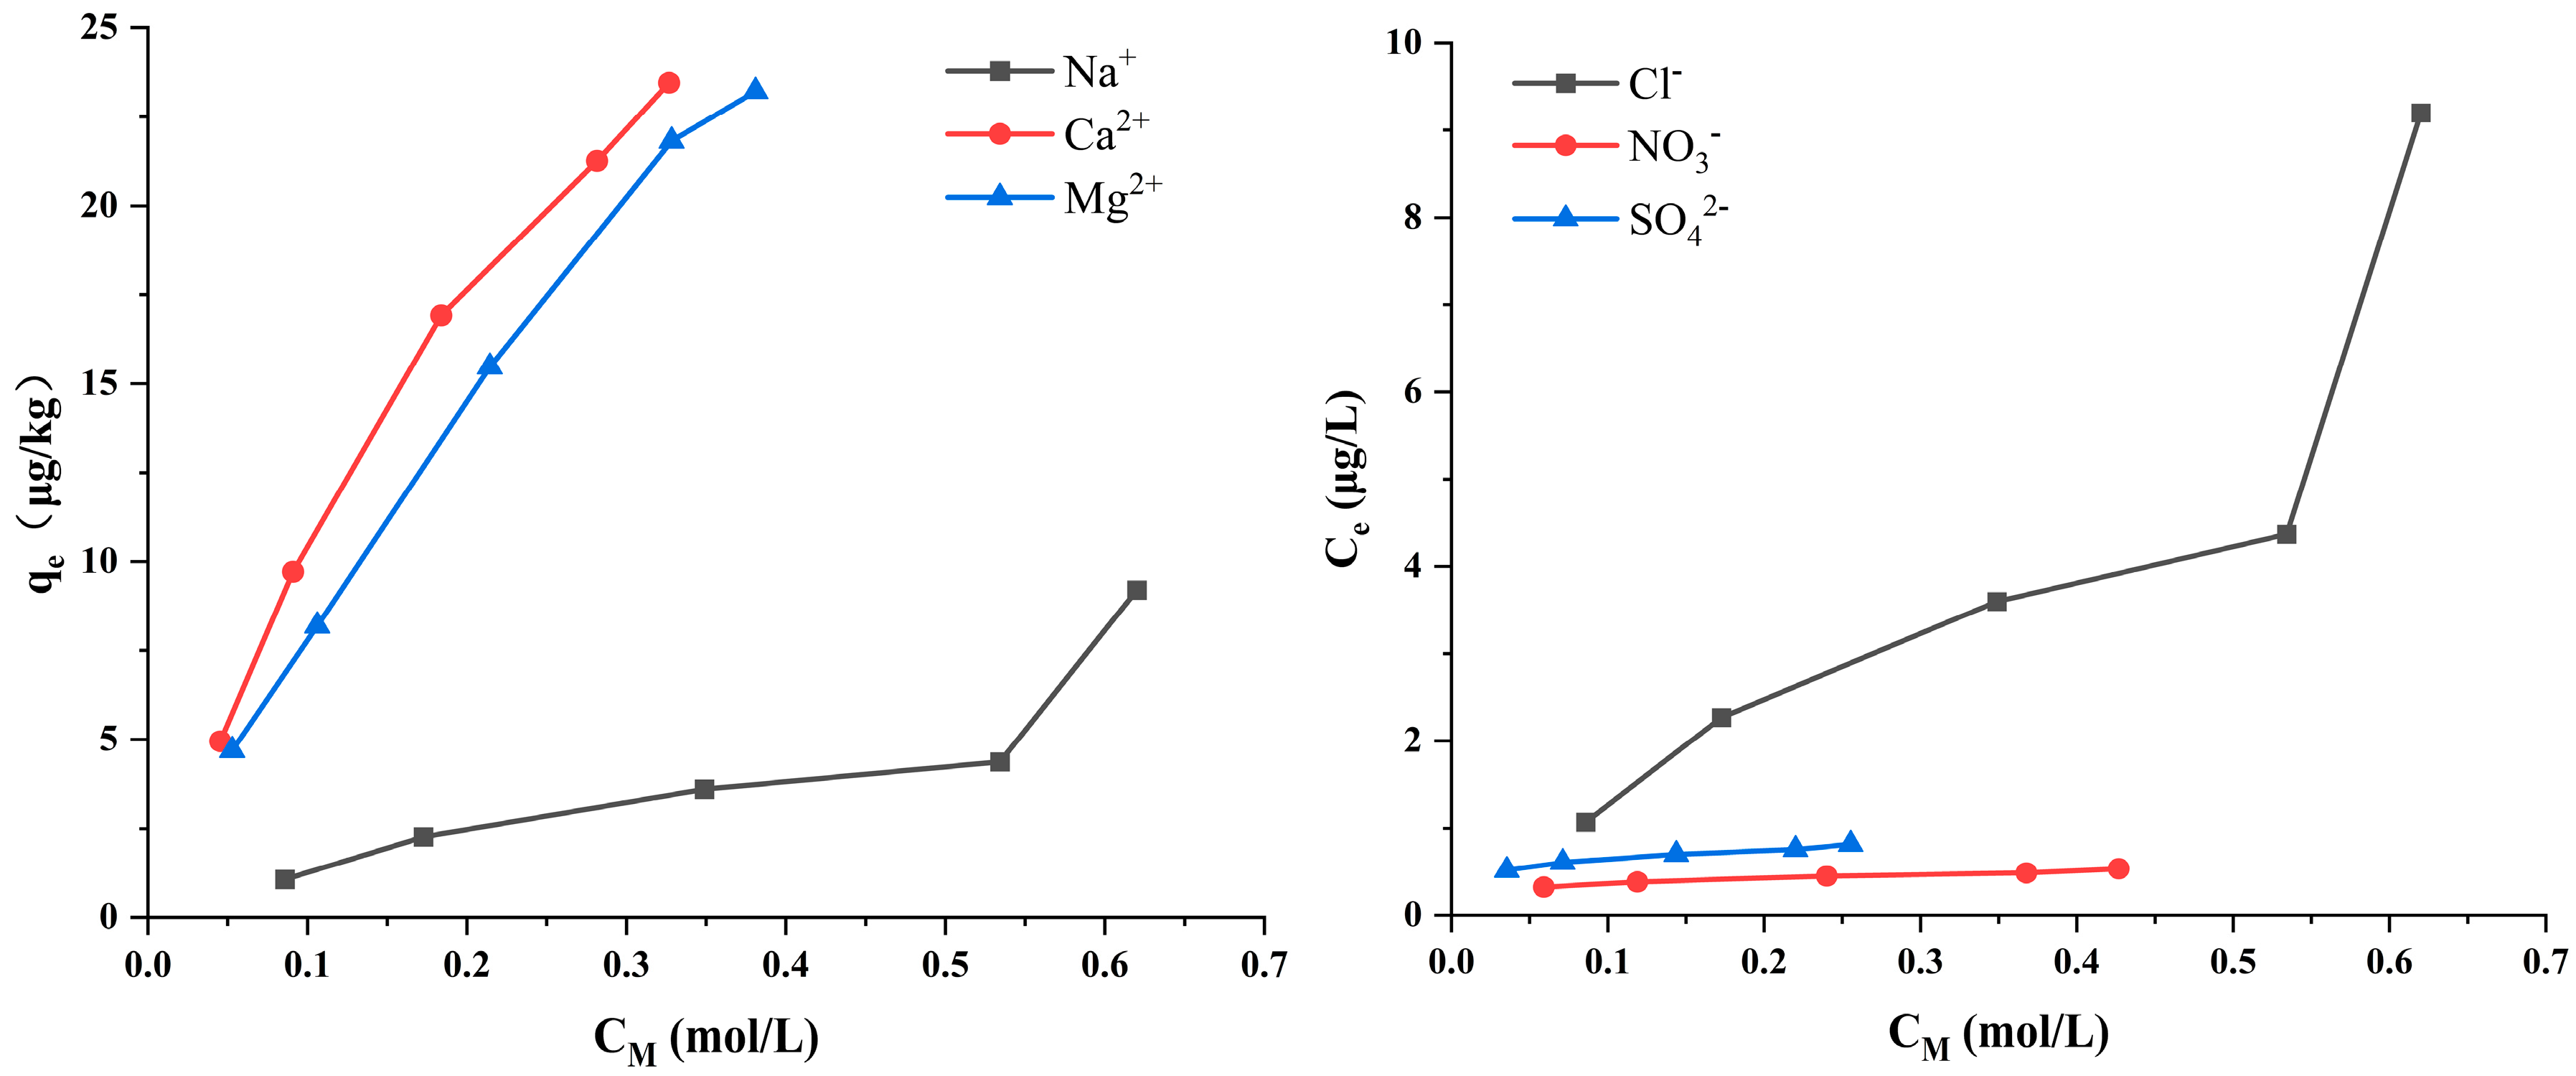
3.2. Effects of Cations and Anions on Cd Release

According to the calculated results, the amounts of Cd released from soil samples were 0.50–5.09 µg/kg at all NaNO3 concentrations, and the desorption rates were 0.10–0.61%. However, the amounts of Cd released at all NaCl concentrations were 0.5–228 µg/kg, and the release rates were 0.15–9.24%. With the same Na+ concentration, more Cd was released by chloride solution than by nitrate solution.
In exploring the effects of salt types on soil cadmium release, we further investigated the effects of ions on soil cadmium release by converting the NaCl, CaCl2, NaNO3, MgCl2, and Na2SO4 mass concentrations (Cm) into molar concentrations (CM). The effects of different molar concentrations of anions and cations on Cd release are shown in Figure 4.
The highest average Cd release levels for all samples were 4.05%, 11.15%, and 10.80% for NaCl, CaCl2, and MgCl2, respectively. This indicated that Cd was more effectively released by Ca2+ and Mg2+ than Na+. The trend lines shown in Figure 4 indicate that the Cd extraction efficiency decreased in the order Ca2+ > Mg2+ > Na+. The maximum Cd desorption rates for NaNO3 and Na2SO4 were only 0.61% and 0.90%, respectively, much smaller than the maximum Cd desorption rate (9.24%) for NaCl. Cd was leached more effectively by Cl than NO3 and SO42−, as shown in Figure 4. The Cd release rate decreased in the order Cl > SO42− > NO3. The results described above showed that Cd release was promoted more effectively by Cl, Ca2+, and Mg2+ than by the other ions.

3.3. Simulation of the Sorption Parameters under Salt Stress

According to the results, NaNO3 caused the release of less Cd than the other salts, and Na2SO4 released the second smallest amount of Cd (Figure 5).
The Kd values were smaller for CaCl2 and MgCl2 than for the other salts. The Kd values for NaCl and the mixed salts were also small for each soil sample, but NaNO3 and Na2SO4 maintained large Kd values, and the differences were significant, which showed that the types of salt had different influences on soil desorption of Cd. The salt concentrations also affected the Kd values. The Kd value increased as the NaCl concentration decreased. Taking sample S7 as an example, Cd desorption with NaCl concentrations of 0.5%, 2%, 3%, and 3.5% gave Kd values of 2.43, 0.49, 0.32, and 0.23 L/g, respectively. The mixed salt at low concentrations caused relatively little Cd release. For example, Kd was 2.15 L/g at a mixed salt concentration of 0.5% but 0.21 L/g at 3.5% for sample S2. As the salt concentration increased, the Kd values decreased.
The adsorption isotherm model is often applied to describe the relationship between salt concentration and the amount of adsorption when the model reaches equilibrium. There are three main common isotherm adsorption models, namely, the Langmuir, Freundlich, and DR isotherm models. After our trials, the goodness of fit for the Freundlich isotherm was higher than those of the other two models. The fitting equation is as follows:
l g q e = l g K f + 1 n l g C e
where qe is the amount of desorption per unit mass of soil (µg/kg), Ce is the Cd concentration at adsorption equilibrium (µg/mL), and Kf and n are the sorption parameters.
The Kf and n parameters and R2 (coefficient of determination) for the Freundlich isothermal sorption model are shown in Table 2. Absorption-desorption can occur when 1 < n < 10 [32], so we concluded that the six salt solutions we used effectively promoted the migration and transformation of Cd in soil samples. With all the correlation coefficients R2 > 0.7, the Cd release data for the different salinities were fitted well by the model.

3.4. Relationships between Soil Properties and Cd Release

The soil properties considered included pH, soil texture, EC, TOC, CEC, SIO, and the desorption rates caused by salt stresses were treated as variables. Principal components with eigenvalues >1.0 were selected. PCA results are presented in Table 3.
We found that the amount of Cd released was correlated with the fine particle size distribution and SIO. The smaller soil particles were, the higher the SIO values, and higher Brunauer–Emmett–Teller surface areas also caused more Cd to desorb from the soil because more contact between the soil and leaching agent caused better exchange of Cd with the solution, thereby leading to a higher Cd desorption rate. The first factor (PCA1) accounted for >40% of the variation in the data, and the cumulative variance for each salt condition explained by the chosen principal components was >85%. The principal components we chose, therefore, represented the variables well.
The Cd release levels under the stresses of CaCl2 and NaNO3 were greatly impacted by particle size distribution, CEC, and SIO (PCA1). Moreover, Cd desorption rates with MgCl2 and mixed salt were influenced by particle size distribution, CEC, SIO, and TOC content (PCA1), indicating that some of the main factors controlling the amount of Cd released were changed by salt stress. According to the specific Cd release caused by different salt types and concentrations and our analysis, the soil particle size distribution, SIO, TOC content, and CEC were the main factors influencing the amount of Cd released. The SIO and salt concentration were positively correlated with the Cd desorption rate, but electrical conductivity, clay content, CEC, and TOC content were negatively correlated with it. According to the PCA results, the Cd release intensity was proportional to the content of fine particles and SIO content in the soil and inversely proportional to the TOC and CEC values. The background Cd value in soil, the soil surface area (indicated by the Brunauer-Emmett-Teller surface areas in the tables), and other variables were mostly in the third and fourth principal components, indicating that these variables had relatively little influence on the Cd release rates and were far less influential than the soil particle size distribution and SIO.

4. Discussion

4.1. Effects of Different Degrees of Salt Stress on Cd Desorption

(1) Salt type and concentration
Numerous studies have shown that salt stress strongly affects Cd migration and transformation in soil [25,30,33]. The data from batch desorption tests indicated that the level of Cd release increased with increasing concentrations of each salt except for NaNO3. Similar results were also found in the study performed by Acosta et al. [25] and Raiesi et al. [34], who found that at high salinities, Cd release rates were much higher.
Moreover, Cd desorption from soil was related not only to the salt concentration but also to the salt type (Figure 1 and Figure 2). We compared the effects of five common salts. The amount of Cd desorbed was clearly increased more by CaCl2 and MgCl2 than by the other salts (Figure 2), but the mixed salts and NaCl also strongly promoted the release of Cd. According to Covelo et al., high and low values of Kd mean an important proportion of metal retained by the solid or liquid phase, respectively [35]. The Kd values were generally smaller for CaCl2, MgCl2 and the mixed salt (Figure 5), larger for NaCl, and the largest for NaNO3. By comparing the Kd values for the same salts at different concentrations, we recognized that the increasing salt concentration facilitated the release of Cd. The adsorption capacity of the soil for Cd decreased as salt stress increased, and Cd was more readily released from the soil by the CaCl2 and MgCl2 solutions than by other salt solutions.
(2) Competitive adsorption
Before the addition of salt, Cd exists in the form of complexes and chelates in soils. Behbahani et al. considered that heavy metals were related to the ion attraction to the particle’s surface, which brought induced repulsive forces that prevented coagulation [36]. Cd has a stronger mobility than other heavy metals [35,37], it is still difficult for migrating efficiently under the condition of stable soil environment. Ion exchange between the soil and salt solution (providing Ca2+, Na+, Mg2+, Cl, SO42−, and NO3) was the dominant mechanism involved in the desorption of Cd. Due to their highly similar ionic radii, chemical behaviors and identical charges, Ca2+ and Cd2+ ions can be exchanged under special circumstances [38]; in the case of increasing salinity, they will exhibit competitive adsorption at sites in soil aggregates [35]. Due to the differences in functional groups and electronic structures, Ca2+ and Mg2+ would be more likely to cause Cd release from soil [32,39]. As Trakal et al. [26] found, Ca2+ and Mg2+ had huge advantages over Na+ and Cd ions in terms of competitive adsorption, so both CaCl2 and MgCl2 effectively caused strong competitive adsorption at appropriate sorption sites on soil, thereby stripping Cd ions from the sites [40]. Ca2+, Mg2+ and Na+ influenced soil Cd desorption to different degrees [33]. Cl can cause Cd ion release by forming CdCl+, CdCl2, CdCl3, and CdCl42− [30,38]. Larger amounts of these Cd compounds would form as the Cl concentration increased, thereby naturally stimulating the mobility of Cd [41]. These hydrophilic Cd chloride complexes diffuse into the solution more efficiently under salt stress. NO3 and SO42− have difficulty forming complexes with Cd2+ [42].
Salt stress not only enhanced the solubility and mobility of Cd [43], but also improved the toxicity and availability of this trace element [34], thereby allowing it to accumulate in organisms through biological chains and amplifying hazards [42].

4.2. Roles of Soil Properties in the Desorption Process

According to previous studies, organic matter, metal (hydr) oxides, soil particle fractionation, the specific surface area of the soil, and soil salinity strongly affect heavy metal sorption and desorption [15,17,44]. Cd2+ sorption and retention are strongly affected by the texture, pH, CEC, and EC of the soil [27,45,46]. Cerqueira et al. [47] reported that soil properties, such as the pH, CEC, SIO, and total clay content greatly influence Cd sorption and desorption. Du et al. [40] found that iron-manganese oxides are the main carriers of Cd and other heavy metals in soil, and our study also found a close relationship between iron-manganese oxides and Cd desorption. Ye et al. [19] proposed that competitive adsorption occurs when soil parameters change in the soil environment. Generally, a high CEC means that soil has a good capacity to maintain fertility [48] because the soil contains large amounts of bioavailable K+, Na+, Ca2+, Mg2+, H+, and other ions. Soil with a high CEC may contain Cd as solid complexes [49], meaning that other ions in a solution would not readily compete with Cd for sorption sites or successfully cause Cd release from the soil system. Imoto and Yasutaka [50] found that CEC was positively related to the Cd sorption level of soil. In agreement with this, we found that the CEC content was inversely proportional to the amount of Cd released from soil.
Table 3 reveals the proportions of clay and sand are proportional to the level of Cd released by the soil, and sand exhibits a negative correlation. Similar results were found in a study performed by Zong et al. [45], who found that heavy metals such as Cd accumulated in clay but that Cd is much more easily leached from clay than from other particle size fractions. Huang et al. [17] indicated that fine particles are more likely than coarser particles to support higher concentrations of heavy metals, contain high levels of organic matter, and reduce the mobility of heavy metals. Liu et al. [44] found that the Cd recoveries were lower for fine soil colloids (<0.2 μm) than for coarse and medium soil particles, which indicated that the ability of fine particles to retain Cd was lower. In other words, clays with more adsorption sites can accumulate large amounts of heavy metals, but when the physical and chemical environments changed, as they do with increasing soil salinity, the amount of trace elements released can be large. As the calculation results of PCA, it led us to conclude that the level of Cd released from the soil decreased in the order clay > silt > sand. Fine particles more readily transport heavy metals than coarse particles, probably because clay or fine particles have much higher specific surface areas than coarser particles [51], and the large surface areas of fine particles provide many suitable sites for competitive adsorption involving cations in the solution and Cd in the soil. The presence of clay leads to an increased environmental risk of Cd pollution in saline soils; therefore, in order to ensure soil ecological security and reduce the release and migration of cadmium, it is crucial to enhance the monitoring of clay soil health and pollution prevention in salinized or coastal areas.
However, due to the limitations of this work, the changes in soil physical and chemical properties after the batch desorption test were not analyzed. This work needs to be focused in the future. On the one side, it is related to the changes of soil structure and properties under the action of salt stress. On the other side, it will help to explain a series of chemical reactions of insoluble ions in soil and solution environment, and provide reference for soil ecological treatment and restoration in cadmium polluted areas, so as to maximize its economic benefits.

5. Conclusions

Batch adsorption tests were performed with eight soil samples, and the amounts of Cd desorbed and the influence for different saline environments on soil Cd release were investigated in this study. Different level of salt stress had markedly different effects on Cd release from the soil. Increasing concentration, except for NaNO3, caused more Cd release. Much more Cd was released by CaCl2 and MgCl2 solutions than by other salts at the same concentration, which was probably contributed to the existence of competitive adsorption and the competitive advantages of Ca2+ and Mg2+. Both the competitive adsorption of cations and the complexation by chloride ions, which are highly sensitive to changes in salt solution concentration, impact the competitive desorption of Cd significantly. Via the calculation of PCA, the level of Cd release was mainly influenced by the soil particle size distribution, CEC, SIO, TOC content, and BET surface area. The soil particle size very strongly affected Cd desorption, meaning that the higher the proportion of clay in soils was, the greater the Cd desorption level was.

Author Contributions

N.Z.: Investigation, Mapping, Formal Analysis, Visualization, Writing—original draft. W.Y.: Investigation, Conceptualization, Supervision, Methodology, Formal Analysis, Writing—Review and Editing. J.W.: Supervision, Conceptualization, Methodology. K.H.: Experiment, Methodology, Investigation. L.W.: Formal Analysis, Visualization. M.G.: Formal Analysis, Visualization. Y.T.: Conceptualization, Supervision, Methodology. All authors have read and agreed to the published version of the manuscript.

Funding

This research was funded by the key science and technology projects of Inner Mongolia autonomous region (grant no. 2019ZD001-05), the National Natural Science Foundation of China (grant no. 51879011), and the 111 Project (grant no. B18006).

Conflicts of Interest

The authors declare that they have no known competing financial interests or personal relationships that could have appeared to influence the work reported in this paper.

References

  1. Chabchoubi, I.B.; Mtibaa, S.; Ksibi, M.; Hentati, O. Health risk assessment of heavy metals (Cu, Zn, and Mn) in wild oat grown in soils amended with sediment dredged from the Joumine Dam in Bizerte, Tunisia. Euro-Mediterr. J. Environ. Integr. 2020, 5, 3. [Google Scholar] [CrossRef]
  2. Chen, H.; Zhang, J.; Tang, L.; Su, M.; Tian, D.; Zhang, L.; Li, Z.; Hu, S. Enhanced Pb immobilization via the combination of biochar and phosphate solubilizing bacteria. Environ. Int. 2019, 127, 395–401. [Google Scholar] [CrossRef]
  3. Gupt, C.B.; Kushwaha, A.; Prakash, A.; Chandra, A.; Goswami, L.; Sekharan, S. Mitigation of Groundwater Pollution: Heavy Metal Retention Characteristics of Fly Ash Based Liner Materials; Springer: Singapore, 2020; pp. 79–104. [Google Scholar]
  4. Dong, B.; Zhang, R.; Gan, Y.; Cai, L.; Freidenreich, A.; Wang, K.; Guo, T.; Wang, H. Multiple methods for the identification of heavy metal sources in cropland soils from a resource-based region. Sci. Total Environ. 2019, 651, 3127–3138. [Google Scholar] [CrossRef] [PubMed]
  5. Wang, S.; Kalkhajeh, Y.K.; Qin, Z.; Jiao, W. Spatial distribution and assessment of the human health risks of heavy metals in a retired petrochemical industrial area, south China. Environ. Res. 2020, 188, 109661. [Google Scholar] [CrossRef]
  6. Yadav, A.P.S.; Dwivedi, V.; Kumar, S.; Kushwaha, A.; Goswami, L.; Reddy, B.S. Cyanobacterial extracellular polymeric substances for heavy metal removal: A mini review. J. Compos. Sci. 2021, 5, 1. [Google Scholar] [CrossRef]
  7. Zhao, M.; Qian, E.; Zhang, F.; Liu, R.; Liu, X.; Zhao, Y.; Liang, X. Spatiotemporal dynamics of labile Cd in soil during rice growth. Sci. Total Environ. 2020, 738, 139832. [Google Scholar] [CrossRef]
  8. Teng, Y.; Wu, J.; Lu, S.; Wang, Y.; Jiao, X.; Song, L. Soil and soil environmental quality monitoring in China: A review. Environ. Int. 2014, 69, 177–199. [Google Scholar] [CrossRef]
  9. Liu, X.; Tian, G.; Jiang, D.; Zhang, C.; Kong, L. Cadmium (Cd) distribution and contamination in Chinese paddy soils on national scale. Environ. Sci. Pollut. Res. 2016, 23, 17941–17952. [Google Scholar] [CrossRef]
  10. Li, K.; Liu, J.; Lu, X.; Yang, J.; Zhang, Z.; Zhu, Q. Uptake and distribution of cadmium in different rice cultivars. J. Agro-Environ. Sci. 2003, 22, 529–532. [Google Scholar]
  11. Yang, Y.; Chang, A.C.; Wang, M.; Chen, W.; Peng, C. Assessing cadmium exposure risks of vegetables with plant uptake factor and soil property. Environ. Pollut. 2018, 238, 263–269. [Google Scholar] [CrossRef] [PubMed]
  12. Nouri, M.; Haddioui, A. Human and animal health risk assessment of metal contamination in soil and plants from Ait Ammar abandoned iron mine, Morocco. Environ. Monit. Assess. 2015, 188, 1–12. [Google Scholar] [CrossRef]
  13. Chen, H.; Ma, J.; Wei, J.; Gong, X.; Yu, X.; Guo, H.; Zhao, Y. Biochar increases plant growth and alters microbial communities via regulating the moisture and temperature of green roof substrates. Sci. Total Environ. 2018, 635, 333–342. [Google Scholar] [CrossRef] [PubMed]
  14. Zang, F.; Wang, S.; Nan, Z.; Ma, J.; Zhang, Q.; Chen, Y.; Li, Y. Accumulation, spatio-temporal distribution, and risk assessment of heavy metals in the soil-corn system around a polymetallic mining area from the Loess Plateau, northwest China. Geoderma 2017, 305, 188–196. [Google Scholar] [CrossRef]
  15. Xia, H.; Kong, W.; Liu, L.; Lin, K.; Li, H. Effects of harvest time and desalination of feedstock on Spartina alterniflora biochar and its efficiency for Cd2+ removal from aqueous solution. Ecotoxicol. Environ. Saf. 2021, 207, 111309. [Google Scholar] [CrossRef]
  16. Chen, Y.X.; Zhong, B.H.; Fang, W.M. Adsorption characterization of lead(II) and cadmium(II) on crosslinked carboxymethyl starch. J. Appl. Polym. Sci. 2012, 124, 5010–5020. [Google Scholar] [CrossRef]
  17. Huang, B.; Yuan, Z.; Li, D.; Zheng, M.; Nie, X.; Liao, Y. Effects of soil particle size on the adsorption, distribution, and migration behaviors of heavy metal(loid)s in soil: A review. Environ. Sci. Proc. Impacts 2020, 22, 1596–1615. [Google Scholar] [CrossRef]
  18. Krčmar, D.; Tenodi, S.; Grba, N.; Kerkez, D.; Watson, M.; Rončević, S.; Dalmacija, B. Preremedial assessment of the municipal landfill pollution impact on soil and shallow groundwater in Subotica, Serbia. Sci. Total Environ. 2018, 615, 1341–1354. [Google Scholar] [CrossRef]
  19. Ye, W.M.; He, Y.; Chen, Y.G.; Chen, B.; Cui, Y.J. Adsorption, desorption and competitive adsorption of heavy metal ions from aqueous solution onto GMZ01 bentonite. In Engineering Geology for Society and Territory; Spinger: Cham, Switzerland, 2015; pp. 533–536. [Google Scholar]
  20. Chen, H.; Tang, L.; Wang, Z.; Su, M.; Tian, D.; Zhang, L.; Li, Z. Evaluating the protection of bacteria from extreme Cd (II) stress by P-enriched biochar. Environ. Pollut. 2020, 263, 114483A. [Google Scholar] [CrossRef]
  21. Yue, W.; Yang, J.; Tong, J.; Gao, H. Transfer and balance of water and salt in irrigation district of arid region. J. Hydraul. Eng. 2008, 39, 623–626. [Google Scholar]
  22. Kozyatnyk, I.; Lovgren, L.; Haglund, P. On the leaching of mercury by brackish seawater from permeable barriers materials and soil. J. Environ. Chem. Eng. 2015, 3, 1200–1206. [Google Scholar] [CrossRef]
  23. Sun, R.; Yang, J.; Xia, P.; Wu, S.; Lin, T.; Yi, Y. Contamination features and ecological risks of heavy metals in the farmland along shoreline of Caohai plateau wetland, China. Chemosphere 2020, 254, 126828. [Google Scholar] [CrossRef] [PubMed]
  24. Costa, M.; Henriques, B.; Pinto, J.; Fabre, E.; Viana, T.; Ferreira, N.; Amaral, J.; Vale, C.; Pinheiro-Torres, J.; Pereira, E. Influence of salinity and rare earth elements on simultaneous removal of Cd, Cr, Cu, Hg, Ni and Pb from contaminated waters by living macroalgae. Environ. Pollut. 2020, 266, 1153741. [Google Scholar] [CrossRef]
  25. Acosta, J.A.; Jansen, B.; Kalbitz, K.; Faz, A.; Martínez-Martínez, S. Salinity increases mobility of heavy metals in soils. Chemosphere 2011, 85, 1318–1324. [Google Scholar] [CrossRef] [PubMed]
  26. Trakal, L.; Kodešová, R.; Komárek, M. Modelling of Cd, Cu, Pb and Zn transport in metal contaminated soil and their uptake by willow (Salix × smithiana) using HYDRUS-2D program. Plant Soil 2012, 366, 433–451. [Google Scholar] [CrossRef]
  27. Zheng, S.; Chen, C.; Li, Y.; Li, S.; Liang, J. Characterizing the release of cadmium from 13 purple soils by batch leaching tests. Chemosphere 2013, 91, 1502–1507. [Google Scholar] [CrossRef]
  28. Hossain, M.A.; Ngo, H.H.; Guo, W.S.; Nghiem, L.D.; Hai, F.I.; Vigneswaran, S.; Nguyen, T.V. Competitive adsorption of metals on cabbage waste from multi-metal solutions. Bioresour. Technol. 2014, 160, 79–88. [Google Scholar] [CrossRef] [PubMed]
  29. Shaheen, S.M. Sorption and lability of cadmium and lead in different soils from Egypt and Greece. Geoderma 2009, 153, 61–68. [Google Scholar] [CrossRef]
  30. Zhao, S.; Feng, C.; Wang, D.; Liu, Y.; Shen, Z. Salinity increases the mobility of Cd, Cu, Mn, and Pb in the sediments of Yangtze Estuary: Relative role of sediments’ properties and metal speciation. Chemosphere 2013, 91, 977–984. [Google Scholar] [CrossRef]
  31. Kolodynska, D.; Wnetrzak, R.; Leahy, J.J.; Hayes, M.H.B.; Kwapinski, W.; Hubicki, Z. Kinetic and adsorptive characterization of biochar in metal ions removal. Chem. Eng. J. 2012, 197, 295–305. [Google Scholar] [CrossRef]
  32. Coelho, G.F.; GonCalves, A.C., Jr.; Novoa-Munoz, J.C.; Fernandez-Calvino, D.; Arias-Estevez, M.; Fernandez-Sanjurjo, M.J.; Alvarez-Rodriguez, E.; Nunez-Delgado, A. Competitive and non-competitive cadmium, copper and lead sorption/desorption on wheat straw affecting sustainability in vineyards. J. Clean. Prod. 2016, 139, 1496–1503. [Google Scholar] [CrossRef]
  33. Wang, M.; Chen, S.; Chen, L.; Wang, D. Saline stress modifies the effect of cadmium toxicity on soil archaeal communities. Ecotoxicol. Environ. Saf. 2019, 182, 109431. [Google Scholar] [CrossRef]
  34. Raiesi, F.; Razmkhah, M.; Kiani, S. Salinity stress accelerates the effect of cadmium toxicity on soil N dynamics and cycling: Does joint effect of these stresses matter? Ecotoxicol. Environ. Saf. 2018, 153, 160–167. [Google Scholar] [CrossRef]
  35. Covelo, E.F.; Vega, F.A.; Andrade, M.L. Heavy metal sorption and desorption capacity of soils containing endogenous contaminants. J. Hazard. Mater. 2007, 143, 419–430. [Google Scholar] [CrossRef]
  36. Behbahani, A.; Ryan, R.J.; McKenzie, E.R. Impacts of salinity on the dynamics of fine particles and their associated metals during stormwater management. Sci. Total Environ. 2021, 777, 146135. [Google Scholar] [CrossRef]
  37. Fernandez-Calvino, D.; Cutillas-Barreiro, L.; Paradelo-Nunez, R.; Novoa-Munoz, J.C.; Fernandez-Sanjurjo, M.J.; Alvarez-Rodriguez, E.; Nunez-Delgado, A.; Arias-Estevez, M. Heavy metals fractionation and desorption in pine bark amended mine soils. J. Environ. Manag. 2017, 192, 79–88. [Google Scholar] [CrossRef] [PubMed]
  38. Kubier, A.; Wilkin, R.T.; Pichler, T. Cadmium in soils and groundwater: A review. Appl. Geochem. 2019, 108. [Google Scholar] [CrossRef]
  39. Ali, R.M.; Hamad, H.A.; Hussein, M.M.; Malash, G.F. Potential of using green adsorbent of heavy metal removal from aqueous solutions: Adsorption kinetics, isotherm, thermodynamic, mechanism and economic analysis. Ecol. Eng. 2016, 91, 317–332. [Google Scholar] [CrossRef]
  40. Du Laing, G.; Rinklebe, J.; Vandecasteele, B.; Meers, E.; Tack, F.M.G. Trace metal behaviour in estuarine and riverine floodplain soils and sediments: A review. Sci. Total Environ. 2009, 407, 3972–3985. [Google Scholar] [CrossRef]
  41. Wang, Z.; Yi, L.; Gao, W.; Zeng, X.; Wang, Z. Impact of inorganic anions on the cadmium effective fraction in soil and its phytoavailability during salinization in alkaline soils. Acta Ecol. Sinica 2012, 32, 7512–7518. [Google Scholar] [CrossRef] [Green Version]
  42. Zhang, C.; Sale, P.W.G.; Tang, C. Cadmium uptake by Carpobrotus rossii (Haw.) Schwantes under different saline conditions. Environ. Sci. Pollut. Res. 2016, 23, 13480–13488. [Google Scholar] [CrossRef]
  43. Ondrasek, G.; Rengel, Z.; Romic, D.; Savic, R. Salinity decreases dissolved organic carbon in the rhizosphere and increases trace element phyto-accumulation. Eur. J. Soil Sci. 2012, 63, 685–693. [Google Scholar] [CrossRef]
  44. Liu, G.; Xue, W.; Wang, J.; Liu, X. Transport behavior of variable charge soil particle size fractions and their influence on cadmium transport in saturated porous media. Geoderma 2019, 337, 945–955. [Google Scholar] [CrossRef]
  45. Zong, Y.; Xiao, Q.; Lu, S. Distribution, bioavailability, and leachability of heavy metals in soil particle size fractions of urban soils (northeastern China). Environ. Sci. Pollut. Res. 2016, 23, 14600–14607. [Google Scholar]
  46. Elbana, T.A.; Selim, H.M. Modeling of cadmium and nickel release from different soils. Geoderma 2019, 338, 78–87. [Google Scholar] [CrossRef]
  47. Cerqueira, B.; Covelo, E.F.; Andrade, L.; Vega, F.A. The influence of soil properties on the individual and competitive sorption and desorption of Cu and Cd. Geoderma 2011, 162, 20–26. [Google Scholar] [CrossRef]
  48. Nguemezi, C.; Tematio, P.; Yemefack, M.; Tsozue, D.; Silatsa, T.B.F. Soil quality and soil fertility status in major soil groups at the Tombel area, South-West Cameroon. Heliyon 2020, 6, 10. [Google Scholar] [CrossRef] [PubMed] [Green Version]
  49. Ammar, R.; Kanbar, H.J.; Kazpard, V.; Wazne, M.; El Samrani, A.G.; Amacha, N.; Saad, Z.; Chou, L. Role of phosphogypsum and NPK amendments on the retention or leaching of metals in different soils. J. Environ. Manag. 2016, 178, 20–29. [Google Scholar] [CrossRef]
  50. Imoto, Y.; Yasutaka, T. Comparison of the impacts of the experimental parameters and soil properties on the prediction of the soil sorption of Cd and Pb. Geoderma 2020, 376, 114538. [Google Scholar] [CrossRef]
  51. Sun, W.; Zhang, X.; Sun, X.; Sun, Y.; Cen, Y. Predicting nickel concentration in soil using reflectance spectroscopy associated with organic matter and clay minerals. Geoderma 2018, 327, 25–35. [Google Scholar] [CrossRef]
Figure 1. Percentages of Cd desorbed in the presence of different salts at different concentrations.
Agronomy 11 02175 g001
Figure 2. Effects of different salt types and salt concentrations (0, 0.5%, 1.0%, 2%, 3%, and 3.5%) on the Cd desorption rates (%).
Agronomy 11 02175 g002
Figure 3. Correlations between Cd desorption rates and salt concentrations (each point is the average for all samples, R2 is the coefficient of determination, P is the Pearson correlation coefficient).
Agronomy 11 02175 g003
Figure 4. Mean amounts of Cd released (qe) at different molar concentrations (CM) of different ions.
Agronomy 11 02175 g004
Figure 5. Kd values for Cd under different salt stresses. Vertical bars represent standard errors of the means (n  =  3). Statistically significant association (p  <  0.05).
Agronomy 11 02175 g005
Table 1. Physical and chemical properties of the soil samples.
S1S2S3S4S5S6S7S8
pH7.657.777.507.737.797.897.377.80
Eh136.0156.6144.1170.6176.1159.7186.2186.0
EC249.47166.5799.60655.00731.00165.6380.17905.67
Total Cd (mg/kg)0.2180.2152.4702.0000.4620.3360.2440.639
SOM (mg/g)28.3038.1015.4520.3019.7017.1010.2025.30
CEC (cmol/kg)19.5021.1011.2033.6034.9019.909.8040.60
SIO (mg/g)13.6612.8314.9112.0013.9714.6313.7814.10
Clay (%)17.8110.3026.9111.8415.1619.4323.2312.21
Silt (%)68.1047.7173.0940.7846.4569.1576.7733.59
Sand (%)14.1041.990.0047.3738.3911.420.0054.21
BET15.9212.6810.9411.8916.5817.3312.9215.21
Eh = oxidation-reduction potential, EC = electrical conductivity, SOM = organic matter content, CEC = cation exchange capacity, SIO = iron–manganese oxide content, and BET = Brunauer-Emmett-Teller surface area.
Table 2. Fitting results for the Freundlich models.
CSaltKf1/nR2n
0.5%NaCl370.790.8930.9601.128
CaCl218.3240.5390.8271.856
NaNO3264.2720.6970.9001.435
MgCl217.5170.5270.7331.899
Na2SO4103.1310.6080.8651.644
mixed salt50.5880.6180.7291.618
1%NaCl40.9860.6070.8711.647
CaCl211.9600.5320.8071.878
NaNO3202.6000.6780.8751.476
MgCl213.7050.5430.7621.841
Na2SO4136.0710.6640.8731.505
mixed salt25.3340.5660.7591.767
2%NaCl114.5560.8730.9481.145
CaCl29.4610.5660.8141.766
NaNO3157.4320.6580.8511.519
MgCl28.5860.5230.7511.911
Na2SO4122.8000.6640.8311.505
mixed salt8.6560.4850.7772.061
3%NaCl34.6780.6580.8901.520
CaCl28.3160.5770.8091.733
NaNO3111.0240.6140.8811.629
MgCl27.3700.5470.7711.829
Na2SO4102.8050.6460.8241.549
mixed salt8.9910.5030.7171.989
3.5%NaCl13.0090.5450.8161.835
CaCl27.4850.5660.8271.768
NaNO3154.9310.6730.8261.487
MgCl26.9780.5440.7661.840
Na2SO472.5800.5990.8241.670
mixed salt9.4600.5420.7411.847
Table 3. Principal component analysis (PCA) results for the Cd release data for different salts and salt concentrations.
NaClCaCl2NaNO3
VariablesPCA1PCA2PCA3PCA4PCA1PCA2PCA3PCA4PCA1PCA2PCA3PCA4
pH−0.450.74−0.440.23−0.460.70−0.220.48−0.580.490.640.08
Eh−0.410.120.780.20−0.48−0.050.76−0.10−0.63−0.59−0.15−0.18
EC−0.680.540.37−0.11−0.680.530.41−0.12−0.91−0.160.060.27
BET−0.260.59−0.070.64−0.350.350.210.72−0.47−0.030.77−0.19
Clay0.93−0.220.230.050.90−0.300.260.030.84−0.510.070.04
Silt0.84−0.44−0.070.290.79−0.55−0.030.250.91−0.250.10−0.29
Sand−0.880.39−0.01−0.24−0.840.50−0.05−0.20−0.910.32−0.090.21
TOC−0.60−0.09−0.74−0.20−0.520.14−0.80−0.02−0.300.90−0.16−0.08
CEC−0.760.600.17−0.06−0.750.600.23−0.01−0.940.050.160.23
SIO0.710.240.060.270.670.130.250.410.49−0.330.48−0.03
Total Cd0.370.290.21−0.800.450.460.10−0.680.21−0.17−0.170.93
Salt–0.0%−0.63−0.06−0.120.05−0.60−0.04−0.24−0.03−0.450.38−0.28−0.28
Salt–0.5%0.260.890.150.050.880.47−0.01−0.070.850.29−0.400.00
Salt–1.0%0.640.71−0.19−0.170.860.500.01−0.020.870.300.110.00
Salt–2.0%0.520.79−0.030.190.830.550.010.030.760.440.250.10
Salt–3.0%0.850.48−0.21−0.040.870.46−0.040.060.860.090.300.36
Salt–3.5%0.790.52−0.04−0.290.840.47−0.24−0.050.620.750.050.01
Eigenvalue7.274.511.741.578.683.341.781.538.773.061.761.41
Cumulative variance42.7769.3179.5488.7951.0570.7081.1990.1651.5669.5379.9088.21
MgCl2Na2SO4Mixed salt
VariablesPCA1PCA2PCA3PCA4PCA1PCA2PCA3PCA4PCA1PCA2PCA3PCA4
pH−0.480.660.550.13−0.70.010.520.41−0.440.710.50.11
Eh−0.350.23−0.710.44−0.270.8−0.470−0.350.2−0.750.4
EC−0.640.63−0.320.03−0.730.590.19−0.1−0.610.64−0.36−0.01
BET−0.280.50.320.60−0.450.220.220.73−0.230.560.230.56
Clay0.94−0.21−0.160.110.970.060.030.090.94−0.24−0.160.09
Silt0.81−0.510.130.230.88−0.3−0.170.290.80−0.510.140.25
Sand−0.860.44−0.06−0.2−0.930.210.12−0.24−0.860.45−0.06−0.21
TOC−0.64−0.120.59−0.39−0.66−0.640.11−0.14−0.65−0.090.63−0.32
CEC−0.730.65−0.120.02−0.850.450.25−0.02−0.700.67−0.16−0.02
SIO0.720.240.140.310.630.20.340.420.760.260.10.29
Total Cd0.390.35−0.35−0.710.320.240.52−0.670.380.26−0.34−0.77
Salt–0.0%−0.64−0.140.080.01−0.53−0.14−0.06−0.09−0.580.060.160.09
Salt–0.5%0.930.330.110.040.76−0.160.57−0.220.530.730.080.16
Salt–1.0%0.940.31−0.060.010.740.150.60.090.910.4−0.060.08
Salt–2.0%0.830.530.07−0.120.880.41−0.07−0.040.790.550.06−0.24
Salt–3.0%0.810.570.12−0.080.880.27−0.36−0.050.820.510.12−0.17
Salt–3.5%0.850.50.06−0.140.950.250.1−0.060.810.560.09−0.09
Eigenvalue8.943.311.611.479.42.251.911.588.033.951.641.51
Cumulative variance52.5772.0381.590.1355.368.5279.7889.0747.2470.580.1388.99
EC = electrical conductivity, m S/cm, BET = Brunauer-Emmett-Teller surface area, TOC = total organic carbon content, mg/g, CEC = cation exchange capacity, cmol/kg, SIO = iron-manganese oxide content, mg/g.
Publisher’s Note: MDPI stays neutral with regard to jurisdictional claims in published maps and institutional affiliations.

