Article

Turbidity and Chemical Oxygen Demand Reduction from Pig Slurry through a Coagulation Flocculation Process

by
Oumaima El bied
1,2,*,
Mathieu Kessler
3,
Martire Angélica Terrero
1,
Taoufiq Fechtali
2,
Angel Faz Cano
1 and
José A. Acosta
1
1
Sustainable Use, Management and Reclamation of Soil and Water Research Group, Agronomic Engineering Department, ETSIA, Universidad Politécnica de Cartagena, Paseo Alfonso XIII, 48, 30203 Cartagena, Murcia, Spain
2
Department of Biosciences, Faculty of Science and Technologies, Hassan II University, Casablanca 28806, Morocco
3
Department of Applied Mathematics and Statistics, Universidad Politécnica de Cartagena, Edificio del Antiguo Hospital de Marina, Planta Bajo Cubierta, Avenida Dr. leming 0202, 30202 Cartagena, Murcia, Spain
*
Author to whom correspondence should be addressed.
Agronomy 2021, 11(11), 2158; https://doi.org/10.3390/agronomy11112158
Submission received: 17 August 2021 / Revised: 24 October 2021 / Accepted: 25 October 2021 / Published: 27 October 2021
(This article belongs to the Section Water Use and Irrigation)

Abstract

:
Pig slurry is considered a high-risk effluent that causes several environmental problems if it is not adequately managed and treated. White Iberian pig farms in the southeast of Spain treat their slurry in situ using separation, double filtration, decantation, and constructed wetland treatments. However, the pretreatment process does not successfully reduce solids, which leads to clogging in the constructed wetlands (CWs). The main objective of this research paper is to reduce the turbidity and chemical oxygen demand (COD) from the effluent to make it appropriate for CW treatment. Optimization of the coagulation–flocculation (CF) process using iron chloride and a cationic flocculent DKFLOCC-1598 was investigated by a central composite design method (CCD). The effects of coagulant concentration, pH, and flocculent on the COD and turbidity removal were evaluated. The best results were found using 0.024 mol L−1 iron chloride and 0.164 mL L−1 flocculent at pH 7.5, which reduced COD by 96% and delivered turbidity removal of 97%. Therefore, the results indicate the high efficiency of the treatment method in reducing the COD and suspended solids.

Graphical Abstract

1. Introduction

In Spain, the pig sector has grown remarkably, both in production and in the number of farms [1]. Due to this growth trend, tons of pig slurry are produced annually. Pig slurry is considered a risky effluent for the environment when not adequately treated. Pig slurry can cause several serious environmental problems in water, soil, and air [2], including eutrophication of water bodies, groundwater contamination [3], emission of greenhouse gases [2], soil degradation, and pollution [4].
Every treatment plant uses different methods and technologies to reduce the negative environmental impacts of pig slurry. One of the newest treatment techniques is constructed wetlands [5]. However, the main problem of this system is the clogging of granular media by the presence of colloidal particles in the pig slurry [6,7,8,9]. Thus, there is a need to find a pretreatment method to remove solids in order to avoid clogging of the wetlands [10].
One of the most effective chemical processes to reduce solids in wastewater is the coagulation–flocculation process [5]. It is a pretreatment mode suited for the removal of colloidal particles [7] and for reducing the chemical oxygen demand (COD) [11,12,13]. The authors of [14] reported that total COD and total suspended solids had reduction yields higher than 66% and 74%, respectively, using chloride ferric, and the authors of [11] also confirmed that using chloride ferric can reduce up to 76% of total suspended solids in pig slurry.
Inorganic salts and iron salts are generally used as coagulants, but iron salts are usually more efficient than aluminum ones [7,15,16]. Some research studies demonstrate that colloidal particles of swine manure are generally negatively charged [17]. Other authors demonstrate that pig manure requires the use of cationic polymers and that organic particles are suspended in neutral or alkaline wastewater [18,19], while the authors of [20] concluded that a medium-charge density and a high molecular weight polymer are the most effective factors in removing solids from pig slurry. For this reason, we selected a cationic DKFLOCC-1598 flocculent to treat our slurry.
The coagulation–flocculation process is highly recommended in removing solids from liquid solutions [5,21]. According to [22], turbidity represents the suspended solids of a solution being the main indicator of solids’ removal from wastewater or pig slurry. In addition, the COD is generally used to indirectly determine the amount of organic compounds in water [23]. High COD indicates the presence of all forms of organic matter, both biodegradable and nonbiodegradable [23]. Therefore, these parameters (turbidity and COD) are the most important to evaluate the effectiveness of a coagulation–flocculation process.
The most common pretreatments for the CWs are the two phases of double filtration and decantation; nevertheless, they do not adequately separate the solids from the liquid, which results in a clogging of the constructed wetland and a diminution of their lifespan [24]. In this study, we propose a suitable pretreatment strategy for CWs and demonstrate how coagulation–flocculation pretreatment can present an excellent remedy for CW clogging by reaching a very high solid removal rate as well as COD removal.
To overcome the limitations and the disadvantages of the coagulation–flocculation (CF) process, it is necessary to apply a central composite design method (CCD). In this study, we used the R statistical software to optimize the affecting factors. We investigated the effect of three factors—coagulant concentration, pH, and flocculent—on COD and turbidity removal. The optimal operating conditions to achieve the maximum COD and turbidity removal were validated experimentally.
The objectives of this study are (i) to investigate whether the coagulation–flocculation process, utilizing chloride ferric as a coagulant and DKFLOCC-1598 as a flocculent, is effective and applicable for the treatment of this type of pig slurry; (ii) make the effluent suitable for the next treatment step, wetlands, to avoid clogging and extend the wetland’s lifespan; (iii) optimize the operating conditions by maximizing the reduction in turbidity and the COD removal efficiency with a central composite design method (CCD) using the R statistical software.

2. Materials and Methods

2.1. Location of the Pig Slurry Farm

The studied slurry was collected from an intensive pig farm located in Alhama de Murcia (Murcia Region), southeastern Spain. The constructed wetland pilot plant is in a Mediterranean climate, where the mean annual temperature is 17.6 °C and annual rainfall is 312 mm [25]. The pig slurry for the experiment came from a farm of 2900 mother pigs with piglets and growing pigs, with an average weight of 300 kg.

2.2. Pig Slurry Sample Collection

The pig farm has a raw pig slurry tank, a phase separator, two filters (1000 µm and 250 µm), and a horizontal decanter 40 m in length, 3.20 m in width, and 0.5 m in depth. A subsurface flow constructed wetland is used as the main slurry treatment, and the treated slurry is stored in an impermeable pond. In this research, the pig slurry was sampled from two different points; the first one was the raw pig slurry tank, and the second point was the input of the farm’s CW, which is the pretreated pig slurry. The coagulation–flocculation treatment was applied to the pretreated slurry from the second point.
The pig slurry that was treated in this study was sampled from the CW’s inlet, which is point (f) in Figure 1, and thus was already pretreated by a process that consisted of five steps (Figure 1): (a) separation phase, (b) vertical decantation, (c) first filtration at 1000 µm, (d) second filtration at 250 µm, and (e) horizontal decantation, (f) CW inlet.

2.3. Analytical Methods and Equipment

Pig slurry samples were transported to the laboratory and conserved at 4 °C to minimize biological and chemical reactions. Therefore, only the soluble fraction of the wastewater was used for the physical–chemical characterization, which included pH, electrical conductivity (EC), turbidity, total suspended solids (TSS), chemical oxygen demand (COD), and biological oxygen demand in 5 days (BOD5). The parameters were determined according to [26].
The experimental equipment used for the coagulation–flocculation experiments at the laboratory included a Jar Test Apparatus (VELP Scientifica F105A0109 JLT 6, UK), in which six stirring blades were connected to a motor that operated under adjustable conditions such as string time and speed.

2.4. Physical–Chemical Characteristics of the Pig Slurry

Table 1 shows the characterization of the raw pig slurry and the pig slurry after pretreatment with the five-step process previously mentioned.
Pig excrements include solid components, namely feces, and liquid components, namely urine. The slurry is a mixture of these two components. The slurry may also include drinking water, non-consumed feed, washing water, and, in most cases, precipitation water. Therefore, the pig slurry is a complex effluent with highly variable composition (Table 1). This variability comes mainly from the following factors: the category of pigs, the type of diet, and the management of wash water and precipitation [27]. The pH of animal slurry normally ranges from 6.3 to 8 on Spanish commercial farms, according to [28]. Based on the results in Table 1, our effluent has a pH of 7.54, which is a normal pH for pig slurry.
The EC of the pig slurry depends on the age and type of the pigs [29,30]. Our effluent has low conductivity. According to [31] and [28], the range of EC on Spanish commercial farms is from 6.59 to 53.5 MS cm −1 for growing pigs [32,33]; therefore, the studied pig slurry is not considered as a high-salinized slurry. The COD of our studied pig slurry is considered low, compared with other farms that can achieve 37 g L−1 [34] or up to 113 g L−1 in some cases [35]. The DBO5 of our studied slurry is also considered low at 4.2 g L−1, compared with other farms, where the slurry can have a DBO5 of 41 g L−1 [35].
The physical separator eliminated only 62% of the solids, which makes the effluent not suitable for the constructed wetland. The CW comprises, from the surface to the bottom, 0.30 m washed sand, 0.10 m fine gravel, 0.50 m coarse gravel, and 0.30 m fine gravel. Therefore, the input slurry should contain low solid materials in order to extend the lifespan of the wetlands by avoiding the clogging of granular media [6,7,8,9,10], which is the main problem of constructed wetlands. Hence, physical and chemical pretreatment to remove the maximum solids is appropriate.

2.5. Design of Coagulation–Flocculation Assay

As pH is one of the most restrictive parameters in the coagulation step and affects the hydrolysis equilibrium that the coagulant agent can bring out, we decided to first carry out the treatment at pH 7.88, as this was the natural pH value determined in the original pig slurry.
The coagulant and flocculent used in this research were chloride ferric and DKFLOCC-1598 (cationic flocculent), respectively, purchased from ACIDEKA, Spain. At the start, to find the closest concentration to the optimum, several coagulant doses from 0.02 mol L−1 to 0.032 mol L−1 were tested at free pH without adjusting it or adding any flocculant. Using concentrations from 0.03 mol L−1 to 0.032 mol L−1 gives an orange color, which represents an excess of iron chloride. A low concentration of 0.02 mol L−1 did not provide any coagulant particles, giving a dark brown color that turned to a clear brown after sludge separation. Meanwhile, 0.022 mol L−1 gave a yellow color and became clear for the coagulant dose near 0.026 mol L−1. Therefore, the concentration of 0.026 mol L−1 was selected for our statistical study.
Turbidity and COD measures were performed to confirm our expectation and showed that using only the coagulant reduced 79% of COD, with a low turbidity reduction of 55%. Hence, to improve turbidity removal, it is highly recommended to use a flocculent.
After fixing the coagulant dose, various flocculent doses were added, starting from 0.06 mL L−1 to 0.2 mL L−1. First, the minimum and the maximum of the flocculent concentration ranges were added. Using the maximum concentration of the chosen flocculent range makes the treated effluent more turbid due to the excess of flocculent while using the minimum concentration makes the solid–liquid separation too slow and unable to form any floc, resulting in a lack of flocculent. Three other concentrations were chosen arbitrarily between the maximum and minimum concentrations: 0.1 mL L−1, 0.14 mL L−1, and 0.18 mL L −1. Using the 0.14 mL L−1 concentration provided better results concerning turbidity removal (85 NTU) after 30 min of settling, while the other concentrations had a major settling time of 50 min.
On that account, 0.140 mL L−1 was chosen for our statistical studies. After measuring the COD and turbidity using the same coagulant dose and different flocculent doses, the COD had a negligible difference, but the turbidity was changeable.
The optimal pH range for coagulation using iron is 5.5 to 6.5. For high alkalinity water, an extra amount of coagulant may be required to lower the pH in order to reach the optimal pH range [36]. Thus, it would be helpful to adjust the pH by adding an acid before the coagulant to reduce the amount of coagulant needed and effectively lower chemical costs.
The decreasing pH can be explained by the acidic character of Fe3+ (acid of Lewis), which reacts with the OH- ions of the pig slurry to produce iron precipitate in the form of Fe (OH)3, according to [37]. The pH of our effluent was 7.74, making it ideal for the coagulation–flocculation treatment. For this reason, the free pH of the solution was chosen as the center of our statistical study, and it helped to avoid the maximum adjustment.
Coagulation–flocculation experiments were performed with a BioBlock flocculator that comprises six paddle rotors in a jar test device with tall, 1-L beakers (VELP Scientifica F105A0109 JLT 6, UK). Tests were carried out at room temperature; the pH of each solution was adjusted by adding NaOH 0.5 M or HCl 5.48 M according to the experimental design. Then, 500 mL of raw pig slurry was put into 1 L beakers, and the various concentrations of the coagulant were added to the effluent at free pH, varying between 0.020 mol L−1 and 0.032 g L−1, and rapidly mixed (160 rpm) for 3 min. Then, the slurry was slowly mixed (40 rpm) while we added the cationic flocculent, with concentrations varying between 0.1 mL L−1 and 0.179 mL L−1, for 15 min. The solution was left to settle for 30 min. The supernatant samples were collected by using a 10 mL pipette to analyze the COD and turbidity removal percentages, which we calculated according to the following equation:
Removal (%) = ((Ci − Cf)/Ci) × 100
where Ci is the initial concentration, and Cf is the final concentration with the same unit for the COD (mol L −1) and with NTU of the turbidity.

2.6. Design of the Experiments and Statistical Analysis

The central composite design was used to determine the influence of pH, coagulant, and flocculant dosages on the efficiency of the coagulation–flocculation process. To this end, a central composite design (CCD) was prepared to fit a second-order response surface [31].
In total, 23 experiments were carried out under different pH conditions. The number of experiments (23) was provided by the CCD method, which optimizes the parameters’ combinations to estimate the response surface, aiming at a balance between achieving a suitable coverage of the parameters’ range and keeping the final number of required experiments reasonable. COD and turbidity removal responses were selected to evaluate wastewater treatment efficiency. The factors chosen were a coagulant (chloride ferric) and a cationic flocculant (DKFLOCC-1598) dosage and pH. These factors were selected due to our interest in reducing the operational costs of wastewater treatment. The design parameters were set as 0.026 mol L−1 for the coagulant concentration, 0.14 mL L−1 for the flocculent concentration, and free pH of 7.74. These values are based on the previous preliminary assay. The R statistical software was used [38] with the RSM library [39].
A blocking factor was introduced to consider three batches of experiments. The design of the experiment is described in Table 2 for each block; three replicates of the central point were used. Two of the blocks included one replicate of each vertex of the cube, while the third block contained one replicate of the star points of the CCD design.
After the experiments were conducted and results were obtained for COD and turbidity reduction, a second-order response surface was fitted. Following standard practice for statistical model selection, the full model that included interactions and blocking was then sequentially simplified based on the significance of the fitted coefficients.
The experimental matrix for the CCD and the results of COD and turbidity removal are shown in Table 2. The experiments were realized at random to minimize errors due to possible systematic trends in the variables. The use of CCD allowed the selected factors to be evaluated in terms of their significance and the optimal values to be determined. This was performed to obtain the best COD and turbidity removal rates from the pig slurry and to study the removal percentages obtained for COD and turbidity. The coagulation–flocculation process is the most suitable and effective method for removing solids from different wastewaters, including pig slurry, which is the aim of this research.

3. Results and Discussion

3.1. Coagulation–Flocculation Assay

The results showed that the supernatant pH decreased continually with increasing coagulant doses and yielded a value of 5.5 to 6.4. The decrease in pH can be explained by the acidic character of Fe3+ (Lewis acid), which reacted with the OH- ions of the pig slurry to produce iron precipitate in the form of Fe (OH)3 [40].
Some water quality parameters, such as pH and temperature, influence the coagulation process. For example, pH can affect the effectiveness of the particle destabilization process, and the temperature affects the viscosity of water, which can influence the coagulation procedure [41].
The optimal pH range for coagulation using iron is 5.5 to 6.5. For high alkalinity water, an extra amount of coagulant may be required to lower the pH in order to reach the optimal pH range [36]. Thus, it is helpful to adjust the pH by adding an acid before the coagulant to reduce the amount of coagulant needed and effectively lower chemical costs.

3.2. Optimal Combination of Coagulant, Flocculent, and pH

As described above, a full model with blocking and second-order terms of coded variables, coagulant, flocculent, and pH with interactions was fitted to COD and turbidity reduction. Both the blocking factor and the flocculent were found to have no significant effect. The model was consequently simplified to a second-order model with coagulant and pH with interaction. The interaction term coagulant*pH was discarded as not significant. The first-order term coefficients of coagulant and pH were also found to be non-significant but were preserved in the response surface model to add flexibility.
The coded variables x1 and x3 are the following:
x1 = (Coag − 0.026)/(0.026 − 0.024753)
x3 = (pH − 7.74)/(7.74 − 7.5779)
For COD removal, the final selected model was as follows:
Table 2. The final selected model for COD removal.
Model TermEstimate of the Coefficientp-Value
Intercept81.21<2 × 10−16
x1 (Normalized coagulation)0.130.88
x3 (Normalized pH)−0.160.85
x121.930.03
x322.300.01
A contour plot of the final fitted response surface is shown in Figure 5.
An appropriate combination of the three factors is desirable to obtain a high-efficiency treatment. Using the central composite design method (CCD) and the R statistical software to obtain the optimal conditions of these factors is less time- and energy consuming, but it is also is a significant, fast, and economical statistical technique for the determination of the interactive effects of parameters on experimental data. The CCD methodology effectively reduced the number of experiments, and the number of experiments that the statistical procedure provided was 23 Table 3. This system offers a better alternative to the conventional method because it includes the influences of individual factors as well as the influences of their interaction. Table 4 lists the COD and turbidity removal rates obtained after the 23 experiments using the methodology of the coagulation–flocculation experiments. As is shown in Table 4, the turbidity removal is high for all experiments, ranging from 96.3% to 99.9%, which shows that none of the three factors significantly affect the turbidity removal, while the COD removal varies from 72.0% to 88.6%, which means that it is possibly affected by the three factors, which are pH and coagulant and flocculent doses.

3.2.1. Effect of Flocculent and Coagulant Concentration Parameters on Turbidity and COD Removal

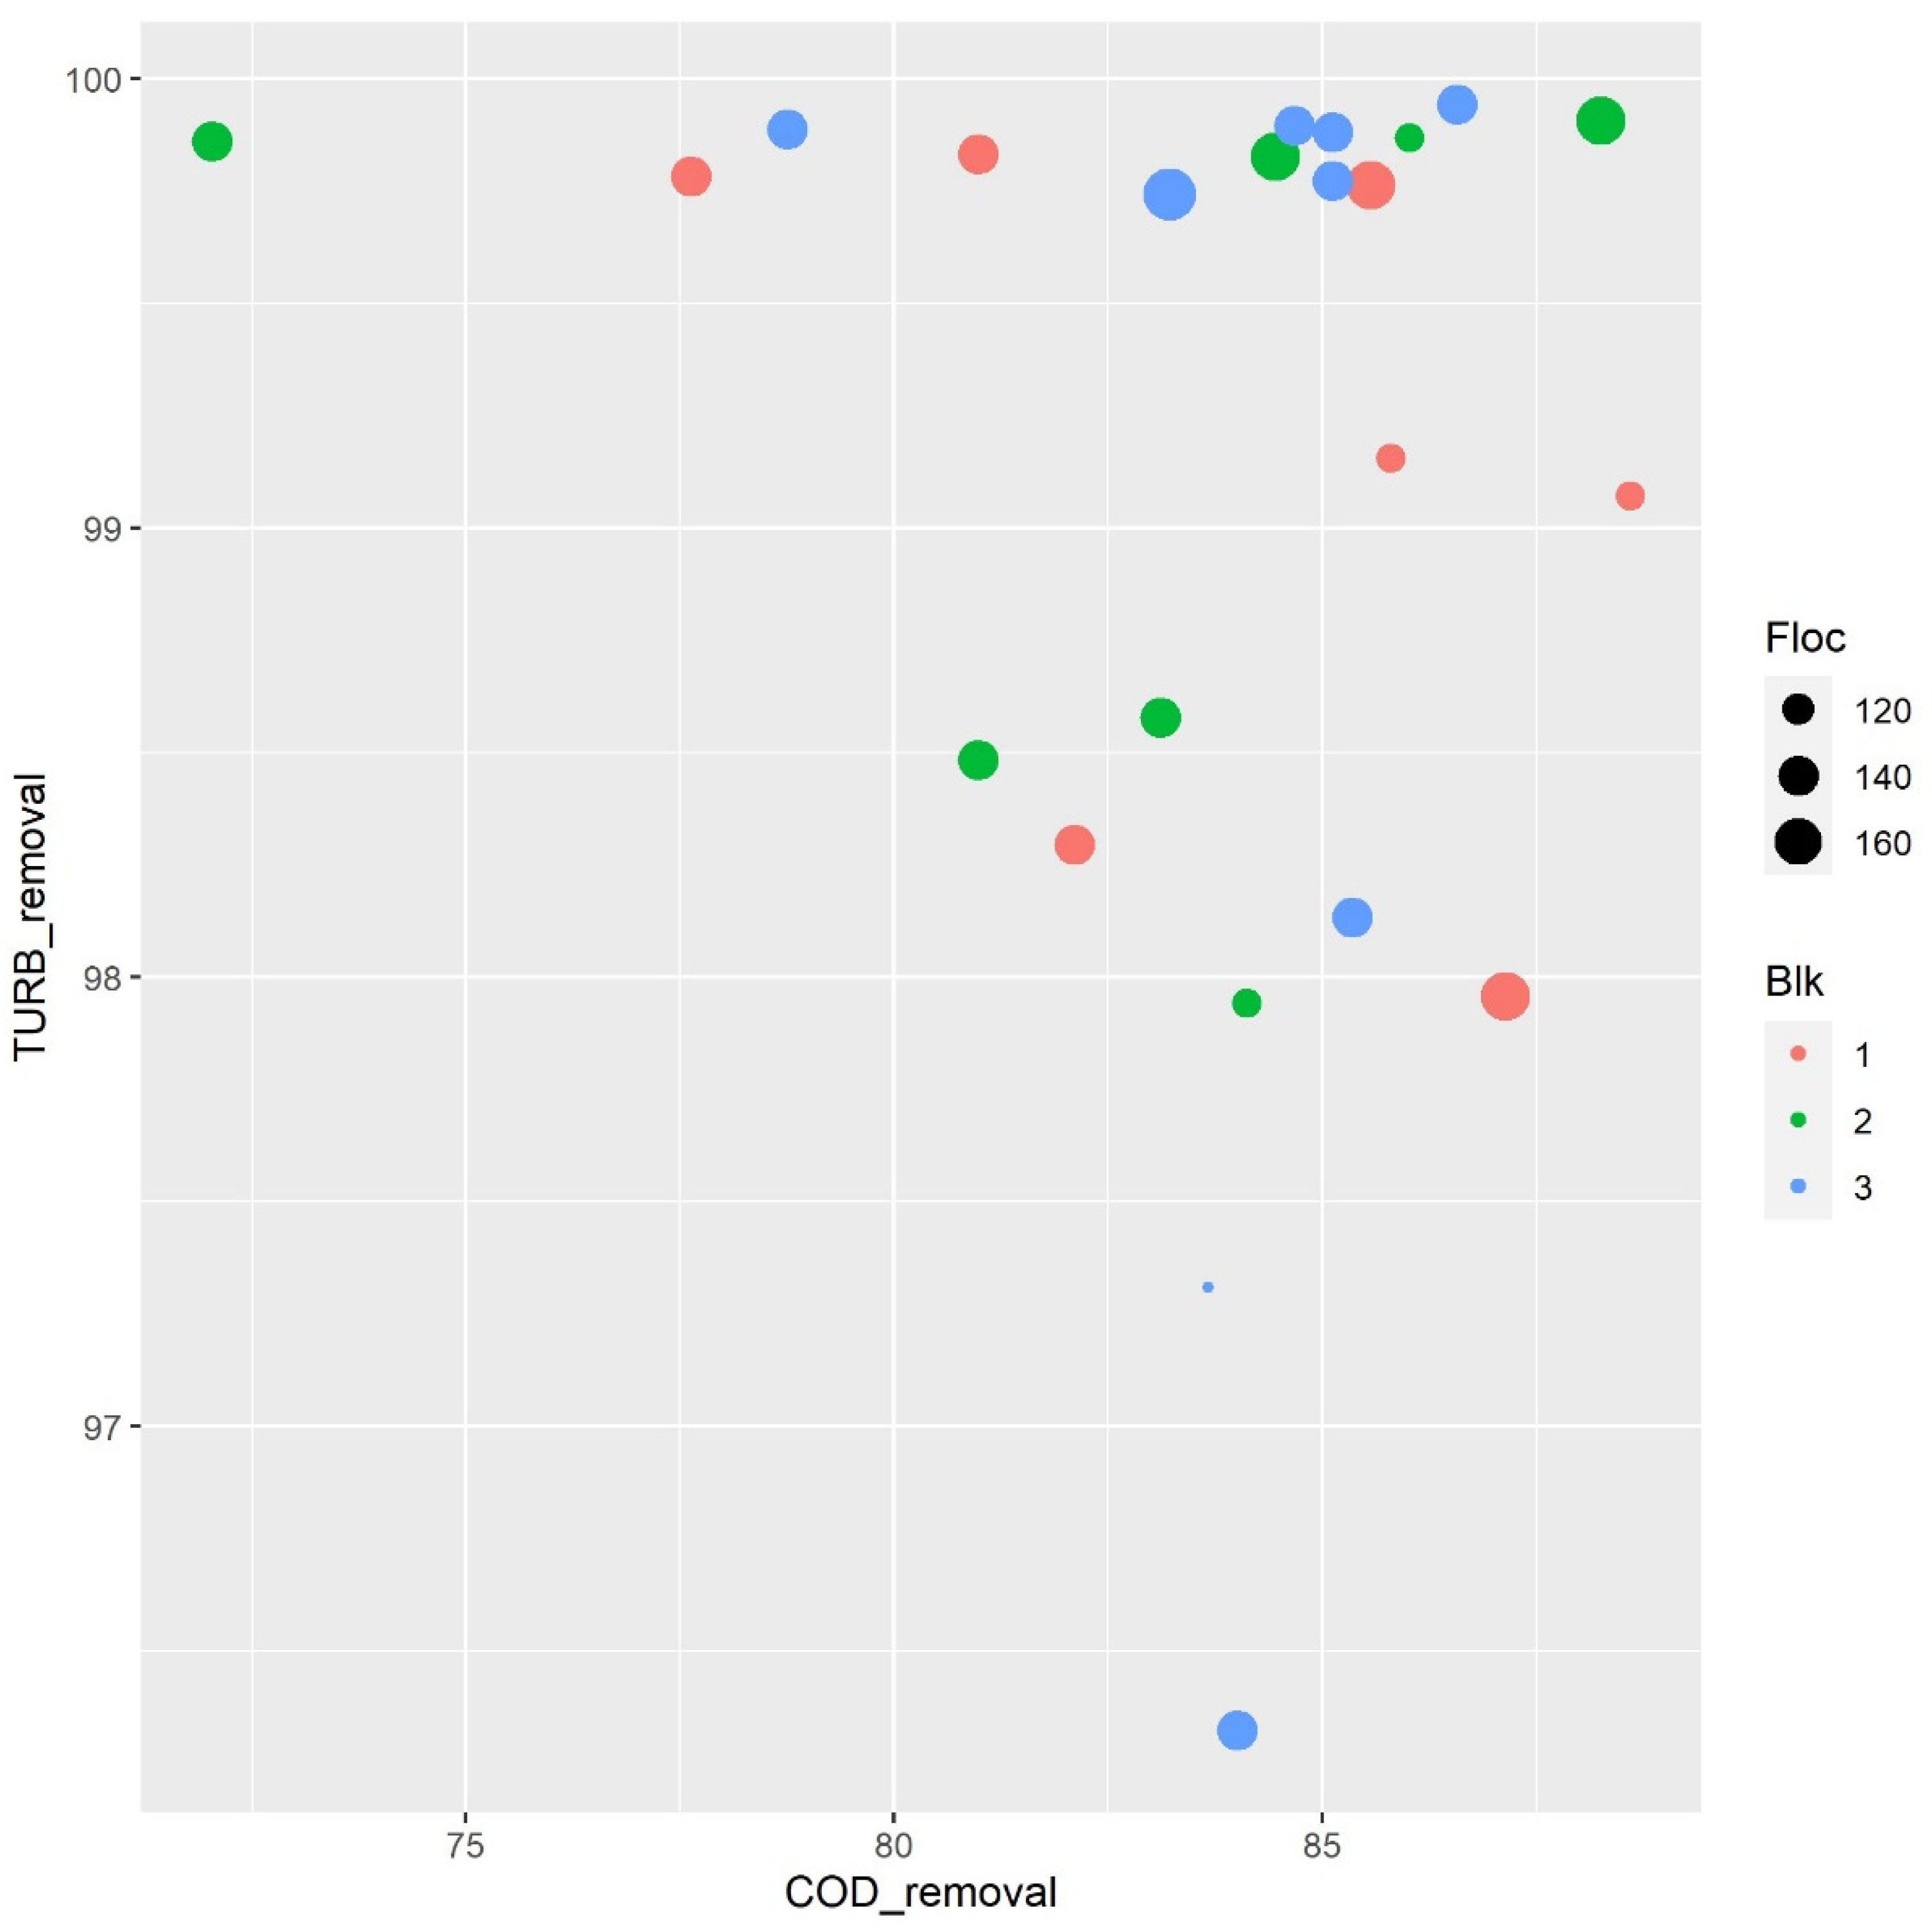
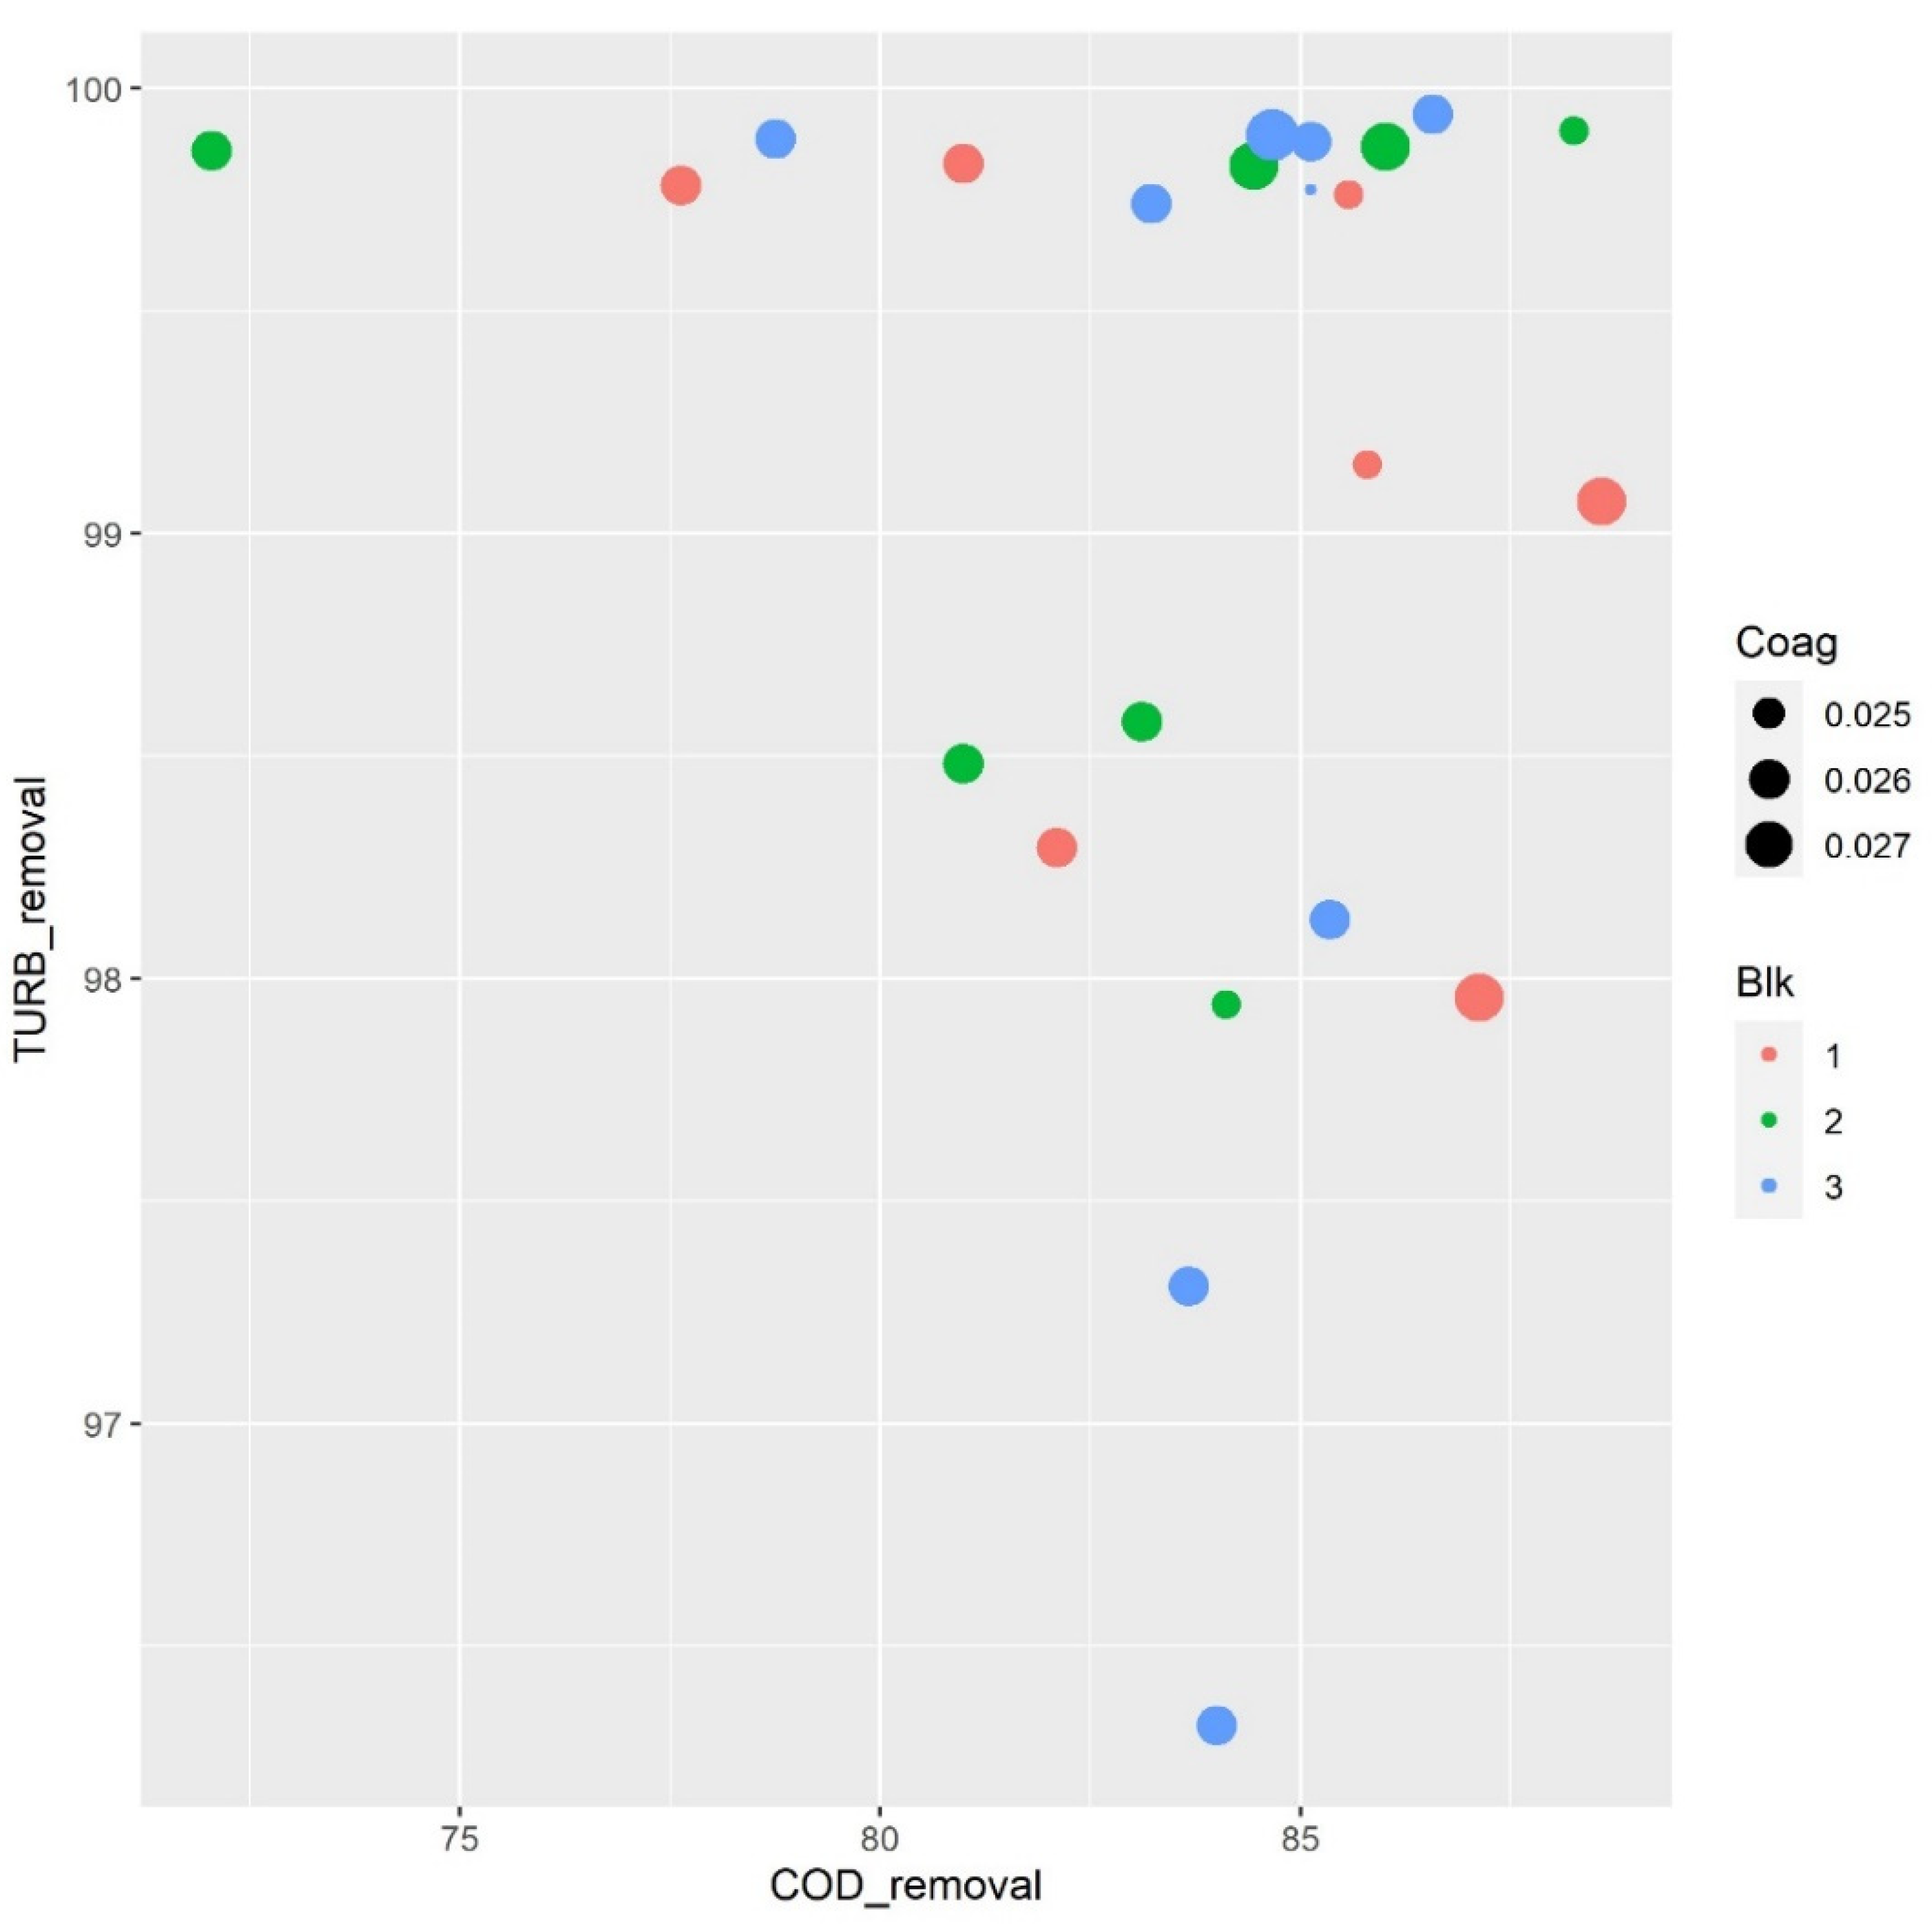
The two figures (Figure 2 and Figure 3) show the joint variation of the two responses of COD and turbidity removal, where the size of the points relates to each of the three factors. The influence of different dosages of flocculent and coagulant on turbidity and COD removal efficiency is shown in Figure 2. The “not significant” message that shows the statistical model indicates that the flocculent concentration has no significant effect on COD and turbidity removal. The two responses maintained a high reduction rate using all the different flocculent concentrations of the selected range. The minimum percentage of COD removal is more than 70%, and the minimum turbidity is 93%. Therefore, according to the results shown in Figure 2 and Table 4, the flocculent concentration range has no significant effect on the two responses. Therefore, it can be ignored as a variable.
Many authors, including [42,43], agree that changing the coagulant dosage is an effective factor in COD reduction. As can be seen from Figure 3, COD removal efficiency varies between 72% and 89%; therefore, the coagulant concentration has a significant effect on COD reduction. The turbidity reduction percentage is high for all the coagulant concentrations, while the minimum reduction percentage is around 98%. On that account, the range of the coagulant concentration has no significant effect on the turbidity removal, but it affects COD removal.
Based on Figure 2 and Figure 3, flocculent does not significantly affect COD or turbidity removal, while coagulant dose affects only COD removal. The flocculent concentration can be ignored as a variable and can be chosen directly from Table 4 which contains the optimal conditions of the coagulant dose and pH.

3.2.2. Effects of pH Parameter on Turbidity and COD Removal

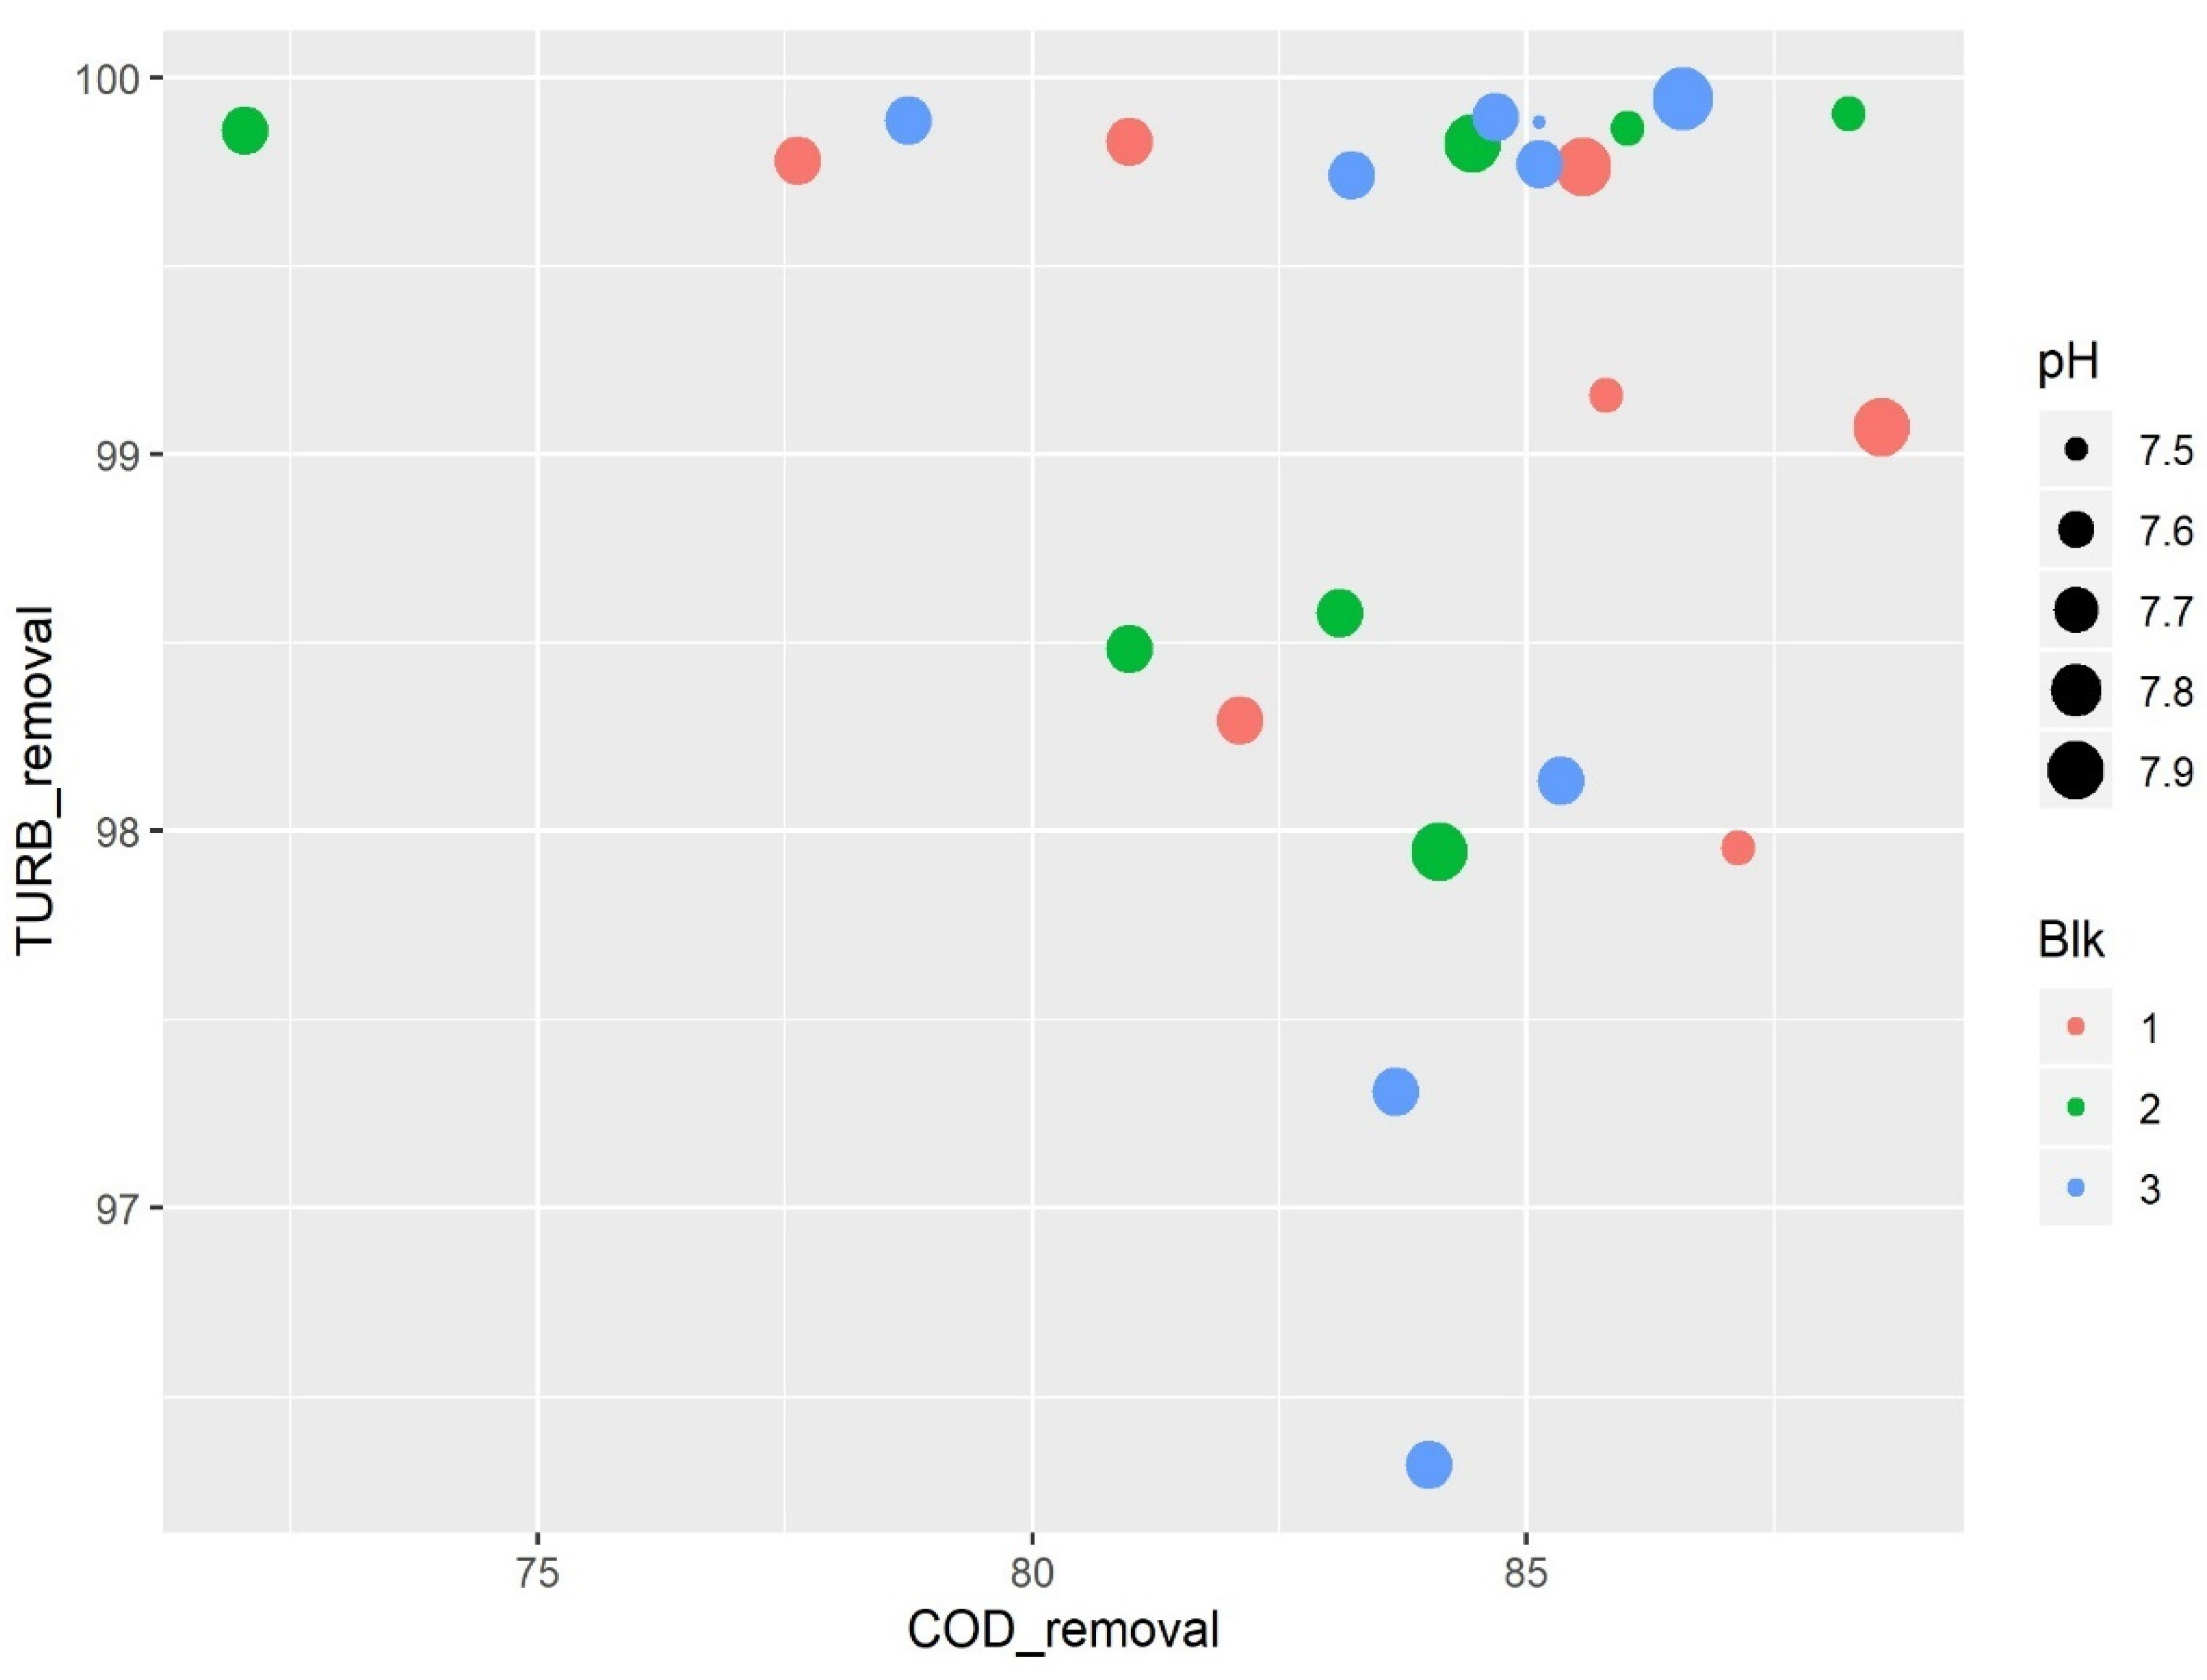
In addition to coagulant and flocculent parameters, pH also can highly affect turbidity and COD removal, and it can be an important parameter in the coagulation of organic matter [44]. Figure 4 shows the effect of pH on turbidity and COD percentage removal. Many authors [42,45] agree that the pH influences the reduction in COD and turbidity.
The pH range proposed by our experiment plan was too small to have any significant effects on the turbidity response, but it retained high percentages of 96–99% COD removal for pH ranging from 7.4 to 8.
In contrast, the small pH range has a significant effect on the COD removal, confirming the findings of [42,43,45], achieving 71% as the minimum percentage removal and around 90% as the maximum percentage removal. The best COD reduction yields were observed at two different pH ranges, with a significant reduction of almost 90%. This reduction can be interpreted as the removal of the organic matter under the effect of chloride ferric [44].
On that account, and based on Figure 4, the response turbidity can be ignored due to its high percentage in different pH values and coagulant and flocculent concentrations proposed by the statistical model (Table 4). Thus, our focus was more on the COD reduction that shows a greater variability. Hence, based on Figure 2, Figure 3 and Figure 4, choosing the optimal points depends on only two variables, pH and coagulant concentration, and on only one response, COD removal.

3.2.3. Influence of the Two Variables, Coagulant Concentration and pH, on COD Response

As reported by [41], pH is one of the most important factors in the coagulation process. At the optimal pH, the coagulant normally produces the most efficient hydrolysis species, which is responsible for pollutant removal. From Figure 4 and Figure 5, it is clear that pH and coagulant concentrations have a great effect on COD removal.
The results shown in Figure 5 indicate that initially, COD removal increases in two different ranges of pH. The first range is below pH 7.6, where COD removal reaches 91%, and the second range is pH up to 7.9, where COD removal also reaches up to 91%. In contrast, in the range between 7.6 and 7.9, the COD removal has the minimum value, which is between 82% and 85%; therefore, the figure explains the pH range function of the chloride iron coagulant described previously.
The coagulant doses proposed by the experimental design are between 0.024 mol L−1 and 0.028 mol L−1, using 0.026 mol L−1 as the center of the design. Regarding Figure 5, two coagulant dose ranges yield the same results at pH below 7.5 and above 7.9. The first range is between 0.024 and 0.025 mol L−1, and the second is 0.027–0.028 mol L−1, while between 0.025 and 0.027 mol L−1, COD removal could not reach more than 87% as the maximum, with 82% as the minimum.
The COD removal increases with the coagulant doses and decreases with doses above the optimum, according to several researchers [45,46,47]. Sometimes, the above-optimal dose can give the same results as the optimum but with higher sludge volume and certainly a higher cost [48,49].
Therefore, choosing the smallest concentration as the optimal dose can be explained with the objective of reducing the dosing costs and the sludge volume in the treatment process [48,49]. That said, 0.024 mol L−1 is the optimal concentration for the coagulant.
As can be seen in Figure 5, COD removal could reach 82% to 88% in two different pH ranges, around 7.5 and above 7.9; hence, choosing a unique pH value is necessary. Acidification has been demonstrated as an effective way to reduce GHG and NH3 emissions [50]; therefore, acidification by adding chemical agents such as ferric chloride (FeCl3) and achieving the pH closest to 5.5 will reduce GHG and NH3 [50,51]. Based on this scenario, we chose the smallest pH value, 7.5, as the optimal pH to treat our pig slurry.
Therefore, based on Figure 2, Figure 3, Figure 4 and Figure 5, the coagulant dose of 0.024 mol L−1 and pH level of 7.5 are the optimal conditions to treat our slurry, considering that the flocculent concentration is not a significant variable.

4. Conclusions

In this work, a coagulation–flocculation process with chloride ferric as the coagulant and DKFLOCC-1598 as the cationic flocculant was used for the treatment of pig slurry and was found to be a highly effective treatment for this type of pig slurry. To minimize turbidity and COD, a central composite design method (CCD) using the R statistical software was employed to optimize the levels of coagulant dosage, flocculant dosage, and pH.
The results reveal that the optimal conditions for the minimum turbidity and COD were a coagulant dosage of 0.024 mol L−1 and a flocculant dosage of 0.1649 mL L−1 at a pH of 7.5. Regarding the CCD results, these concentrations can achieve 88.25% COD removal and 99% turbidity removal. The verification experiments proved and demonstrated that the CCD approach is appropriate for optimizing the coagulation–flocculation process.
It is also worth mentioning that the high turbidity removal rate of 88% has a positive impact and is highly recommended in terms of minimizing the risk of clogging the CWs.

Author Contributions

Conceptualization, O.E.b. and J.A.A.; methodology, O.E.b. and M.K.; validation; M.K. and T.F.; software, M.K.; funding acquisition A.F.C.; formal analysis, O.E.b. and J.A.A.; investigation, O.E.b. M.A.T. and A.F.C.; resources, J.A.A.; data curation, O.E.b.; writing—original draft preparation, J.A.A. and O.E.b.; writing—review and editing, O.E.b. and J.A.A.; visualization, O.E.b. and J.A.A.; supervision, J.A.A. All authors have read and agreed to the published version of the manuscript.

Funding

This research was funded by Grupo Fuertes (CEFUSA), Region of Murcia, Spain.

Informed Consent Statement

Written informed consent was obtained from the participants and guardians of underage participants to publish this paper.

Data Availability Statement

https://emfoca.upct.es/catedra-info/cefusa (accessed on 25 June 2021).

Conflicts of Interest

The authors declare no conflict of interest. The funders had no role in the design of the study; in the collection, analyses, or interpretation of data; in the writing of the manuscript, or in the decision to publish the results.

References

  1. MAPA. Sector Porcino en España. Available online: https://www.mapa.gob.es/va/ganaderia/temas/produccion-y-mercados-ganaderos/sectores-ganaderos/porcino/ (accessed on 25 June 2021).
  2. Lopez-Ridaura, S.; van der Werf, H.; Paillat, J.M.; Le Bris, B. Environmental evaluation of transfer and treatment of excess pig slurry by life cycle assessment. J. Environ. Manag. 2009, 90, 1296–1304. [Google Scholar] [CrossRef]
  3. Krapac, I.G.; Dey, W.S.; Roy, W.R.; Smyth, C.A.; Storment, E.; Sargent, S.L.; Steele, J.D. Impacts of swine manure pits on groundwater quality. Environ. Pollut. 2002, 120, 475–492. [Google Scholar] [CrossRef]
  4. Hoeve, M.T. Life cycle assessment of pig slurry treatment technologies for nutrient redistribution in Denmark. J. Environ. Manag. 2014, 132, 60–70. [Google Scholar] [CrossRef] [PubMed]
  5. Lecomte, T.; Ferrería de la Fuente, J.F.; Neuwahl, F.; Canova, M.; Pinasseau, A.; Jankov, I.; Brinkmann Serge Roudier, T.; Delgado Sancho, L. Best Available Techniques (BAT) Reference Document for Large Combustion Plants; Publications Office of the European Union: Luxembourg, 2017; ISBN 9789279743030. [Google Scholar]
  6. Caselles-Osorio, A.; Puigagut, J.; Segú, E.; Vaello, N.; Granés, F.; García, D.; García, J. Solids accumulation in six full-scale subsurface flow constructed wetlands. Water Res. 2007, 41, 1388–1398. [Google Scholar] [CrossRef]
  7. Hjorth, M.; Christensen, M.L.; Christensen, P.V. Flocculation, coagulation, and precipitation of manure affecting three separation techniques. Bioresour. Technol. 2008, 99, 8598–8604. [Google Scholar] [CrossRef] [PubMed]
  8. Knowles, P.; Dotro, G.; Nivala, J.; García, J. Clogging in subsurface-flow treatment wetlands: Occurrence and contributing factors. Ecol. Eng. 2011, 37, 99–112. [Google Scholar] [CrossRef]
  9. Pedescoll, A.; Corzo, A.; Álvarez, E.; García, J.; Puigagut, J. The effect of primary treatment and flow regime on clogging development in horizontal subsurface flow constructed wetlands: An experimental evaluation. Water Res. 2011, 45, 3579–3589. [Google Scholar] [CrossRef]
  10. De la Varga, D.; Díaz, M.A.; Ruiz, I.; Soto, M. Avoiding clogging in constructed wetlands by using anaerobic digesters as pre-treatment. Ecol. Eng. 2013, 52, 262–269. [Google Scholar] [CrossRef]
  11. Zhu, K.; Gamal El-Din, M.; Moawad, A.K.; Bromley, D. Physical and Chemical Processes for Removing Suspended Solids and Phosphorus from Liquid Swine Manure. Environ. Technol. 2004, 25, 1177–1187. [Google Scholar] [CrossRef] [PubMed]
  12. Ndegwa, P.; ZhuJun, J.; Luo, Z. Effects of Solid Levels and Chemical Additives on Removal of Solids and Phosphorus in Swine Manure. J. Environ. Eng. 2001, 127, 1111–1115. [Google Scholar] [CrossRef] [Green Version]
  13. Azimi, S.C.; Shirini, F.; Pendashteh, A. Treatment of wood industry wastewater by combined coagulation–flocculation–decantation and fenton process. Water Environ. Res. 2021, 93, 433–444. [Google Scholar] [CrossRef]
  14. Dosta, J.; Rovira, J.; Galí, A.; Macé, S.; Mata-Álvarez, J. Integration of a Coagulation/Flocculation step in a biological sequencing batch reactor for COD and nitrogen removal of supernatant of anaerobically digested piggery wastewater. Bioresour. Technol. 2008, 99, 5722–5730. [Google Scholar] [CrossRef] [PubMed]
  15. Amokrane, A.; Comel, C.; Veron, J. Landfill leachates pretreatment by coagulation-flocculation. Water Res. 1997, 31, 2775–2782. [Google Scholar] [CrossRef]
  16. Samadi, M.T.; Saghi, M.H.; Rahmani, A.; Hasanvand, J.; Rahimi, S.; Syboney, M.S. Hamadan Landfill Leachate Treatment By Coagulation-Flocculation Process. Iran. J. Environ. Health Sci. Eng. 2010, 7, 253–258. [Google Scholar]
  17. Christensen, M.L.; Hjorth, M.; Keiding, K. Characterization of pig slurry with reference to flocculation and separation. Water Res. 2009, 43, 773–783. [Google Scholar] [CrossRef]
  18. Hjorth, M.; Jørgensen, B.U. Polymer flocculation mechanism in animal slurry established by charge neutralization. Water Res. 2012, 46, 1045–1051. [Google Scholar] [CrossRef]
  19. Liu, Z.; Carroll, Z.S.; Long, S.C.; Gunasekaran, S.; Runge, T. Use of cationic polymers to reduce pathogen levels during dairy manure separation. J. Environ. Manag. 2016, 166, 260–266. [Google Scholar] [CrossRef] [Green Version]
  20. Hjorth, M.; Christensen, K.V.; Christensen, M.L.; Sommer, S.G. Solid-liquid separation of animal slurry in theory and practice. A review. Agron. Sustain. Dev. 2010, 30, 153–180. [Google Scholar] [CrossRef] [Green Version]
  21. Kurniawan, T.A.; Hung, W.; Chan, G.Y.S. Physico-chemical treatments for removal of recalcitrant contaminants from landfill leachate. J. Hazard. Mater. 2006, 129, 80–100. [Google Scholar] [CrossRef] [PubMed]
  22. APHA. American Public Health Association. Available online: https://www.apha.org/ (accessed on 25 June 2021).
  23. Islam, M.M.M.; Shafi, S.; Bandh, S.A.; Shameem, N. Impact of environmental changes and human activities on bacterial diversity of lakes. In Freshwater Microbiology; Perspectives of Bacterial Dynamics in Lake Ecosystems; Academic Press: Cambridge, MA, USA, 2019; pp. 105–136. [Google Scholar] [CrossRef]
  24. Licciardello, F.; Aiello, R.; Alagna, V.; Iovino, M.; Ventura, D.; Cirelli, G.L. Assessment of clogging in constructed wetlands by saturated hydraulic conductivity measurements. Water Sci. Technol. 2019, 79, 314–322. [Google Scholar] [CrossRef] [PubMed]
  25. Climate Data. Available online: https://es.climate-data.org/europe/espana/region-de-murcia/murcia-3214/ (accessed on 20 March 2021).
  26. APHA. Standard Methods for the Examination of Water and Wastewater, 21st ed.; APHA: Washington, DC, USA, 2005. [Google Scholar]
  27. Boursier, H.; Béline, F.; Paul, E. Piggery wastewater characterisation for biological nitrogen removal process design. Bioresour. Technol. 2005, 96, 351–358. [Google Scholar] [CrossRef] [PubMed]
  28. Antezana, W.; Calvet, S.; Beccaccia, A.; Ferrer, P.; García-Rebollar, P.; Cerisuelo, A. Effects of nutrition on digestion efficiency and gaseous emissions from slurry in growing pigs: III. Influence of varying the dietary level of calcium soap of palm fatty acids distillate with or without orange pulp supplementation. Anim. Feed Sci. 2015, 209, 128–136. [Google Scholar] [CrossRef] [Green Version]
  29. ProvoloL, G.; Suller, L.M. In situ determination of slurry nutrient content by electrical conductivity. Bioresour. Technol. 2007, 98, 3235–3242. [Google Scholar] [CrossRef] [PubMed]
  30. Yagüe, M.R.; Bosch-Serra, Á.D.; Antúnez, M.; Boixadera, J. Pig slurry and mineral fertilization strategies’ effects on soil quality: Macroaggregate stability and organic matter fractions. Sci. Total Environ. 2012, 438, 218–224. [Google Scholar] [CrossRef] [Green Version]
  31. Montgomery, D.C. Design and Analysis of Experiments, 10th ed.; John Wiley & Sons: Hoboken, NJ, USA, 2019. [Google Scholar]
  32. Sánchez, M.; González, J.L. The fertilizer value of pig slurry. I. Values depending on the type of operation. Bioresour Technol. 2005, 96, 1117–1123. [Google Scholar] [CrossRef] [PubMed]
  33. Omotoso, S. Olusegun Influence of NPK 15-15-15 Fertilizer and Pig Manure on Nutrient Dynamics and Production of Cowpea, Vigna Unguiculata L. Walp. Am. J. Agric. For. 2014, 2, 267. [Google Scholar] [CrossRef]
  34. Terrero, M.A.; Muñoz, M.Á.; Faz, Á.; Gómez-López, M.D.; Acosta, J.A. Efficiency of an integrated purification system for pig slurry treatment under mediterranean climate. Agronomy 2020, 10, 208. [Google Scholar] [CrossRef] [Green Version]
  35. Kowalski, Z.; Makara, A.; Fijorek, K. Changes in the properties of pig manure slurry. Acta Biochim. Pol. 2013, 60. [Google Scholar] [CrossRef] [Green Version]
  36. EPA United States Environmental Protection Agency. Available online: https://iaspub.epa.gov/tdb/pages/treatment/treatmentOverview.do?treatmentProcessId=1934681921 (accessed on 5 February 2021).
  37. Stumm, V.; O’Melia, C. Stoechiometry of coagulation. In Water Works Association; John Wiley & Sons: Hoboken, NJ, USA, 1968; pp. 514–539. [Google Scholar]
  38. R Core Team. The R Project for Statistical Computing. Available online: https://www.r-project.org/ (accessed on 5 February 2021).
  39. Lenth, R.V. Response-Surface Methods in R, Using rsm. J. Stat. Softw. 2009, 32, 1–17. [Google Scholar] [CrossRef] [Green Version]
  40. O’Melia, C.R. Review of coagulation process. J. Am. Water Works Assoc. 1969, 219–268. [Google Scholar] [CrossRef]
  41. Bratby, J. Coagulation and Flocculation in Water and Wastewater Treatment, 2nd ed.; IWA Publishing: London, UK, 2006. [Google Scholar]
  42. Al-Hamadani, Y.A.J.; Yusoff, M.S.; Umar, M.; Bashir, M.J.K.; Adlan, M.N. Application of psyllium husk as coagulant and coagulant aid in semi-aerobic landfill leachate treatment. J. Hazard. Mater. 2011, 190, 582–587. [Google Scholar] [CrossRef] [PubMed]
  43. Rasool, M.A.; Tavakoli, B.; Chaibakhsh, N.; Pendashteh, A.R.; Mirroshandel, A.S. Use of a plant-based coagulant in coagulation-ozonation combined treatment of leachate from a waste dumping site. Ecol. Eng. 2016, 90, 431–437. [Google Scholar] [CrossRef]
  44. Boughou, N.; Majdy, I.; Cherkaoui, E.; Khamar, M.; Nounah, A. Effect of pH and time on the treatment by coagulation from slaughterhouse of the city of Rabat. MATEC Web Conf. 2018, 149, 2–5. [Google Scholar] [CrossRef]
  45. Irfan, M.; Butt, T.; Imtiaz, N.; Abbas, N.; Khan, R.A.; Shafique, A. The removal of COD, TSS and colour of black liquor by coagulation–flocculation process at optimized pH, settling and dosing rate. Arab. J. Chem. 2017, 10, S2307–S2318. [Google Scholar] [CrossRef] [Green Version]
  46. Tahereh Zarei, M.; Ali Asghar, E.; Hadi, E.; Mehdi, M.; Mohammad Hossein, S.; Mohammad Taghi, G.; Morteza, M.; Mohsen, P. Optimization and economic evaluation of modified coagulation–flocculation process for enhanced treatment of ceramic-tile industry wastewater. AMB Express 2018, 8, 172. [Google Scholar] [CrossRef]
  47. Tawakkoly, B.; Alizadehdakhel, A.; Dorosti, F. Evaluation of COD and turbidity removal from compost leachate wastewater using Salvia hispanica as a natural coagulant. Ind. Crops Prod. 2019, 137, 323–331. [Google Scholar] [CrossRef]
  48. Patel, H.; Vashi, R.T. Comparison of naturally prepared coagulants for removal of COD and color from textile wastewater. Glob. Nest J. 2013, 15, 522–528. [Google Scholar] [CrossRef] [Green Version]
  49. Subramonian, W.; Wu, T.Y. Effect of enhancers and inhibitors on photocatalytic sunlight treatment of methylene blue. Water. Air. Soil Pollut. 2014, 225, 1922. [Google Scholar] [CrossRef] [Green Version]
  50. Kavanagh, I.; Burchill, W.; Healy, M.G.; Fenton, O.; Krol, D.J.; Lanigan, G.J. Mitigation of ammonia and greenhouse gas emissions from stored cattle slurry using acidifiers and chemical amendments. J. Clean. Prod. 2019, 237, 117822. [Google Scholar] [CrossRef]
  51. Husted, S.; Husted, S. A simple model of ph in slurry. J. Agric. Sci. 1995, 124, 447–453. [Google Scholar] [CrossRef]
Figure 1. Scheme of the pretreatment system with (a) separation phase, (b) vertical decantation, (c) first filtration at 1000 µm, (d) second filtration at 250 µm, and (e) horizontal decantation, (f) CW inlet.
Agronomy 11 02158 g001
Figure 2. Effect of flocculent concentration on COD and turbidity removal. Floc: Flocculent concentration (120 µL, 140 µL,160 µL);Blk: Blocks number (Blk1,Blk2, Blk3).
Agronomy 11 02158 g002
Figure 3. Effect of coagulant concentration on COD and turbidity removal. Coag: coagulation concentration 0.025, 0.026, 0.027 mol L−1); Blk: Blocks number (Blk1, Blk2, Blk3).
Agronomy 11 02158 g003
Figure 4. Effect of pH on COD and turbidity removal. COD: chemical oxygen demand, TURB: Turbidity; Blk: Blocks number (Blk1, Blk2, Blk3).
Agronomy 11 02158 g004
Figure 5. Effect of pH and coagulant concentration on COD removal. Coag: Coagulant, pH: potential hydrogen.
Agronomy 11 02158 g005
Table 1. Characterization of raw and treated pig slurry.
Raw Pig SlurryAfter Pretreatment (The Five-Step Process)After Treatment with CF Process in Optimal Conditions
pH7.637.886.4
EC (ms cm −1)9.108.768
SM (g L−1)80300
BOD5 (mg L−1)53004200400
COD (g L−1)11.28.941.29
Turbidity (NTU)350021102.11
Table 3. Experiment design table results.
Run OrderCoag
mol L−1
Floc
µL
pHBlk
10.0248164.97.901
20.0260140.07.741
30.0248115.17.581
40.0260140.07.741
50.0272115.17.901
60.0272164.97.581
70.0260140.07.741
10.0272115.17.582
20.0260140.07.742
30.0260140.07.742
40.0272164.97.902
50.0260140.07.742
60.0248164.97.582
70.0248115.17.902
10.0260180.07.743
20.0240140.07.743
30.0260140.07.743
40.0280140.07.743
50.0260140.07.743
60.0260140.07.743
70.0260140.08.003
80.0260100.07.743
90.0260140.07.483
Table 4. Composition of various experiments of the central composite design, COD reduction, and turbidity removal responses for pig slurry treatment.
Run OrderCoag
mol L −1
Floc
µL
pH% COD
Removal
% TURB
Removal
10.024164.947.9085.5799.76
20.0261407.7482.1098.29
30.024115.067.5785.7999.15
40.0261407.7480.9899.83
50.027115.067.9088.5999.07
60.027164.947.5787.1397.95
70.0261407.7477.6299.78
10.027115.067.5786.0199.86
20.0261407.7483.1098.57
30.0261407.7472.0399.86
40.027164.947.9084.4599.82
50.0261407.7480.9898.48
60.024164.947.5788.2599.90
70.024115.067.9084.1197.94
10.026179.997.7483.2299.74
20.0241407.7485.1299.77
30.0261407.7485.3498.13
40.0281407.7484.6799.89
50.0261407.7484.0096.32
60.0261407.7478.7499.88
70.0261407.9986.5799.94
80.0261007.7483.6697.30
90.0261407.4885.1299.88
Publisher’s Note: MDPI stays neutral with regard to jurisdictional claims in published maps and institutional affiliations.