Article

Blueberry Yield and Soil Mineral Nitrogen Response to Nitrogen Fertilizer and Nitrification Inhibitors under Drip-Fertigation Systems

1
Agriculture and Agri-Food Canada, Agassiz Research and Development Centre, 6947 Highway 7, P.O. Box 1000, Agassiz, BC V0M 1A0, Canada
2
Centre de Recherche et d’Innovation sur les Végétaux (CRIV), Département de Phytologie, Faculté des Sciences de l’Agriculture et de l’Alimentation, Pavillon Envirotron, Local 2021, Université Laval, Québec, QC G1V 0A6, Canada
*
Author to whom correspondence should be addressed.
Agronomy 2021, 11(11), 2144; https://doi.org/10.3390/agronomy11112144
Submission received: 2 October 2021 / Revised: 21 October 2021 / Accepted: 22 October 2021 / Published: 26 October 2021

Abstract

:
In blueberry plantings, nitrification can result in losses of mineral nitrogen (N) through leaching because blueberries prefer ammonium (NH4+) over nitrate (NO3). The objective of this study was to assess the effects of two rates of N fertilizer, mixed or not with nitrification inhibitors (NI) and applied through two fertigation systems, on berry yield and the concentrations of NH4+-N and NO3-N along the soil profile. Thus, nine combinations of treatments including two N fertilizer rates (60 and 120 kg N ha−1), two NI (with DCD + Nitra-pyrin or without) and two fertigation application methods (buried and suspended drip lines) and a control (0 kg N ha−1) were tested over three years (2016–2018) in a long-term blueberry planting. Berry yield was on average 47.32 Mg ha−1 in 2016 and 26.86 Mg ha−1 in 2018. In 2017, berry yield varied between 8.60 Mg ha−1 under the control and 11.66 Mg ha−1 with 120 kg N ha−1 applied through suspended drip lines. Low berry yield in 2017 was due to a heavy pruning to rejuvenate the plants. In 2016, the concentration of NH4+-N in the sawdust mulch layer varied between 13.1 and 27.1 mg kg−1 in the spring, 11.4 and 32.1 mg kg−1 in the summer, and 7.9 and 72.9 mg kg−1 in the fall; the concentration of high NH4+-N along the soil profile did not exceed 5 mg kg−1. High concentrations of NH4+-N in the sawdust mulch layer were associated with NI, but did not translate to high berry yields. The concentration of NO3-N in the soil profile reached 42.6 mg kg−1 in the summer and 39.0 mg kg−1 in the fall and these high concentrations were associated with NI. In 2017 and 2018, there was no effect of NI on NH4+-N concentrations even in the layer of sawdust mulch which was not consistent with the results obtained in 2016. High concentrations of NO3-N were measured beneath the sawdust mulch layer with treatments including N fertilizer alone or mixed with NI. It is possible that NH4+ retained in the layer of sawdust mulch and not taken up by plant roots was subsequently oxidized to NO3 at the end of the residence time of NI in the soil. Our results showed that high concentrations of NO3-N along the soil profile occurred mainly during the summer which could be explained by irrigation water driving NO3 leaching.

1. Introduction

Nitrogen (N) fertilization is a key management practice in agricultural production systems. Ammonium (NH4+) based fertilizers applied to soils are transformed through nitrification into NO3 via nitrite (NO2) by nitrifying microorganisms [1,2]. This process is key for most plants with a preference for NO3 absorption, but poses a risk for the environment because residual soil NO3 not absorbed by plant roots is likely to be lost through leaching into surface and ground waters [3]. In addition, residual soil NO3 is susceptible to conversion into gaseous form by denitrification and be lost through nitrous oxide (N2O) emissions, contributing to greenhouse gas in the atmosphere [4].
Nitrification inhibitors (NI) represent a group of chemical compounds which when applied to soils slow the microbial oxidation of NH4+ to NO3, thus reducing N loss and enhancing N use efficiency [5]. The main NIs, dicyandiamide (DCD) and 2-chloro-6-(trichloromethyl)-pyridine (Nitra-pyrin), are widely used and have been shown to be successful at delaying the oxidation of NH4+ to NO3 in agricultural systems [6,7,8,9,10]. The DCD is a co-chelating agent that acts on ammonia monooxygenase [11] and the Nitra-pyrin suppresses the activity of ammonia oxidizers by blocking the enzymatic pathway of ammonia monooxygenase [12,13]. Guardia et al. [14] showed that DCD decreased NO3-N compared to the no NI treatment in a calcareous sandy clay loam Calcic Haploxerept and a sandy clay loam textured Typic Eutrudepts in a laboratory-scale incubation experiment. Min et al. [10] in a study aiming at understanding N-dynamic pathways in order to achieve practical, useful recommendations recently showed that application of urea and Nitrapyrin significantly decreased N leaching by 37, 27 and 28% and soil residual NO3-N contents by 34, 44 and 44%, under lettuce, celery, and tomato, respectively. In a meta-analysis including data from 62 field studies with grain, straw, vegetable, and pasture hay, the use of NI increased NH4+-N and decreased NO3-N concentrations in the soil [7]. In contrast, Li et al. [9] found no effect of NI on seed and lint yield in cotton production under drip-fertigation in a dry climate.
Ammonium sulfate fertilizer is widely used in blueberry production systems in British Columbia (BC), Canada [15,16]. This N fertilizer source has two major advantages for blueberries: first, it breaks down rapidly to NH4+, the preferred form taken up by blueberry plants; second, SO42− maintains low soil pH favorable for blueberry growth and development [17]. In recent years, studies have shown that application of (NH4)2SO4 fertilizers above recommended rates [18] increases the soil electrical conductivity (EC) and further decreases the soil pH below the thresholds (pH = 4.5–5.5) suitable for blueberry growth [15,19]. This process is further enhanced by fertigation through which dissolved NH4+ and SO42− quickly move through the layer of sawdust mulch to the soil beneath resulting in high residual soil NO3-N and soil property changes, including low soil pH and high EC [15]. High concentrations of NH4+, NO3, and SO42− were measured in leachate waters collected under blueberry plantings in relation with applications of (NH4)2SO4 fertilizers above recommended rates [16]. Altogether, the use of (NH4)2SO4 fertilizers in blueberry production is not efficient because nitrification oxidizes NH4+ to NO3.
In recent years, fertigation and drip irrigation systems have extensively evolved due to their benefits in improving water management and N use efficiency. These systems also offer the possibility to use water soluble N fertilizers such as urea in split applications to synchronize N supply with blueberry N needs [20,21] and reduce risks related to N leaching. However, for blueberry crops with sawdust mulch, it remains unclear whether the mixture of urea, DCD and Nitrapyrin can delay the conversion of NH4+ to NO3 to match and synchronize blueberry N needs under drip-fertigation systems. The objective of this study was to assess the effects of N fertilizer mixed with NI applied through drip-fertigation on berry yield and the concentrations of NH4+-N and NO3-N along the soil profile. We hypothesize that (1) the addition of NI would increase the concentration of NH4+-N in the soil and increase blueberry production; (2) the addition of NI would reduce the amount of N fertilizer through reduction of NH4+-N transformation into NO3-N; and (3) buried drip tape would increase the availability of NH4+-N in the soil and increase blueberry production.

2. Materials and Methods

2.1. Site Description

The blueberry crop was established in 2006 at Agassiz Research and Development Centre, Agriculture and Agri-Food Canada (49°14′ N, 121°45′ W). The silt loam soil of the Monroe series (Typic Dystroxerepts under U.S. Soil Taxonomy) [22] used for the trial originates from a recent alluvial deposit. The parent material has a coarse texture, a weak profile development and is moderately well-drained and shallow. Until 2006, the site was amended with compost derived from lawn clippings and waste from poultry and greenhouse vegetables. The topsoil at the onset of the experiment was characterized by organic matter 5.27% and mineral N 29 kg ha−1 [15]. The local climate is moderate oceanic with warm, rainy winters and relatively cool, dry summers. The 30 year (1980–2010) average normal daily temperature ranges from 3.2 °C in December to 18.7 °C in August. The 30 year (1980–2010) average annual rainfall is 1689 mm, 261.9 mm of which falls between May and June [23]. Total annual precipitations and average monthly air temperatures were recorded from the Agassiz CDA Station [23].
In spring 2006, the field was prepared by ploughing and disking at depth 20 cm and elemental sulfur (0-0-0-90S; Terralink Horticulture Inc., Abbotsford, BC, Canada) was applied at a rate of 1120 kg ha−1 to adjust the soil pH to 5.0. In fall 2006, the field was subsoiled, and raised beds were prepared in a north-south direction using a bed shaper. The beds were 1 m wide × 0.2 m high and spaced 3.048 m apart. The field was then planted with two-year old highbush blueberry plants cv. Duke, obtained locally (JRT Nurseries, Abbotsford, BC, Canada) with an intra-row of 0.914 m (plant density of 3590 plants ha−1). The Duke variety is an early-season, late-blooming, high-yield and winter-hardy cultivar. After planting, a layer of mulch of approximately 8-cm thick of new Western hemlock and Douglas fir sawdust was topped at the surface of the raised beds. The mulch material was renewed every second year (i.e., 2008, 2010, 2012, 2014, 2016, 2018). All alleys between and around the beds were seeded with a mix of 30% fescue and 70% perennial rye grass (Alleyway Agricultural Mix, Richardson Seed, Abbotsford, BC, Canada).
This trial has evolved with time and has had two modifications to meet specific objectives. At establishment and until 2012, the trial was designed to assess the effects of drip configuration (one or two lines with emitters spaced every 0.3 or 0.45 m) and irrigation intensity (moderate (5 L/plant) or heavy (10 L/plant)) [24]. The experiment consisted of nine irrigation treatments (Table 1) arranged in a randomized complete block design with six blocks. The first modification occurred in 2013–2015 to assess the effects of humic acids (kelp) on berry yield and quality. Briefly, two treatments of humic acid (with and without humic acid) were assigned to four treatments plots (Table 1). Between 2007 and 2015, fertilizers (15-8-11 (Berry Blend fertilizer; TerraLink Inc., Abbottsford, British Columbia, Canada)) were broadcast in two split applications at the surface of the sawdust mulch around the base of the blueberry plants from early April–mid-May. Annual application rates in 2007, 2008, 2009, and 2010, 2011, 2012 were 21, 31, 50, 82, 100, and 111 kg N ha−1 and in 2013–2015 were 144 kg ha−1, respectively [25]. The second modification occurred in 2016 to assess the effects of varying N rates, NI and placement of fertigation lines on blueberry yield and distribution of mineral N along the soil profile. This paper is the object of the second modification and will be described in detail in the following sections.

2.2. Experimental Design and Treatments

For the second modification starting in 2016, eight combinations of two N fertilizer rates (low (60 kg N ha−1) and high (120 kg N ha−1)), two irrigation placement methods (suspended and buried) and two NI (without and with di-cycandiamide (DCD) + 2-chloro-6-(trichloromethyl)-pyridine (Nitra-pyrin)) and a control (0 kg N ha−1 and no NI) for a total of nine treatments (Table 1) were arranged in a randomized complete block design with four replicates. Individual plots consisted of five measurement plants with a guard plant on each end. The N fertilizer used included urea (46-0-0) for the treatments without NI and a stabilized urea N fertilizer (UMAX, Koch Agronomic Services LLC) for the treatments with NI. The N fertilizer treatments were applied by fertigation and consisted of six equal applications beginning at bud break and continuing every week until end-May.
Two lines of drip tape (DLT Heavywall Dripperline, Netafim, Fresno, CA, USA) were installed in each experimental plot. For the suspended irrigation method, these were installed on each side of the raised bed, 19 cm away from the center of the plant row. The two suspended lines of drip tape were fixed to catch wires previously placed at 0.6 m above the sawdust mulch layer. For the buried irrigation method, the two lines of drip tape were buried under the layer of sawdust mulch on each side of the raised bed, 19 cm away from the center of the plant row. The drip lines were equipped with in-line emitters (1 L h−1) spaced 0.45 m apart. Fertigation events were triggered manually and applied using a Harrow Fertigation Manager (Climate Control Systems, Leamington, ON). All fertigation treatments including control (water) were completed within a seven-hour period on the same day. The plants were irrigated in between two fertigation events, usually Monday and Friday, depending on soil moisture conditions. At the end of the fertigation events and depending on soil moisture conditions, all plots received additional irrigation until the end of the growing season. Granular matrix sensors (Watermark Model 900 M, Irrometer Co., Riverside, CA, USA) were used to monitor soil moisture tension and EC-5 sensors (Decagon Devices Inc., Pullman, WA, USA) were used to monitor soil water content. In each treatment plot, two granular matrix sensors and two EC-5 sensors were installed at 30 cm depth below the soil surface. One sensor was placed in the middle of the row and the second sensor was placed directly under the drip tape between two emitters. Every year, all plots received two split applications of 0-20-20 + micronutrients to provide plants with 11.5 kg P ha−1 and 15.8 kg K ha−1 applied as broadcast along each plant’s drip line in early-April and mid-June.
Blueberry plants were pruned in January and February every year according to industry standard [25]. In 2017, plants were pruned heavily to rejuvenate. Casoron herbicide was broadcast at a rate of 175 kg ha−1 to the perimeter of the raised beds in early spring for weed control. Each year at bloom, flowers were removed from guard plants to reduce the workload at harvest and a honeybee hive was placed at the south end of the field to enhance pollination. During berry ripening, bird netting was installed above and around all six blocks. As needed, the grass in all alleys between and around the beds was mown. Pristine (boscalid, pyraclostrobin; BASF Canada Inc., Mississauga, ON, Canada) and Switch (cyprodinil, fludioxonil; Syngenta, Plattsville, ON, Canada) fungicides were sprayed to prevent botrytis blossom rot in spring. Dipel 2XDF (Bacillus thuringiensis; Valent Canada Inc., Guelph, ON, Canada) was sprayed to control Bruce spanworm (Operophtera bruceata) and European leafroller (Archips rosanus) in spring.

2.3. Berry Yield

Berry yield was assessed by harvesting berries twice a year from the five measurement plants in each experimental plots between late-June and late-July. In the first and second harvest, all mature fruits were hand-picked and weighed. During the second harvest, the unripe fruits were harvested to avoid a third hand-picking, due to resource constraints. The total berry yield was calculated as the sum of the first and second harvest, including unripe fruits.

2.4. Sawdust Mulch and Soil Sampling

For each of the three experimental years, three series of soil samples were collected, first in spring, second in summer and third in fall. For each series of soil samples, the layer of sawdust mulch, approximately 8 cm thick, was first collected by hand. Four soil cores (2 cm diameter) were then collected using an auger along the drip line in between two measurement plants at depth 0–15 cm, 15–30 cm, and 30–60 cm in spring and fall, but only at depth 0–15 cm and 15–30 cm in summer because the soil was dry. Sawdust mulch and field-moist soil samples were composited on-site, sieved (2 mm) and separated into two parts: one part was stored at 4 °C and another part was air-dried.

2.5. Chemical Analysis

Soil mineral N (NH4+-N and NO3-N) was analyzed on moist soil and sawdust mulch samples. Briefly, 5 g of soil or sawdust mulch was shaken with 50 mL (1:10 (w/v)) of 2 M KCl solution for one hour using an orbital shaker and the suspensions were filtered using Whatman No. 40 paper. All extracts were analyzed colori-metrically for NH4+ and NO3 using a flow injection analyzer (Tecator FIAStar 2010) as described by Maynard et al. [26]. In air-dried soil samples collected in fall, soil pH and electrical conductivity (EC) were measured in distilled water (1:1 soil:solution ratio) [27] using a pH/EC meter (YSI MultiLab IDS 4010-3W).

2.6. Statistical Analysis

All data were tested for normality using the SAS univariate procedure. Analysis of variance (ANOVA) was performed using SAS Proc Mixed, version 9.3 [28]. Berry yield data were analyzed each year using one-way ANOVA with replicates as random effects and treatments as fixed effects. Soil mineral N (NH4+-N and NO3-N) data were analyzed each year using three-way ANOVA with replicates as random effects, season as repeated effects, and treatments, depth, and two- and three-way interactions as fixed effects. The pH and EC data were analyzed each year using two-way ANOVA with replicates as random effects and treatments, depth and two-way interactions as fixed effects. Differences among least square means (LSMEANS) for all treatment pairs were tested at a significance level of p = 0.05. Where appropriate, LSMEANS for berry yield were compared using a set of selected orthogonal contrast.

3. Results

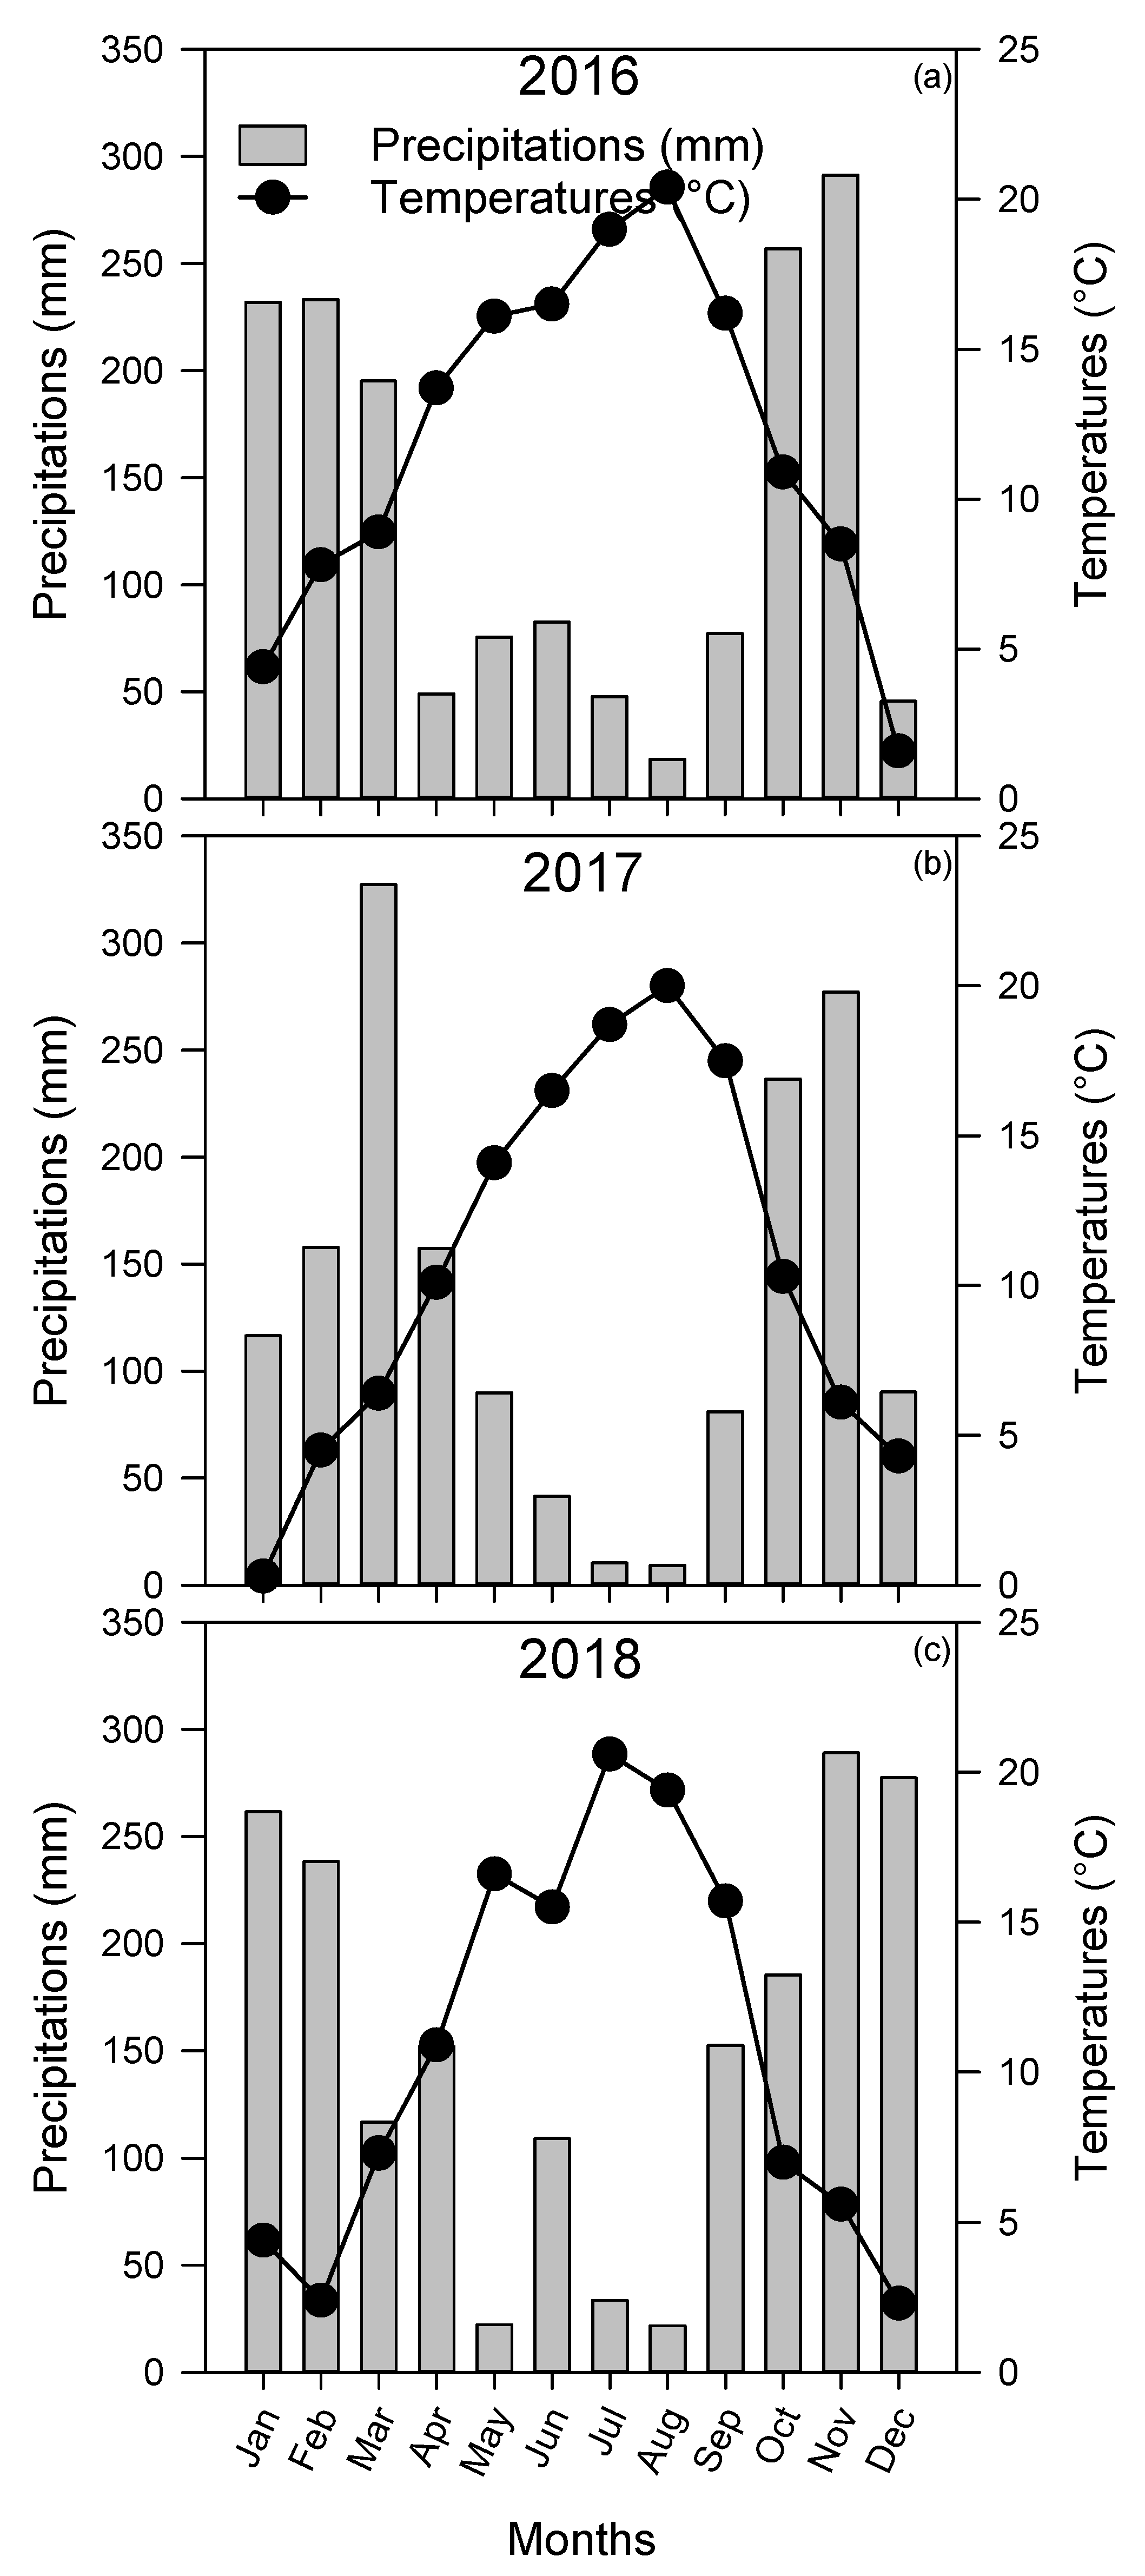
3.1. Weather Conditions

Total precipitations were in the order 1858.9 mm in 2018 > 1604.9 mm in 2016 > 1594.9 mm in 2017 (Figure 1a–c). Compared with normal precipitations of 1745 mm (30 year; 1981–2010), there were 140 mm less precipitations in 2016 and 150 mm in 2017, while 114 mm more precipitations were received in 2018 [23]. Given that soil samples were collected in April, July and September, we split the total precipitations into three periods including October to April, May to July, and August to September. From October to April, precipitations accumulated were 1424.6 mm during the 2015/16 period, 1353 mm during the 2016/17 period and 1372.1 mm during the 2017/18 period. From May to July, precipitations received were 206 mm in 2016, 141.8 mm in 2017 and 164.8 mm in 2018. From August to September, precipitations received were 95.6 mm in 2016, 90.2 mm in 2017, and 174.1 mm in 2018. The average monthly air temperatures were in the order 12.0 °C in 2016 > 10.7 °C in 2017 > 10.6 °C in 2018 (Figure 1a–c). Compared with the normal air temperature of 10.8 °C (30 year; 1981–2010), average monthly air temperatures were lower by 0.1 °C in 2017 and 0.2 °C in 2018, but higher by 1.2 °C in 2016.

3.2. Berry Yield

Berry yield was significantly affected by the treatment combinations in 2017 (p < 0.001), but not in 2016 (p = 0.376) and 2018 (p = 0.991). Berry yield was on average 47.32 Mg ha−1 in 2016 and 26.86 Mg ha−1 in 2018 (Table 2). In 2017, berry yield varied between 8.60 Mg ha−1 under CONT and 11.66 Mg ha−1 with 120 kg N ha−1 applied through suspended drip lines (Table 2). Orthogonal contrast comparisons showed that the NI reduced berry yield in 2017 by 11 to 21% compared to its respective treatment. For example, berry yield obtained with N application rate of 120 kg N ha−1 was 11.66 Mg ha−1 under suspended drip lines and 11.21 Mg ha−1 under buried drip line, but decreased by 11.2% and 13.5%, respectively, with addition of NI. Similarly, berry yield obtained with N application rate of 60 kg N ha−1 was 11.65 Mg ha−1 under suspended drip lines and 10.48 Mg ha−1 under buried drip line, but decreased by 20.7% and 10.6%, respectively, with addition of NI. Finally, treatment combinations including low N application rates with NI were always lower (by 17–21%) than treatment combinations including high N application rates without NI. For example, berry yield obtained with treatment combinations including N application rates of 60 kg N ha−1 and NI was 9.24 Mg ha−1 under suspended drip lines and 9.37 Mg ha−1 under buried drip lines, while for N application rates of 120 kg N ha−1 berry yield was 11.66 Mg ha−1 under suspended drip line and 11.21 Mg ha−1 under buried drip lines.

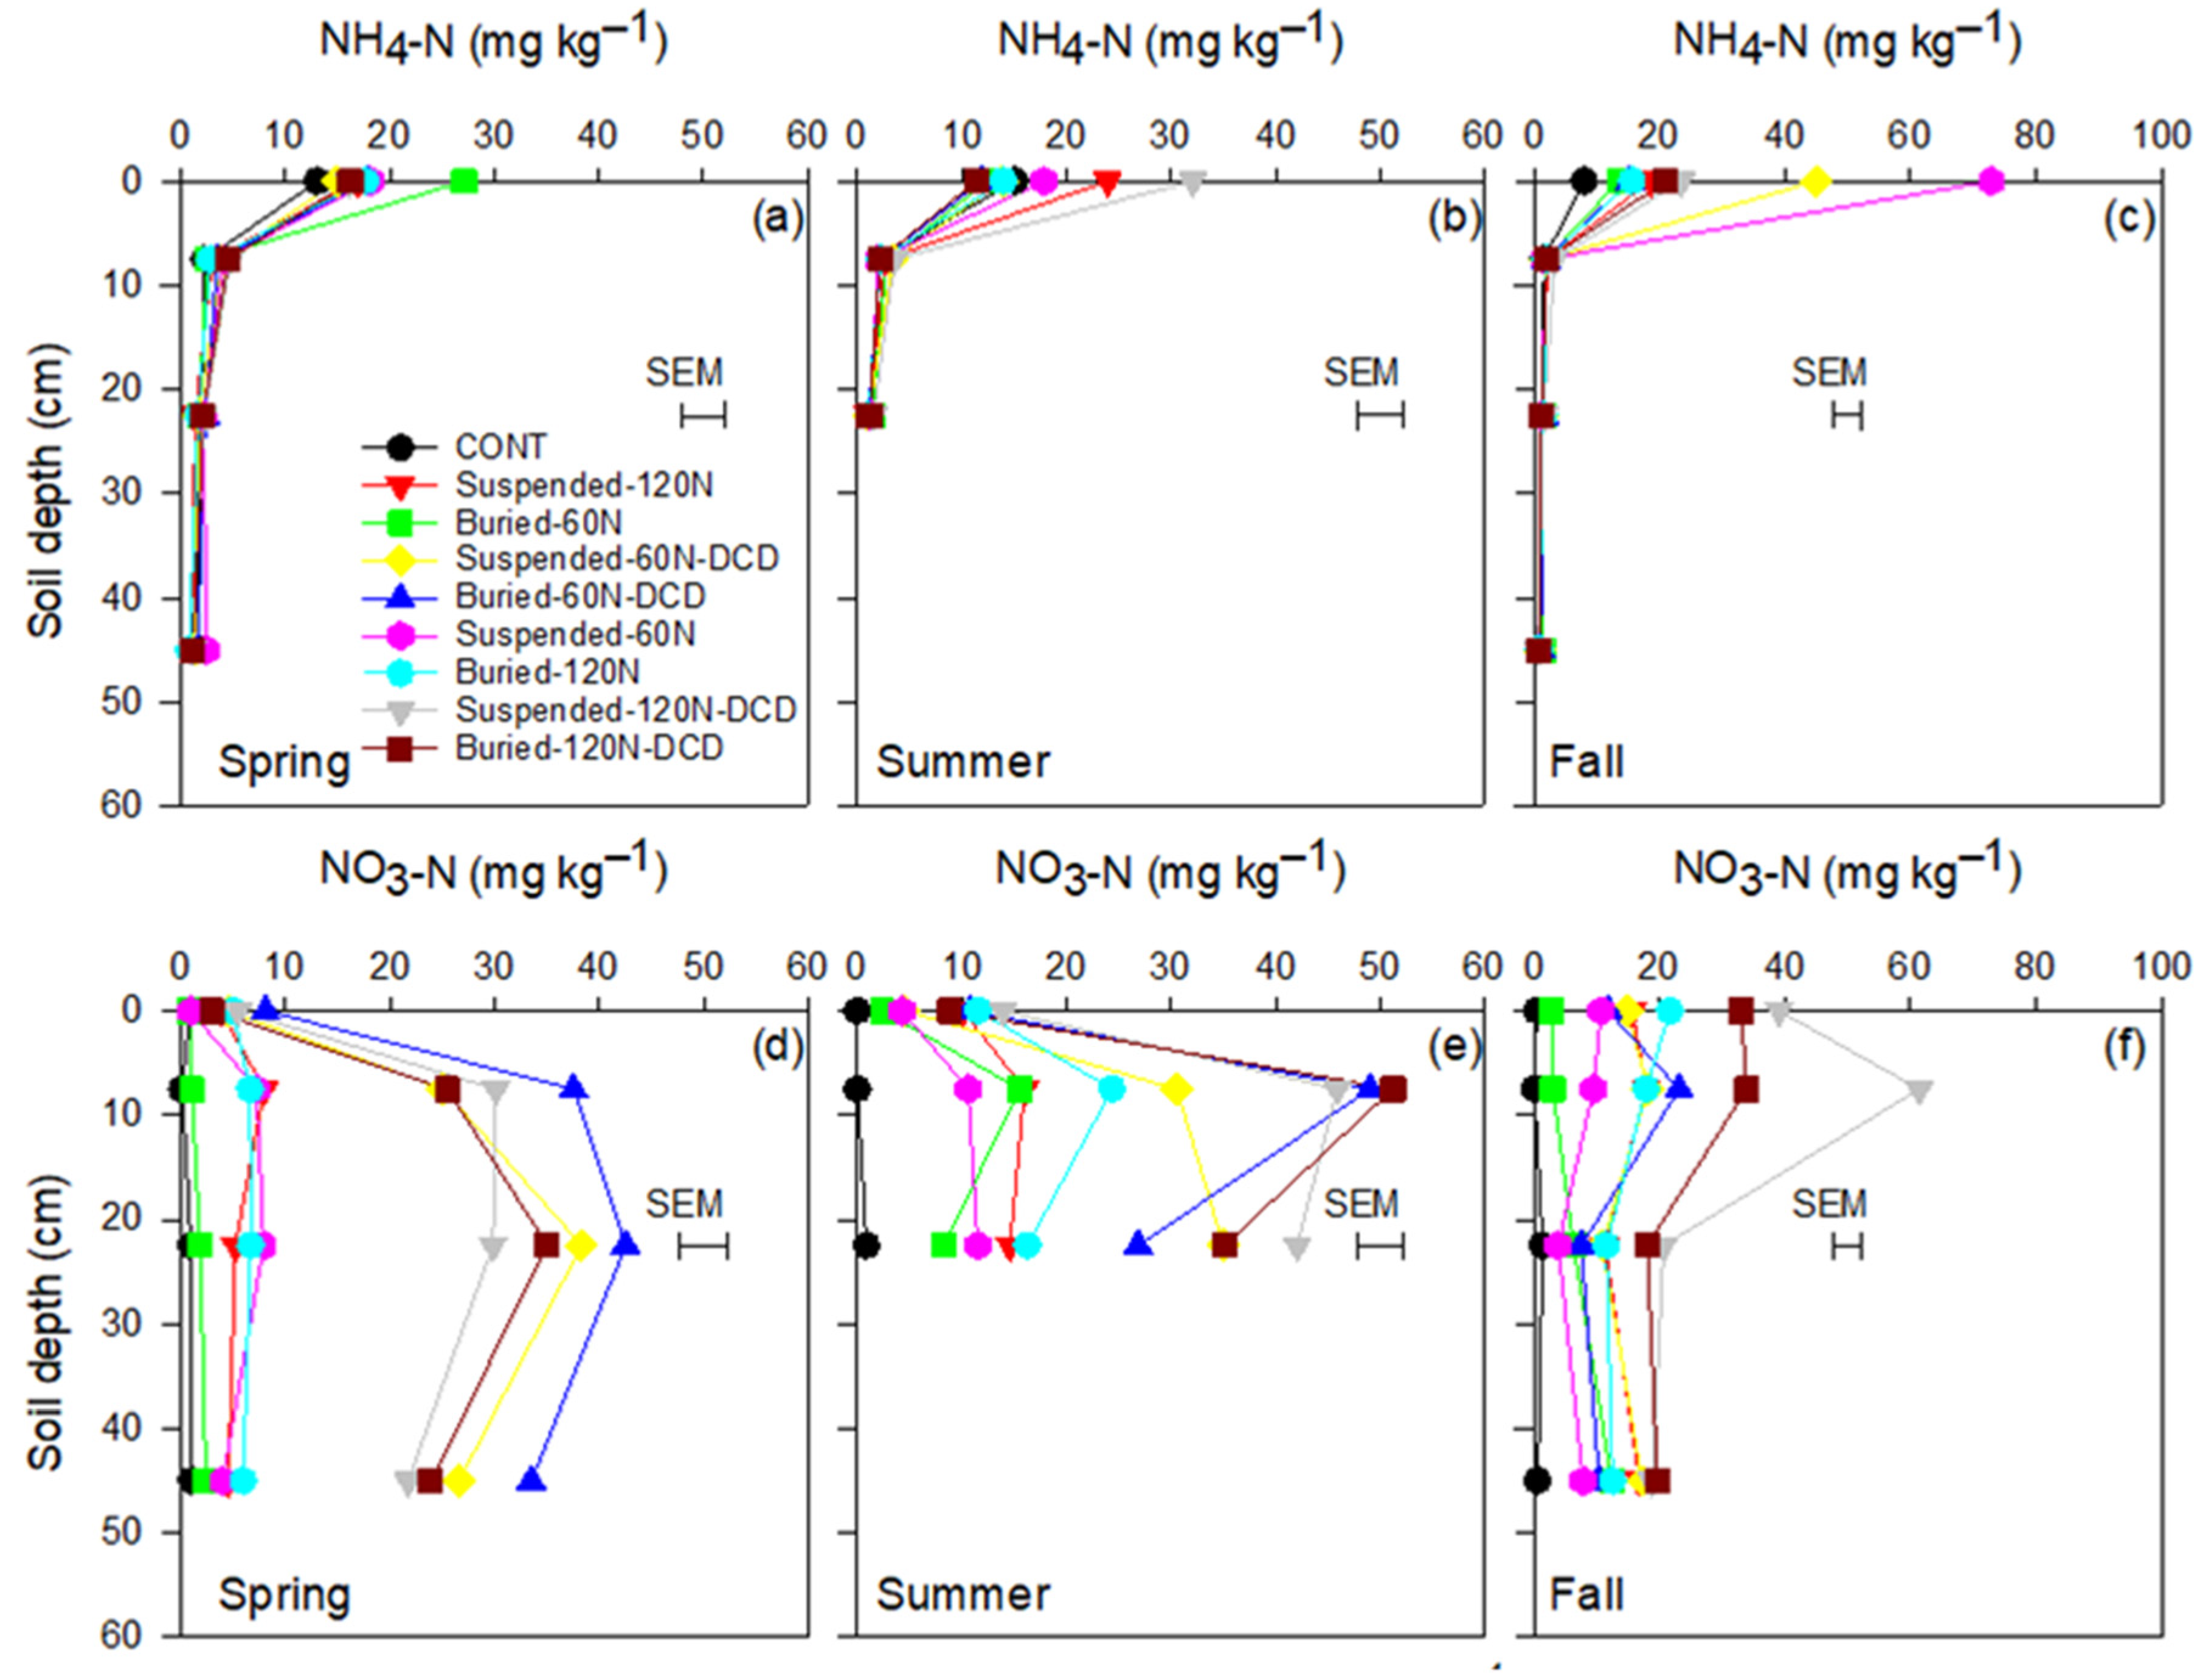
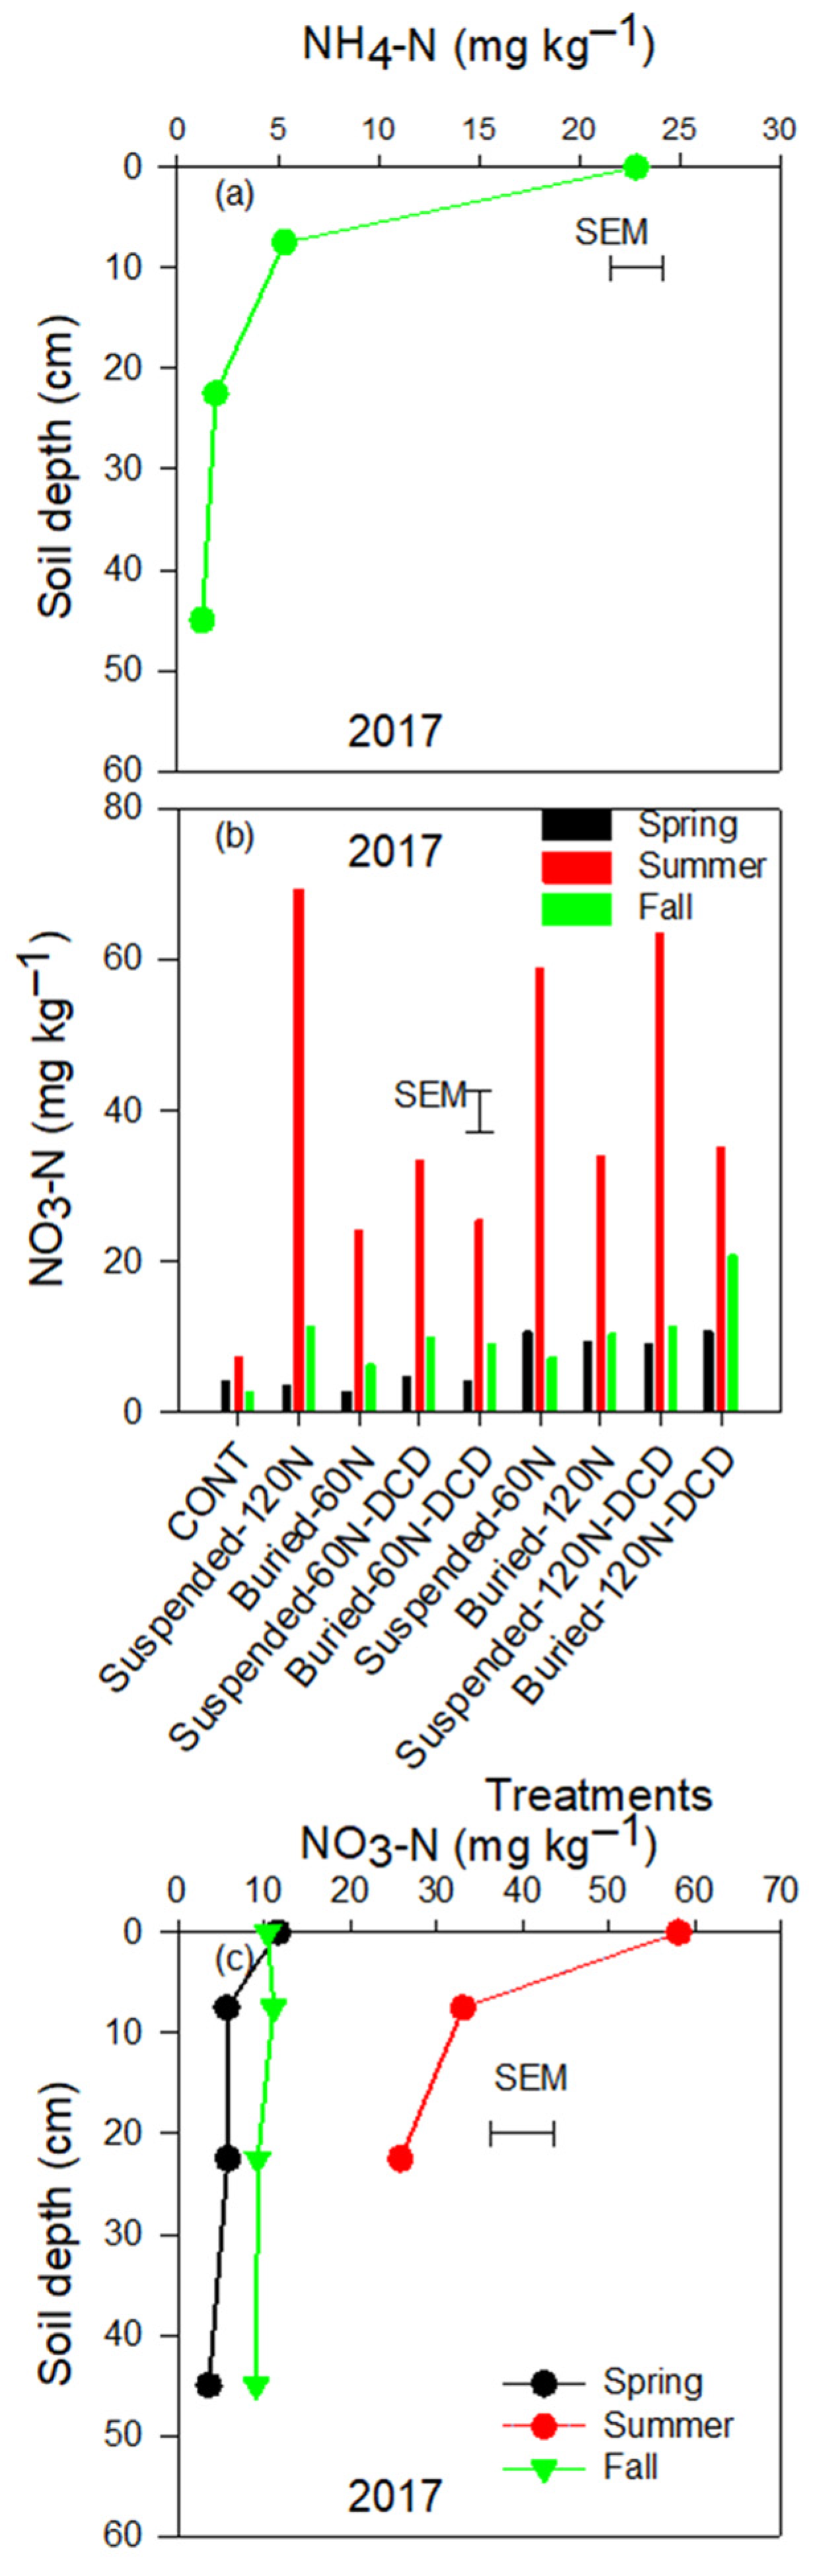
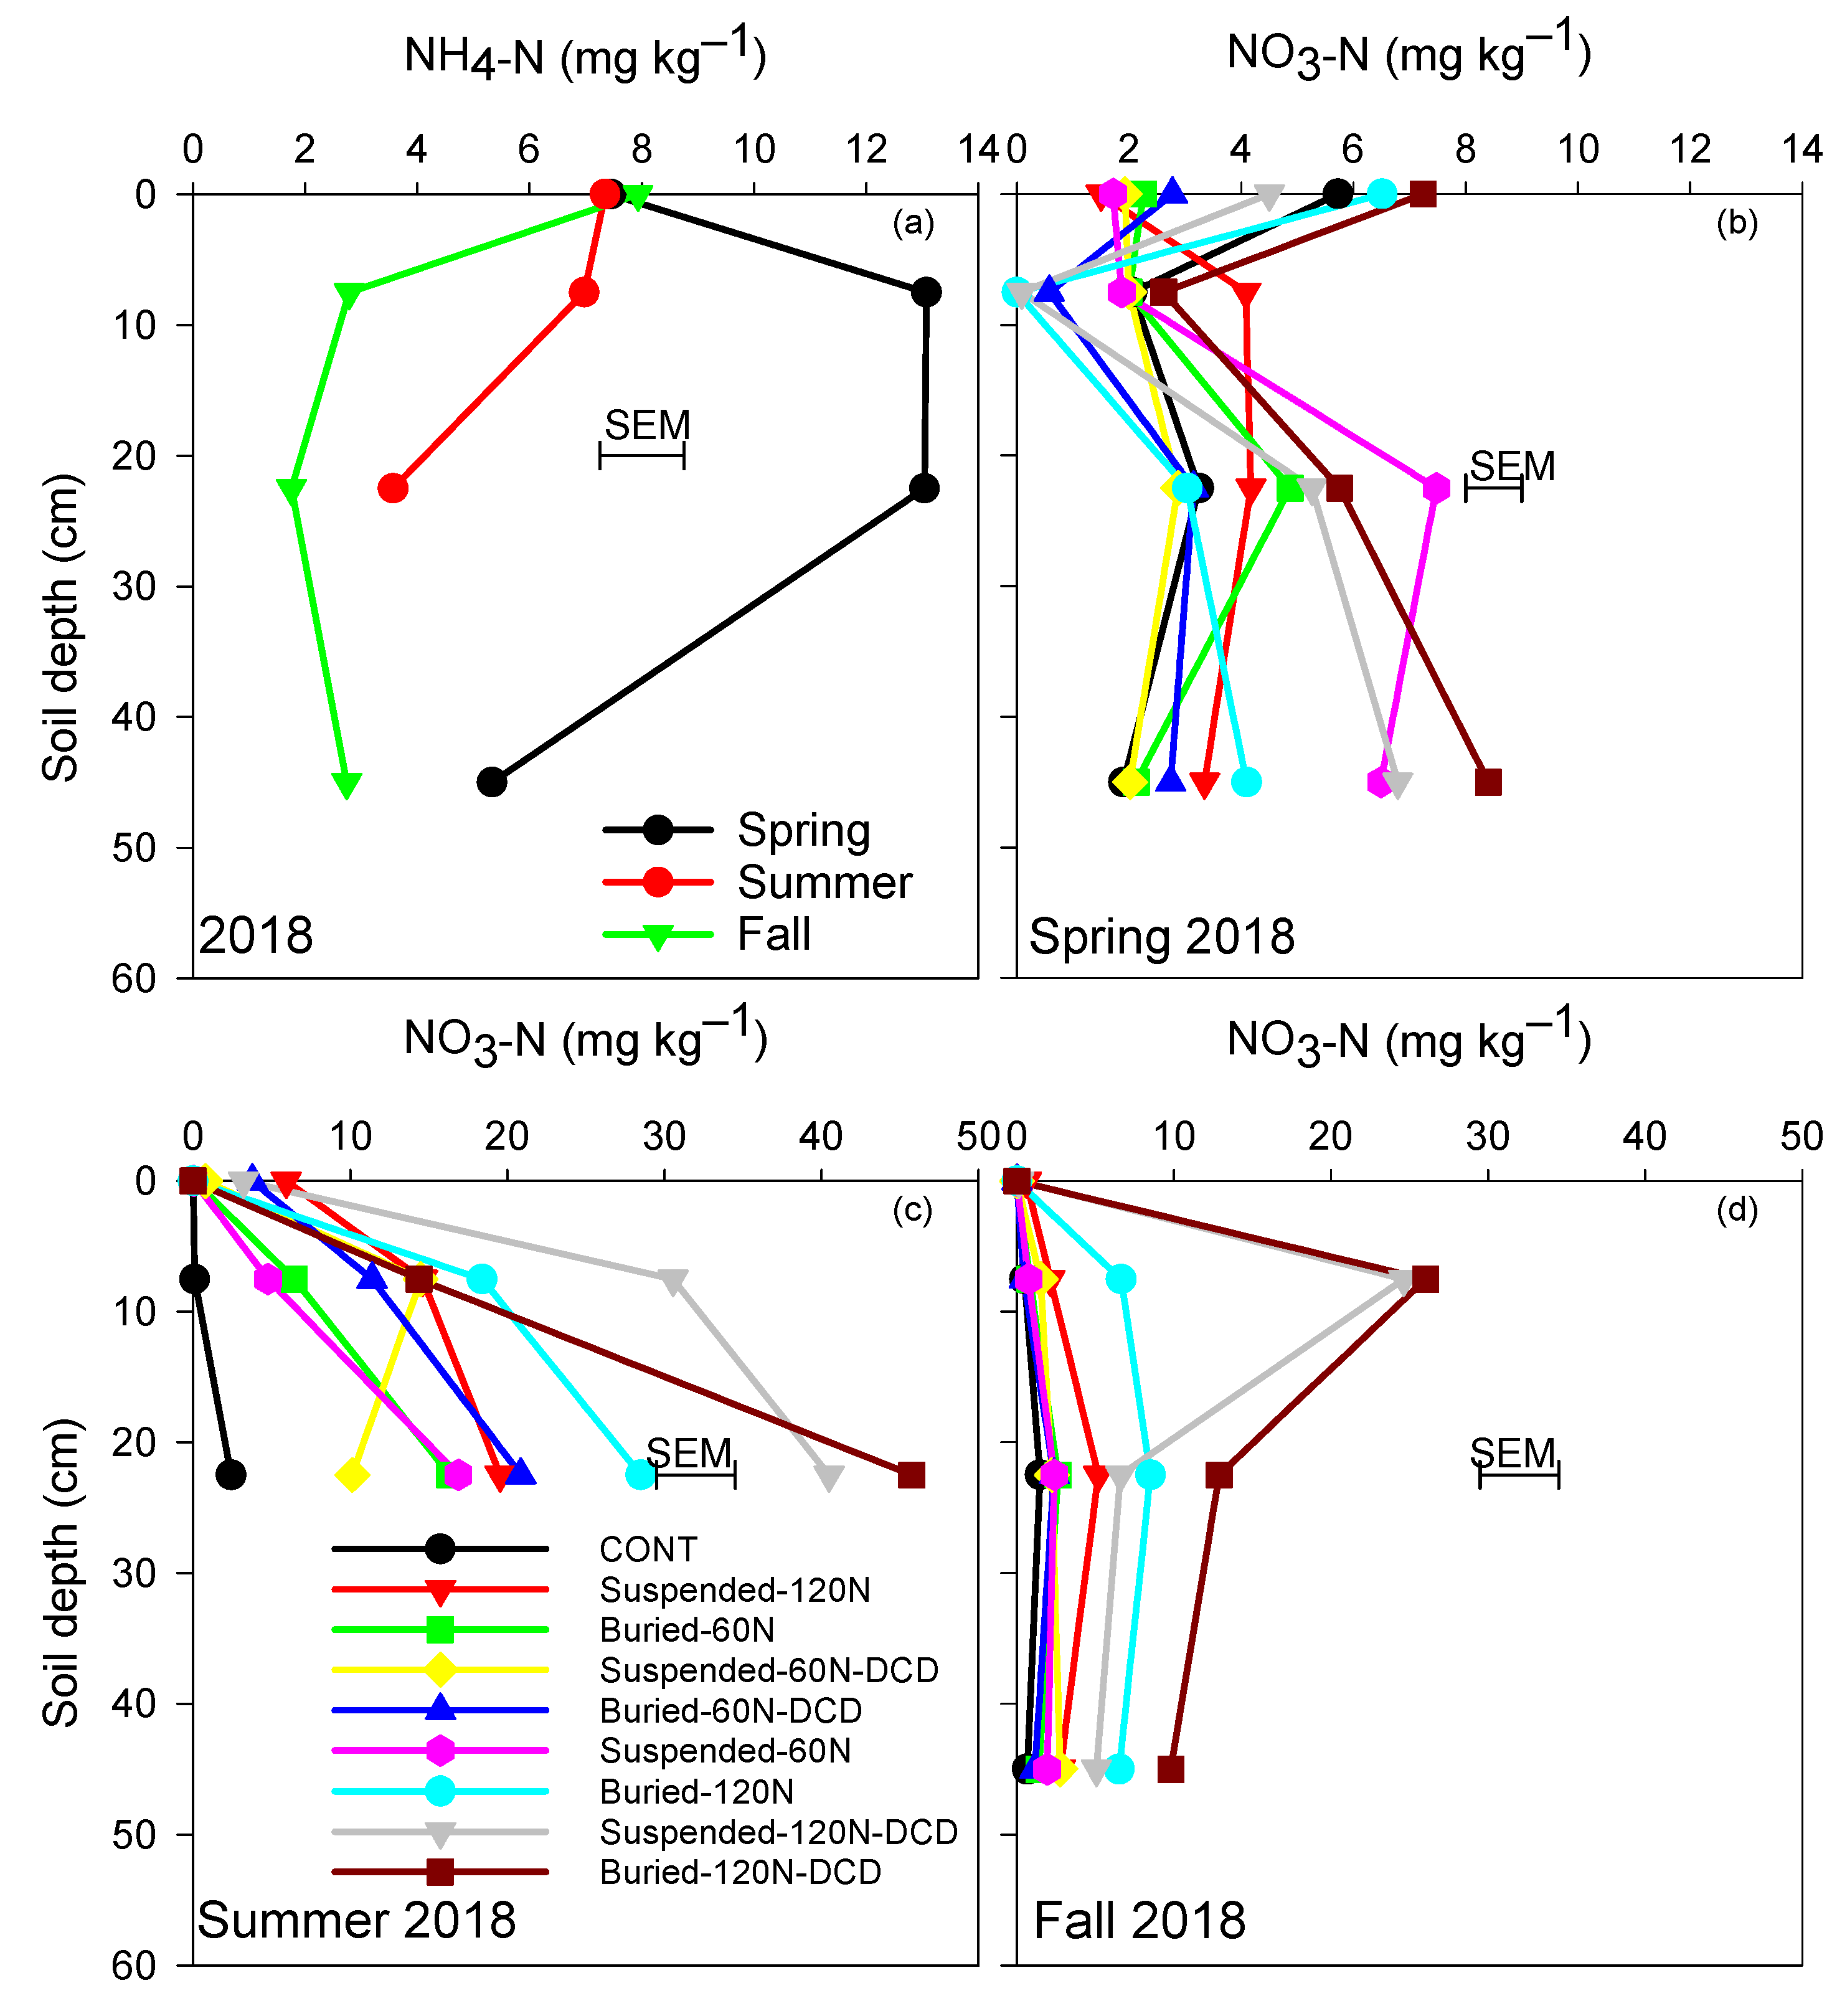
3.3. Ammonium and Nitrate Concentrations in the Soil
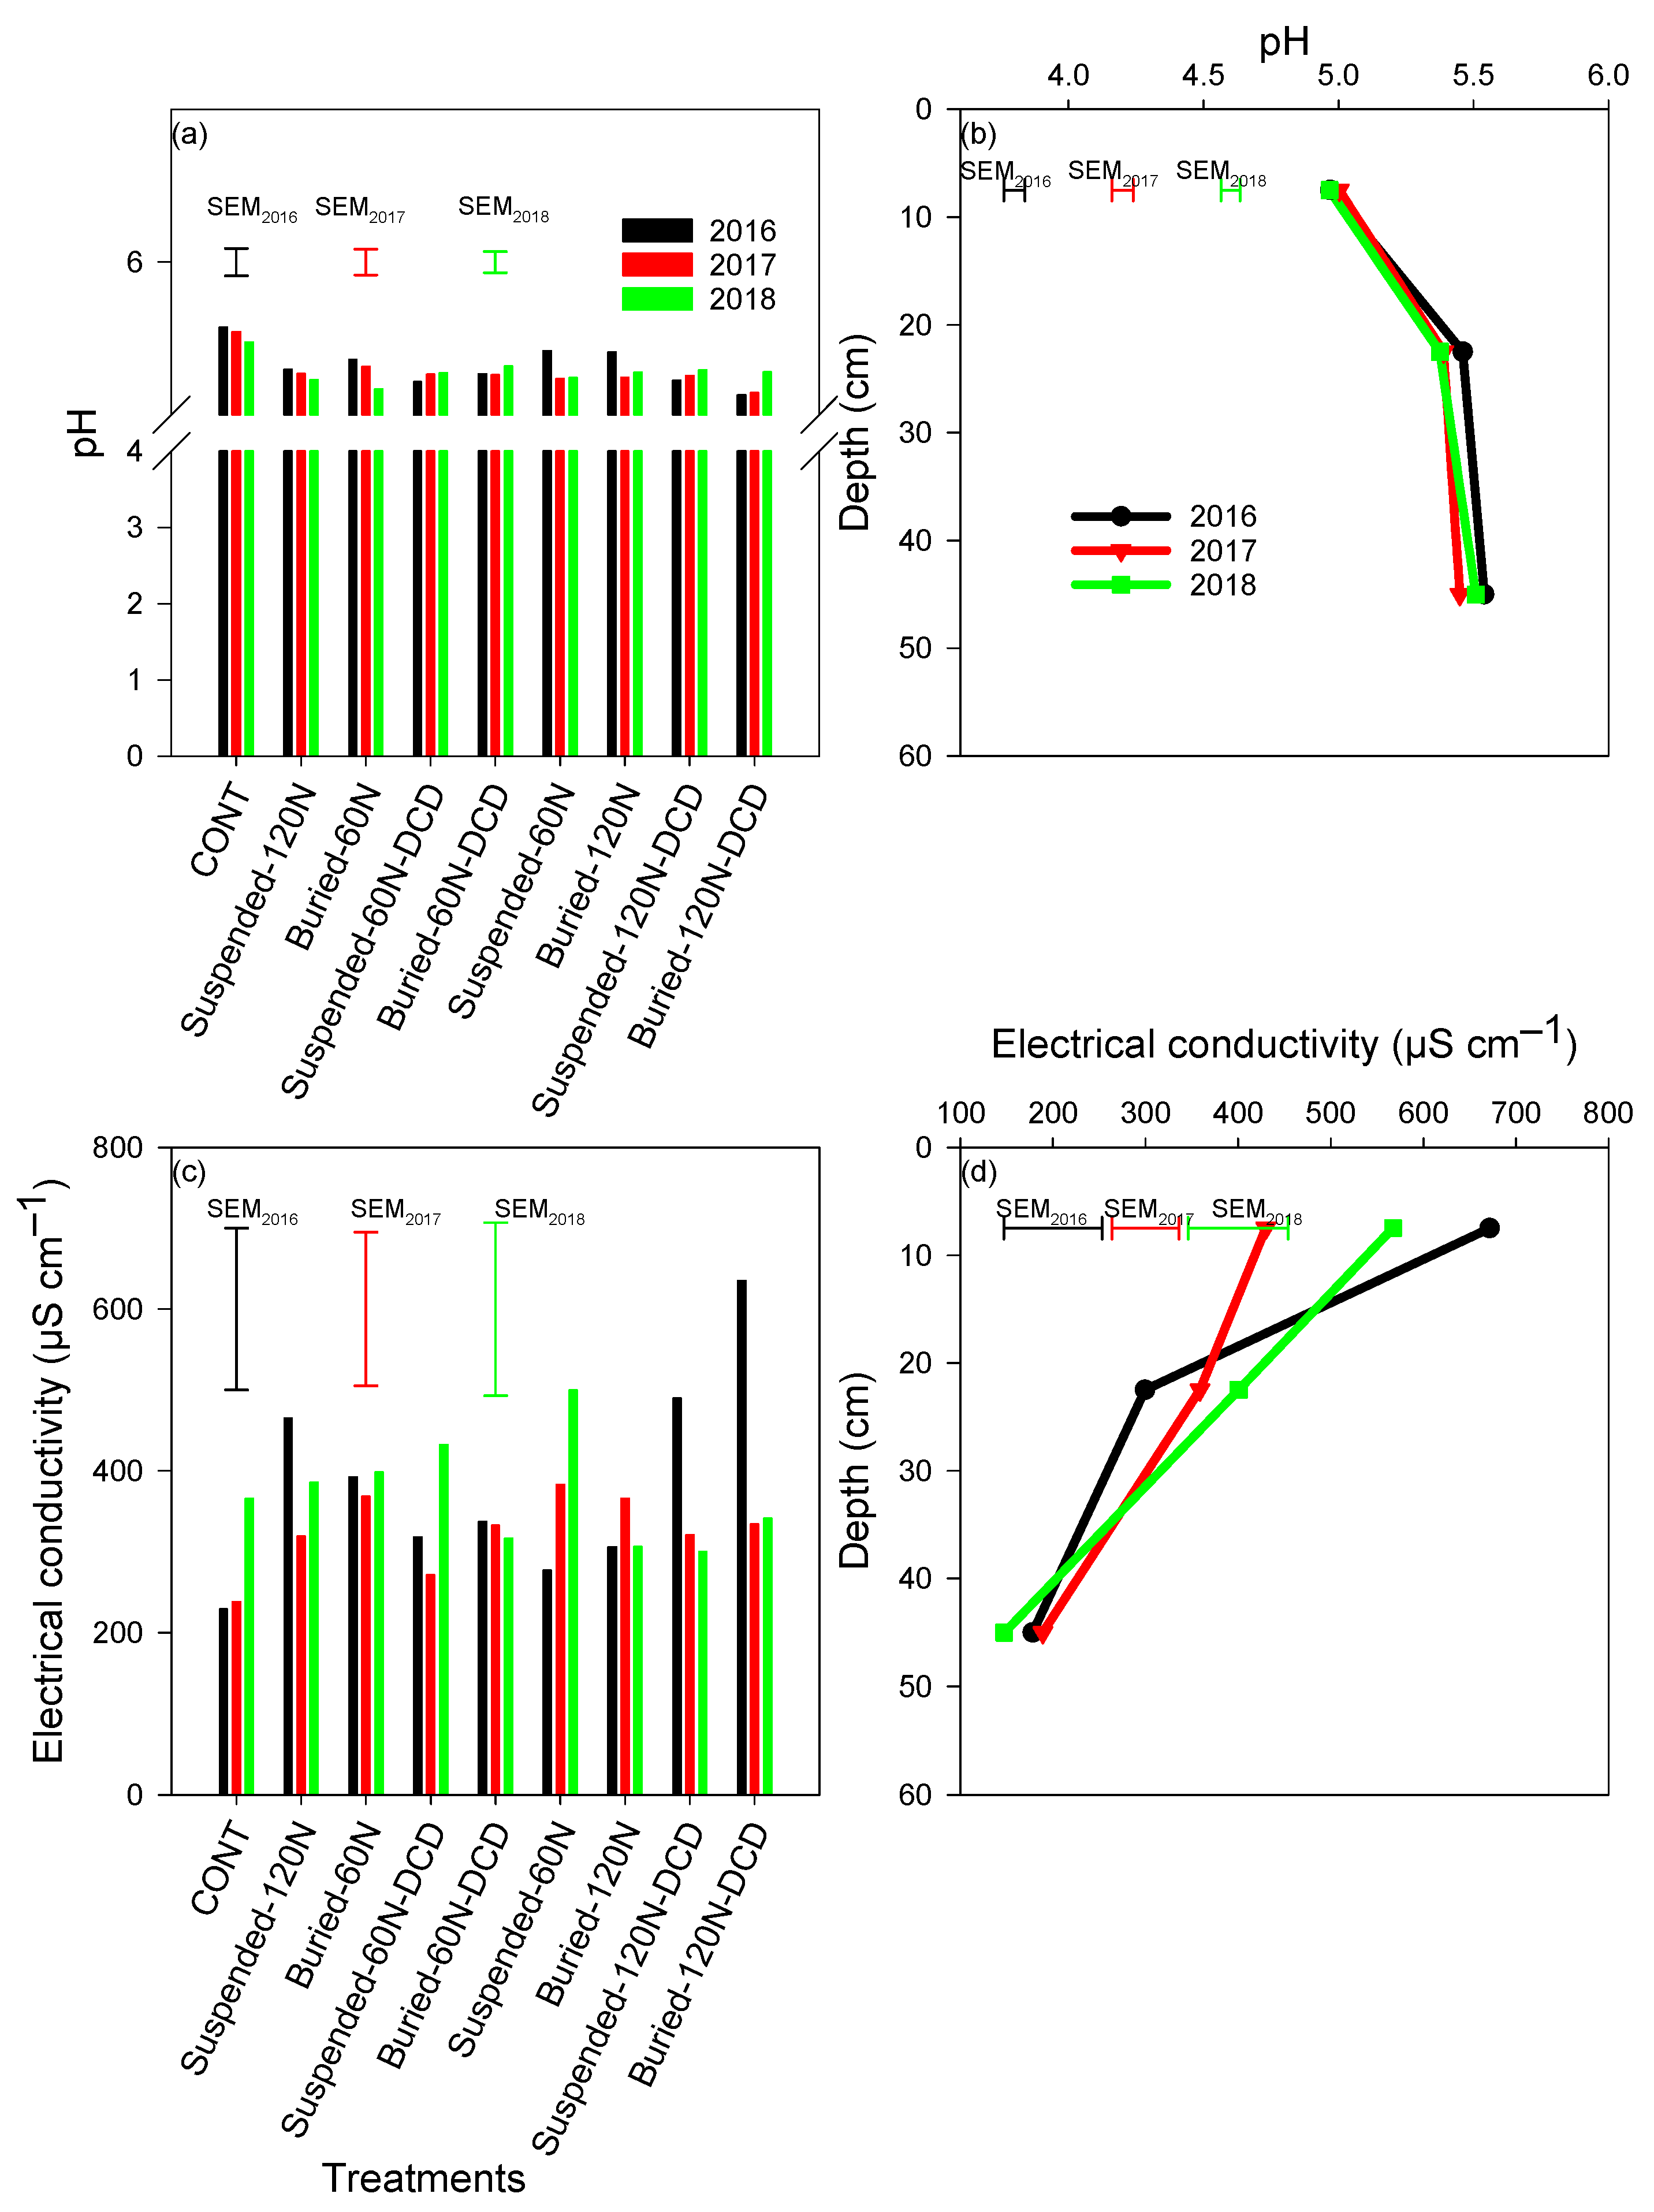
In 2016, the concentrations of NH4+-N in the soil was influenced by the treatment combinations and the extent varied with the depth of sampling and the season (p < 0.001) (Table 3). In the spring, the concentration of NH4+-N in the sawdust mulch layer varied between 13.1 mg kg−1 under CONT and 27.1 mg kg−1 with applications of 60 kg N ha−1 through buried drip line (Figure 2a). The concentration of NH4+-N decreased with soil depth and was on average 3.5 mg kg−1 at 0–15 cm, 2.0 mg kg−1 at 15–30 cm, and 1.4 mg kg−1 at 30–60 cm depth (Figure 2a). In the summer, the concentration of NH4+-N in the sawdust mulch layer varied between 11.4 mg kg−1 with application of 120 kg N ha−1 through buried drip line to 32.1 mg kg−1 with application of 120 kg N ha−1 combined with NI through suspended drip line (Figure 2b). In the fall, the concentration of NH4+-N in the sawdust mulch layer varied between 7.9 mg kg−1 under CONT to 72.9 mg kg−1 with application of 60 kg N ha−1 through suspended drip line (Figure 2c). The concentration of NH4+-N decreased with soil depth and was on average 2.0 mg kg−1 at 0–15 cm, 1.4 mg kg−1 at 15–30 cm, and 0.9 mg kg−1 at 30–60 cm depth (Figure 2c). For all seasons, no significant difference was observed between treatments and soil depths.
In contrast to NH4-N, the concentrations of NO3-N in the soil was influenced by the treatment combinations and the extent varied significantly with the depth of sampling and the seasons (p < 0.001) (Table 3, Figure 2d–f). In the spring, the concentration of NO3-N in the sawdust mulch layer varied between 0.9 mg kg−1 under CONT to 8.2 mg kg−1 with application of 60 kg N ha−1 combined with the NI through buried drip line (Figure 2d). In contrast to our expectations, the concentration of NO3-N below the sawdust mulch layer was higher when applications of N fertilizer were combined with NI compared with N fertilizer alone: this varied between 21.8 mg kg−1 at 30–60 cm with application of 120 kg N ha−1 combined with NI through suspended drip line to 42.6 mg kg−1 at 15–30 cm with application of 60 kg N ha−1 combined with NI through buried drip line (Figure 2d). For all soil depths, higher NO3-N soil concentrations were observed with 60 kg N ha−1 and NI buried drip line. In contrast to NI treatments, the concentration of NO3-N did not vary significantly with soil depth with CONT and other studied treatments (N rates and irrigation methods) (Figure 2d). In the summer, the concentration of NO3-N in the sawdust mulch layer varied between 0.0 mg kg−1 under CONT to 13.9 mg kg−1 with application of 120 kg N ha−1 combined with NI through suspended drip line (Figure 2e). The concentration of NO3-N below the layer of sawdust mulch increased with soil depth for all treatment combinations except CONT with the highest increase obtained when N fertilizer applications were combined with NI; when fertilizer applications were combined with the NI, the concentration of NO3-N increased by 3.0 to 6.8 times through suspended drip lines and by 4.6 to 5.8 times through buried drip lines, while when fertilizer applications were not combined with NI, the concentration of NO3-N increased by 1.6 to 2.5 times through suspended drip lines and by 2.1 to 6.5 times through buried drip lines (Figure 2e). In the fall, the concentration of NO3-N in the sawdust mulch layer varied between 0.4 mg kg−1 under CONT to 39.0 mg kg−1 with applications of 120 kg N ha−1 combined with NI through suspended drip lines (Figure 2f). As observed in the spring and summer, the combination of high N fertilizers with NI maintained higher NO3-N concentrations in the 0–15 cm soil depth compared with the other treatments. The concentrations of NO3-N below the layer of sawdust mulch remained relatively constant in the soil depths except with applications of 120 kg N ha−1 combined with NI through suspended drip lines and applications of 60 kg N ha−1 combined with NI through buried drip lines at 0–15 cm.
In 2017, the concentration of NH4+-N only varied with soil depth (p < 0.001) (Table 3). Irrespective to N rates, NI and irrigation methods were on average 22.8 mg kg−1 in the sawdust mulch layer and decreased at 5.3 mg kg−1 in the 0–15 cm, 1.9 mg kg−1 in the 15–30 cm and 1.2 mg kg−1 in the 30–60 cm soil depth (Figure 3a). Sawdust layer had the highest NH4+-N concentration followed by the 0–15 cm depth and then the 15–30 cm. However, the concentration of NO3-N was influenced by treatment combinations and the extent varied with seasons (p = 0.011, Treatment × Season interaction) (Table 3). The concentrations of NO3-N were low in the spring and varied between 2.8 mg kg−1 with application of 60 kg N ha−1 through buried drip line to 10.8 mg kg−1 with application of 60 kg N ha−1 through suspended drip line (Figure 3b). The concentrations of NO3-N were also low in the fall and varied between 2.8 mg kg−1 under CONT to 20.9 mg kg−1 with application of 120 kg N ha−1 combined with NI through buried drip line (Figure 3b). In contrast, the concentrations of NO3-N were high in the summer and varied between 7.3 mg kg−1 under CONT to 69.4 mg kg−1 with application of 120 kg N ha−1 through suspended drip line (Figure 3b). For example, the suspended drip line application of 120 mg kg−1 with or without NI resulted in NO3-N concentrations of 66.5 mg kg−1 and, respectively, while it was 58.9 mg kg−1 for the application of 60 kg N ha−1 without NI, and 33.4 mg kg−1 when combined with NI resulted to NO3-N concentrations of (Figure 3b). The concentration of NO3-N was also influenced by soil depth and the extent varied with the season (p = 0.009, Depth × Season interaction) (Table 3). Although, the concentrations of NO3-N in the spring and fall were similar (averaged 11.0 mg kg−1) and did not vary with soil depth, its concentration during the summer was 58.1 mg kg−1 in the layer of sawdust mulch and decreased at 33.1 mg kg−1 in the 0–15 cm and 25.84 mg kg−1 in the 15–30 cm soil depth (Figure 3c).
In 2018, the concentration of NH4+-N was influenced by soil depth and the extent varied with the seasons (p = 0.001, Depth × Season interaction) (Table 3). In the spring, the concentration of NH4+-N was 7.5 mg kg−1 in the layer of sawdust mulch and increased to 13.1 mg kg−1 at depth 0–15 cm and 15–30 cm, but remained low (5.3 mg kg−1) and similar to the sawdust layer at depth 30–60 cm (Figure 4a). In the summer the concentration of NH4+-N varied between 7.4 mg kg−1 in the layer of sawdust mulch and in the 0–15 cm soil depth to 3.6 mg kg−1 (Figure 4a). In the fall, the concentration of NH4+-N was 7.9 mg kg−1 in the layer of sawdust mulch and remained low at average concentration of 2.2 mg kg−1 at depths 0–15 cm, 15–30 cm and 30–60 cm (Figure 4a). In contrast to NH4+-N, the concentration of NO3-N was influenced by the treatment combinations, the soil depths and the seasons (p < 0.001, Treatment × Depth × Season) (Table 3). In the spring, the concentration of NO3-N varied from 0.0 mg kg−1 at 0–15 cm depth and 8.4 mg kg−1 at 30–60 cm depth with application of 120 kg N ha−1 combined with NI through buried drip line (Figure 4b). In the summer, the concentration of NO3-N remained lower than 10 mg kg−1 in the layer of sawdust mulch, but increased with soil depth up to 45.8 mg kg−1 and 40.5 mg kg−1 at 15–30 cm depth with application of 120 kg N ha−1 combined with NI through buried and suspended drip lines, respectively (Figure 4c). In the fall, the concentration of NO3-N remained close to 0.0 mg kg−1 in the sawdust mulch layer and lower than 10.0 mg kg−1 for the different combination treatments except for treatments corresponding with application of 120 kg N ha−1 combined with NI through buried (26.0 mg kg−1 at 0–15 cm depth) and suspended (24.6 mg kg−1 at 0–15 cm depth) drip lines (Figure 4d).

3.4. Soil pH and EC

During the three years of study, the soil pH was influenced simply by the effect of treatments and the soil depth (Table 4). The soil pH varied between 5.6 under CONT and 5.1 with applications of 120 kg N ha−1 combined with NI through buried drip lines in 2016, between 5.5 under CONT and 5.1 with applications of 120 kg N ha−1 combined with NI through buried drip lines in 2017, between 5.5 under CONT and 5.2 with applications of 60 kg N ha−1 through buried drip lines in 2018 (Figure 5a). The soil pH increased with soil depth between 4.9 in the 0–15 cm and 5.5 in the 30–60 cm in 2016, between 5.0 in the 0–15 cm and 5.5 in the 30–60 cm in 2017, between 4.9 in the 0–15 cm and 5.5 in the 30–60 cm in 2018 (Figure 5b).
The EC was influenced by treatment combinations and soil depth in 2016, but only by soil depth in 2017 and 2018 (Table 4). The EC varied between 229 µS cm−1 under CONT and 6359 µS cm−1 with applications of 120 kg N ha−1 combined with NI through buried drip lines in 2016, it was on average 326 µS cm−1 in 2017 and 372 µS cm−1 in 2018 (Figure 5c). For all year, EC decreased with soil depth; between 672 µS cm−1 in the 0–15 cm and 178 µS cm−1 in the 30–60 cm in 2016, between 430 µS cm−1 in the 0–15 cm and 189 µS cm−1 in the 30–60 cm in 2017, and between 567 µS cm−1 in the 0–15 cm and 147 µS cm−1 in the 30–60 cm in 2018 (Figure 5d).

4. Discussion

Nitrogen fertilization is crucial for blueberry production and berry yield reduction up to 57% between the recommended rate and zero N application have been reported [15]. During the three years of study, N applications affected berry yield only in 2017 after a severe plant pruning to regenerate the plants (Table 2). The lack of berry yield response to N application is probably related to the history of N fertilization in the site. At establishment, the site was designed to assess the effects of drip irrigation configuration and rate on berry yield and quality [24]. All plants were fertilized with a berry fertilizer blend (15-8-11) in two equal broadcast applications up to 2015 using N rates recommended in the BC Berry Production Guide [25]. Nitrogen was not a limiting factor for the growth of the mature plants in any of the experimental plots until the beginning of the present study in 2016. The decrease in berry yield following the heavy pruning to rejuvenate the plants that occurred in 2016, which affected the amount of nutrients stored in the plants that would otherwise be translocated to the berries and have contributed to plant productivity. Upon pruning, the plants relied heavily on N uptake during the growing season for growth and berry production which was limited by the absence of N application in the control plots.
One key finding of this study is the lack of NI effects on berry yield in 2016 and 2018, and the overall reduction of berry yield in 2017 when NI was combined with N fertilizers (Table 2). This lower yield may have partly resulted in higher NO3-N form observed during spring, but was not related to a higher concentration in summer. Moreover, no positive impact of higher N application rates was observed in 2017, when the crop N demand was high due to the crop regeneration. Similarly to our 2016 and 2018 results, Qiao et al. [7] showed that the NI had no effect on the productivity of vegetable and pasture hay in a synthesis of 62 NI field studies. Vegetables strongly prefer NO3 to NH4+ and a shift in the relative proportion of these N forms can affect the response to N fertilizer applications [2,29]. Li et al. [9] also found that the combination of urea and NI had no effect on seed and lint yield in a cotton plantation under drip-fertigation system due partly to the split-application of nutrient with fertigation that better match crop needs. In Spain, the use of NI and drip-fertigation did not affect corn yield and N uptake [14]. Liu et al. [30] also found that NI had no effect on cotton yield under a drip-fertigation system.
A highest concentration of NH4 -N in the sawdust layer was observed only in summer for suspended 120 kg N ha−1 combined with NI, while the highest concentration was observed with 60 kg N ha−1 buried line in spring and with suspended 120 kg N ha−1 in fall. Our results showed that, in 2016, the combinations of treatments consisting of 60 kg N ha−1 and 120 kg N ha−1 combined with NI and applied through suspended drip lines had the highest concentrations of NH4+-N in the sawdust mulch layer (Figure 2b,c). The high NH4+-N concentrations in the sawdust mulch layer indicate that NI was effective at delaying the conversion of NH4+ to NO3 [31,32]. However, high berry yields were not associated with these treatments indicating a limited NH4+ uptake by the highbush blueberry plants (Table 2). Highbush blueberries are generally planted on raised beds covered by a layer of sawdust mulch. The raised beds increase the volume of soil around the roots to compensate for the shallow root system of highbush blueberries [33]. The layer of sawdust mulch reduces the evaporation of soil moisture, improves weed control, and insulates the roots against extreme temperatures [34]. The suspended drip lines applied the dissolved N fertilizer and NI at the surface of the sawdust mulch layer. The NH4+ accumulated in the layer of sawdust mulch as a result of the activity of NI have to move down the soil beneath before they can be taken up by plant roots. The downward movement of NH4+ is enhanced by irrigation water and rainfall [16]. Low concentrations of NH4+-N measured in the soil beneath the layer of sawdust mulch in the spring, summer and fall of 2016 (Figure 2a–c) indicate a limited vertical transport of NH4+ along the soil profile. Although that limited NH4+ leaching could be explained by limited irrigation and rainfall waters necessary to move NH4+ to the soil beneath the layer of sawdust mulch where most of the plant roots are located, no NH4+-N concentration difference was observed in spring and fall where the precipitation was important. This may be explained by the sawdust N mobilization and soil NH4 nitrification, although N1 was used. On the other hand, in our study, N1 promoted NO3 soil concentration at all soil depths, which may be related to a reduction of the N volatilization at the sawdust layer.
Our results also showed that in 2017 and 2018, there was no significant effects of treatment on NH4+-N sawdust and soil concentrations (Table 3). The absence of the effects of NI on NH4+-N concentrations in the layer of sawdust mulch was not consistent with the results obtained in 2016, but was consistent with the results observed in soil depths in 2017 and the summer and fall 2018. This lack of NH4+ accumulation in the layer of sawdust mulch in relation to NI could be explained by an enhanced vertical transport of NI down the soil profile. The downward transport of NI can induce a spatial separation with NH4+ and nitrifying microorganisms in the layer of sawdust mulch and the soil [35]. This spatial separation could have limited the efficacy of NI by reducing its action on nitrifying microorganisms present in the layer of sawdust mulch. Precipitation received in 2017 and 2018 during the period May to July (Figure 1a–c) were lower than precipitation received during the same period in 2016 (206 mm) and during the 30-year normal (261.9 mm) [23]. These dry conditions prompted more frequent irrigation events to offset the evapotranspiration and therefore resulted in applications of high volume of water to the soil. The NI is soluble in water and studies have shown that it could be transported vertically down the soil profile [36]. In a study conducted in New Zealand, NI particularly DCD, was found in drainage waters collected in lysimeters immediately after application of NI to soil and 40 mm of water through simulated rainfall [36]. It is also possible that some NH4+ resulting from the delay of nitrification by NI were leached down the soil profile driven by the high volume of irrigation waters. A recent study assessing nutrient leaching in highbush blueberries [16] showed that high concentrations of NH4+-N in the leachate water occurred during the growing season from May to August due to high volume of irrigation waters. Additional studies will be needed to assess the effects of irrigation on the vertical transport and the presence of NI in the leachates in order to improve the efficacy of these compounds in highbush blueberry production systems [37]. A better understanding of the interactions between NH4+ and NI in the sawdust mulch layer will also be key to promote the use of these compounds in highbush blueberry production systems.
Our results showed that high concentrations of NO3-N were measured beneath the sawdust mulch layer with treatments including urea fertilizer alone or mixed with NI, indicating a conversion of NH4+ to NO3. The presence of NO3 in the soil profile of blueberry plants under treatments including N fertilizer alone is well documented [15,16]. We showed that in 2016, high concentrations of NH4+-N in the layer of sawdust mulch were associated with combination treatments including NI. It is possible that NH4+ retained in the layer of sawdust mulch and not taken up by plant roots was subsequently oxidized to NO3 at the end of the residence time of NI in the soil [8]. The residence time of NI in the soil usually varies between 6 and 16 days [37]. After this period, NI loses its efficacy and NH4+ accumulated in the soil is oxidized to NO3 thus reducing the fertilizer use efficiency due to limited uptake because blueberries prefer NH4+ over NO3 [17]. Our results showed that high concentrations of NO3-N along the soil profile occurred mainly during the summer (Figure 3b,c and Figure 4c), and this could be explained by irrigation water driving NO3 leaching [17]. It is also of interest to highlight that the method of fertigation application influenced the concentration of NO3-N in the soil profile. Buried drip lines resulted to lower concentrations of NO3-N in the soil profile compared with suspended drip lines (Figure 3b and Figure 4b–d). The buried drip lines were placed below the layer of sawdust mulch to deliver the dissolved N directly to the soil. It is possible that, under buried drip lines, irrigation waters moved the NI down the soil profile with leachates faster than under suspended drip lines, thus creating a spatial separation between NI and dissolved N fertilizers [35]. In 2017 and 2018, we observed that the two combination treatments including 60 kg N ha−1 (with and without NI) applied through buried drip lines had similar NO3-N concentrations and this was also true for treatments including 120 kg N ha−1 (Figure 3b and Figure 4b–d). We also observed that buried drip lines had no effect on NH4+-N concentrations indicating that NI did not delay the conversion of NH4+ to NO3. Several factors could have affected the efficacy of NI in this blueberry production system. The layer of sawdust mulch may have induced warmer conditions, thus increasing the degradation rate of NI [38]. The soil used for this experiment is a silt loam with 5.27% organic matter content which suggests a reduced adsorption of NI in the soil [39]. The use of drip irrigation with high volume of water to offset evapotranspiration could have also enhanced the transport of NH4+ with leachates down the soil profile [9,16].
Another important result of this study that highlights the effect of NI to some extent is the increased soil pH with time associated with treatment combinations involving NI. The pH increased between 2016 and 2018 ranging from 0.05 to 0.15 units under treatment combinations involving NI (Figure 5a). Qiao et al. [7] observed that NI application increased soil pH by 0.23 units and suggested that this could alleviate soil acidification. Under treatment combinations not involving NI, the pH decreased between 2016 and 2018 ranging from 0.07 to 0.19 units (Figure 5a). The differences in soil pH change between treatment combinations involving NI or not indicate differences in the nitrification process and the fate of NO3 present in the soil. The increase in soil pH with time under treatment combinations involving NI indicates either a limited nitrification and therefore released of H+ in the rhizosphere or some absorption of NO3 by plant roots followed by released of OH to balance the negative charges. The decrease in soil pH with time under treatment combinations not involving NI indicates that nitrification proceeded which released H+ in the rhizosphere, but the positive charges were not balanced probably because NO3 was leached. It is clear that additional studies will be needed to understand how the use of NI with drip-fertigation in blueberry production systems affect N uptake and leaching and therefore N use efficiency and potential risk to the environment.

5. Conclusions

This three-year study evaluated the contribution of NI to berry yield production and mineral N changes in the soil profile. Results showed that NI effects on berry yield were not consistent throughout the three years of study. Part of the lack of effects on berry yield was due to the history of N fertilization in the site as these plants received equal amount of N between 2008 and 2015, thus resulting in robust and mature plants harboring sufficient N storage. Some annual variability was also observed with the fate of NH4+ and NO3 in relation with the use of NI. In 2016, there was an accumulation of NH4+ in the layer of sawdust mulch with treatment combinations involving NI and applied through suspended drip lines, but this was not observed in 2017 and 2018. While the accumulation of NH4+ in the layer of sawdust mulch was the result of NI, the dry growing seasons that prevailed in 2017 and 2018 prompted more irrigation events with increased volume of water that moved NI down the soil profile creating a spatial separation with NI and the nitrifying microorganisms.

Author Contributions

Conceptualization, A.J.M. and M.D.; Data curation, A.J.M., S.N. and S.Y.; Formal analysis, S.Y.; Funding acquisition, A.J.M.; Investigation, A.J.M.; Methodology, A.J.M., S.Y. and M.D.; Resources, A.J.M.; Writing—original draft, A.J.M. and S.N.; Writing—review and editing, A.J.M., S.N. and M.D. All authors have read and agreed to the published version of the manuscript.

Funding

This work was funded by Agriculture and Agri-Food Canada through an A-Base program (Project ID: J-001401—Sustainable production and genetic enhancement of small fruit crops with improved market oriented quality attributes).

Institutional Review Board Statement

Not Applicable.

Informed Consent Statement

Not Applicable.

Data Availability Statement

The data presented in this study are available withn the article and upon request.

Conflicts of Interest

All authors declare no conflict of interest.

References

  1. Arp, D.J.; Stein, L.Y. Metabolism of inorganic N compounds by ammonia-oxidizing bacteria. Crit. Rev. Biochem. Mol. Biol. 2003, 38, 471–495. [Google Scholar] [CrossRef]
  2. Huber, D.; Warren, H.; Nelson, D.; Tsai, C. Nitrification inhibitors: New tools for food production. BioScience 1977, 27, 523–529. [Google Scholar] [CrossRef]
  3. Schlesinger, W.H. On the fate of anthropogenic nitrogen. Proc. Natl. Acad. Sci. USA 2009, 106, 203–208. [Google Scholar] [CrossRef] [Green Version]
  4. Shaw, L.J.; Nicol, G.W.; Smith, Z.; Fear, J.; Prosser, J.I.; Baggs, E.M. Nitrosospira spp. can produce nitrous oxide via a nitrifier denitrification pathway. Environ. Microbiol. 2006, 8, 214–222. [Google Scholar] [CrossRef] [PubMed]
  5. Dinnes, D.L.; Karlen, D.; Jaynes, D.B.; Kaspar, T.; Hatfield, J.; Colvin, T.S.; Cambardella, C.A. Nitrogen management strategies to reduce nitrate leaching in tile drained midwestern soils. Agron. J. 2002, 94, 153–171. [Google Scholar] [CrossRef]
  6. Zaman, M.; Blennerhassett, J.D. Effects of the different rates of urease and nitrification inhibitors on gaseous emissions of ammonia and nitrous oxide, nitrate leaching and pasture production from urine patches in an intensive grazed pasture system. Agric. Ecosyst. Environ. 2010, 136, 236–246. [Google Scholar] [CrossRef]
  7. Qiao, C.; Liu, L.; Hu, S.; Compton, J.E.; Greaver, T.L.; Li, Q. How inhibiting nitrification affects nitrogen cycle and reduces environmental impacts of anthropogenic nitrogen input. Glob. Chang. Biol. 2015, 21, 1249–1257. [Google Scholar] [CrossRef]
  8. Marsden, K.A.; Marín-Martínez, A.J.; Vallejo, A.; Hill, P.W.; Jones, D.L.; Chadwick, D.R. The mobility of nitrification inhibitors under simulated ruminant urine deposition and rainfall: A comparison between DCD and DMPP. Biol. Fertil. Soils 2016, 52, 491–503. [Google Scholar] [CrossRef] [Green Version]
  9. Li, Y.; Hu, M.; Tenuta, M.; Ma, Z.; Gui, D.; Li, X.; Zeng, F.; Gao, X. Agronomic evaluation of polymercoated urea and urease and nitrification inhibitors for cotton production under drip-fertigation in a dry climate. Sci. Rep. 2020, 10, 1472. [Google Scholar] [CrossRef] [Green Version]
  10. Min, J.; Sun, H.; Kronzucker, H.J.; Wang, Y.; Shi, W. Comprehensive assessment of the effects of nitrification inhibitor application on reactive nitrogen loss in intensive vegetable production systems. Agric. Ecosyst. Environ. 2021, 307, 107227. [Google Scholar] [CrossRef]
  11. Morales, S.E.; Jha, N.; Saggar, S. Impact of urine and the application of the nitrification inhibitor DCD on microbial communities in dairy-grazed pasture soils. Soil Biol. Biochem. 2015, 88, 344–353. [Google Scholar] [CrossRef]
  12. Subbarao, G.V.; Nakahara, K.; Ishikawa, T.; Yoshihashi, T.; Ito, O.; Ono, H.; Ohnishi-Kameyama, M.; Yoshida, M.; Kawano, N.; Berry, W.L. Free fatty acids from the pasture grass Brachiaria humidicola and one of their methyl esters as inhibitors of nitrification. Plant Soil 2008, 313, 89–99. [Google Scholar] [CrossRef]
  13. Subbarao, G.V.; Nakahara, K.; Ishikawa, T.; Yoshihashi, T.; Ito, O.; Ono, H.; Ohnishi-Kameyama, M.; Yoshida, M.; Kawano, N.; Berry, W.L. Evidence for biological nitrification inhibition in Brachiaria pastures. Proc. Natl. Acad. Sci. USA 2009, 106, 17302–17307. [Google Scholar] [CrossRef] [PubMed] [Green Version]
  14. Guardia, G.; Marsden, K.A.; Vallejo, A.; Jones, D.L.; Chadwick, D.R. Determining the influence of environmental and edaphic factors on the fate of the nitrification inhibitors DCD and DMPP in soil. Sci. Total Environ. 2018, 624, 1202–1212. [Google Scholar] [CrossRef] [PubMed] [Green Version]
  15. Messiga, A.; Haak, D.; Dorais, M. Blueberry yield and soil properties response to long-term fertigation and broadcast nitrogen. Sci. Hortic. 2018, 230, 92–101. [Google Scholar] [CrossRef]
  16. Messiga, A.J.; Dyck, K.; Ronda, K.; van Baar, K.; Haak, D.; Yu, S.; Dorais, M. Nutrients leaching in response to long-term fertigation and broadcast nitrogen in blueberry production. Plants 2020, 9, 1530. [Google Scholar] [CrossRef]
  17. Poonnachit, U.; Darnell, R. Effect of ammonium and nitrate on ferric chelate reductase and nitrate reductase in Vaccinium species. Ann. Bot. 2004, 93, 399–405. [Google Scholar] [CrossRef] [PubMed]
  18. BCMAL. British Columbia Ministry of Agriculture and Lands, BC Berry Production Guides. 2020. Available online: https://www2.gov.bc.ca/gov/content/industry/agriservice-bc/production-guides/berries (accessed on 3 September 2020).
  19. Forge, T.; Ehret, D.; Messiga, A.; Dorais, M. Influences of nitrogen inputs on nematode populations under highbush blueberry. J. Nematol. 2020, 52, e2020-56. [Google Scholar] [CrossRef]
  20. Ehret, D.L.; Frey, B.; Forge, T.; Helmer, T.; Bryla, D.R.; Zebarth, B.J. Effects of nitrogen rate and application method on early production and fruit quality in highbush blueberry. Can. J. Plant Sci. 2014, 94, 1165–1179. [Google Scholar] [CrossRef]
  21. Bryla, D.R.; Strik, B.C.; Bañados, M.P.; Righetti, T.L. Response of highbush blueberry to nitrogen fertilizer during field establishment, II: Plant nutrient requirements in relation to nitrogen fertilizer supply. HortScience 2012, 47, 917–926. [Google Scholar] [CrossRef]
  22. Soil Survey Staff. Keys to Soil Taxonomy, 11th ed.; NRCS: Washington, DC, USA, 2010.
  23. Environment and Climate Change Canada (ECCC). 2020. Canadian Climate Normals 1981–2010 Station Data. Date Modified: 17 September 2020. Available online: https://climate.weather.gc.ca/climate_normals/results_1981_2010_e.html?stnID=707&autofwd=1 (accessed on 12 December 2020).
  24. Ehret, D.L.; Frey, B.; Forge, T.; Helmer, T.; Bryla, D.R. Age-related changes in response of highbush blueberry plants to drip Irrigation. HortScience 2015, 50, 486–490. [Google Scholar] [CrossRef] [Green Version]
  25. British Columbia Ministry of Agriculture and Lands. Berry Production Guide; BC Ministry of Agriculture and Lands: Victoria, BC, Canada, 2009.
  26. Maynard, D.G.; Kalra, Y.P.; Crambaugh, J.A. Nitrate and exchangeable ammonium nitrogen. In Soil Sampling and Methods of Analysis, 2nd ed.; Carter, M.R., Gregorich, E.G., Eds.; CRC Press: Boca Raton, FL, USA, 2007; pp. 607–616. [Google Scholar]
  27. Hendershot, W.H.; Lalande, H.; Duquette, M. Ion exchange and exchangeable cations. In Soil Sampling and Methods of Analysis; Carter, M.R., Gregorich, E.G., Eds.; Lewis Publishers: Boca Raton, FL, USA, 1993; pp. 183–205. [Google Scholar]
  28. SAS Institute. SAS User’s Guide: Statistics, 3rd ed.; Version 9; SAS Institute: Cary, NC, USA, 2010. [Google Scholar]
  29. Li, S.X.; Wang, Z.H.; Stewart, B.A. Responses of crop plants to ammonium and nitrate N. In Advances in Agronomy; Sparks, D.L., Ed.; Academic Press: New York, NY, USA, 2013; pp. 205–397. [Google Scholar]
  30. Liu, T.; Liang, Y.; Chu, G. Nitrapyrin addition mitigates nitrous oxide emissions and raises nitrogen use efficiency in plastic-film mulched drip-fertigated cotton field. PLoS ONE 2017, 12, e0176305. [Google Scholar] [CrossRef]
  31. Cui, M.; Zeng, L.; Qin, W.; Feng, J. Measures for reducing nitrate leaching in orchards: A review. Environ. Pollut. 2020, 263, 114553. [Google Scholar] [CrossRef] [PubMed]
  32. Serna, M.D.; Legaz, F.; PrimoMillo, E. Improvement of the n fertilizer efficiency with dicyandiamide (dcd) in citrus trees. Fert. Res. 1996, 43, 137–142. [Google Scholar] [CrossRef]
  33. Holzapfel, E.A.; Hepp, R.F.; Mariño, M.A. Effect of irrigation on fruit production in blueberry. Agric. Water Manag. 2004, 67, 173–184. [Google Scholar] [CrossRef]
  34. Retamales, J.B.; Hancock, J.F. Blueberries; Crop Production Science in Horticulture Series 21; CAB International: Wallingford, UK, 2012. [Google Scholar]
  35. Ruser, R.; Schulz, R. The effect of nitrification inhibitors on the nitrous oxide (N2O) release from agricultural soils—A review. J. Plant Nutr. Soil Sci. 2015, 178, 171–188. [Google Scholar] [CrossRef]
  36. Shepherd, M.; Wyatt, J.; Welten, B. Effect of soil type and rainfall on dicyandiamide concentrations in drainage from lysimeters. Soil Res. 2012, 50, 67–75. [Google Scholar] [CrossRef]
  37. Kim, D.-G.; Giltrap, D.; Saggar, S.; Palmada, T.; Berben, P.; Drysdale, D. Fate of the nitrification inhibitor dicyandiamide (DCD) sprayed on a grazed pasture: Effect of rate and time of application. Soil Res. 2012, 50, 337–347. [Google Scholar] [CrossRef]
  38. Kelliher, F.M.; Clough, T.J.; Clark, H.; Rys, G.; Sedcole, J.R. The temperature dependence of dicyandiamide (DCD) degradation in soils: A data synthesis. Soil Biol. Biochem. 2008, 40, 1878–1882. [Google Scholar] [CrossRef]
  39. McGeough, K.L.; Watson, C.J.; Müller, C.; Laughlin, R.J.; Chadwick, D.R. Evidence that the efficacy of the nitrification inhibitor dicyandiamide (DCD) is affected by soil properties in UK soils. Soil Biol. Biochem. 2016, 940, 222–232. [Google Scholar] [CrossRef]
Figure 1. Average monthly precipitation and air temperatures during the periods (a) 2016, (b) 2017, and (c) 2018.
Agronomy 11 02144 g001
Figure 2. Concentrations of (ac) ammonium nitrogen (NH4+-N, mg kg−1) and (df) nitrate nitrogen (NO3-N, mg kg−1) at 0–15 cm, 15–30 cm, 30–60 cm and sawdust mulch layer (0 cm; 8 cm of sawdust) with annual applications of combination of nitrogen fertilizer rates and nitrification inhibitors (2-chloro-6-(trichloromethyl)-pyridine (Nitra-pyrin), di-cycandiamide (DCD)) in soils collected in a long-term blueberry experiment during the growing season (spring, summer, fall) in 2016 (N = 396).
Agronomy 11 02144 g002
Figure 3. Concentrations of (a) ammonium nitrogen (NH4+-N, mg kg−1) and (b,c) nitrate nitrogen (NO3-N, mg kg−1) among treatment combinations and soil depth with annual applications of combination of nitrogen fertilizer rates and nitrification inhibitors (2-chloro-6-(trichloromethyl)-pyridine (Nitra-pyrin), di-cycandiamide (DCD)) in soils collected in a long-term blueberry experiment during the growing season (spring, summer, fall) in 2017 (N = 396).
Agronomy 11 02144 g003
Figure 4. Concentrations of (a) ammonium nitrogen (NH4-N, mg kg−1) and (bd) nitrate nitrogen (NO3-N, mg kg−1) among treatment combinations and soil depth with annual applications of combination of nitrogen fertilizer rates and nitrification inhibitors (2-chloro-6-(trichloromethyl)-pyridine (Nitra-pyrin), di-cycandiamide (DCD)) in soils collected in a long-term blueberry experiment during the growing season (spring, summer, fall) in 2018 (N = 396).
Agronomy 11 02144 g004
Figure 5. (a,b) Soil acidity (pH) and (c,d) electrical conductivity (EC, µS cm−1) with annual applications of combination of nitrogen fertilizer and nitrification inhibitors (2-chloro-6-(trichloromethyl)-pyridine (Nitra-pyrin), di-cycandiamide (DCD)) in soils collected in fall at different depths (0–15 cm, 15–30 cm and 30–60 cm) in 2016, 2017 and 2018 in a long-term blueberry experiment (N = 108).
Agronomy 11 02144 g005
Table 1. Description of experimental treatments including combinations of annual nitrogen application rates and nitrification inhibitor (2-chloro-6-(trichloromethyl)-pyridine (Nitra-pyrin), di-cycandiamide (DCD)) and methods, and placement of irrigation/fertigation lines in the long-term blueberry experiment.
Modifications of Treatments during the Three Successive TrialsTreatment Description between 2016 and 2018
Treatment Plots2006–20122013–20152016–2018Rate of Nitrogen Application and Method of ApplicationPlacement of Fertigation Lines
1CONTCONTCONTCONT, 0 kg N ha−1 yr−1
2Heavy water-Suspended-120N120 N ha−1 yr−1 applied by fertigation (high N rate)Suspended line
3Heavy water-Buried-60N60 N ha−1 yr−1 applied by fertigation (low N rate)Buried line
4Heavy waterNo Humic AcidSuspended-60N-DCD60 N ha−1 yr−1 applied by fertigation (low rate)Suspended line
5Heavy waterWith Humic AcidBuried-60N-DCD60 N ha−1 yr−1 combined with inhibitor (DCD) applied by fertigation (low rate)Buried line
6Moderate water-Suspended-60N60 N ha−1 yr−1 applied by fertigation (low rate)Suspended line
7Moderate water-Buried-120N120 N ha−1 yr−1 applied by fertigation (high N rate)Buried line
8Moderate waterWith Humic AcidSuspended-120N-DCD120 N ha−1 yr−1 combined with inhibitor (DCD) applied by fertigation (high rate)Suspended line
9Moderate waterNo Humic AcidBuried-120N-DCD120 N ha−1 yr−1 combined with inhibitor (DCD) applied by fertigation (high rate)Buried line
Table 2. Total berry yield (Mg ha−1) with varying combinations of nitrogen rates (60 and 120 kg N ha−1), fertigation methods (suspended and buried) and inhibitor (2-chloro-6-(trichloromethyl)-pyridine (Nitra-pyrin), di-cycandiamide (DCD)) to blueberry during three production years (2016–2018).
Treatments201620172018
CONT a49.518.6026.18
Suspended-60N48.2311.6527.04
Suspended-60N-DCD44.529.2426.29
Suspended-120N51.4511.6625.75
Suspended-120N-DCD46.8310.3527.16
Buried-60N50.3610.4828.96
Buried-60N-DCD46.449.3726.81
Buried-120N42.5811.2125.90
Buried-120N-DCD45.939.7027.61
SEM b3.800.4663.321
p values c0.376<0.0010.991
Contrasts p values
CONT vs. All0.0720.2660.669
Suspended-60N-DCD vs. Suspended-60N0.198<0.0010.752
Suspended-120N-DCD vs. Suspended-120N0.549<0.0010.864
Buried-60N-DCD vs. Buried-60N0.8250.0050.409
Buried-120N-DCD vs. Buried-120N0.548<0.0010.794
Buried-60N-DCD vs. Buried-120N0.4870.0010.768
Buried-60N-DCD vs. Suspended-120N0.3540.0100.669
Suspended-60N-DCD vs. Suspended-120N0.8940.0460.811
a CONT: control (0 kg N ha−1). b SEM: standard error of the mean. c Probability values.
Table 3. Results of ANOVA for the concentrations of ammonium nitrogen (NH4+-N, mg kg−1) and nitrate nitrogen (NO3-N, mg kg−1) with annual applications of combination of nitrogen fertilizer and nitrification inhibitors (2-chloro-6-(trichloromethyl)-pyridine (Nitra-pyrin), di-cycandiamide (DCD)) in soils collected during the growing season (spring, summer, fall) at different depths (sawdust layer, 0–15 cm, 15–30 cm and 30–60 cm) in 2016, 2017 and 2018 in a long-term blueberry experiment (N = 396).
201620172018
NH4+-NNO3-NNH4+-NNO3-NNH4+-NNO3-N
Treatment0.081 a<0.0010.5890.1040.762<0.001
Depth<0.001<0.001<0.0010.0040.009<0.001
Treatment × Depth0.001<0.0010.8630.1750.885<0.001
Season0.070<0.0010.174<0.001<0.001<0.001
Treatment × Season0.004<0.0010.6780.0090.156<0.001
Depth × Season0.002<0.0010.1270.0110.001<0.001
Treatment × Depth × Season<0.0010.0010.78670.1250.722<0.001
a probability values.
Table 4. Results of ANOVA for soil acidity (pH) and electrical conductivity (EC, µS cm−1) with annual applications of combination of nitrogen fertilizer and nitrification inhibitors (2-chloro-6-(trichloromethyl)-pyridine (Nitrapyrin), dicycandiamide (DCD)) in soils collected in fall at different depths (0–15 cm, 15–30 cm and 30–60 cm) in 2016, 2017 and 2018 in a long-term blueberry experiment (N = 108).
201620172018
pHECpHECpHEC
Treatment0.002 a0.0160.0450.8540.0080.899
Depth<0.001<0.001<0.001<0.001<0.001<0.001
Treatment × Depth0.8330.3130.7290.9740.3390.657
a probability values.
Publisher’s Note: MDPI stays neutral with regard to jurisdictional claims in published maps and institutional affiliations.

