
Soil and Plant Nutrient Analysis with a Portable XRF Probe Using a Single Calibration


Abstract
:1. Introduction
2. Materials and Methods
2.1. Forage Plant Samples Collection and Preparation
2.2. Wet Chemical Analysis (Standard Method)
2.3. pXRF Probe Assays and Analysis
2.4. Quality Control
2.5. Data Collection and Statiscal Analyses
2.5.1. Descriptive Statistics
2.5.2. Modeling
2.5.3. Validation
3. Results
3.1. Exploratory Data Analysis Variation
3.2. pXRF and ICP Measurements Relationship
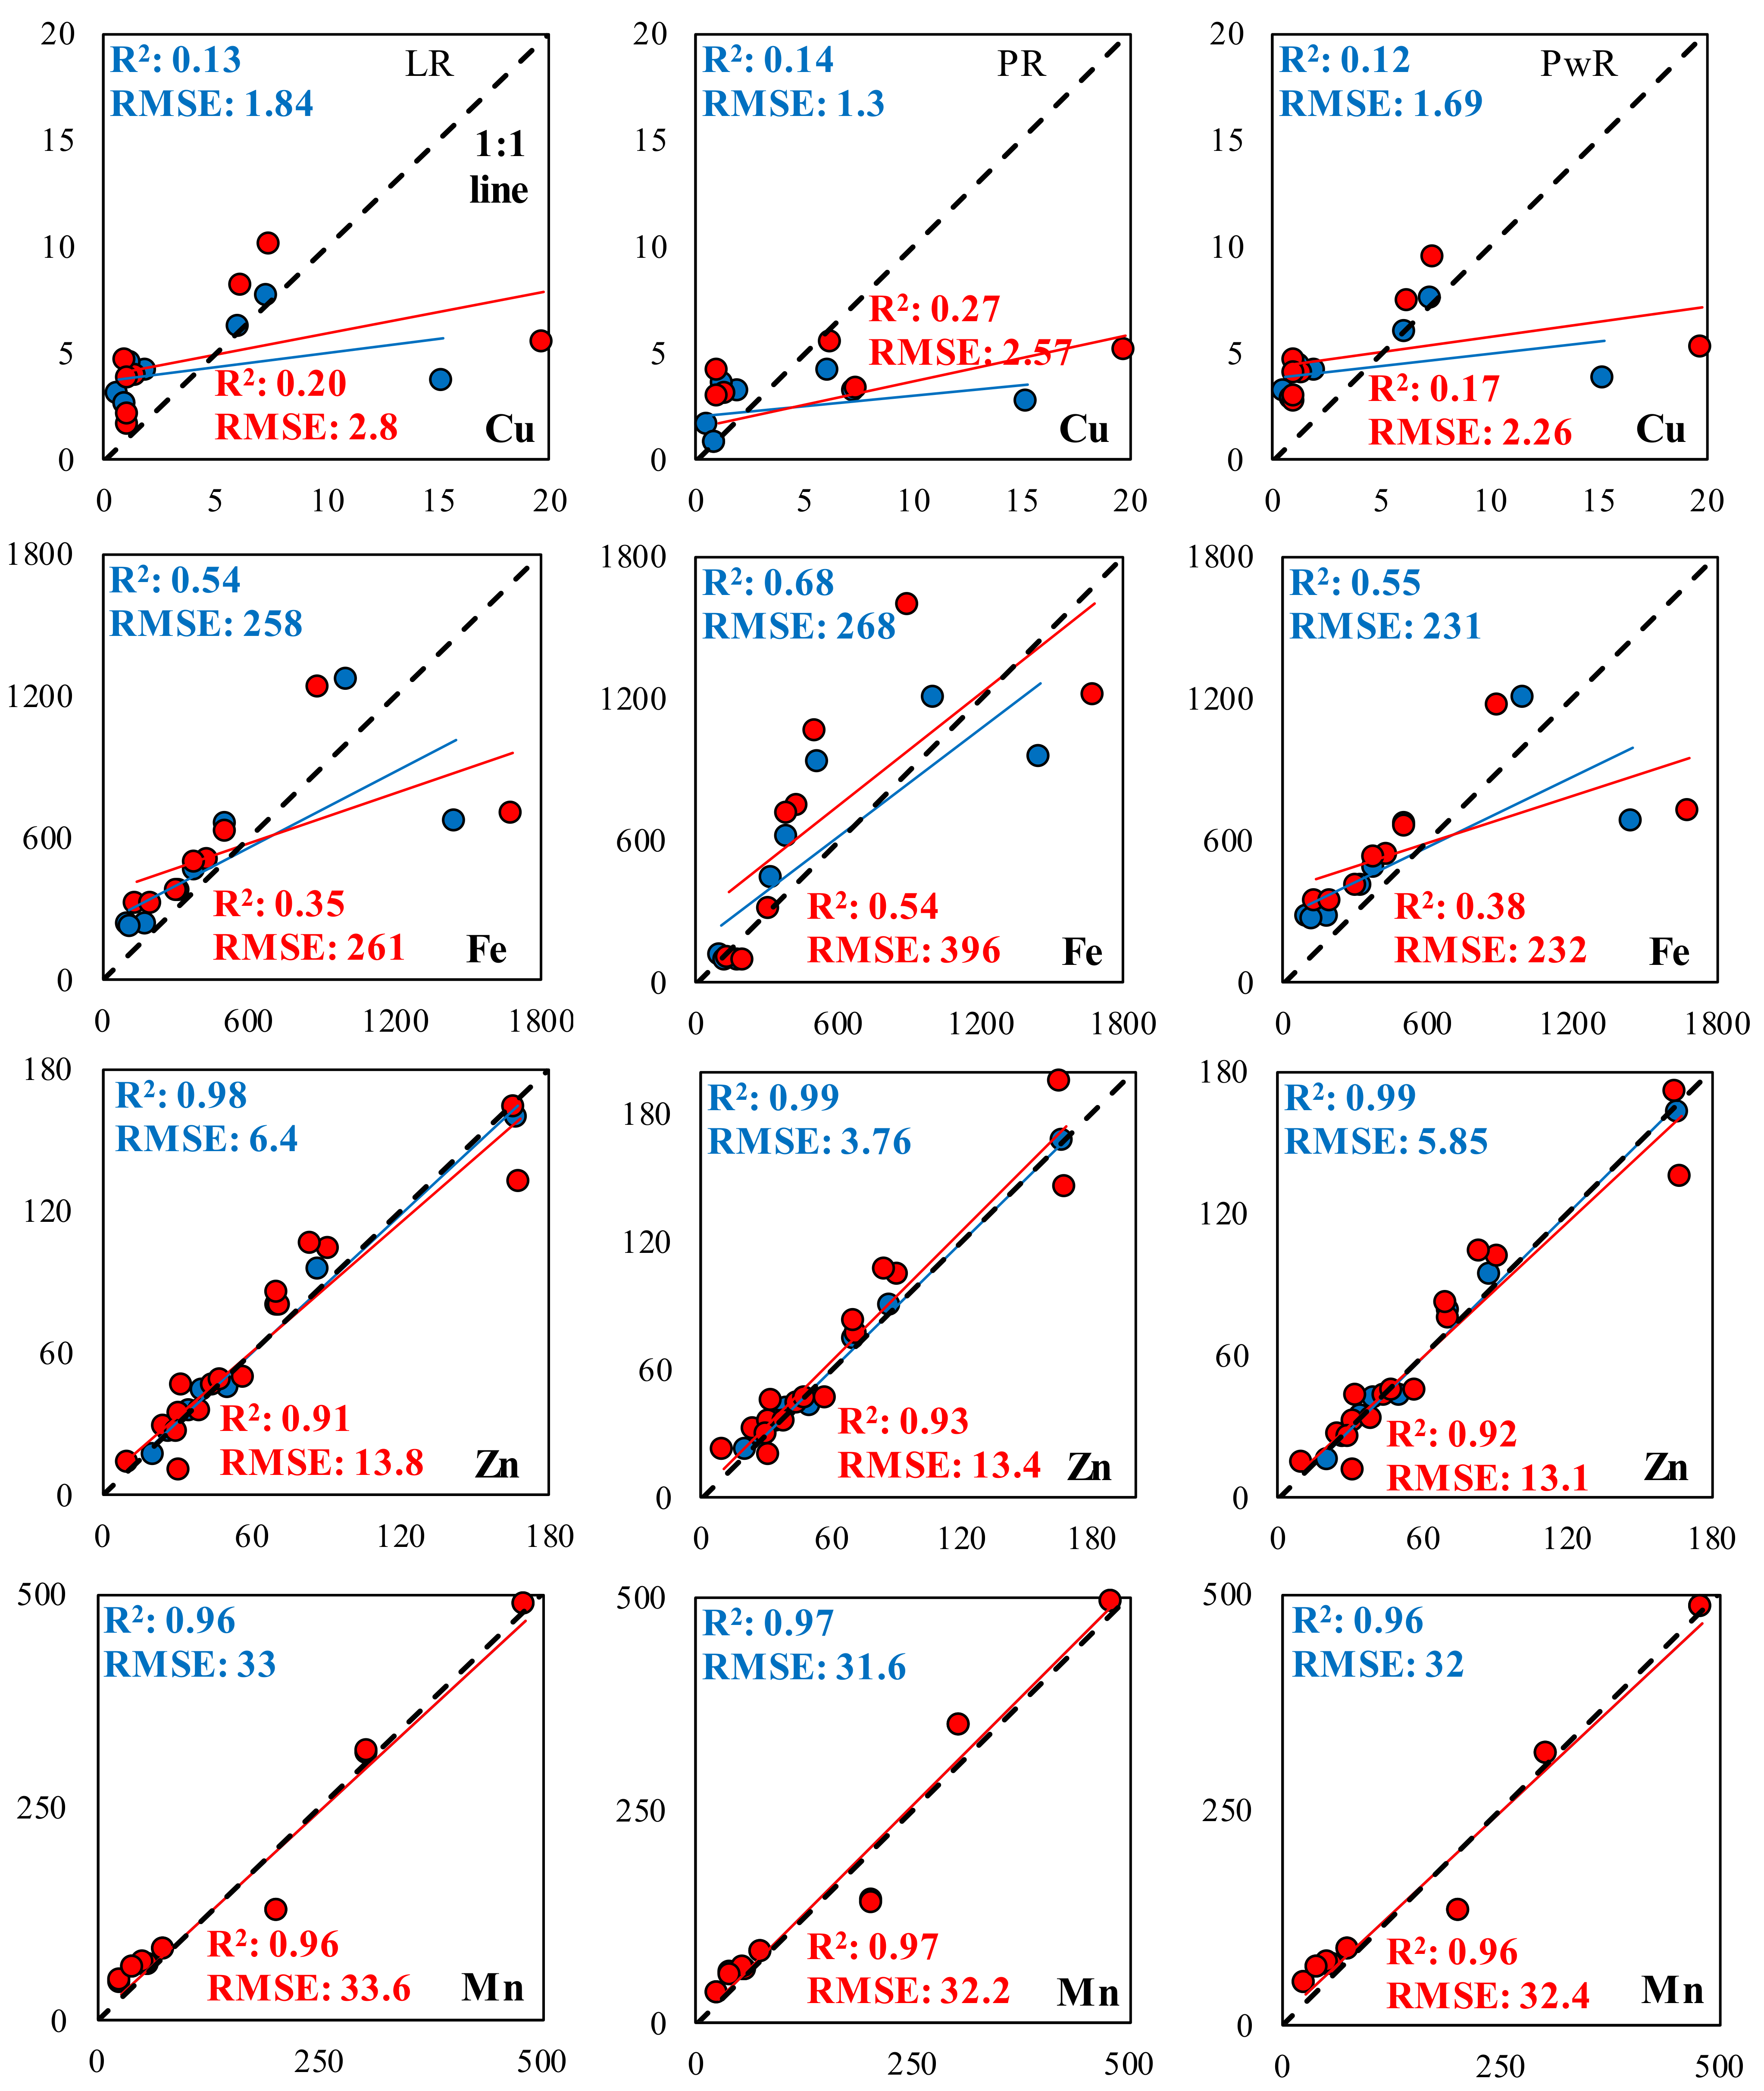
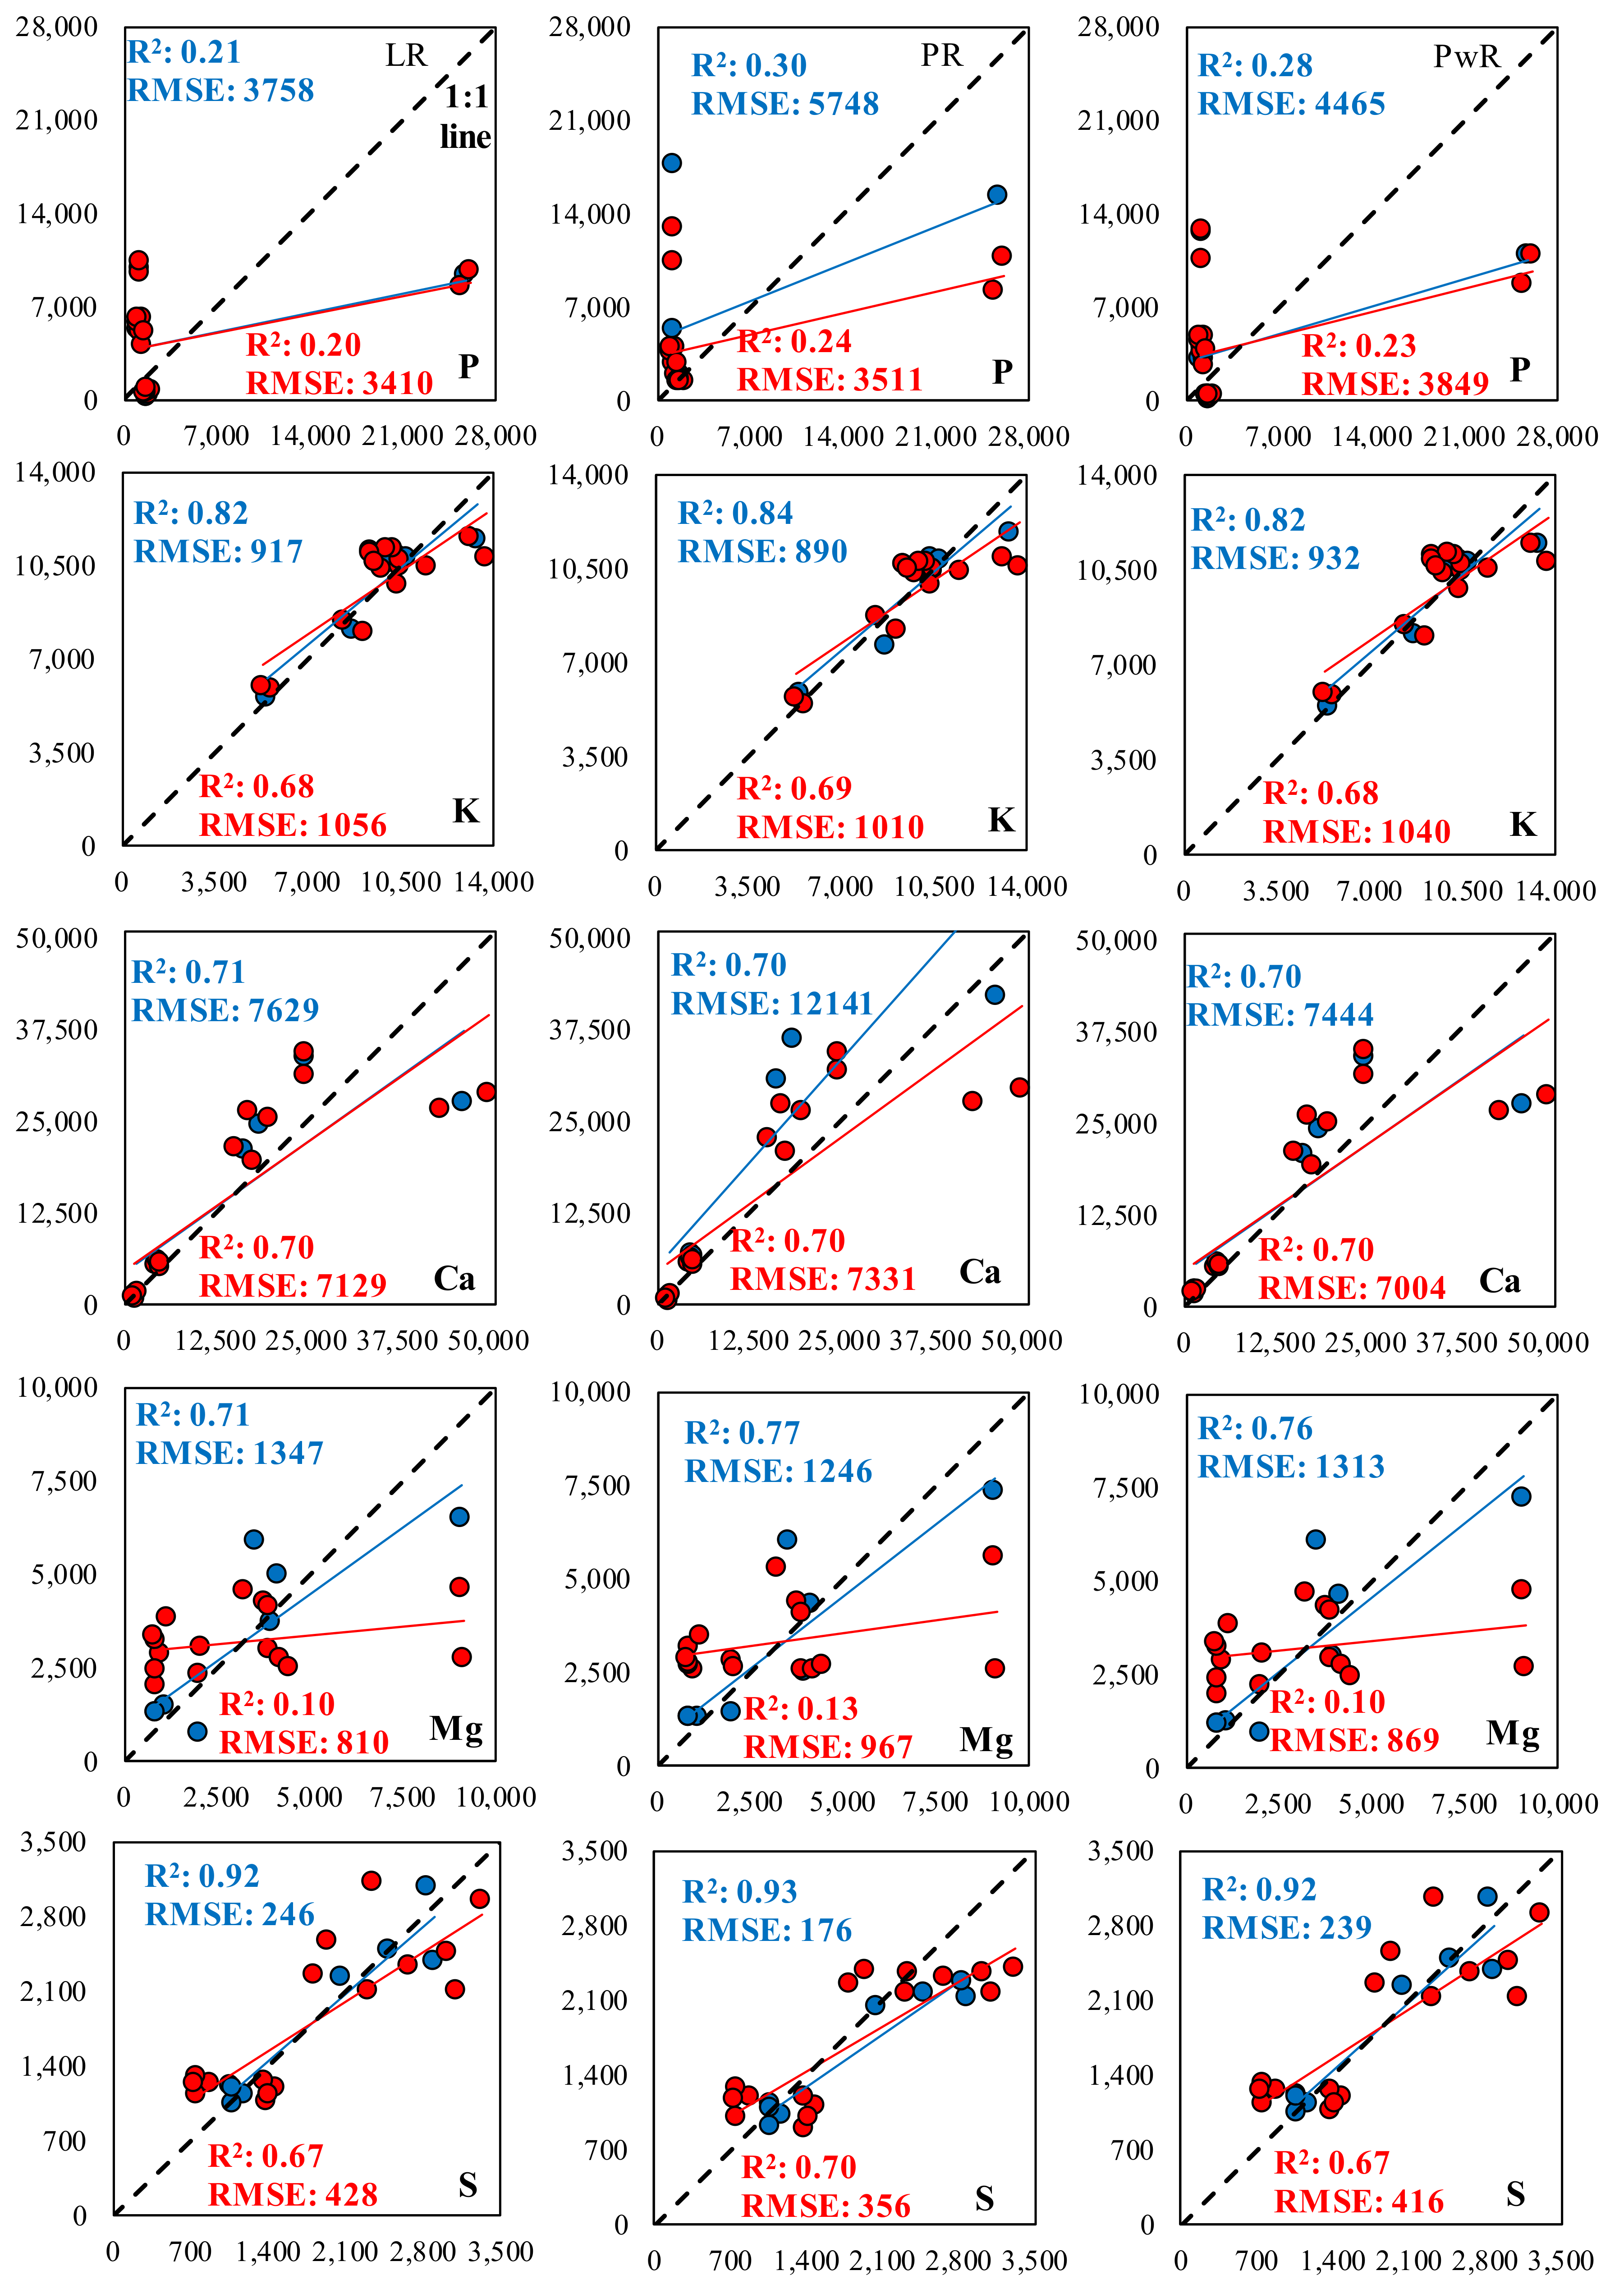
3.3. Regression Models
4. Discussion
Supplementary Materials
Author Contributions
Funding
Institutional Review Board Statement
Informed Consent Statement
Data Availability Statement
Conflicts of Interest
References
- McLaren, T.I.; Guppy, C.N.; Tighe, M.K. A rapid and nondestructive plant nutrient analysis using portable X-ray fluorescence. Soil Sci. Soc. Am. J. 2012, 76, 1446–1453. [Google Scholar] [CrossRef]
- Towett, E.K.; Shepherd, K.D.; Lee Drake, B. Plant elemental composition and Portable X-ray Fluorescence (pxrf) spectroscopy: Quantification under different analytical parameters. X-ray Spectrom. 2016, 45, 117–124. [Google Scholar] [CrossRef] [Green Version]
- Sapkota, Y.; McDonald, L.M.; Griggs, T.C.; Basden, T.J.; Drake, B.L. Portable X-ray fluorescence spectroscopy for rapid and cost-effective determination of elemental composition of ground forage. Front. Plant Sci. 2019, 10, 317. [Google Scholar] [CrossRef] [PubMed] [Green Version]
- Costa, G.T., Jr.; Nunes, L.C.; Feresin Gomes, M.H.; Almeida, E.; de Carvalho, H.W.P. Direct determination of mineral nutrients in soybean leaves under vivo conditions by portable x-ray Fluorescence Spectroscopy. X-ray Spectrom. 2020, 49, 274–283. [Google Scholar]
- Kalra, Y.P. Handbook of Reference Methods for Plant Analysis; CRC Press: Boca Raton, FL, USA, 2019. [Google Scholar]
- Pelegrino, M.H.; Silva, S.H.; de Faria, Á.J.; Mancini, M.; Teixeira, A.F.; Chakraborty, S.; Weindorf, D.C.; Guilherme, L.R.; Curi, N. Prediction of soil nutrient content via pXRF spectrometry and its spatial variation in a highly variable tropical area. Precis. Agric. 2021, 22, 1–17. [Google Scholar]
- Reidinger, S.; Ramsey, M.H.; Hartley, S.E. Rapid and accurate analyses of silicon and phosphorus in plants using a portable X-ray Fluorescence Spectrometer. New Phytol. 2012, 195, 699–706. [Google Scholar] [CrossRef] [PubMed]
- Zhang, H.; Antonangelo, J.; Penn, C. Development of a rapid field testing method for metals in horizontal directional drilling residuals with XRF sensor. Sci. Rep. 2021, 11, 3901. [Google Scholar] [CrossRef] [PubMed]
- Westerman, R.L. Soil Testing and Plant Analysis; Soil Science Society of America: Madison, WI, USA, 1990. [Google Scholar]
- Willmott, C.J.; Ackleson, S.G.; Davis, R.E.; Feddema, J.J.; Klink, K.M.; Legates, D.R.; O’Donnell, J.; Rowe, C.M. Statistics for the evaluation and comparison of Models. J. Geophys. Res. 1985, 90, 8995. [Google Scholar] [CrossRef] [Green Version]
- Chang, C.-W.; Laird, D.A.; Mausbach, M.J.; Hurburgh, C.R. Near-infrared reflectance spectroscopy-principal components regression analyses of soil properties. Soil Sci. Soc. Am. J. 2001, 65, 480–490. [Google Scholar] [CrossRef] [Green Version]
- Peng, J.-L.; Kim, M.-J.; Jo, M.-H.; Min, D.-H.; Kim, K.-D.; Lee, B.-H.; Kim, B.-W.; Sung, K.-I. Accuracy evaluation of the crop-weather yield predictive models of Italian ryegrass and forage rye using cross-validation. J. Crop Sci. Biotechnol. 2017, 20, 327–334. [Google Scholar] [CrossRef]
- Rinaldi, M.; Losavio, N.; Flagella, Z. Evaluation and application of the OILCROP–sun model for sunflower in southern Italy. Agric. Syst. 2003, 78, 17–30. [Google Scholar] [CrossRef]
- Andrade, R.; Silva, S.H.; Faria, W.M.; Poggere, G.C.; Barbosa, J.Z.; Guilherme, L.R.; Curi, N. Proximal sensing applied to soil texture prediction and mapping in Brazil. Geoderma Reg. 2020, 23, e00321. [Google Scholar] [CrossRef]
- Benedet, L.; Acuña-Guzman, S.F.; Faria, W.M.; Silva, S.H.; Mancini, M.; Teixeira, A.F.; Pierangeli, L.M.; Acerbi Júnior, F.W.; Gomide, L.R.; Pádua Júnior, A.L.; et al. Rapid soil fertility prediction using x-ray fluorescence data and machine learning algorithms. CATENA 2021, 197, 105003. [Google Scholar] [CrossRef]
- Chatterjee, S.; Hartemink, A.E.; Triantafilis, J.; Desai, A.R.; Soldat, D.; Zhu, J.; Townsend, P.A.; Zhang, Y.; Huang, J. Characterization of field-scale soil variation using a stepwise multi-sensor fusion approach and a cost-benefit analysis. CATENA 2021, 201, 105190. [Google Scholar] [CrossRef]
- Vasques, G.M.; Rodrigues, H.M.; Coelho, M.R.; Baca, J.F.; Dart, R.O.; Oliveira, R.P.; Teixeira, W.G.; Ceddia, M.B. Field proximal SOIL sensor fusion for Improving High-resolution Soil Property Maps. Soil Syst. 2020, 4, 52. [Google Scholar] [CrossRef]


| Element | Average CV of all Plant Samples (n = 8) % | CV for CRM % | Difference between Mean Standard and CRM Measurement % |
|---|---|---|---|
| pXRF (net intensity) a | pXRF (mg kg−1) a | ||
| P | 2.1 | 11.1 | 4.5 |
| K | 0.7 | 0.6 | 3.1 |
| Ca | 0.8 | 0.5 | 0.7 |
| Mg | 9.5 | 30.2 | 14.7 |
| S | 2.0 | 5.1 | 13.5 |
| Cu | 14.3 | 1.9 | 3.6 |
| Fe | 1.2 | 0.4 | 0.5 |
| Zn | 8.4 | 1.0 | 10.2 |
| Mn | 3.0 | 1.5 | 1.1 |
| ICP-AES (mg kg−1) b | |||
| P | 0.9 | 3.5 | 2.5 |
| K | 5.3 | 0.0 | 3.0 |
| Ca | 0.8 | 11.1 | 6.3 |
| Mg | 4.4 | 8.7 | 12 |
| S | 26.4 | 19.7 | 4.3 |
| Cu | 19.5 | 2.4 | 2.7 |
| Fe | 16 | 17 | 13.4 |
| Zn | 7.3 | 5.9 | 15 |
| Mn | 0.3 | 13.2 | 1.1 |
| Statistic | P | K | Ca | Mg | S | Cu | Fe | Zn | Mn |
|---|---|---|---|---|---|---|---|---|---|
| pXRF intensity | |||||||||
| Mean | 17,423 | 96,167 | 137,003 | 1106 | 7092 | 2033 | 27,282 | 3583 | 7891 |
| SD | 10,238 | 22,076 | 106,038 | 215 | 3284 | 445 | 17,389 | 2623 | 7913 |
| SE of mean | 3620 | 7805 | 37,490 | 76 | 1161 | 157 | 6148 | 927 | 2798 |
| Minimum | 5918 | 48,799 | 23,960 | 876 | 3789 | 1605 | 13,114 | 1022 | 2375 |
| Median | 19,295 | 105,072 | 122,531 | 1046 | 6579 | 1946 | 22,486 | 2550 | 3820 |
| Maximum | 31,199 | 114,465 | 289,205 | 1406 | 12,282 | 2862 | 64,273 | 8969 | 24,302 |
| CV (%) | 0.6 | 0.2 | 0.8 | 0.2 | 0.5 | 0.2 | 0.6 | 0.7 | 1.0 |
| Wet chemistry (elemental concentration, mg kg−1) | |||||||||
| Mean | 4556 | 9785 | 15,009 | 3220 | 1835 | 4 | 511 | 63 | 156 |
| SD | 8559 | 2211 | 15,495 | 2751 | 821 | 5 | 478 | 48 | 163 |
| SE of mean | 3026 | 782 | 5478 | 973 | 290 | 2 | 169 | 17 | 58 |
| Minimum | 1145 | 5475 | 1550 | 850 | 1075 | 1 | 105 | 21 | 26 |
| Median | 1630 | 9978 | 10,835 | 2810 | 1620 | 2 | 353 | 46 | 67 |
| Maximum | 25,725 | 13,410 | 46,765 | 9100 | 2890 | 15 | 1452 | 167 | 481 |
| CV (%) | 1.9 | 0.2 | 1.0 | 0.9 | 0.4 | 1.2 | 0.9 | 0.8 | 1.0 |
| Element | Intercept | Intercept | Slope | Slope | R2 | d-Index |
|---|---|---|---|---|---|---|
| Value | SE | Value | SE | Slope Corrected a | ||
| P | −2103 | 6035 | 0.38 NS | 0.30 | 0.21 | 0.58 |
| K | 1063 | 1705 | 0.09 ** | 0.02 | 0.82 | 0.88 |
| Ca | −1804 | 5477 | 0.12 ** | 0.03 | 0.71 | 0.90 |
| Mg | −8719 | 3160 | 10.8 ** | 2.8 | 0.71 | 0.37 |
| S | 137 | 229 | 0.24 *** | 0.03 | 0.92 | 0.97 |
| Cu | −4.0 | 9.1 | 0.004 NS | 0.004 | 0.13 | 0.34 |
| Fe | −39.8 | 242 | 0.02 * | 0.007 | 0.54 | 0.82 |
| Zn | −1.95 | 4.04 | 0.02 *** | 0.000 | 0.98 | 0.99 |
| Mn | −4.17 | 17.4 | 0.02 *** | 0.002 | 0.98 | 0.99 |
| Parameter | P | K | Ca | Mg | S | Cu | Fe | Zn | Mn |
|---|---|---|---|---|---|---|---|---|---|
| LR | |||||||||
| R2 | 0.21 NS | 0.82 ** | 0.71 ** | 0.71 ** | 0.92 *** | 0.13 NS | 0.54 * | 0.98 *** | 0.96 *** |
| RMSE | 8222 | 1013 | 9085 | 1598 | 257 | 5.16 | 351 | 6.45 | 34 |
| NRMSE | 1.80 | 0.10 | 0.61 | 0.50 | 0.14 | 1.20 | 0.69 | 0.10 | 0.22 |
| MAE | 5285 | 658 | 4998 | 1069 | 159 | 2.89 | 197 | 4.74 | 19 |
| RPD | 1.04 | 2.18 | 1.71 | 1.72 | 3.19 | 0.99 | 1.36 | 7.38 | 4.85 |
| PR | |||||||||
| R2 | 0.30 NS | 0.84 * | 0.71 * | 0.77 * | 0.93 ** | 0.15 NS | 0.68 NS | 0.99 *** | 0.97 *** |
| RMSE | 8466 | 1062 | 9895 | 1567 | 251 | 5.58 | 318 | 4.10 | 33 |
| NRMSE | 1.86 | 0.11 | 0.66 | 0.49 | 0.14 | 1.30 | 0.62 | 0.07 | 0.21 |
| MAE | 4562 | 706 | 8694 | 943 | 261 | 2.96 | 199 | 2.27 | 20 |
| RPD | 1.01 | 2.08 | 1.57 | 1.76 | 3.27 | 0.92 | 1.50 | 11.60 | 4.89 |
| PwR | |||||||||
| R2 | 0.27 NS | 0.82 *** | 0.70 ** | 0.76 *** | 0.92 *** | 0.12 NS | 0.54 ** | 0.99 *** | 0.96 *** |
| RMSE | 6817 | 883 | 7901 | 1260 | 219 | 4.49 | 304 | 5.14 | 29 |
| NRMSE | 1.50 | 0.09 | 0.53 | 0.39 | 0.12 | 1.04 | 0.60 | 0.08 | 0.19 |
| MAE | 4681 | 666 | 5061 | 962 | 157 | 2.95 | 213 | 4.48 | 21 |
| RPD | 1.26 | 2.50 | 1.96 | 2.18 | 3.74 | 1.14 | 1.57 | 9.27 | 5.58 |
Publisher’s Note: MDPI stays neutral with regard to jurisdictional claims in published maps and institutional affiliations. |
© 2021 by the authors. Licensee MDPI, Basel, Switzerland. This article is an open access article distributed under the terms and conditions of the Creative Commons Attribution (CC BY) license (https://creativecommons.org/licenses/by/4.0/).
Share and Cite
Antonangelo, J.; Zhang, H. Soil and Plant Nutrient Analysis with a Portable XRF Probe Using a Single Calibration. Agronomy 2021, 11, 2118. https://doi.org/10.3390/agronomy11112118
Antonangelo J, Zhang H. Soil and Plant Nutrient Analysis with a Portable XRF Probe Using a Single Calibration. Agronomy. 2021; 11(11):2118. https://doi.org/10.3390/agronomy11112118
Chicago/Turabian StyleAntonangelo, João, and Hailin Zhang. 2021. "Soil and Plant Nutrient Analysis with a Portable XRF Probe Using a Single Calibration" Agronomy 11, no. 11: 2118. https://doi.org/10.3390/agronomy11112118
APA StyleAntonangelo, J., & Zhang, H. (2021). Soil and Plant Nutrient Analysis with a Portable XRF Probe Using a Single Calibration. Agronomy, 11(11), 2118. https://doi.org/10.3390/agronomy11112118