Article

Investigation of the Effects of Probiotics on Sub-Chronic Neonicotinoid Toxicity in Rats

1
Department of Medical Pharmacology, Faculty of Medicine, Kastamonu University, Kastamonu 37150, Turkey
2
Department of Pharmacology, Faculty of Medicine, Ataturk University, Erzurum 25240, Turkey
3
Laboratory of Toxicology & Forensic Sciences, Faculty of Medicine, University of Crete, 71003 Heraklion, Greece
4
Department of Pathology, Faculty of Veterinary Medicine, Ataturk University, Erzurum 25240, Turkey
5
Deparment of Pharmaceutical Toxicology, Faculty of Pharmacy, University of Istanbul, Istanbul 34116, Turkey
6
Department of Medical Pharmacology, Faculty of Medicine, Bahcesehir University, Istanbul 34349, Turkey
*
Authors to whom correspondence should be addressed.
Agronomy 2021, 11(10), 2003; https://doi.org/10.3390/agronomy11102003
Submission received: 16 August 2021 / Revised: 29 September 2021 / Accepted: 1 October 2021 / Published: 3 October 2021

Abstract

:
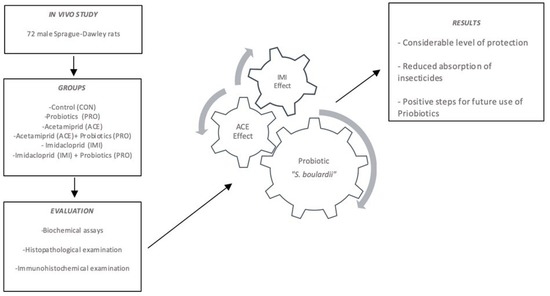
Probiotics have been shown to have positive effects when it comes to combating various health issues when consumed, preventing even the absorption of environmental toxins. One of the main environmental toxins encountered today is pesticide residues. Neonicotinoids, widely applied today in countries that have approved of them, are a known class of insecticides with an excellent and effective potency. Neonicotinoids have been shown to cause various toxic effects, either acutely or chronically, on human health and on beneficial insects when exposed. To clarify the assumption that probiotics could counteract these toxic effects, especially on vital organs, the probiotic yeast “Saccharomyces boulardii” (S. boulardii) was tested against the neonicotinoids, acetamiprid (ACE) and imidacloprid (IMI), as it has outstanding physiological and metabolic properties. The results obtained from the studies indicated that although ACE and IMI induced liver, kidney, brain and bowel damage, there was a considerable level of protection by the dietary supplementation of S. boulardii, as it reduced the absorption of these insecticides.

Graphical Abstract

1. Introduction

Probiotics are defined as microbial food additives that have positive effects on host health when consumed in certain amounts [1]. There are many scientific studies about probiotics showing that they prevent the absorption of environmental toxins such as pesticides, heavy metals and aflatoxins [2,3]. The results obtained from the studies indicate that use of probiotics is an inexpensive and safe method of protection from microbial infections [4]. Probiotics need to be consumed regularly to protect against stomach acids, bile salts and various enzymes and to pass into the host intestine and colonize and maintain their viability [5]. Many scientific studies have revealed that the regular intake of probiotics contributes to the biosynthesis of vitamins (e.g., vitamin K), detoxification of xenobiotics, enhancing host immunity (by competing with pathogenic microbes for binding sites on the mucosal epithelium) and contributing to human health in many areas [6,7,8,9].
Saccharomyces boulardii (S. boulardii) is a probiotic yeast with outstanding physiological and metabolic properties. S. boulardii has been accepted as a probiotic by the World Health Organization (WHO). It is widely used for the prevention and treatment of infectious enteritis and Clostridium-difficile-associated enterocolopathies. Lactic acid bacteria are preferred in toxicological studies as their ability to maintain viability and colonization and their binding capacity to toxic substances have been analyzed.
Neonicotinoids, such as imidacloprid (IMI) and acetamiprid (ACE), are a known class of insecticides with excellent potency and systemic effect on plant protection against piercing and sucking insects [10,11]. Acetamiprid (ACE) (EC 603-921-1), on the European level, has a current approval period from 1 March 2018 until 28 February 2033, based on its status under Reg. (EC) No 1107/2009 and Reg. (EU) 2018/113, and it is classified in Annex VI of the Regulation No. 1272/2008/EC with the tags, Acute Tox. 4-H302 and Aquatic Chronic 3-H412. Imidacloprid (IMI) (EC 428-040-8) had an approval period from 1/08/2009 until 1/12/2020, whereas it is no longer approved, based on the current status under Reg. (EC) No 1107/2009, and Reg. (EU) 2020/1643, and it is currently classified in Annex VI of the Regulation No. 1272/2008/EC with the tags, Acute Tox. 4-H302, Aquatic Acute 1-H400 and Aquatic Chronic 1-H410. Since 2018, IMI usage has been limited in Turkey. ACE is the second compound that started to be produced in the neonicotinoid group, and was offered for sale for the first time in Japan under the trade name mospilan. About 20 years after the discovery of neonicotinoids, the insecticide dominated the market, and its annual sales exceeded $ 3.5 billion worldwide. Annual production of the active ingredient in neonicotinoids is estimated to have been approximately 20,000 tons in 2010, and neonicotinoids accounted for 85% of sales for plant protection in 2012. [12,13,14].
Despite the belief that neonicotinoids have low mammalian toxicity, studies have shown that the increased use of neonicotinoids has serious cytotoxic effects on neurotoxicity, immunotoxicity, hepatotoxicity, nephrotoxicity, and on the reproductive system in humans, vertebrates and invertebrates [15,16,17]. It has been shown that ACE causes hepatocellular damage by harming the hepatic membrane structure, disrupts defense barriers in vertebrates, and increases pro-inflammatory cytokines [18,19]. As regards IMI, their administration to mice at a dose of 10 mg/kg for more than 28 days suppresses cell-mediated immune response and reduces the delayed type hypersensitivity response, and with IMI doses higher than 5 mg/kg, there was an immunosuppressive effect, indicating that long-term exposure to IMI can be harmful to the immune system [20]. Like these studies, many others have shown that neonicotinamides can increase pro-inflammatory cytokine expression [21,22,23].
This study aims to clarify the effect of the probiotic S. boulardii on the chronic toxicity effects of two insecticides, IMI and ACE in rats, focusing on preventing possible toxic effects of these pesticides on the liver, intestine, kidney and brain tissue.

2. Materials and Methods

2.1. Chemicals and Reagents

An imidacloprid-based insecticide (Gortca FS 600) and acetamipirid-based insecticide (Mosetam 20 SL) was purchased from Safa Tarım company (Turkey). Formaldehyde (37%) and phosphate buffer saline (PBS) were obtained from Sigma-Aldrich (St. Louis, MO, USA).

2.2. Ethics

This study was approved by the Ataturk University Local Board of Ethics Committee for Animal Experiments, Erzurum, Turkey (decision no: 42190979-000-E.1700332023). The study was in compliance with OECD principles of good laboratory practice, guidelines for testing of chemicals no. 408, and in accordance with standard operating procedures of the host institution [24].

2.3. Animals

A total of 72 male Sprague–Dawley rats (250 ± 10 g) were used in this study. Animals were randomly assigned into 6 groups (n = 12/group), including control (CON), probiotic (PRO), ACE, ACE + PRO, IMI, and IMI + PRO. The NOAEL doses from reports of risk assessment were taken into account. The imidacloprid-based and acetamiprid-based herbicide was mixed with water to allow the administration of a 5.7 mg/kg and 12.4 mg/kg bw imidacloprid and acetamiprid equivalent dose, respectively [25,26]. A volume of 1 mL was injected intraperitoneally. The animals were sacrificed at 90 days following injection. Rats were decapitated rapidly under deep anesthesia (Sevoflurane) [27]. Liver and kidney samples collected were snap-frozen in liquid nitrogen and stored at −80 °C until further analysis. Brain, kidney, liver and small intestine tissues were fixed in 10% neutral formaldehyde for immunohistochemical analysis (Sigma-Aldrich Corp., St. Louis, MO, USA).

2.4. Biochemical Assays

After the decapitated session, a 5–7 mL blood sample was collected from the heart, and the blood samples were collected in tubes using K-EDTA as anticoagulant for urea analysis, and in tubes without anticoagulants (Vacutainer, BD-Plymouth, UK) for the other analysis. Blood samples in non-anticoagulant tubes were centrifuged at 5000 rpm for 15 min, and the serum was used. Measurement of biochemical parameters (alanine aminotransferase (ALT), aspartate aminotransferase (AST), alkaline phosphatase (AP), and lactate dehydrogenase (LDH)) determined with commercial test kits (Roche Diagnostics GMBH Sandhofer STR. 116 D-68305). The measurements were performed on an auto-analyzer (Roche/Hitachi Cobas 6000 C501).

2.5. Liquid Chromatography–Mass Spectrometry Analysis

2.5.1. Tissue Sample Preparation Procedures

The extraction procedure was applied according to the method described by Vardavas et al. 2018 [28].

2.5.2. Instrumental Conditions

Liquid chromatography was carried out using a Shimadzu LC system, consisting of a binary LC pump, a vacuum degasser, an autosampler, and a column oven. Similar conditions to a previous study were used for the chromatographic separation and detection of IMI, ACE and its metabolite, 6-chloronicotinic acid (6- CINA) [29]. Briefly, a gradient of 0.1% formic acid in water (solvent A) and methanol (solvent B) was used: starting at 20% of solvent B, 50% (5.0 min linear ramp), 80% (3.0 min linear ramp), and finally, 100% B (6.0 min linear ramp). The mobile phase was pumped at 0.6 mL/min through a Discovery C18 HPLC column (25 cm × 4.6 mm, 5 μm) (Bellefonte, Supelco), which was thermostated at 30 °C. A volume of 10 μL was injected into the system. A mass spectrometer (LCMS-2010 EV Shimadzu), which consisted of an atmospheric pressure chemical ionization (APCI) interface, and a single quadrupole mass filter was used to detect and quantify IMI and 6-ClNA in the column effluent. The interface, curved desolvation system (CDL) and heat block temperatures were 400 °C, 200 °C and 200 °C, respectively. The detector voltage was 1.5 kV and the nebulizing gas flow was 2.5 l/min. The drying gas pressure was set at 0.02 MPa. The ion signals were acquired in time in the selected ion monitoring (SIM) mode with ions m/z = 256.100, 211.895, 288.00 174.95 for IMI, 223.05, 255.1, 198.9 for ACE, 157.985, 19089.090, 96.00 for 6-ClNA and 210.10, 182.05, 206.05 for IS (underlined fragments were used for quantification) [29]. The mass spectrometry operating conditions were tuned according to the manufacturer’s recommendations.

2.6. Pathological Analysis

2.6.1. Histopathological Examination

Livers, kidneys, brains and small intestines were fixed in 10% neutral formaldehyde for 24–48 h and were embedded in paraffin blocks. Paraffin-embedded tissues were processed to give 5 μm thick sections and were stained with hematoxylin–eosin, followed by microscopic examination. The histopathological findings in the sections were graded as 0 (none), 1 (mild), 2 (moderate), and 3 (severe) [30,31].

2.6.2. Immunohistochemical Examination

After dehydration, transparency, and paraffinization, 4–5 μm thick sections were taken from paraffin blocks and placed on poly-L-lysine slides. Slides were taken into preparation transport apparatus and left at 56 °C for 1 h. Immunohistochemical staining Expose Kit (Abcam: ab80436, Cambridge, UK) was performed as recommended by the manufacturer. Briefly, after xylene and graded ethanol administration, the sample was washed in phosphate buffer (PBS) solution. For blocking endogenous peroxidase activity, 10% hydrogen peroxide was applied. Then, protein block (ABCAM: ab80436) was applied to each slide to cover the tissue (block non-specific antibody binding). The primary antibody was reconstituted with 8-OHdG and IL-6 (Santa Cruz, USA), GFAP (Novus Biological, USA). After washing, 1–2 drops of secondary antibody were added for 20 min, followed by the addition of horseradish peroxidase (HRP) conjugate. The mixture was incubated for 30 min in a humidified vessel at room temperature. Moreover, 3−3 diaminobenzidine (DAB) was applied, and then washed with distilled water. The hematoxylin (Mayer’s) was applied for 15−20 s. The tissue slice was washed until the excess of hematoxylin was removed. After this process, the slides were suspended by lamination with 80% ethanol, 96% ethanol, 100% ethanol, and xylol. Sections were evaluated as (−), mild (+), moderate (++) and severe (+++) according to immune positive values [30,31].

2.7. Statistical Analysis

All statistical analyses were carried out by using the SPSS statistical software (SPSS for Windows, version 20.0). All data were presented in mean (±) standard deviation (S.D.). For biochemical analysis, differences were assessed using one-way analysis of variance (one-way ANOVA). For immunohistochemical analysis, differences in measured parameters between the groups were analyzed with a nonparametric test (Kruskal–Wallis). Dual comparisons between groups exhibiting significant values were evaluated with the Mann–Whitney U test (p < 0.05).

3. Results

3.1. Body Weight

At 12-week follow-up, weight gain did not differ significantly between the groups, and there was no relationship between drug administration and body weight. Comparing the changes in body weight from before-drug to during-drug administration, although there is no statistically significant, all groups gained weight compared to the control (Table 1).

3.2. Biochemical Analyses

ALT, AST, ALP, LDH, and urea levels were not significantly higher in IMI and ACE groups compared to control group (Table 2). The following blood parameters were determined: the number of red blood cells—RBC (10/mm3), the hemoglobin content—HGB (g/L), the mean corpuscular volume—MCV (μm3), the mean corpuscular hemoglobin–MCH (pg), the mean corpuscular hemoglobin concentration—MCHC (g/L), and the hematocrit value—HCT (%). The following types of leukocytes (g/L) were counted under the microscope, using an automatic counter: eosinophils, basophils, lymphocytes, monocytes, and neutrophils. Hematological indices were not significantly altered (Table 3).

3.3. Liquid Chromatography–Mass Spectrometry

Table 4 presents liver reference concentration measures and pesticide residues levels in liver tissue. Measurements could not be made, because all measured levels in the probiotic group and 6-chloronicotinic acid (6-CNA), metabolite of IMI and ACE, were below the LOD. In the liver tissue, the levels of IMI are lower in IMI group in comparison to IMI + PRO group, while ACE residue was found to be lower in the ACE + PRO group than in the ACE group. Table 5 present kidney reference concentration measures and pesticide residues levels in kidney tissue. In the kidney tissue, IMI residue was found to be higher in the IMI group than in the IMI + PRO group, while ACE residue was found to be higher in the ACE group than in the ACE + PRO group.

3.4. Histopathological Analysis

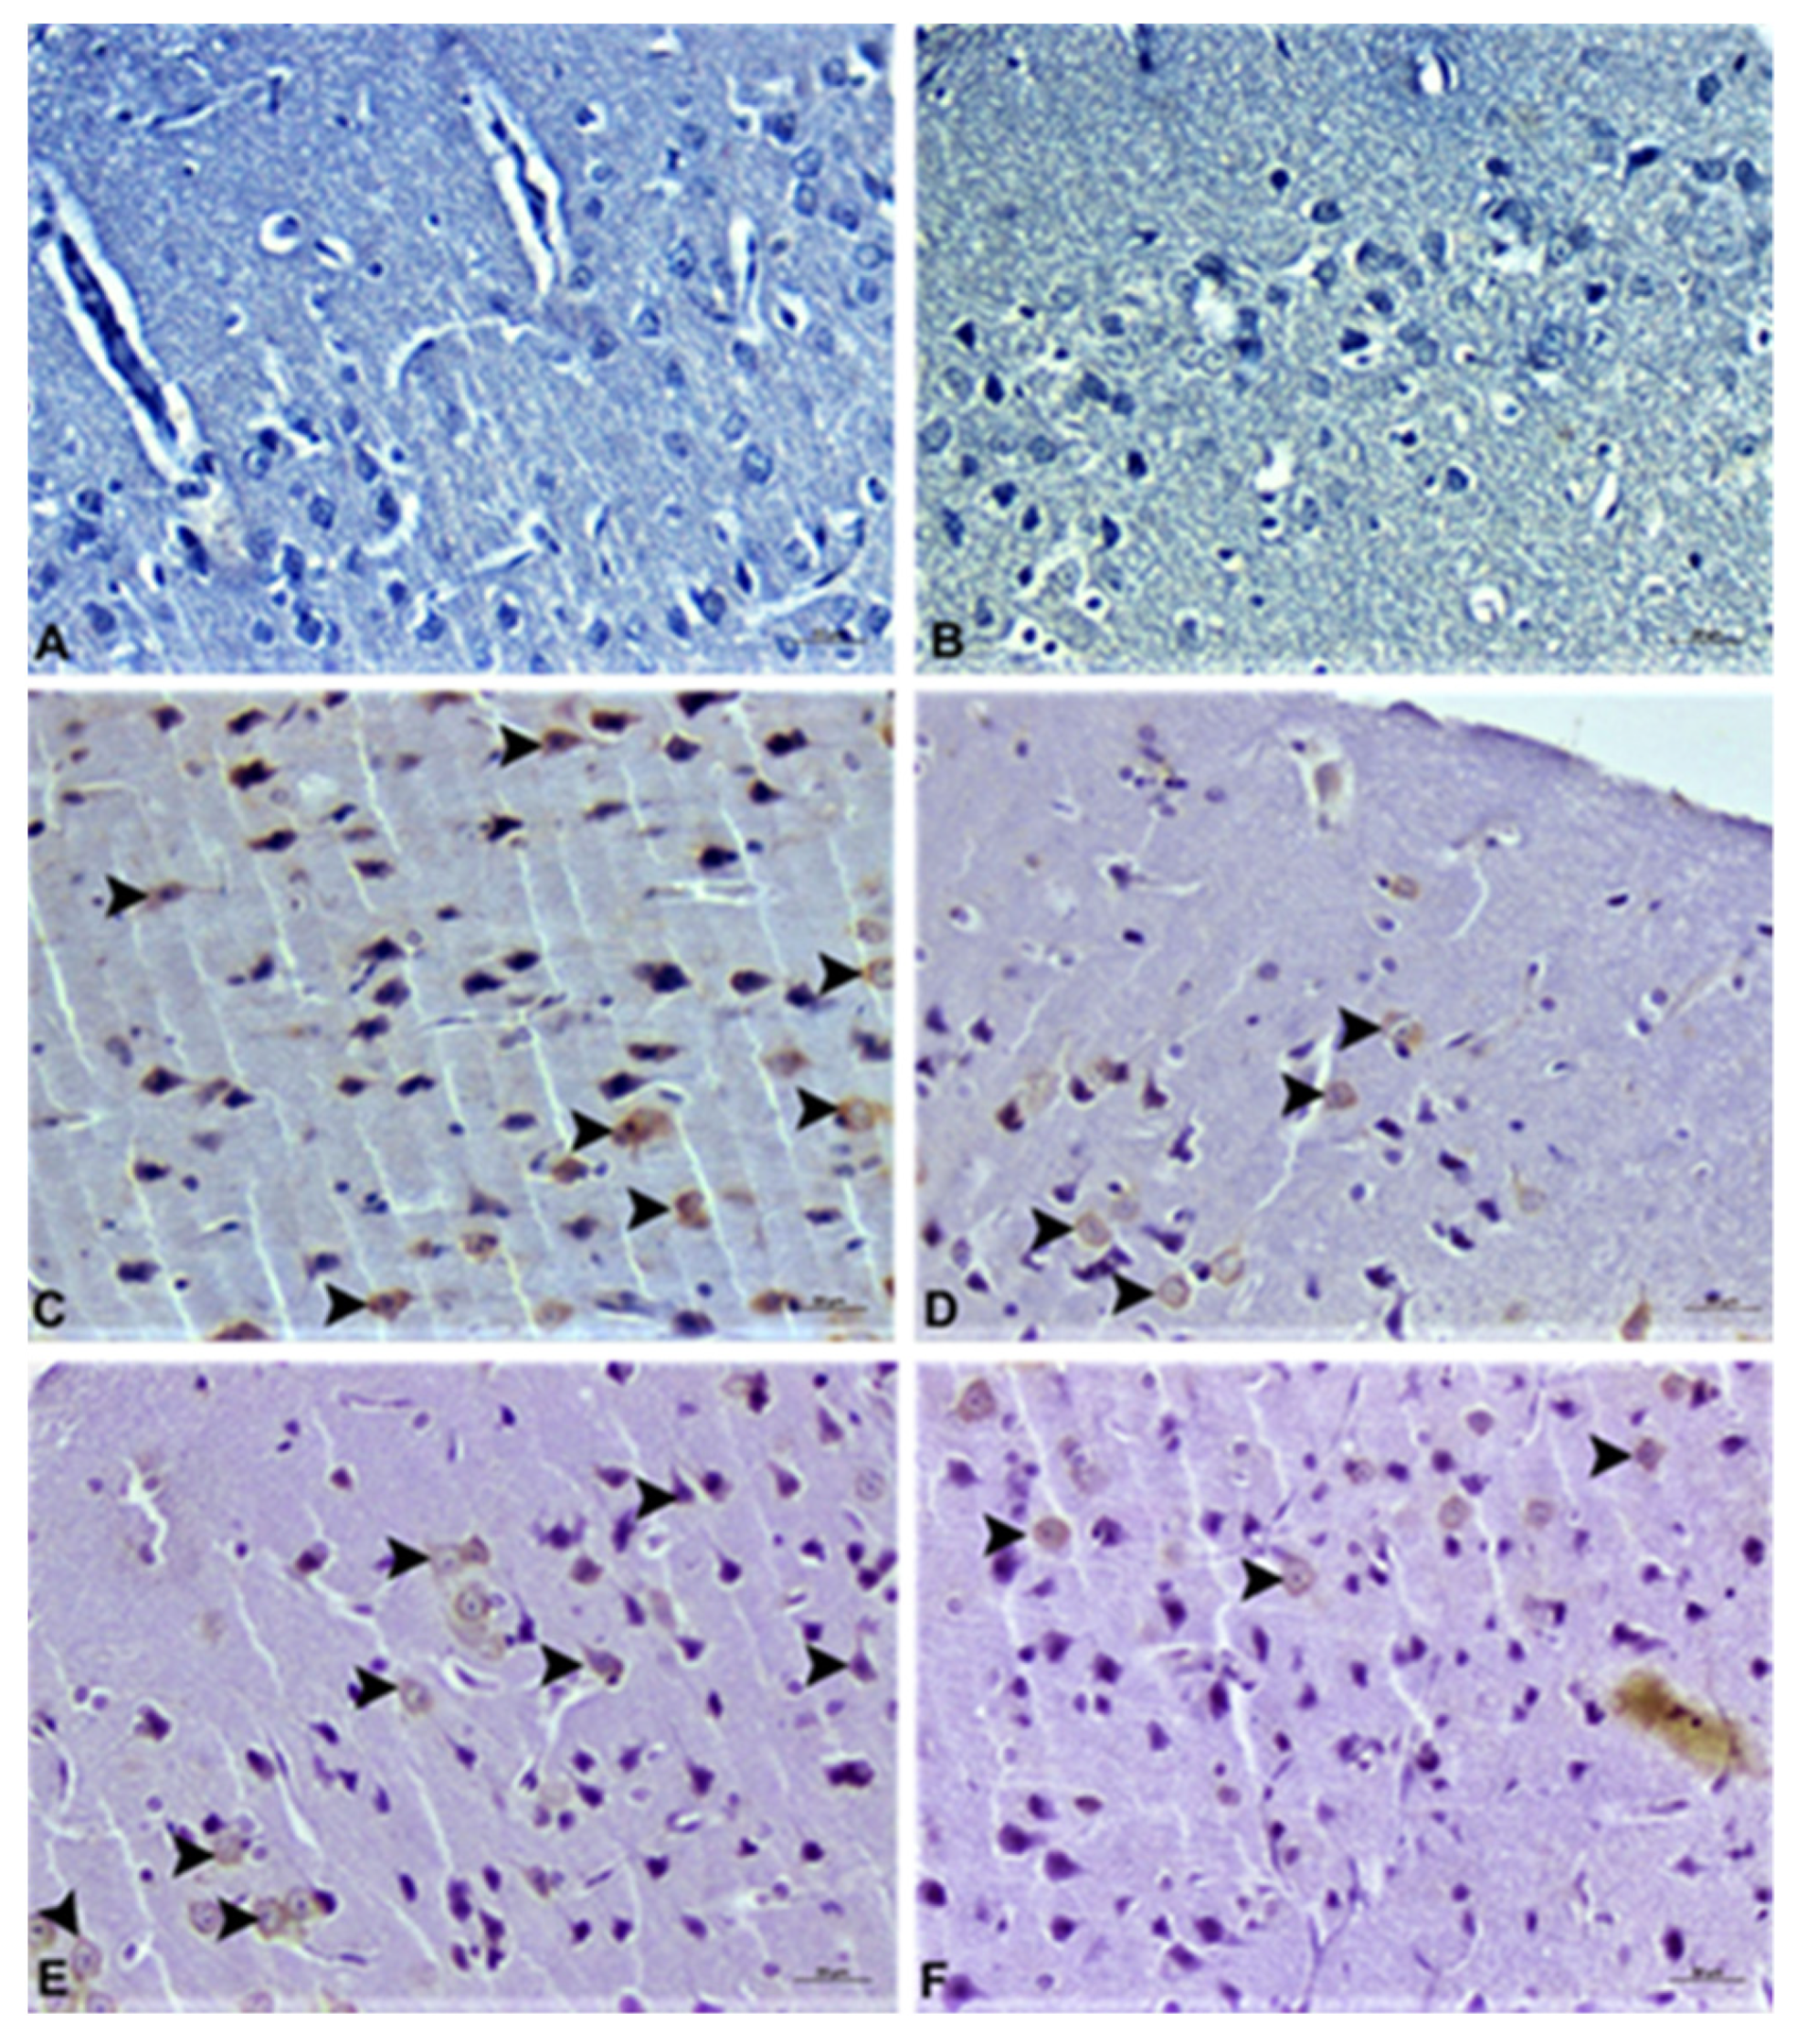
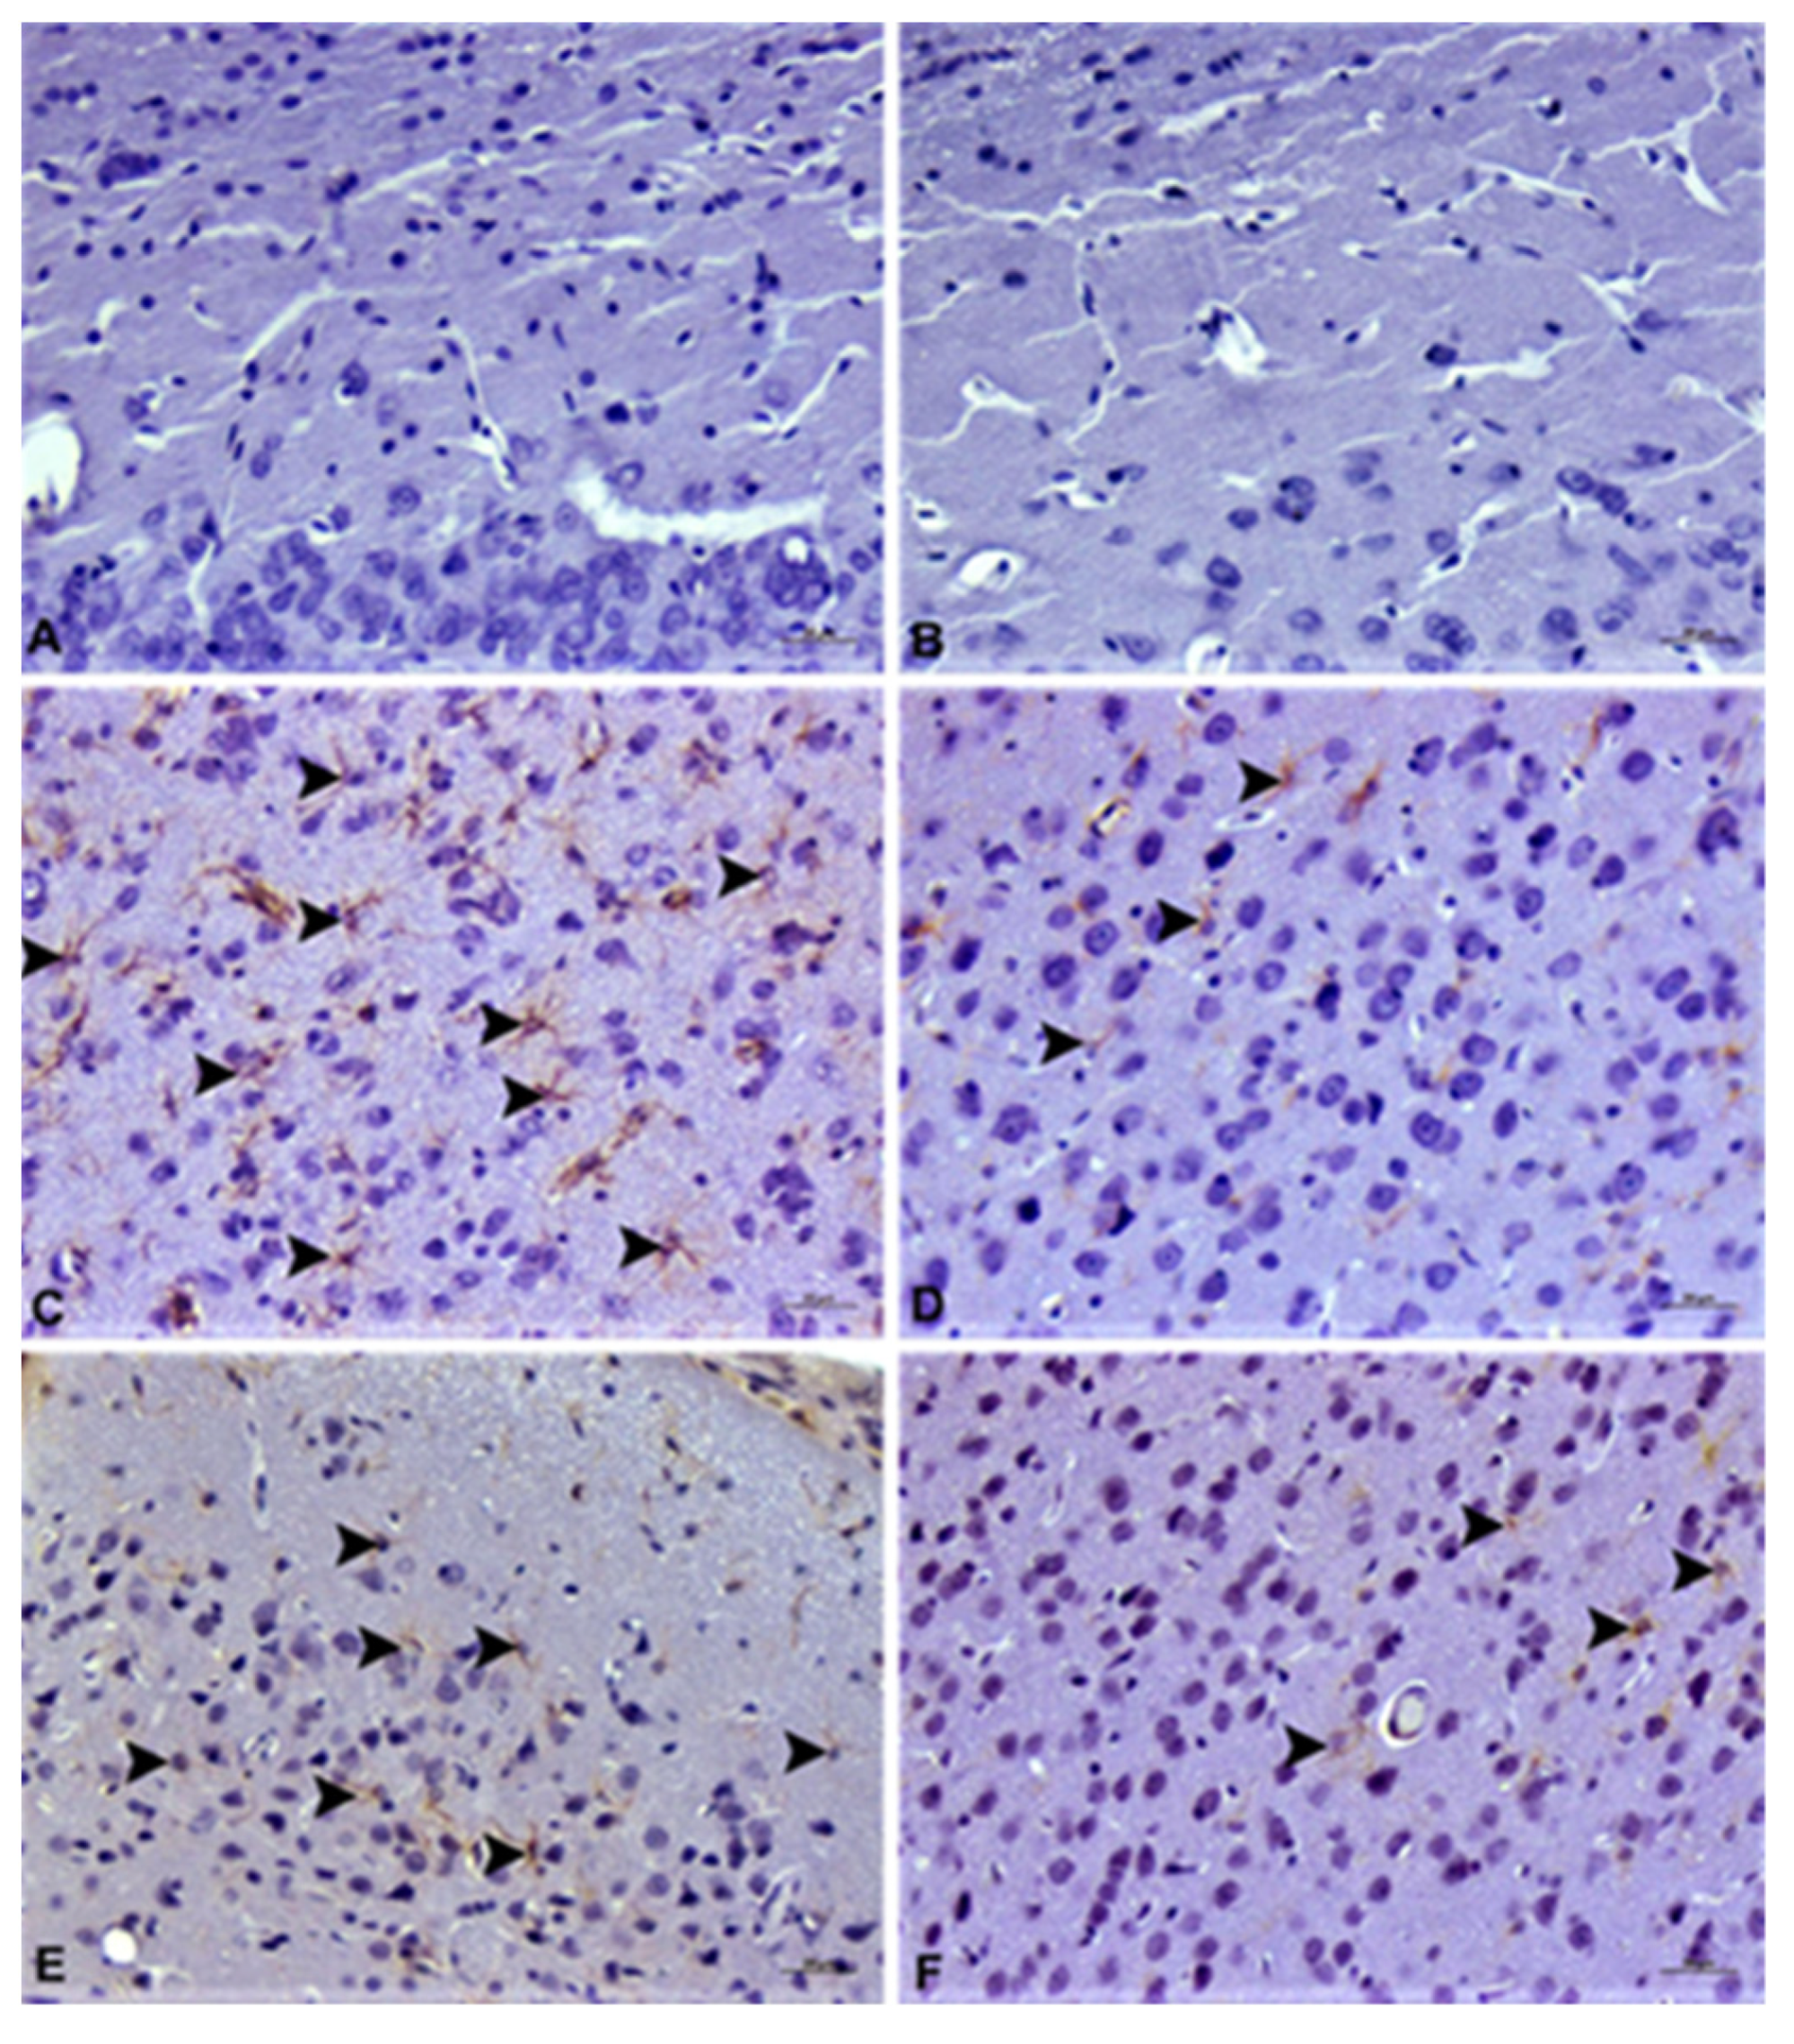
Brain tissues show severe degeneration and moderate necrosis in neurons, severe hyperemia in meningeal and parenchymal vessels were observed in the ACE and IMI groups, while moderate hyperemia in the meninges and parenchymal vessels, mild degeneration in the neurons were observed in the ACE + PRO group, while no necrotic cells were observed. Mild degeneration of neurons and hyperemia of vessels were detected in IMI + PRO group (Figure 1). It was observed that 8 OHdG and GFAP immunopositivity were negative in the control and probiotic groups; severe 8 OHdG and GFAP immunopositivity were observed in the ACE and IMI groups, but were slightly positive in the IMI + PRO and ACE + PRO groups (Figure 2 and Figure 3).
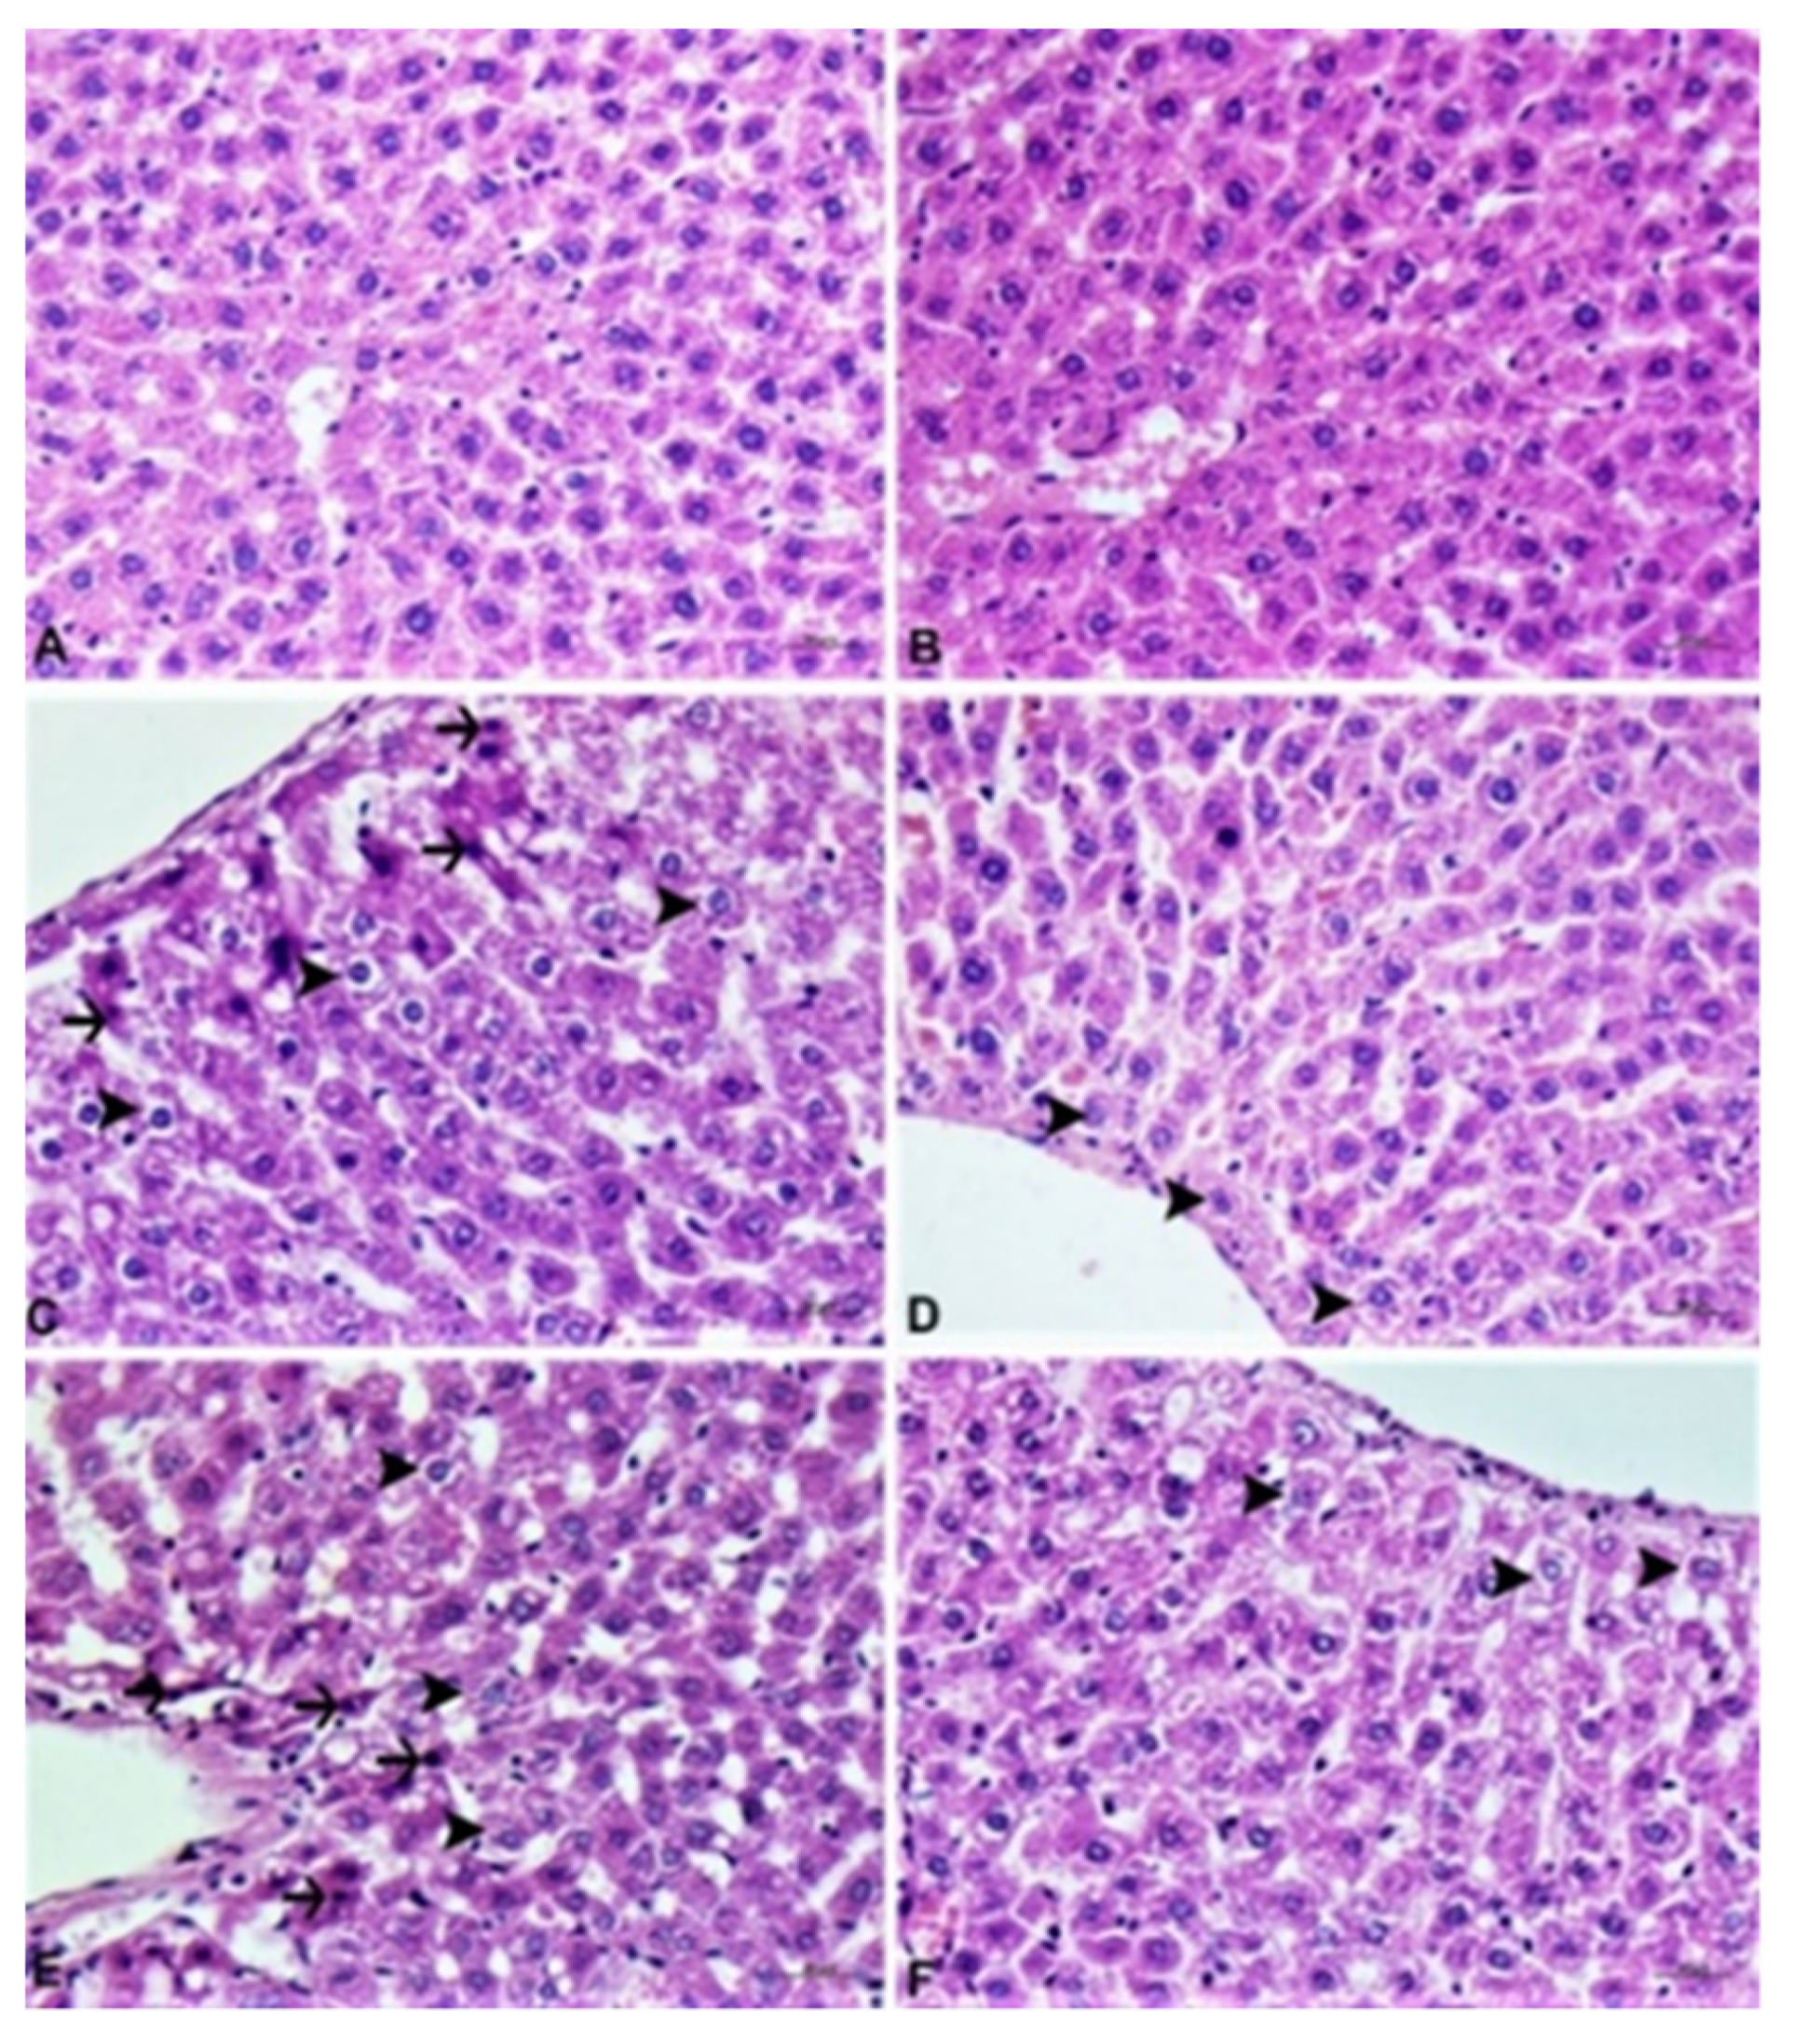
Liver tissues showing degeneration, necrosis in hepatocytes, and severe hyperemia in parenchymal vessels were observed in ACE and IMI groups, while mild hydropic degeneration and moderate hyperemia in interstitial vessels were observed in ACE + PRO and IMI + PRO groups (Figure 4).
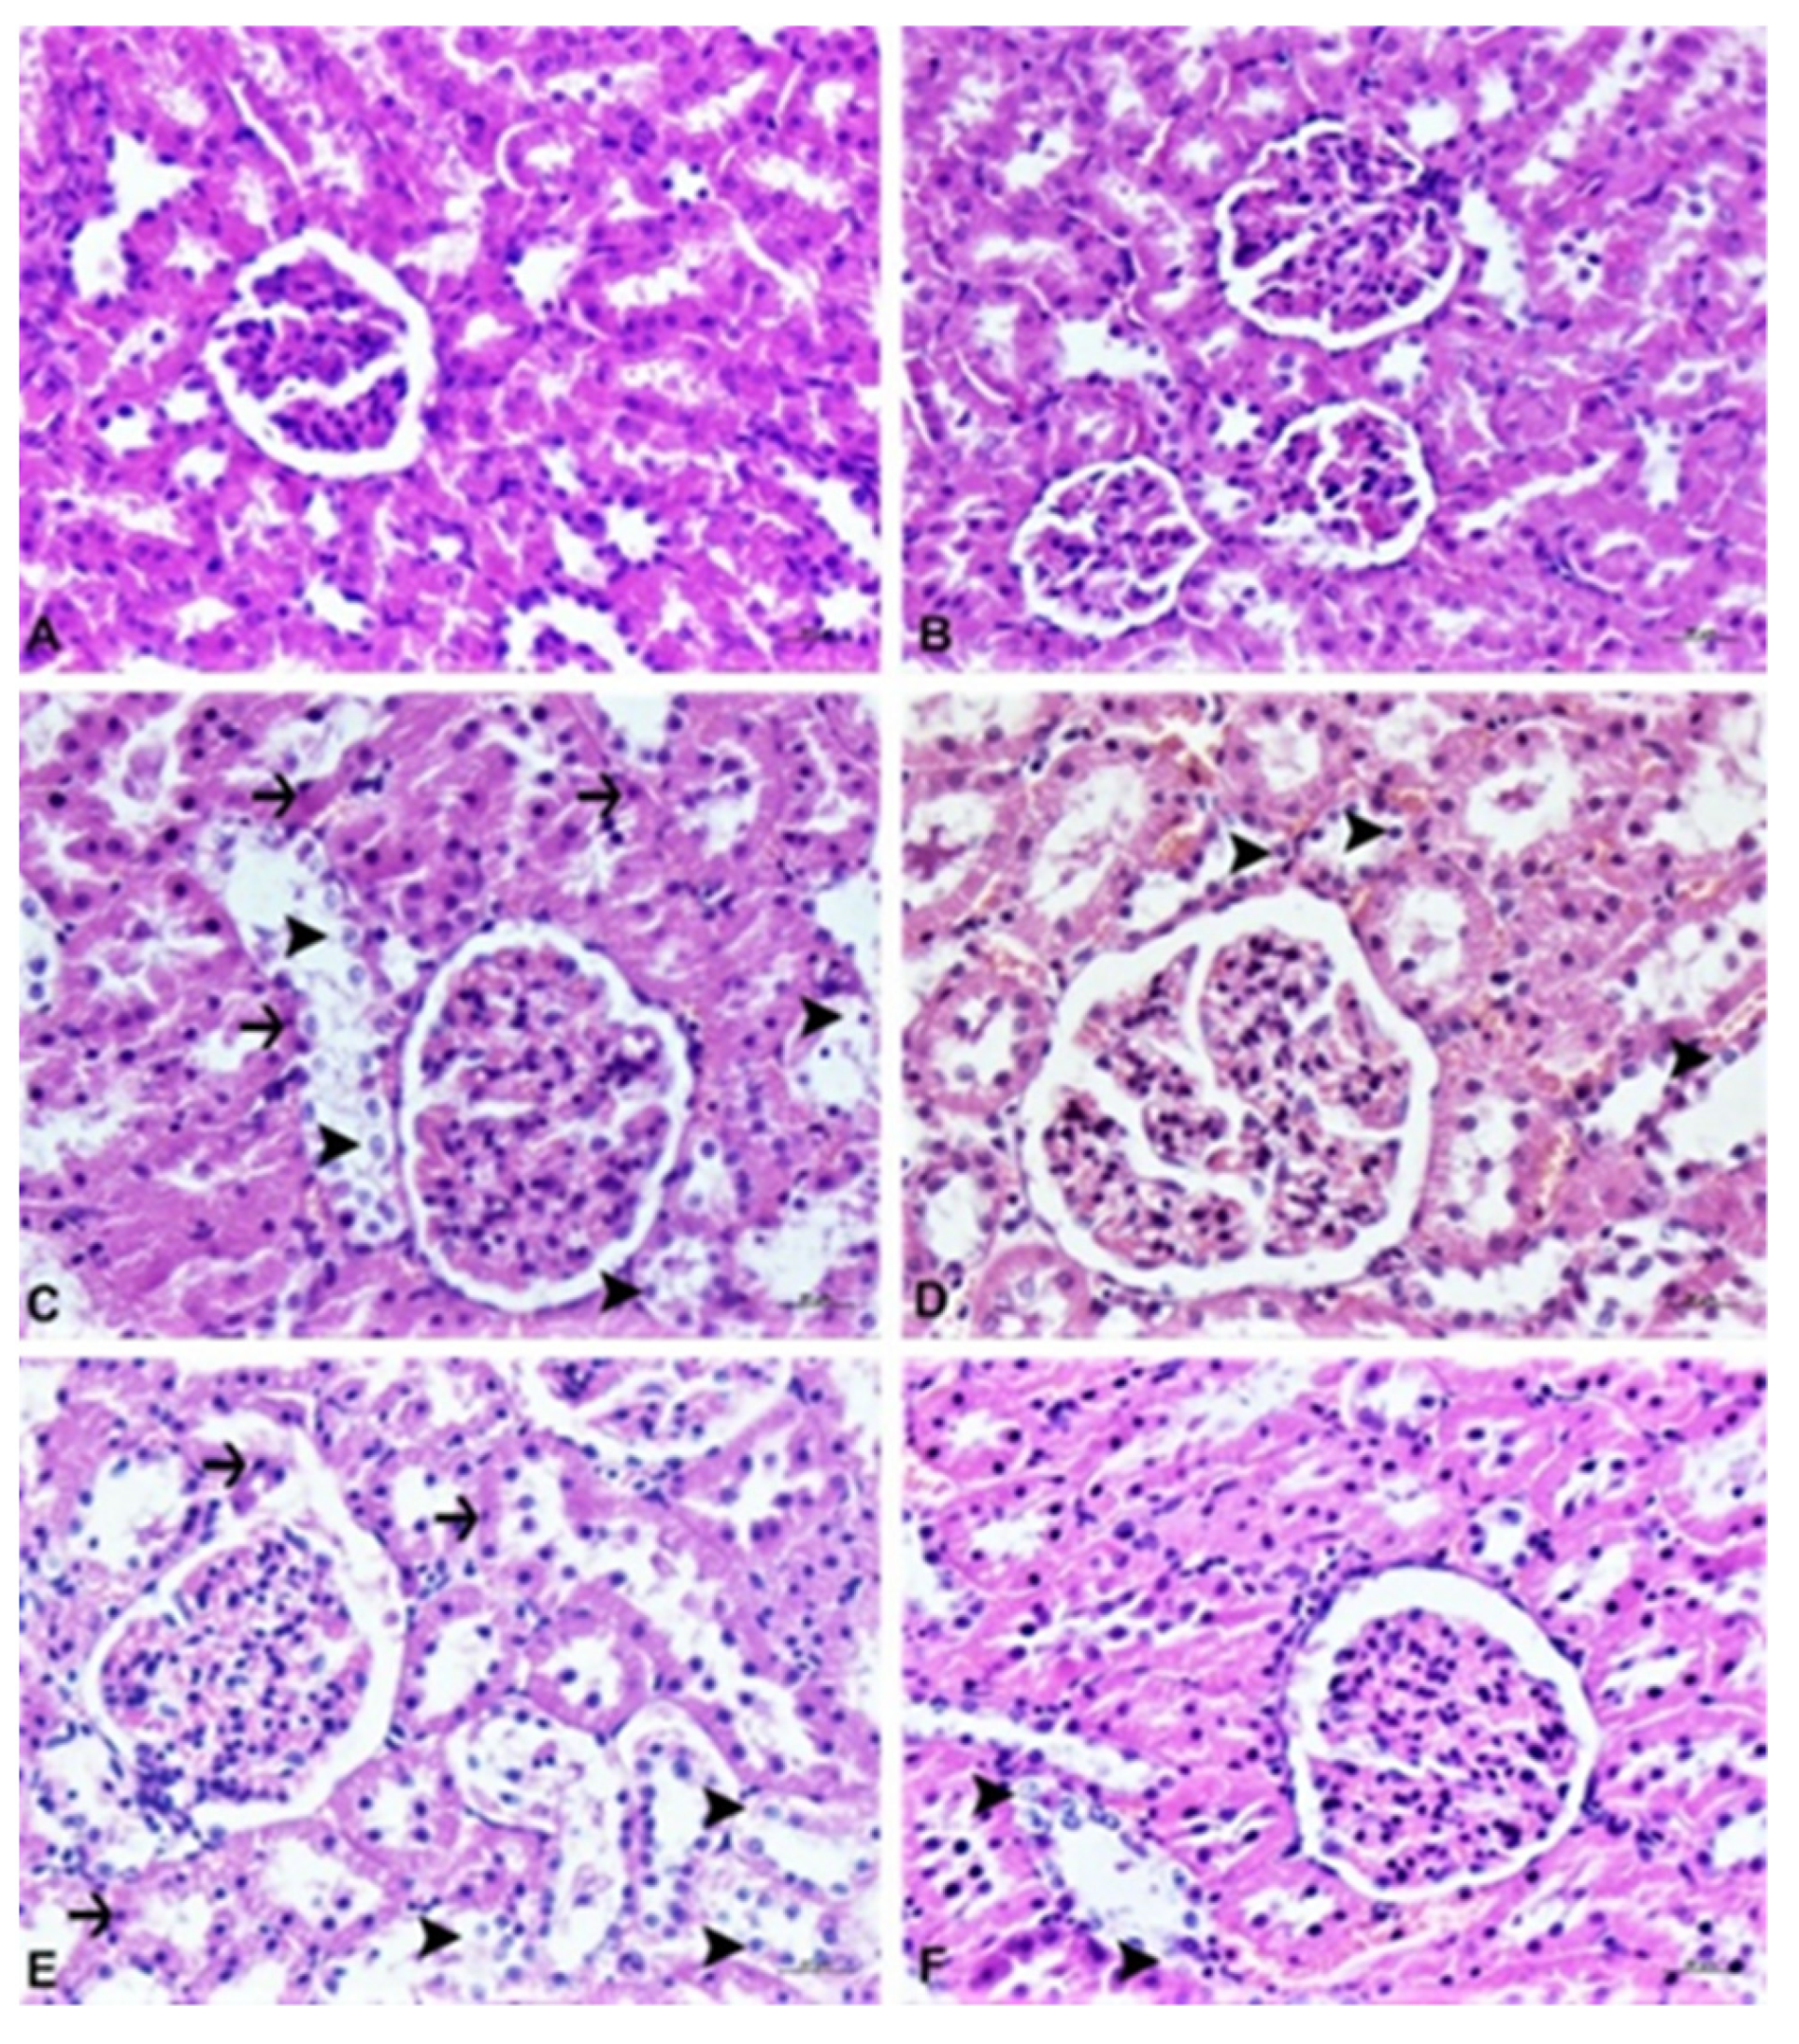
Kidney tissues show severe degeneration and necrosis of the renal tubular epithelium and hyperemia in the interstitial vessels were observed in the ACE and IMI groups, while mild hydropic degeneration of the tubular epithelium and moderate hyperemia in the interstitial vessels were observed in the ACE + PRO and IMI + PRO groups (Figure 5).
Intestinal tissues show atrophy of the villi, severe mononuclear cell infiltrations, desquamation and erosion in the mucosal epithelium were observed in the ACE and IMI groups, with severe mononuclear cell infiltration in the mucosal layer, very mild degeneration in the mucous epithelium in the ACE + PRO group, and mucosal epithelial desquamation in the IMI + PRO group. Mild mononuclear cell infiltration in the dermal layer, mild degeneration of the mucosal epithelium and mild edema in the tunuka muscularis were observed (Figure 6). It was observed that IL-6 expression was negative in the control and probiotic groups, severely positive in the IMI and ACE groups, and slightly positive in the IMI + PRO and ACE + PRO groups (Figure 7).

4. Discussion

In the current study, the chronic exposure of rats for 90 days to IMI and ACE induced hepatorenal injury without changes in ALP, ALT, and AST enzymes’ activity and LDH and urea levels. Data from previous studies, using such high doses as 80 or 139 mg/kg/bw, have shown that neonicotinoid exposure results in a significant increase in serum AST, ALT and ALP enzyme activity [32,33]. In contrast to other studies, however, there is a reduction in ALT and ALP enzyme activity when IMI is applied at a low dose [34]. Additionally, the change in biochemical parameters induced by neonicotinoid exposure depends on the applied neonicotinoid dose concentration [35].
In this study, we used low neonicotinoid dose concentrations in accordance with the real-life exposure scenario study type [36,37]. Chronic exposure of low neonicotinoid doses actually induced hepatorenal injury; however, there were no changes regarding the biochemical parameters. This finding was unexpected, and it suggests the possible unforeseen danger that could be induced upon neonicotinoid exposure to humans.
Dietary supplementation with S. boulardii displayed a counteractive effect on the hepatorenal injury, induced by IMI and ACE exposure, possibly linked to the fact that probiotics reduce the bioavailability of contaminated toxins. To evaluate the potential of S. boulardii to alleviate hepatorenal toxicity, the measured residual level of IMI and ACE in kidney and liver samples showed a decreased residual level of IMI and ACE, with a significant reduction noted in the ACE exposure group.
In addition to hepatorenal injury, the brain may be the tissue most likely to be affected by neonicotinoid toxicity due to its direct actions on mammalian nicotinic acetylcholine receptors (nAChRs). While it has been demonstrated that exposure to neonicotinoid can cause impairments in sensorimotor performance, the overexpression of glial fibrillary acidic protein (GFAP) [38] and adverse effects on the developing mammalian brain [39], our findings showed that severe histopathological lesions and GFAP expression were similarly detected in brain tissue, induced by IMI and ACE exposure, possibly due to increased oxidative stress levels.
Neonicotinoids have been shown to induce oxidative stress and lipid peroxidation by increasing the production of free radicals [40,41,42]. The concentration of 8-OHdG, the major product of DNA oxidation, is one of the sensitivity indicators for oxidative DNA damage [43,44], and the obtained results in this study indicated that 8-OHdG levels significantly increased under IMI and ACE exposure.
Intestinal cells provided a natural barrier to prevent infiltration of toxic substances and pathogens. Pesticides are absorbed into body via the intestine after their administration [45], affecting the structure and enzyme activity of the intestine, and impairing the absorptive function of the intestine [46,47]. Histological results showed that rats exhibited a significant decrease in villus length from IMI and ACE exposure, which indicated that neonicotinoids tend to alter the intestinal structure, potentially leading to intestinal disorders and nutrient absorption effects.
Finally, changes in interleukin levels showed that IL-6 immunopositivity increased significantly from IMI and ACE exposure, compared to the control groups that comply with previous results [48,49].
We demonstrated that neonicotinoids disrupted the intestinal immune function and impaired intestinal health. S. boulardii supplementation inhibited the upregulation of IL-6 level in the intestine of rats treated with IMI and ACE.

5. Conclusions

The neonicotinoid insecticides, IMI and ACE, are known to induce toxicity in insects and mammals, while prebiotic treatments may actually prevent negative consequences from chronic neonicotinoid toxicity via enhancing the gut barrier function and decreasing their intestinal absorption. Dietary supplementation with S. boulardii could possibly be used to achieve this, especially as a solution for asymptomatic neonicotinoid toxicity effects. Our results indicated that IMI and ACE induced liver, kidney, brain and bowel damage via several biochemical and pathological adverse effects, as well as oxidative stress and inflammation levels to increase. To conclude, there was a considerable protection ensured by dietary supplementation with S. boulardii in rats against the above detrimental effects. Despite the consideration of the prophylactic effect of S. boulardii on neonicotinoid toxicity, these observations highlight the need for further studies, so that laboratory experiments can be converted into clinical treatment.

Author Contributions

Investigation, C.S., M.K., S.Y., M.T. resources; writing—original draft preparation, C.S., Z.G.; writing—review and editing, A.I.V., C.I.V.; supervision, A.T., E.A.; project administration, C.S., E.A.; funding acquisition, E.A. All authors have read and agreed to the published version of the manuscript.

Funding

This research was funded by Ataturk University Scientific Research Project department (BAPSİS) and project code TDK-2018-6537.

Institutional Review Board Statement

The study was conducted according to the guidelines of the Declaration of Helsinki, and approved by the Local Board of Ethics Committee for Animal Experiments of Ataturk University (42190979-000-E.1700332023 and 30 November 2017).

Data Availability Statement

Not applicable.

Conflicts of Interest

The authors declare no conflict of interest.

References

  1. Yaqoob, P. Ageing, immunity and influenza: A role for probiotics? Proc. Nutr. Soc. 2014, 73, 309–317. [Google Scholar] [CrossRef] [Green Version]
  2. Zoghi, A.; Khosravi-Darani, K.; Sohrabvandi, S. Surface Binding of Toxins and Heavy Metals by Probiotics. Mini-Rev. Med. Chem. 2014, 14, 84–98. [Google Scholar] [CrossRef]
  3. Monachese, M.; Burton, J.P.; Reid, G. Bioremediation and Tolerance of Humans to Heavy Metals through Microbial Processes: A Potential Role for Probiotics? Appl. Environ. Microbiol. 2012, 78, 6397–6404. [Google Scholar] [CrossRef] [PubMed] [Green Version]
  4. Patil, S. Probiotics and prebiotics: Fabulous nutritional supplements. Int. J. Sci. Eng. Res. 2013, 4, 318–333. [Google Scholar]
  5. Ouwehand, A.C.; Salminen, S.; Isolauri, E. Probiotics: An overview of beneficial effects. Antonie Van Leeuwenhoek 2002, 82, 279–289. [Google Scholar] [CrossRef] [PubMed]
  6. Candela, M.; Perna, F.; Carnevali, P.; Vitali, B.; Ciati, R.; Gionchetti, P.; Rizzello, F.; Campieri, M.; Brigidi, P. Interaction of probiotic Lactobacillus and Bifidobacterium strains with human intestinal epithelial cells: Adhesion properties, competition against enteropathogens and modulation of IL-8 production. Int. J. Food Microbiol. 2008, 125, 286–292. [Google Scholar] [CrossRef]
  7. Hardy, H.; Harris, J.; Lyon, E.; Beal, J.; Foey, A.D. Probiotics, Prebiotics and Immunomodulation of Gut Mucosal Defences: Homeostasis and Immunopathology. Nutrients 2013, 5, 1869–1912. [Google Scholar] [CrossRef]
  8. Gül, Z.; Demircan, C.; Bagdas, D.; Buyukuysal, R.L. Protective Effects of Chlorogenic Acid and its Metabolites on Hydrogen Peroxide-Induced Alterations in Rat Brain Slices: A Comparative Study with Resveratrol. Neurochem. Res. 2016, 41, 2075–2085. [Google Scholar] [CrossRef]
  9. Trinder, M.; Bisanz, J.; Burton, J.; Reid, G. Probiotic lactobacilli: A potential prophylactic treatment for reducing pesticide absorption in humans and wildlife. Benef. Microbes 2015, 6, 841–847. [Google Scholar] [CrossRef]
  10. Tomizawa, M.; Casida, J.E. Neonicotinoid Insecticide Toxicology: Mechanisms of Selective Action. Annu. Rev. Pharmacol. Toxicol. 2005, 45, 247–268. [Google Scholar] [CrossRef] [PubMed] [Green Version]
  11. Jeschke, P.; Nauen, R.; Schindler, M.; Elbert, A. Overview of the Status and Global Strategy for Neonicotinoids. J. Agric. Food Chem. 2011, 59, 2897–2908. [Google Scholar] [CrossRef]
  12. Crossthwaite, A.J.; Rendine, S.; Stenta, M.; Slater, R. Target-site resistance to neonicotinoids. J. Chem. Biol. 2014, 7, 125–128. [Google Scholar] [CrossRef] [PubMed] [Green Version]
  13. Simon-Delso, N.; Amaral-Rogers, V.; Belzunces, L.P.; Bonmatin, J.M.; Chagnon, M.; Downs, C.; Furlan, L.; Gibbons, D.W.; Giorio, C.; Girolami, V.; et al. Systemic insecticides (neonicotinoids and fipronil): Trends, uses, mode of action and metabolites. Environ. Sci. Pollut. Res. 2015, 22, 5–34. [Google Scholar] [CrossRef]
  14. Bass, C.; Denholm, I.; Williamson, M.S.; Nauen, R. The global status of insect resistance to neonicotinoid insecticides. Pestic. Biochem. Physiol. 2015, 121, 78–87. [Google Scholar] [CrossRef] [PubMed] [Green Version]
  15. Crosby, E.B.; Bailey, J.M.; Oliveri, A.N.; Levin, E.D. Neurobehavioral impairments caused by developmental imidacloprid exposure in zebrafish. Neurotoxicol. Teratol. 2015, 49, 81–90. [Google Scholar] [CrossRef] [Green Version]
  16. Bal, R.; Türk, G.; Tuzcu, M.; Yilmaz, O.; Kuloglu, T.; Gundogdu, R.; Gür, S.; Agca, A.; Ulas, M.; Çambay, Z.; et al. Assessment of imidacloprid toxicity on reproductive organ system of adult male rats. J. Environ. Sci. Health Part B 2012, 47, 434–444. [Google Scholar] [CrossRef] [PubMed]
  17. Yardimci, M.; Sevgiler, Y.; Rencuzogullari, E.; Arslan, M.; Buyukleyla, M.; Yilmaz, M. Sex-, tissue-, and exposure duration-dependent effects of imidacloprid modulated by piperonyl butoxide and menadione in rats. Part I: Oxidative and neurotoxic potentials. Arch. Ind. Hyg. Toxicol. 2014, 65, 387–398. [Google Scholar] [CrossRef] [Green Version]
  18. Chakroun, S.; Ezzi, L.; Grissa, I.; Kerkeni, E.; Neffati, F.; Bhouri, R.; Sallem, A.; Najjar, M.F.; Hassine, M.; Mehdi, M.; et al. Hematological, biochemical, and toxicopathic effects of subchronic acetamiprid toxicity in Wistar rats. Environ. Sci. Pollut. Res. 2016, 23, 25191–25199. [Google Scholar] [CrossRef]
  19. Devan, R.K.S.; Prabu, P.C.; Panchapakesan, S. Immunotoxicity assessment of sub-chronic oral administration of acetamiprid in Wistar rats. Drug Chem. Toxicol. 2014, 38, 328–336. [Google Scholar] [CrossRef]
  20. Badgujar, P.C.; Jain, S.; Singh, A.; Punia, J.; Gupta, R.; Chandratre, G.A. Immunotoxic effects of imidacloprid following 28 days of oral exposure in BALB/c mice. Environ. Toxicol. Pharmacol. 2013, 35, 408–418. [Google Scholar] [CrossRef]
  21. Costas-Ferreira, C.; Faro, L. Neurotoxic Effects of Neonicotinoids on Mammals: What Is There beyond the Activation of Nicotinic Acetylcholine Receptors?—A Systematic Review. Int. J. Mol. Sci. 2021, 22, 8413. [Google Scholar] [CrossRef]
  22. Kagawa, N.; Nagao, T. Neurodevelopmental toxicity in the mouse neocortex following prenatal exposure to acetamiprid. J. Appl. Toxicol. 2018, 38, 1521–1528. [Google Scholar] [CrossRef] [PubMed]
  23. Duzguner, V.; Erdogan, S. Chronic exposure to imidacloprid induces inflammation and oxidative stress in the liver & central nervous system of rats. Pestic. Biochem. Physiol. 2012, 104, 58–64. [Google Scholar] [CrossRef]
  24. EFSA Scientific Committee Guidance on conducting repeated-dose 90-day oral toxicity study in rodents on whole food/feed. EFSA J. 2011, 9, 2438. [CrossRef]
  25. Imidacloprid. Available online: https://pubchem.ncbi.nlm.nih.gov/compound/Imidacloprid (accessed on 16 May 2021).
  26. Acetamiprid. Available online: https://pubchem.ncbi.nlm.nih.gov/compound/Acetamiprid (accessed on 16 May 2021).
  27. National Research Council (US). Guide for the Care and Use of Laboratory Animals, 8th ed.; National Academies Press: Washington, DC, USA, 2011. Available online: https://www.ncbi.nlm.nih.gov/books/NBK54050/ (accessed on 16 May 2021). [CrossRef]
  28. Vardavas, A.I.; Ozcagli, E.; Fragkiadaki, P.; Stivaktakis, P.D.; Tzatzarakis, M.N.; Alegakis, A.K.; Vasilaki, F.; Kaloudis, K.; Tsiaoussis, J.; Kouretas, D.; et al. The metabolism of imidacloprid by aldehyde oxidase contributes to its clastogenic effect in New Zealand rabbits. Mutat. Res. Toxicol. Environ. Mutagen. 2018, 829–830, 26–32. [Google Scholar] [CrossRef] [PubMed]
  29. Kavvalakis, M.P.; Tzatzarakis, M.N.; Theodoropoulou, E.P.; Barbounis, E.G.; Tsakalof, A.K.; Tsatsakis, A.M. Development and application of LC–APCI–MS method for biomonitoring of animal and human exposure to imidacloprid. Chemosphere 2013, 93, 2612–2620. [Google Scholar] [CrossRef] [PubMed]
  30. Varmazyari, A.; Taghizadehghalehjoughi, A.; Sevim, C.; Baris, O.; Eser, G.; Yildirim, S.; Hacimuftuoglu, A.; Buha, A.; Wallace, D.; Tsatsakis, A.; et al. Cadmium sulfide-induced toxicity in the cortex and cerebellum: In vitro and in vivo studies. Toxicol. Rep. 2020, 7, 637–648. [Google Scholar] [CrossRef]
  31. Sevim, Ç.; Çomaklı, S.; Taghizadehghalehjoughi, A.; Özkaraca, M.; Mesnage, R.; Kovatsi, L.; Burykina, T.I.; Kalogeraki, A.; Antoniou, M.N.; Tsatsakis, A. An imazamox-based herbicide causes apoptotic changes in rat liver and pancreas. Toxicol. Rep. 2018, 6, 42–50. [Google Scholar] [CrossRef] [PubMed]
  32. Reddy, A.G.; Soujanya, S.; Lakshman, M.; Kumar, A.A. Evaluation of the protective role of vitamin C in imidacloprid-induced hepatotoxicity in male Albino rats. J. Nat. Sci. Biol. Med. 2013, 4, 63–67. [Google Scholar] [CrossRef] [PubMed] [Green Version]
  33. Kammon, A.M.; Biar, R.S.; Banga, H.S.; Sodhi, S. Patho-biochemical studies on hepatotoxicity and nephrotoxicity on exposure to chlorpyrifos and imidacloprid in layer chickens. Vet. arhiv 2010, 80, 663–672. [Google Scholar]
  34. El-Deeb, A.E.A.; Abd El-Aleem, I.M.; Sherin, S.G. Harmful effect of some insecticides on vital parameters of albino rats. J. Egypt. Soc. Toxicol. 2007, 36, 53–60. [Google Scholar]
  35. Emam, H.; Ahmed, E.; Abdel-Daim, M. Antioxidant capacity of omega-3-fatty acids and vitamin E against imidacloprid-induced hepatotoxicity in Japanese quails. Environ. Sci. Pollut. Res. 2018, 25, 11694–11702. [Google Scholar] [CrossRef]
  36. Tsatsakis, A.M.; Docea, A.O.; Tsitsimpikou, C. New challenges in risk assessment of chemicals when simulating real exposure scenarios; simultaneous multi-chemicals’ low dose exposure. Food Chem. Toxicol. 2016, 96, 174–176. [Google Scholar] [CrossRef] [PubMed]
  37. Tsatsakis, A.; Kouretas, D.; Tzatzarakis, M.; Stivaktakis, P.; Tsarouhas, K.; Golokhvast, K.; Rakitskii, V.; Tutelyan, V.; Hernandez, A.; Rezaee, R.; et al. Simulating real-life exposures to uncover possible risks to human health: A proposed consensus for a novel methodological approach. Hum. Exp. Toxicol. 2016, 36, 554–564. [Google Scholar] [CrossRef]
  38. Abou-Donia, M.B.; Goldstein, L.B.; Bullman, S.; Tu, T.; Khan, W.A.; Dechkovskaia, A.M.; Abdel-Rahman, A.A. Imidacloprid Induces Neurobehavioral Deficits and Increases Expression of Glial Fibrillary Acidic Protein in the Motor Cortex and Hippocampus in Offspring Rats Following in Utero Exposure. J. Toxicol. Environ. Health Part A 2008, 71, 119–130. [Google Scholar] [CrossRef]
  39. Kimura-Kuroda, J.; Nishito, Y.; Yanagisawa, H.; Kuroda, Y.; Komuta, Y.; Kawano, H.; Hayashi, M. Neonicotinoid Insecticides Alter the Gene Expression Profile of Neuron-Enriched Cultures from Neonatal Rat Cerebellum. Int. J. Environ. Res. Public Health 2016, 13, 987. [Google Scholar] [CrossRef] [PubMed] [Green Version]
  40. Ge, W.; Yan, S.; Wang, J.; Zhu, L.; Chen, A.; Wang, J. Oxidative Stress and DNA Damage Induced by Imidacloprid in Zebrafish (Danio rerio). J. Agric. Food Chem. 2015, 63, 1856–1862. [Google Scholar] [CrossRef]
  41. Topal, A.; Alak, G.; Ozkaraca, M.; Yeltekin, A.C.; Comaklı, S.; Acıl, G.; Kokturk, M.; Atamanalp, M. Neurotoxic responses in brain tissues of rainbow trout exposed to imidacloprid pesticide: Assessment of 8-hydroxy-2-deoxyguanosine activity, oxidative stress and acetylcholinesterase activity. Chemosphere 2017, 175, 186–191. [Google Scholar] [CrossRef] [PubMed]
  42. Wang, X.; Anadón, A.; Wu, Q.; Qiao, F.; Ares, I.; Martínez-Larrañaga, M.-R.; Yuan, Z.; Martínez, M.-A. Mechanism of Neonicotinoid Toxicity: Impact on Oxidative Stress and Metabolism. Annu. Rev. Pharmacol. Toxicol. 2018, 58, 471–507. [Google Scholar] [CrossRef]
  43. de Souza-Pinto, N.C.; Eide, L.; Hogue, B.A.; Thybo, T.; Stevnsner, T.; Seeberg, E.; Klungland, A.; Bohr, V.A. Repair of 8-oxodeoxyguanosine lesions in mitochondrial dna depends on the oxoguanine dna glycosylase (OGG1) gene and 8-oxoguanine accumulates in the mitochondrial dna of OGG1-defective mice. Cancer Res. 2001, 61, 5378–5381. [Google Scholar] [PubMed]
  44. Thompson, H.J.; Heimendinger, J.; Haegele, A.; Sedlacek, S.M.; Gillette, C.; O’Neill, C.; Wolfe, P.; Conry, C. Effect of increased vegetable and fruit consumption on markers of oxidative cellular damage. Carcinogenesis 1999, 20, 2261–2266. [Google Scholar] [CrossRef] [PubMed] [Green Version]
  45. Yuan, X.; Pan, Z.; Jin, C.; Ni, Y.; Fu, Z.; Jin, Y. Gut microbiota: An underestimated and unintended recipient for pesticide-induced toxicity. Chemosphere 2019, 227, 425–434. [Google Scholar] [CrossRef] [PubMed]
  46. Pinton, P.; Nougayrede, J.-P.; Del Rio, J.-C.; Moreno, C.; Marin, D.E.; Ferrier, L.; Bracarense, A.P.L.; Kolf-Clauw, M.; Oswald, I. The food contaminant deoxynivalenol, decreases intestinal barrier permeability and reduces claudin expression. Toxicol. Appl. Pharmacol. 2009, 237, 41–48. [Google Scholar] [CrossRef] [PubMed] [Green Version]
  47. McLaughlin, J.; Padfield, P.J.; Burt, J.P.H.; O’Neill, C.A. Ochratoxin A increases permeability through tight junctions by removal of specific claudin isoforms. Am. J. Physiol. Physiol. 2004, 287, C1412–C1417. [Google Scholar] [CrossRef] [PubMed] [Green Version]
  48. Nurulain, S.M.; Adeghate, E.; Sheikh, A.; Yasin, J.; Kamal, M.; Sharma, C.; Adem, A.; Ojha, S. Sub-Chronic Exposure of Non-Observable Adverse Effect Dose of Terbufos Sulfone: Neuroinflammation in Diabetic and Non-Diabetic Rats. CNS Neurol. Disord.-Drug Targets 2014, 13, 1397–1405. [Google Scholar] [CrossRef]
  49. Taghavian, F.; Vaezi, G.; Abdollahi, M.; Malekirad, A.A. Comparative Toxicological Study between Exposed and Non-Exposed Farmers to Organophosphorus Pesticides. Cell J. 2016, 18, 89–96. [Google Scholar] [PubMed]
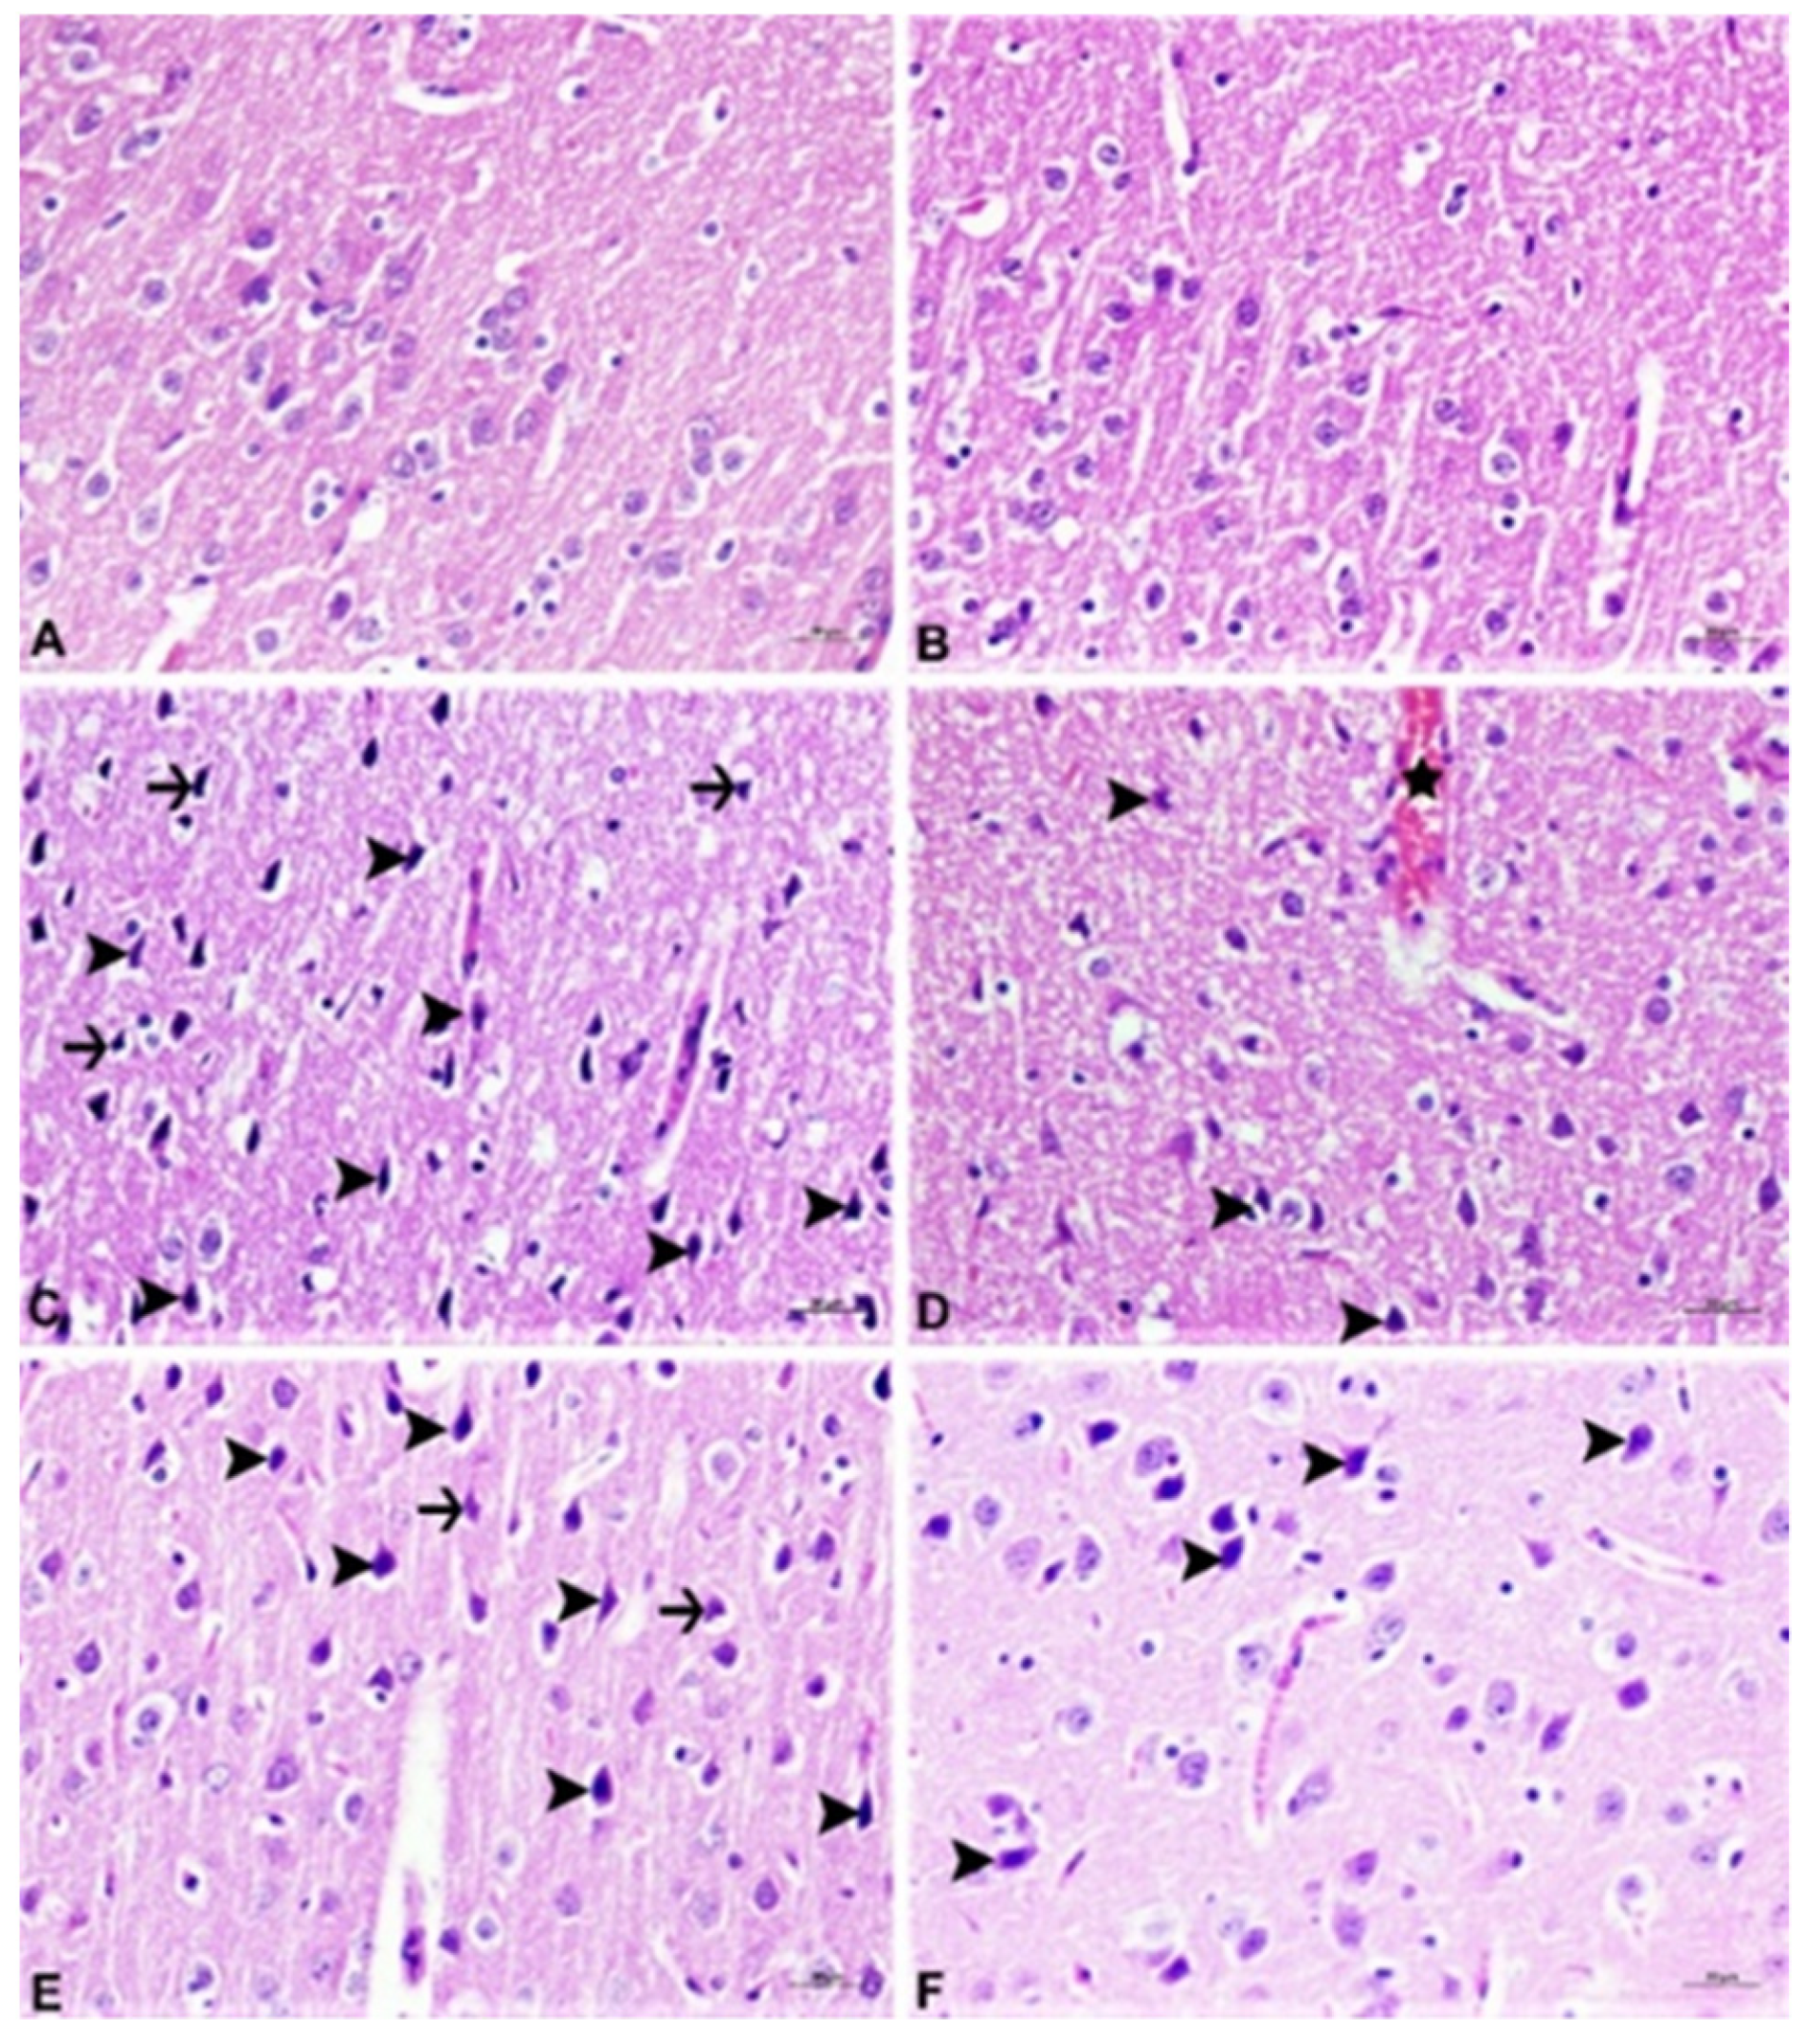
Figure 1. Brain tissue, control group (A), normal his-tological view; PRO group (B), normal histological view; ACE group (C), severe necrosis (arrows) in the tubular epithelium, severe degeneration (arrowheads); ACE + PRO group (D), mild hydropic degeneration in tubular epithe-lium (arrow), moderate level hyperemia in parenchyma vessels (star); IMI group (E), severe necrosis (arrows) in the tubular epithelium, severe degeneration (arrowheads); IMI + PRO group (F), mild degeneration in tubular epithe-lium (arrow), H&E, Bar: 20 µm.
Agronomy 11 02003 g001
Figure 2. Brain tissue, control group (A), negative 8-OHdG expression; PRO group (B), negative 8-OHdG expression; ACE group (C), severe 8-OHdG expression in neurons (arrowheads); ACE + PRO group (D), moderate 8-OHdG expression in neurons (arrowheads); IMI group (E), severe cytoplasmic 8-OHdG expression in neuron (arrowheads), IMI + PRO group (F), moderate 8-OHdG expression (arrowheads); IHC-P, Bar: 20 µm.
Agronomy 11 02003 g002
Figure 3. Brain tissue, control group (A), negative GFAP expression; PRO group (B), negative GFAP expression; ACE group (C), severe GFAP expression in astrocytes (arrowheads); ACE + PRO group (D), moderate GFAP expression (arrowheads); IMI group (E), severe GFAP expres-sion in astrocytes (arrow-heads), IMI + PRO group (F), moderate GFAP expression in astrocytes (arrowheads); IHC-P, Bar: 20 µm.
Agronomy 11 02003 g003
Figure 4. Liver tissue, control group (A), normal histological view; PRO group (B), normal histological view; ACE group (C), severe degeneration in hepatocytes (arrowheads), necrosis (arrows), hyperemia in the veins; ACE + PRO group (D), Mild degeneration (arrowheads) in hepatocytes; IMI group (E), Severe degeneration in hepatocytes (arrowheads), necrosis (arrows), moderate hyperemia of the vessels; IMI + PRO group (F), Mild degeneration in hepatocytes (arrowheads), H&E, Bar: 20 µm.
Agronomy 11 02003 g004
Figure 5. Kidney tissue, control group (A), normal histological view; PRO group (B), normal histological view; ACE group (C), severe necrosis (arrows) in the tubular epithelium, severe degeneration (arrowheads); ACE + PRO group (D), mild hydropic degeneration in tubular epithelium (arrow); IMI group (E), severe necrosis (arrows) in the tubular epithelium, severe degeneration (arrowheads); IMI + PRO group (F), mild degeneration in tubular epithelium (arrow), H&E, Bar: 20 µm.
Agronomy 11 02003 g005
Figure 6. Intestinal tissue, control group (A), normal histological view; PRO group (B), normal histological view; ACE group (C), Severe desquamation and erosion of the mucosal epithelium (arrowheads), severe mononuclear cell infiltration (stars); ACE + PRO group (D), Mild mononuclear cell infiltration in the mucous layer (stars), mild degeneration of the mucous epithelium; IMI group (E), severe mononuclear cell infiltration (stars) in the mucosa, severe erosion of the mucosal epithelium, desquamation and necrosis (arrowheads), edema in the tunica mucosa; IMI + PRO group (F), Mild degeneration of the mucosal epithelium, mild mononuclear cell infiltration in the mucosal layer (stars), H&E, Bar: 20 µm.
Agronomy 11 02003 g006
Figure 7. Intestinal tissue, control group (A), negative IL-6 expression; PRO group (B), negative IL-6 expression; ACE group (C), severe IL-6 expression in mononuclear cells and mucosa epithelium (arrowheads); ACE + PRO group (D), moderate IL-6 expression in mucous epithelium in the intestinal mucosa and inflammatory cells (arrowheads); IMI group (E), severe IL-6 expression in mucous epithelium in the intestinal mucosa and inflammatory cells (arrow-heads), IMI + PRO group (F), moderate IL-6 expression in mucous epithelium in the intestinal mucosa and inflammatory cells (arrowheads); IHC-P, Bar: 20 µm.
Agronomy 11 02003 g007
Table 1. Groups’ 13-week weight measurement results.
WeeksControlIMIACEPROIMI + PROACE + PRO
1190.63 ± 63.93192.61 ± 4.67198.45 ± 28.34195.25 ± 32.11195.83 ± 3.63191.18 ± 6.66
2250 ± 65.48254.53 ± 5.91247.72 ± 35.56255.91 ± 37.73254.83 ± 10.62250.18 ± 7.64
3283.45 ± 64.24290.69 ± 7.19280.54 ± 36.80282.50 ± 32.52282.16 ± 20.94287.72 ± 9.15
4313.81 ± 67.97319.76± 8.85302 ± 48.53318.08 ± 38.18302.75 ± 24.33307.27 ± 11.67
5330.72 ± 64.44340.07± 10.04332 ± 36.62339.91 ± 36.67319.41 ± 25.64328.90 ± 12.13
6360.45 ± 69.04362.84 ± 10.69357.36 ± 33.67366.08 ± 39.76344.33 ± 30.07351.72 ± 12.43
7378.27 ± 69.66376.07 ± 11.65357.36 ± 33.67380.66 ± 40.50359.83 ± 34.10370.18 ± 11.47
8379.36 ± 64.81395.69 ± 11.84396.63 ± 38.15391.75 ± 32.65379.33 ± 37.88392.63 ± 11.22
9400.81 ± 67.56417.30 ± 11.96416.18 ± 41.80422.83 ± 41.25397.66 ± 40.34405.09 ± 16.37
10402 ± 64.84420.84 ± 12.24421.36 ± 41.75428.33 ± 41.57398.83 ± 40.56416.45 ± 12.70
11415.63 ± 58.11428.84 ± 12.46422.09 ± 42.70429.58 ± 37.04417.58 ± 46.04429.09 ± 11.67
12400.81 ± 67.56417.38 ± 11.94416.18 ± 41.80422.83 ± 41.25397.66 ± 40.34414.18 ± 12.12
13431.18 ± 59.56450.76 ± 12.88449.45 ± 45.31453.75 ± 53.46439.25 ± 48.19448.72 ± 11.88
Table 2. Blood ALT, AST, ALP, LDH, and urea values.
ControlIMIACEPROIMI + PROACE + PRO
ALT (IU/L)62.6 ± 12.8764.5 ± 8.9370.1 ± 11.6876± 10.9571.1± 8.9368.3± 10.59
AST (IU/L)189.1 ± 36.17196.5 ± 23.27194.3 ± 14.67250 ± 61.84205.6 ± 50.01192.8 ± 2.22
ALP (IU/L)112.8 ± 20.49186.2 ± 19.09172.2 ± 20.39179.1 ± 20.40185.4 ± 22.33166.8 ± 14.02
LDH (IU/L)1758.8 ± 227.412423.5 ± 216.542350.7 ± 191.462577.8 ± 171.152031.4 ± 276.981432.4 ± 127.06
UREA(mg/dL)40.7 ± 2.5042.7 ± 2.5438.6 ± 2.4539.1 ± 2.2140.6 ± 1.4440.7 ± 4.40
Table 3. Hemogram values of experimental and control group rats.
ControlIMIACEPROIMI + PROACE + PRO
WBC (103/µL)6.28 ± 1.247.43 ± 2.8812.05 ± 7.515.91 ± 4.626.23 ± 1.0713.82 ± 9.90
Nötrofil1.79 ± 0.491.24 ± 0.541.73 ± 1.201.12 ± 0.691.07 ± 0.051.51 ± 0.39
Lenfosit4.24 ± 0.925.92 ± 2.369.73 ± 5.964.43 ± 3.614.74 ± 1.0011.87 ± 9.46
Monosit0.09 ± 0.060.11 ± 0.040.07 ± 0.000.09 ± 0.090.08 ± 0.050.14 ± 0.07
Eozinofil0.13 ± 0.090.15 ± 0.060.50 ± 0.350.25 ± 0.340.32 ± 0.180.27 ± 0.08
Bazofil0.01 ± 0.000.01 ± 0.000.01 ± 0.000.01 ± 0.000.01 ± 0.000.02 ± 0.00
RBC (106/µL)8.18 ± 0.488.92 ± 1.039.23 ± 0.349.05 ± 0.309.21 ± 0.528.71 ± 0.62
HGB (gm/dl)14.63 ± 1.0415.47 ± 1.7116.30 ± 0.4216.17 ± 0.4716.50 ± 0.9815.45 ± 0.99
HCT (%)47.68 ± 3.2250.67 ± 5.6251.45 ± 0.6351.77 ± 2.1952.52 ± 3.1649.40 ± 2.51
PLT (103/µL)732.50 ± 93.22543.37 ± 321.53740.50 ± 17.67866.75 ± 49.77702.50 ± 140.14761 ± 83.76
MCV (fL)58.21 ± 0.9556.83 ± 0.9555.70 ± 1.4157.30 ± 4.3656.97 ± 0.3356.85 ± 2.59
MCH (pg)17.83 ± 0.2817.36 ± 0.4217.65 ± 0.2117.87 ± 0.4717.90 ± 0.3717.72 ± 0.36
MCHC (g/dL)30.66 ± 0.3330.53 ± 0.4631.70 ± 0.4231.32 ± 2.0331.42 ± 0.5831.25 ± 0.96
IG (g/L)0.17 ± 0.400.01 ± 0.000.01 ± 0.000.01 ± 0.000.02 ± 0.010.03 ± 0.02
Table 4. Measurement of residue levels in liver tissue (- means remaining below the detection limit). Values were given as mean ± standard deviation (SD). p < 0.05 was considered significant.
ControlIMIACEPROIMI + PROACE + PRO
Imidacloprid (µg/g)Mean ± SD-0.06 ± 0.01--0.20 ± 0.02-
Minimum-0.02--0.15-
Maximum-0.11--0.25-
p = 0.315
Acetamiprid (µg/g)Mean ± SD--0.51 ± 0.06--0.20 ± 0.02
Minimum--0.37--0.15
Maximum--0.66--0.25
p = 0.003
Table 5. Measurement of residue levels in kidney tissue (- means remaining below the detection limit). Values were given as mean ± standard deviation (SD). p < 0.05 was considered significant.
ControlIMIACEPROIMI + PROACE + PRO
Imidacloprid (µg/g)Mean ± SD-0.37 ± 0.30--0.16 ± 0.03-
Minimum-0.04--0.06-
Maximum-1.28--0.22-
p = 0.506
Acetamiprid (µg/g)Mean ± SD--0.88 ± 0.07--0.18 ± 0.05
Minimum--0.72--0.06
Maximum--1.08--0.31
p < 0.001
Publisher’s Note: MDPI stays neutral with regard to jurisdictional claims in published maps and institutional affiliations.