Article

Drivers and Barriers Influencing the Willingness to Adopt Technologies for Variable Rate Application of Fertiliser in Lower Austria

1
Institute for Environmental Studies (IVM), Vrije Universiteit Amsterdam, 1081 HV Amsterdam, The Netherlands
2
Institute of Geomatics, University of Natural Resources and Life Sciences, Vienna (BOKU), 1190 Vienna, Austria
3
Netherlands Enterprise Agency (RVO), 2595 AL The Hague, The Netherlands
*
Author to whom correspondence should be addressed.
Agronomy 2021, 11(10), 1965; https://doi.org/10.3390/agronomy11101965
Submission received: 2 August 2021 / Revised: 10 September 2021 / Accepted: 13 September 2021 / Published: 29 September 2021
(This article belongs to the Special Issue Farmers’ Adoption of Agricultural Innovations and Their Impact)

Abstract

:
Even though a broad range of technologies for variable rate application of nitrogen fertiliser is available, there are hardly any documented cases of their use in Austria. In this study, the drivers and barriers of adoption have been investigated. A survey of 242 farmers in Lower Austria was conducted. The survey covered the farmers’ economic situation, concerns, and expectations regarding the future of their farms and their interest in precision farming technologies. A choice experiment was included in the survey to elicit farmers’ preferences for different features of variable rate application technologies. A series of multinomial logit, mixed logit and latent class logit models were run to analyze the choice experiment. Most farmers were interested in variable rate application, whereas technology costs, yield and environmental improvements were found to be important drivers of adoption. Also, farm size, farming system, technological level and network activities seem to play an important role in the uptake of variable rate application technologies.

1. Introduction

In the last 25 years, agriculture has undergone massive changes. While the aims of farmers remain the same—optimised yield, high income and a healthy environment—the technologies to reach these goals changed significantly. Over the last three decades different technologies and applications based on the spatial information in the fields have been developed. They now allow farmers to observe their fields with frequently updated maps that allow timely decisions on production inputs (e.g., fertiliser, water, seeds, pesticides) according to the specific (in time and space) requirements of the plants [1,2,3,4,5]. Automated guidance systems for tractors, in-field sensors for the monitoring of crops and soil, and maps generated by using data collected by satellites are part of the growing sector of precision agriculture, smart farming, digital agriculture or agriculture 4.0 [6].
Within the project FATIMA (“Farming tools for external nutrient inputs and water management”—www.fatima-h2020.eu (accessed on 15 September 2021)) a focus was set on spatial variable nitrogen requirements and the provision of this information to farmers. A market analysis showed that there is a large number of manufacturers providing technical solutions for variable rate nitrogen application. For example, tractor-mounted multi-spectral sensors can estimate the chlorophyll content in the leaves and a software is used to correlate it to the concentration of fertiliser in order to apply fertiliser accordingly in real time (“online systems”) [7]. Similar maps can be derived using satellite-based measurements of plant conditions to derive variable rate application maps (“offline systems”) [8,9]. Application maps can either be uploaded to the tractor terminal or used printed or on mobile devices as guides for the manual distribution of fertiliser.
Unfortunately, the diversity of solutions offered is not reflected in the number of active users in Austria. There are rare documented cases of variable rate application (VRA) of agricultural production inputs. However, there are efforts to spread existing ideas and tools and creating impulses through research and demonstration. Existing examples are the Innovation Farm (innovationfarm.at (accessed on 15 September 2021)) and the Doctoral School DiLaAg (dilaag.boku.ac.at (accessed on 15 September 2021)).
In Austria, and more generally in Europe, the adoption rate of variable rate application (VRA) and other precision farming technologies is still rather low, with some variation between countries [10,11,12,13]. A broad literature review investigated the barriers to adoption, including farm(er) characteristics, such as a lack of knowledge and/or financial means, incompatible equipment or small plot sizes that reduce the financial attractiveness of the technology for the farmers [13,14]. Nonetheless, apart from studies on precision farming in the United States of America [15,16,17,18,19,20,21,22,23,24], there is only little evidence for the barriers and drivers of the adoption of precision farming technologies in Europe. The few studies that are available are using observations from Germany and Denmark [11,12,25,26,27], the Netherlands, France, Switzerland, Italy [28,29] and Hungary [30]. Furthermore, there are several cross-country studies on the adoption of smart farming technologies in several European countries [31,32,33], but also these studies do not deal with VRA adoption in Austria.
How is the situation in Austria? Do we have similar barriers to the adoption of technologies? This study investigates the conditions for the adoption of VRA in Lower Austria. Using a choice experiment, we aim to relate the barriers and drivers for adoption to the various characteristics of alternative VRA technologies, such as the degree of automation of the technologies, their potential impacts on yields, use of fertiliser, and groundwater quality. We are further interested in understanding the characteristics of farms and farmers that are associated with a higher willingness to adopt. The insights may help to target information and other policy support towards those farmers that are most likely to take up VRA technologies.

2. Materials and Method

2.1. Survey Design

The study region comprises the districts Gänserndorf, Mistelbach, Korneuburg, Tulln and Bruck an der Leitha in Lower Austria, which is the federal state with the highest economic output of the country [34]. Average farm sizes are in the range of 50 ha. The main crops produced are cereals, maize, sunflowers, potatoes, soybeans and vegetables [34].
To gain a better understanding of the situation of the farmers in Austria and to assess their willingness to adopt VRA technologies, we conducted a large farmer survey in intensively farmed regions that aimed to provide a detailed picture of the characteristics of the farms and farmers in the region. The survey covered the farmers’ economic situation, concerns and expectations regarding the future of their farms, and the extent to which they are interested in the adoption of VRA technologies. A discrete choice experiment (DCE) was included in the survey to elicit farmers’ preferences for different features of VRA technologies. A choice experiment is a preference elicitation technique that is particularly relevant when technologies are either not offered on the market or are not widely adopted yet, which is the case for VRA technologies in the study area. It can give insights into which products and services the farmers would most likely purchase if they are offered them.
The focus of the choice experiment was to elicit the willingness to adopt different farming technologies for variable rate application of fertiliser. The focus was on technologies in general rather than on certain brands, providers of services or specific types of nitrogen fertiliser. The three options differed in the degree of automation and are presented in Table 1.
The choice experiment was embedded in a farmer survey, which was developed based on insights from previous literature on the adoption of new farming technologies and techniques by farmers [30,35,36,37,38] and using state-of-the-art approaches for drafting questionnaires [39,40]. As part of the development of the questionnaires, farmers from the area were invited to focus groups, to discuss the questionnaire. In addition, several local farmers suggested edits to the questionnaire, which the research team used to fine tune the survey. Eventually, the survey questionnaire was shared with the local research team for a review. Only then was the questionnaire translated into German. The final English version is provided in the Supplementary Material (Supplementary Material S1).
As a screening question, farmers had to confirm that they cultivate field crops and that they operate the farm on a daily basis. If they confirmed, they were introduced to the topic of the survey. This was followed by questions about the farm’s characteristics, such as size, farm type, ownership, amount and type of workers on the farm, type of cultivated crops or irrigated area. Next, farmers were asked to rank the importance of various problems on their farm (i.e., soil degradation, nitrogen enrichment of groundwater, lack of access to credit, the economic situation of the farm and bureaucracy) using Likert scales. They were then asked about their openness to innovations on their farm, any innovations they had carried out during past years, as well as their knowledge of and interest in VRA technologies. To facilitate these questions, farmers first saw descriptions of the major VRA technologies to ensure that they understand what type of technologies the questions and the choice experiment refer to. This included non-automated technologies (e.g., use of satellite images to generate field data maps useable on a pc or mobile device), partly automated technologies (e.g., use of satellite images to generate field data maps that are fed into the board computer of a spreader) and fully automated technologies (e.g., use of a spreader with built-in real-time sensors). The Supplementary Material S2 includes the original English description of the technologies. After this, the choice experiment and the logic of the choice cards was introduced to the survey participants. Each of the four choice cards shown to the farmers displayed three alternative technologies that varied in their attributes (see Section 3.2). Finally, farmers were asked for their socio-demographic characteristics (such as age, education, farm income) and how regularly they use mobile phones and computers as part of their work on the farm.

2.2. Experimental Design of the Choice Experiment

To elicit the farmers’ preferences for the different characteristics of the VRA technologies offered, the technology’s potential to increase yields, to reduce the input of fertiliser, and to improve groundwater quality were varied. The choice experiment technique hereby assumes the consumer theory of Lancaster [41], which suggests that consumers derive utility from the attributes of a good rather than from the good itself. By observing farmers’ choices between different technological alternatives, researchers get an understanding of which characteristics of the technology farmers prefer, and to what extent they are willing to pay for it [42,43].
As a first step towards creating the sets of alternatives that were shown to the participants (i.e., the choice cards), the most relevant characteristics were identified based on the focus groups. These had to (1) be features of all different types of VRA technology and (2) influence the farmer’s decision based on the results of previous research (e.g., [14,30]) and (d) be approved by the participants of the focus groups. Among several possible technology features, the following six were eventually selected and included in the choice experiment:
  • The degree of automation of the technology.
  • The potential increase in yields associated with the technology.
  • The potential reduction in the use of fertiliser associated with the technology.
  • The potential improvement in groundwater quality associated with the technology.
  • Whether free personal advice from an expert is provided with the technology.
  • The (initial, one-time) cost of adopting the technology.
These six attributes had between 2 and 6 levels as shown below in Table 2.
The above attributes were used to generate the experimental design, which determines the different combinations of features that are shown to the participants as alternatives per single choice card. As the six attributes and their levels allow the creation of 972 possible alternatives, we opted for a Bayesian D-efficient design [44] using the experimental design generator Ngene (a software by Choice Metrics, Sydney, Australia). As all offered alternatives needed to be realistic technology choices for the farmers, we included design constraints that avoided random combinations of technology features (e.g., such that relatively low-cost technologies like smartphone apps could only take the values 1000 EUR or 5000 EUR, as any higher amounts would not represent options offered on actual markets). Along the same lines of argumentation, if a technology option was associated with no reduction in fertiliser use, it could not be combined with moderate or strong improvement in groundwater quality). After applying these restrictions, a design with 32 choice cards, divided into eight blocks of four cards, resulted for the experiment. The different alternatives on the choice cards were presented with pictograms, to support the information uptake by the participants. As a last step the cards were translated to German, which was then embedded in the survey questionnaire. Also for the choice cards, an example is presented in the supplementary material (Supplementary Material S3).
In addition to three technology options, every choice card also included an option to not choose any technology (i.e., to remain with the status quo). A description of the attributes is provided in the supplementary material (Supplementary Material S4). To reduce the amount of cards that every farmer had to process, we applied blocking and showed each participant only one block of four choice cards instead of all 32 cards.

2.3. Sample Description

The survey questionnaire, including the choice experiment was completed by 242 farmers from the region. This led to the sample shown in Table 3, of 95% male farmers and 40% young farmers below 40. Only a relatively small share (2%) was 65 years or older. This suggests that the average farmer age in our sample was relatively low. In fact, data from the European Union Farm Structure Survey (EU-FSS) 2013, indicates that the Austrian farmer population is relatively young compared to other EU countries. For example, Austria is among the few EU countries with a share of farm managers below the age of 35 of above 10% and with a share of those aged 55 or older of less than 37% (Eurostat 2013). In tendency, our sample seems to reflect the relatively young farmer population in Austria. A majority of the participants had high school or vocational school degrees (73%). College or university degrees (9% and 10%, respectively) were indicated only by a few farmers. Most farmers mentioned that they use smartphones (99%) and a PC (97.9%) on their farm.
It also became clear that most of the respondents (83%) were farm owners, and only a smaller share were farm managers or employed by farming cooperatives (17%); 95% of the respondents indicated that their farm is a long-established family farm; 3% indicated that it is a first generation family farm. Only in 2% of the cases did the respondents represent a farming company or cooperative. With an average probability of 65%, the farms in the sample had a successor.
With 87% of the cases, conventional farming practices were prevalent in the sample. Only 12% reported practising organic farming. Also, this reflects data from the European Union Farm Structure Survey (EU-FSS) 2010, in which 12.3% of agricultural land in Austria is declared as dedicated to organic farming (Eurostat 2010a). Overall, our sample seems to represent the farm population in Austria reasonably well in this regard.
Regarding farm size in our sample, we observed a slight oversampling of larger farms. In the sample, none of the farms was smaller than 5 hectares and only a few were between 5 and 25 hectares (10%), whereas a relatively large share (26%) reported a size of between 100 and 500 hectares. In comparison to this, the data from the European Union Farm Structure Survey (EU-FSS) 2010 report a share of smaller farms (<5 ha) of 32%, and a share of farms between 5 and 30 hectares of 51%. Only 18% of the farms were larger than 30 hectares [45]. Regarding this discrepancy between population statistics and sample, it has to be kept in mind that these are national statistics, while the sample is drawn from the region of Lower Austria.
In terms of field crops, a share of 66% of the farmers reported grains as their most important cultivated crop, while a share of 13.2% indicated sugar beet and 6.2% potatoes as their most important field crops. Finally, regarding farm income, it is difficult to judge how representative the sample is, as 35% of the farmers were not willing to indicate their income bracket in the survey. The full dataset of responses is available in the supplementary material (Material S5).

2.4. Empirical Models

Data analysis was carried out using Stata (by StataCorp LLC, College Station, TX, USA) and NLOGIT (by Econometric Software, Inc., Plainview, NY, USA) as statistical software. After providing summary statistics, we ran a multinomial logit, a random parameters logit (mixed logit) and a latent class logit model to assess farmers preferences expressed in the choice experiment. These models are random utility models (see Marschak [46] and McFadden [47]). In these models, consumer preferences are evaluated based on choices made in the choice experiment. An underlying random utility function with a stochastic and a deterministic component is assumed. The deterministic part of the model is specified as a linear index that varies across individuals and contains a vector of attributes that vary with the alternatives in the choice experiment, as well as a vector of individual-specific characteristics. All unobserved factors are captured in a random term.
Depending on the assumptions made regarding the probability density of the unobserved factors, different models can be run, such as the logit and probit model. The logit model assumes an extreme value distribution for the random term [48]. A basic model to be run is the multinomial logit model (MNL), which further assumes that the random components of the utility of the alternatives are independently and identically distributed (i.i.d) with an extreme value distribution. Furthermore, it implies the independence of irrelevant alternatives (IIA) property, which is based on the assumption that the ratio of probabilities of two selected options remains the same if other alternatives are either added or removed, suggesting proportional or symmetric substitution among all choice options. These models cannot, therefore, account for similarities between alternatives. Furthermore, they assume that the responsiveness to attributes of different alternatives is homogeneous across participants in the experiments.
To overcome these shortcomings, a random parameters logit or mixed logit allows for a random variation in preferences, unrestricted substitution patterns and correlation in unobserved factors [48]. As additional elements, such models may involve error components (EC) or random parameters. This allows the coefficients of the attributes to follow a particular distribution rather than being fixed. Like this, heterogeneous preferences in the population can be accounted for. The EC models allow for correlation between the unobserved utility εni of different alternatives, which overcomes the i.i.d. assumption. This further can accommodate correlation between alternatives by including a common random parameter with zero mean in the utility function specification of correlated alternatives [49]. Besides relaxing the assumption of fixed coefficients and error terms, a random parameters logit model enables a correct treatment of repeated choices.
Nonetheless, the heterogeneity of preferences in the population can also be captured in a latent class logit model [50,51], which identifies different groups of respondents that share preferences for certain attributes. In mixed logit models and latent class logit models differ in the way they represent such preference heterogeneity. The former makes assumptions about the distribution of the parameter values across the population. The latter approximates the distribution in a discrete manner [52]. This allows a classification of respondents, identifying them as distinct groups with shared preferences. Other than the mixed logit model, the latent class model identifies a discrete number of classes of respondents. While class affiliation is unknown to the researcher, the prior probability of respondents to be affiliated with one of the classes can be estimated as a model parameter, based on observed individual-specific characteristics [52]. Unique utility parameters are estimated per latent class. The optimal number of classes identified by the model should be assessed based on information criteria (e.g., Akaike information criterion (AIC), Bayesian information criterion (BIC)).

3. Results

Among the 242 survey participants, a total of 28 respondents (11.6% of the sample) declined the adoption of any VRA technology across all four choice cards. These respondents are highly unlikely to invest in a VRA technology. For the remaining farmers, the model results suggest that the willingness to adopt is determined by the attributes of the VRA technology that is offered.

3.1. Results Based on the Multinomial Logit Model (MNL) and Mixed Logit Models

We first estimated the multinomial logit model, as a basic model that represents the average choice parameters. Then, we ran the more advanced models to capture the heterogeneity in farmer preferences. For the mixed logit model this involved the use of a Halton sequence of 100 replications in a quasi-Monte Carlo maximum likelihood simulation [53]. The results of the estimations are provided in Table 4. Models I and II include the choice attributes only. By contrast, Model III also includes interaction terms with covariates found to be statistically significant based on a systematic search procedure.
Regarding the goodness of fit, the outcome of a likelihood-ratio test shows that Model II fits significantly better than Model I, yet Model III, shows the best model fit. In model I, the estimators for the non-automated and partially automated technologies are not significant. The increase in yield at the 5% level also does not turn out to be significant in Model I. The other choice attribute parameters are statistically significant. With the exception of the increase in yield at 3%, they all have the expected sign.
In model II, preference heterogeneity is accounted for by the inclusion of random parameters. The dummy coded attributes (degree of technology automation, increase in yields, fertiliser savings, groundwater quality improvement and expert advice,) are specified using a uniform distribution [43] and the linear-effects coded attribute cost, using a normal distribution. As mentioned above, the inclusion of the random parameters improves the model fit. The random parameters for the non- and partially automated technologies, the yield increase at 5% and fertiliser saving at 5%, and the medium water quality improvement demonstrate a significant effect at the 1% level. This indicates that these choice attributes are subject to preference heterogeneity.
The respondents have a negative preference for the fully automated technology. The remaining two technology estimates do not have a significant effect on the mean, but the preference is not constant across the respondents given the significant random parameter estimate. This indicates that there is a diversity of preferences, being both positive and negative related to the choice for the non-automated and partially automated technologies. The increase in yield at 3% seems to not have an effect on the choice made. It is possible that the farmers who responded did not consider this effect to be of specific interest in this choice task. For the 5% increase in yield, only a significant effect is found for the random parameter. Both estimators for the water quality improvement show a significant effect indicating the interest to contribute to measures to improve the environmental conditions. Personal advice was positively valued and shows the importance of offering support to farmers after the initial purchase. Finally, the cost attribute (purchase cost) is negative which is in line with the expectation that there is price sensitivity that causes respondents to be less willing to invest at higher price points.
Comparing the attributes-only results (Model I) with the self-reported importance of the attributes (measured on a scale from 1 to 5, with 1 indicating the lowest importance and 5 indicating the highest importance), as listed in Table 5, shows some inconsistencies. As shown in Table 5, the farmers indicated that the economic aspects of the technology are most important when making choices. According to the actual choices made by these farmers in the discrete choice experiment (DCE) (Model I), besides the cost factor, the environmental aspect of water quality improvements were considered as an essential feature. The importance of fertiliser reductions and yield improvements are less clear from the DCE.
In model III, the interactions between choice experiment attributes and farm characteristics are presented. The covariates included are farm size, medium 50–100 ha and large farms of over 100 ha. Those who operated large farms have a clear preference for the partially automated and fully automated technology over operators of smaller farms, which can be derived from the interactions of the farm size dummies with the dummies indicating the degree of automation. Lastly, a dummy variable for organic farming was included as an interaction term with the technologies. The results show that organic farmers are less interested in all three technologies included.

3.2. Insights from the Latent Class Model

In addition to the mixed logit model, we also ran a latent class model. Comparing the model fit parameters of the model presented in Table 6 compared to a model that includes only the attributes of the choice experiment (and no covariates explaining class affiliation) we can state that including the covariates increases the model fit. The Log Likelihood function reduces from −1219.13 (model only including the attributes) to −1205.54 (model with covariates shown in Table 6) and the Pseudo R-squared increases from 0.092 (model only including the attributes) to 0.102 (model with covariates shown in Table 6). However, in absolute terms the explanatory power of the model is relatively low, which was already stated for the mixed logit models presented earlier.
Based on the results from the latent class model, we can identify two groups of farmers with different preferences. The first latent class that can be identified comprises about 75% of the farmers in the sample. These farmers show rational preferences and express a general interest in VRA technologies, in particular for the non-automated technologies and the partially automated technologies (both significant at 5% level). Fully automated technologies do not seem to be appreciated by this group of farmers. They greatly value strong increases in yields (significant at 1% level) yet show no preference for savings in fertiliser. These farmers value both medium and strong improvements in water quality (both parameters significant at 1% level) but show no preference for personal advice that comes with the technology. The price coefficient is significant and negative, which is in line with rational economic behaviour. For the farmers in Class 1 we can thus conclude that they seem to be interested in adopting non-automated or partially automated technologies, in particular when they entail high potential increases in yields as well as strong improvements in water quality. We would thus expect that these farmers are generally willing to adopt VRA technologies in case they entail the preferred features. From the class probability model, we can infer that Class 1 comprises a higher share of conventional farmers as compared to organic farmers.
Another group of farmers (Class 2), comprising about 25% of the sample, shows, however, slightly irrational preferences. These farmers did not only express a strong and significant disapproval of all types of VRA technologies but also for many of their features such as increases in yields and increases in water quality. The only attributes they value are moderate savings in fertiliser (significant at 5% level) and personal advice (significant at 5% level). However, the positive and significant parameter estimate for cost shows that these farmers did not follow economic rationality in their choices. Therefore, it is difficult to explain the preferences of this latent class. From the class probability model, we can infer that Class 2 comprises a higher share of organic farmers as well as farmers who were interviewed by interviewers 2, 4 and 5, compared to Class 1. Whereas the disapproval of farmers interviewed by interviewers 2, 4 and 5 cannot be explained ex post, the general disapproval of technologies by organic farmers seems somewhat plausible. As organic farmers usually do not use chemical fertilisers, one of the major advantages of VRA technologies does not materialise for them, which makes it comprehensible that their interest in these technologies is very limited.

4. Discussion and Conclusions

Based on the insights from the survey and the choice experiment, we can conclude that farmers’ interest in the fully-automated technology is limited in the study area. This makes it very unlikely that this technology will be widely adopted in the short term in Lower Austria. Partially and non-automated technologies stand better chances of adoption by farmers.
Nevertheless, about 75% of the respondents expressed a general interest in VRA technologies. Their preference is geared towards non-automated and partially automated technologies. Technology cost, yield improvements and environmental improvements were found to be important drivers for this group of farmers. The latter is in line with the findings of another study [22] that observed that the early adoption of precision agriculture technologies in the US was favourably influenced by farmers’ beliefs in the environmental benefits of these technologies. Although fertiliser savings were self-reported by farmers as an important feature of VRA technology, this did not turn up as a key feature in the choice experiment. More specifically, fertiliser savings did not have a significant effect on the choices made by the farmers. It is possible that the low cost of fertilisers in Austria have influenced this finding. Although the presented VRA technologies could reduce the fertiliser costs of the farmers, the impact is marginal related to the total costs incurred on the farm.
Despite the fact that in general, farmers perceived the problems addressed by the VRA technologies (i.e., nitrification of groundwater, water scarcity) to be less of a challenge compared to other issues (e.g., bureaucracy, market conditions, extreme weather events), the improvement in groundwater quality was valued quite strongly in the choice experiment. Groundwater problems are a specific concern in the region and our results suggest that although farmers are confronted with bigger problems, they are interested in contributing to a solution for improving groundwater quality.
Several farm(er) characteristics proved influential for the choices made by the farmers. One of the main influential factors is the farm size. The non-automated technologies are more strongly preferred by small and medium-sized farms (up to 50 ha), the partly automated technologies are more geared towards medium-sized farms. The fully automated technologies are of interest only for larger-scale farms of over 100 ha. Furthermore, smaller farms turned out to be less interested in fertiliser savings. The financial gains for these farms’ sizes might not be large enough to make the investment worthwhile. Both findings suggest that economies of scale play an important role, which confirms the suggestions in [12,13] that high investment cost and small plot size are major barriers to adoption of VRA technologies. Furthermore, the farming technique seems to influence the interest for VRA technologies. Conventional farmers seem, in tendency, to be more interested in the VRA technologies than organic farmers. A reason might be that VRA systems for organic fertiliser have so far only been applied on an experimental basis in Austria [53].
VRA technologies can be rather costly for individual farmers. Our results suggest that for many farmers the initial financial investment is a major barrier for the adoption of these innovative farming technologies. This holds in particular under the market conditions at the time the survey was conducted, which were rated among the greatest challenges for farmers in the survey. Farmers who were familiar with VRA technologies through other farmers indicated a significantly higher interest in the technologies. Having a chance to observe and experience the use of precision farming technologies on the plots of a fellow farmer increases the likelihood of adopting such a technology on one’s own farm, as also mentioned by [18]. Network effects seem essential for the uptake of VRA technologies [28], which has also been suggested before in other studies [54,55,56].
Therefore, we conclude that to promote VRA technologies, a combination of financial support, possibly through subsidies, as well as promoting networking and knowledge-sharing among farmers is crucial. In our survey, farmers indicated that they most often turn to neighboring farmers and independent advisors for farming-related information. The use of these channels seems important to reach the farming community at large. A study by the European Parliament proposes incentives for cooperation between farmers and the necessity to include farm advisors in the process of digitalisation as many solutions are perceived to be too complex [57].
In our future work we will put even more focus on the way how and by whom information is communicated as it turns out to be one of the decisive factors of technology adoption.

Supplementary Materials

The following are available online at https://www.mdpi.com/article/10.3390/agronomy11101965/s1, Supplementary Material S1: Farmer survey and choice experiment: “Socio-economic situation of farmers and techniques to reduce nutrient input and water use“; Supplementary Material S2: Description of PF technologies included in the choice experiment and survey; Supplementary Material S3: Example choice card as shown to the respondents; Supplementary Material S4: Description of the attributes used in the choice experiment; Supplementary Material S5: Dataset of responses.

Author Contributions

Conceptualisation, J.B.; methodology, J.B.; validation, J.B.; formal analysis, J.B. and B.v.d.K.; investigation, L.E.; resources, L.E.; data curation, J.B.; writing—original draft preparation, J.B., B.v.d.K. and L.E.; writing—review and editing, F.V.; visualisation, J.B. and B.v.d.K.; supervision, F.V.; project administration, J.B.; funding acquisition, F.V. All authors have read and agreed to the published version of the manuscript.

Funding

This research was funded by the European Union’s Horizon 2020 research and innovation programme under grant agreement No 633945.

Data Availability Statement

The data presented in this study are available in in the Supplementary Material S5.

Conflicts of Interest

The authors declare no conflict of interest. The funders had no role in the design of the study; in the collection, analyses, or interpretation of data; in the writing of the manuscript, or in the decision to publish the results.

References

  1. Dusadeerungsikul, P.O.; Liakos, V.; Morari, F.; Nof, S.Y.; Bechar, A. Smart action. In Agricultural Internet of Things and Decision Support for Precision Smart Farming; Elsevier: Amsterdam, The Netherlands, 2020; pp. 225–277. ISBN 978-0-12-818373-1. [Google Scholar]
  2. Heege, H.J. (Ed.) Precision in Crop Farming; Springer: Dordrecht, The Netherlands, 2013; ISBN 978-94-007-6759-1. [Google Scholar]
  3. Sawyer, J.E. Concepts of variable rate technology with considerations for fertilizer application. J. Prod. Agric. 1994, 7, 195–201. [Google Scholar] [CrossRef]
  4. Al-Gaadi, K.A.; Ayers, P.D. Integrating Gis and GPS into a spatially variable rate herbicide application system. Appl. Eng. Agric. 1999, 15, 255–262. [Google Scholar] [CrossRef]
  5. Sishodia, R.P.; Ray, R.L.; Singh, S.K. Applications of remote sensing in precision agriculture: A review. Remote Sens. 2020, 12, 3136. [Google Scholar] [CrossRef]
  6. McBratney, A.; Whelan, B.; Ancev, T.; Bouma, J. Future directions of precision agriculture. Precis. Agric. 2005, 6, 7–23. [Google Scholar] [CrossRef]
  7. Reckleben, Y. Sensoren für die stickstoffdüngung—Erfahrungen in 12 Jahren praktischem Einsatz. J. Kult. 2014, 66, 42–47. [Google Scholar] [CrossRef]
  8. Zhang, X.; Shi, L.; Jia, X.; Seielstad, G.; Helgason, C. Zone mapping application for precision-farming: A decision support tool for variable rate application. Precis. Agric. 2010, 11, 103–114. [Google Scholar] [CrossRef] [Green Version]
  9. Jin, Z.; Prasad, R.; Shriver, J.; Zhuang, Q. Crop model- and satellite imagery-based recommendation tool for variable rate N fertilizer application for the US corn system. Precis. Agric. 2017, 18, 779–800. [Google Scholar] [CrossRef]
  10. Reichardt, M.; Jürgens, C.; Klöble, U.; Hüter, J.; Moser, K. Dissemination of precision farming in Germany: Acceptance, adoption, obstacles, knowledge transfer and training activities. Precis. Agric. 2009, 10, 525–545. [Google Scholar] [CrossRef]
  11. Kutter, T.; Tiemann, S.; Siebert, R.; Fountas, S. The role of communication and co-operation in the adoption of precision farming. Precis. Agric. 2011, 12, 2–17. [Google Scholar] [CrossRef]
  12. Zarco-Tejada, P.; Hubbard, N.; Loudjani, P. Precision Agriculture: An Opportunity for EU Farmers—Potential Support with the CAP 2014–2020; Publications Office of the European Union: Luxembourg, 2014. [Google Scholar]
  13. OECD. Farm Management Practices to Foster Green Growth; Organization for Economic: Paris, France, 2016. [Google Scholar]
  14. Khanna, M.; Epouhe, F.; Hornbaker, R. Site-specific crop management: Adoption patterns and incentives. Rev. Agric. Econ. 1999, 21, 433–472. [Google Scholar] [CrossRef]
  15. Khanna, M.; Zilberman, D. Incentives, precision technology and environmental protection. Ecol. Econ. 1997, 23, 25–43. [Google Scholar] [CrossRef]
  16. Daberkow, S.G.; Mcbride, W.D. Farm and operator characteristics affecting the awareness and adoption of precision agriculture technologies in the US. Precis. Agric. 2003, 4, 163–177. [Google Scholar] [CrossRef]
  17. Paxton, K.W.; Mishra, A.K.; Chintawar, S.; Roberts, R.K.; Larson, J.A.; English, B.C.; Lambert, D.M.; Marra, M.C.; Larkin, S.L.; Reeves, J.M.; et al. Intensity of precision agriculture technology adoption by cotton producers. Agric. Resour. Econ. Rev. 2011, 40, 133–144. [Google Scholar] [CrossRef]
  18. Pierpaoli, E.; Carli, G.; Pignatti, E.; Canavari, M. Drivers of precision agriculture technologies adoption: A literature review. Procedia Technol. 2013, 8, 61–69. [Google Scholar] [CrossRef] [Green Version]
  19. Schimmelpfennig, D.; Ebel, R. On the Doorstep of the Information Age: Recent Adoption of Precision Agriculture; Economic Research Service: Washington, DC, USA, 2011. [Google Scholar]
  20. Schimmelpfennig, D. Farm Profits and Adoption of Precision Agriculture; Economic Research Service: Washington, DC, USA, 2016. [Google Scholar]
  21. Schimmelpfennig, D. Crop production costs, profits, and ecosystem stewardship with precision agriculture. J. Agric. Appl. Econ. 2018, 50, 81–103. [Google Scholar] [CrossRef] [Green Version]
  22. Watcharaanantapong, P.; Roberts, R.K.; Lambert, D.M.; Larson, J.A.; Velandia, M.; English, B.C.; Rejesus, R.M.; Wang, C. Timing of precision agriculture technology adoption in US cotton production. Precis. Agric. 2014, 15, 427–446. [Google Scholar] [CrossRef]
  23. Ofori, E.; Griffin, T.; Yeager, E. Duration analyses of precision agriculture technology adoption: What’s influencing farmers’ time-to-adoption decisions? Agric. Finance Rev. 2020, 80, 647–664. [Google Scholar] [CrossRef]
  24. Reichardt, M.; Jürgens, C. Adoption and future perspective of precision farming in germany: Results of several surveys among different agricultural target groups. Precis. Agric. 2009, 10, 73–94. [Google Scholar] [CrossRef]
  25. Tamirat, T.W.; Pedersen, S.M.; Lind, K.M. Farm and operator characteristics affecting adoption of precision agriculture in denmark and germany. Acta Agric. Scand. Sect. B—Plant Soil Sci. 2018, 68, 349–357. [Google Scholar] [CrossRef]
  26. Pedersen, S.M.; Fountas, S.; Blackmore, B.S.; Gylling, M.; Pedersen, J.L. Adoption and perspectives of precision farming in Denmark. Acta Agric. Scand. Sect. B—Plant Soil Sci. 2004, 54, 2–8. [Google Scholar] [CrossRef]
  27. Long, T.B.; Blok, V.; Coninx, I. Barriers to the adoption and diffusion of technological innovations for climate-smart agriculture in Europe: Evidence from The Netherlands, France, Switzerland and Italy. J. Clean. Prod. 2016, 112, 9–21. [Google Scholar] [CrossRef]
  28. Blasch, J.; van der Kroon, B.; van Beukering, P.; Munster, R.; Fabiani, S.; Nino, P.; Vanino, S. Farmer preferences for adopting precision farming technologies: A case study from Italy. Eur. Rev. Agric. Econ. 2020, jbaa031. [Google Scholar] [CrossRef]
  29. Lencsés, E.; Takács, I.; Takács-György, K. Farmers’ perception of precision farming technology among hungarian farmers. Sustainability 2014, 6, 8452–8465. [Google Scholar] [CrossRef] [Green Version]
  30. Barnes, A.; De Soto, I.; Eory, V.; Beck, B.; Balafoutis, A.; Sánchez, B.; Vangeyte, J.; Fountas, S.; van der Wal, T.; Gómez-Barbero, M. Influencing factors and incentives on the intention to adopt precision agricultural technologies within arable farming systems. Environ. Sci. Policy 2019, 93, 66–74. [Google Scholar] [CrossRef]
  31. Barnes, A.P.; Soto, I.; Eory, V.; Beck, B.; Balafoutis, A.; Sánchez, B.; Vangeyte, J.; Fountas, S.; van der Wal, T.; Gómez-Barbero, M. Exploring the adoption of precision agricultural technologies: A cross regional study of EU farmers. Land Use Policy 2019, 80, 163–174. [Google Scholar] [CrossRef]
  32. Knierim, A.; Borges, F.; Lee Kernecker, M.; Kraus, T.; Wurbs, A. Theme 4-Smart Technologies in Farming and Food Systems What Drives Adoption of Smart Farming Technologies? Evidence from a Cross-Country Study; European IFSA Symposium: Chania, Greece, 2018; p. 1. [Google Scholar]
  33. Amt der NÖ Landesregierung. Der Grüne Bericht 2019—Bericht Über die Wirtschaftliche und Soziale Lage der Landund Forstwirtschaft 2019; Amt der NÖ Landesregierung: St. Pölten, Austria, 2019.
  34. Alcon, F.; Tapsuwan, S.; Brouwer, R.; de Miguel, M.D. A choice experiment of farmer’s acceptance and adoption of irrigation water supply management policies. Environ. Sci. Policy 2014, 44, 226–236. [Google Scholar] [CrossRef]
  35. Brouwer, R.; Lienhoop, N.; Oosterhuis, F. Incentivizing afforestation agreements: Institutional-economic conditions and motivational drivers. J. For. Econ. 2015, 21, 205–222. [Google Scholar] [CrossRef]
  36. Farmar-Bowers, Q.; Lane, R. Understanding farmers’ strategic decision-making processes and the implications for biodiversity conservation policy. J. Environ. Manag. 2009, 90, 1135–1144. [Google Scholar] [CrossRef] [PubMed]
  37. Kuhfuss, L.; Hanley, T.S.; Préget, R.B.; Thoyer, S.; Hanley, N. Nudging Farmers to Sign Agri-Environmental Contracts: The Effects of a Collective Bonus; University of St. Andrews: St. Andrews, Scotland, 2015. [Google Scholar]
  38. Dillman, D.A.; Smyth, J.D.; Christian, L.M. (Eds.) Internet, Phone, Mail, and Mixed-Mode Surveys: The Tailored Design Method, 4th ed.; Wiley: Hoboken, NJ, USA, 2014. [Google Scholar]
  39. Groves, R.M. (Ed.) Survey Methodology, 2nd ed.; Wiley: Hoboken, NJ, USA, 2009. [Google Scholar]
  40. Lancaster, K.J. A new approach to consumer theory. J. Political Econ. 1966, 74, 132–157. [Google Scholar] [CrossRef]
  41. Louviere, J.J.; Hensher, D.; Swait, J.D. (Eds.) Stated Choice Methods—Analysis and Application; Cambridge University Press: Cambridge, UK, 2000. [Google Scholar]
  42. Hensher, D.A.; Rose, J.M.; Greene, W.H. (Eds.) Applied Choice Analysis: A Primer; Cambridge University Press: Cambridge, UK, 2005. [Google Scholar]
  43. Rose, J.M.; Bliemer, M.C.J. Constructing efficient stated choice experimental designs. Transp. Rev. 2009, 29, 587–617. [Google Scholar] [CrossRef]
  44. Eurostat Agricultural Census in Austria. 2010. Available online: http://ec.europa.eu/eurostat/statistics-explained/index.php/Agricultural_census_in_Austria (accessed on 26 October 2017).
  45. Marschak, J. Binary choice constraints on random utility indications. In Stanford Symposium on Mathematical Methods in the Social Sciences; Arrow, K., Ed.; Stanford University Press: Stanford, CA, USA, 1960; pp. 312–329. [Google Scholar]
  46. McFadden, D. Conditional logit analysis of qualitative choice behavior. In Frontiers in Econometrics; Zarembka, P., Ed.; Academic Press: New York, NY, USA, 1974; pp. 105–142. [Google Scholar]
  47. Train, K. Discrete Choice Methods with Simulation; Cambridge University Press: Cambridge, UK, 2003. [Google Scholar]
  48. Brownstone, D.; Train, K. Forecasting new product penetration with flexible substitution patterns. J. Econ. 1999, 89, 109–129. [Google Scholar] [CrossRef] [Green Version]
  49. Morey, E.; Thacher, J.; Breffle, W. Using angler characteristics and attitudinal data to identify environmental preference classes: A latent-class model. Environ. Resour. Econ. 2006, 34, 91–115. [Google Scholar] [CrossRef]
  50. Scarpa, R.; Thiene, M.; Tempesta, T. Latent class count models of total visitation demand: Days out hiking in the eastern alps. Environ. Resour. Econ. 2007, 38, 447–460. [Google Scholar] [CrossRef]
  51. Greene, W.H.; Hensher, D.A. A latent class model for discrete choice analysis: Contrasts with mixed logit. Transp. Res. Part B Methodol. 2003, 37, 681–698. [Google Scholar] [CrossRef]
  52. Bhat, C.R. Quasi-random maximum simulated likelihood estimation of the mixed multinomial logit model. Transp. Res. Part B Methodol. 2001, 35, 677–693. [Google Scholar] [CrossRef] [Green Version]
  53. Böck, A. Kompost streuen 4.0—Teilflächenspezifische Bodenverbesserung. Landwirt 2019, 3, 50–52. [Google Scholar]
  54. Maertens, A.; Barrett, C.B. Measuring social networks’ effects on agricultural technology adoption. Am. J. Agric. Econ. 2012, 95, 353–359. [Google Scholar] [CrossRef]
  55. Conley, T.; Christopher, U. Social learning through networks: The adoption of new agricultural technologies in Ghana. Am. J. Agric. Econ. 2001, 83, 668–673. [Google Scholar] [CrossRef] [Green Version]
  56. Bandiera, O.; Rasul, I. Social networks and technology adoption in Northern Mozambique. Econ. J. 2006, 116, 869–902. [Google Scholar] [CrossRef] [Green Version]
  57. Kritikos, M.; European Parliament; European Parliamentary Research Service; Scientific Foresight Unit. Precision Agriculture in Europe: Legal, Social and Ethical Considerations: Study; European Parliament: Brussels, Belgium, 2017; ISBN 978-92-846-1662-6. [Google Scholar]
Table 1. Overview of technologies for variable rate application of fertiliser offered to the farmers in the choice experiment.
Data SourceOptionDescriptionSchematic View
Satellite-based mapsNon-automated technologyThis option allows farmers to view their fields in a webGIS platforms. The system provides information on management zones and satellite imagery, including the possibility to calculate fertiliser requirements.
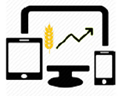
 Agronomy 11 01965 i001
Partly automated technologySimilar to option 1 with in addition the possibility to download the application map with prescriptions and transfer the map to the terminal of the tractor. A positioning system (DGPS) is used during the application to assure the correct application of the fertiliser.
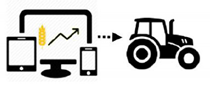
 Agronomy 11 01965 i002
Ground-based mapsFully automated technologySensor-based variable rate application is a site-specific management method that utilises sensors to measure the desired properties, usually soil properties or crop characteristics on the go. Measurements made by such systems are then processed and used immediately to control a variable rate applicator.
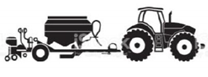
 Agronomy 11 01965 i003
Table 2. Attributes of the proposed options and description of different levels.
AttributeNo. of LevelsLevels
Automation3Non-automated, Partially automated, Fully automated
Increase in yields30%, +3%, +5%
Savings in fertiliser30%, −5%, −10%
Improvement of groundwater quality3no change, moderate change, strong change
Free expert advice2no, yes
Cost of adoption61, 5, 10, 25, 50, 75 (in thousand Euros)
Table 3. Sample characteristics (percentages, except for last indicator), (the number of farmers that was interviewed) N = 242.
IndicatorCategoryValue
SexMale95.0
Female5.0
Agebelow 40 years39.7
between 40 and 54 years45.0
between 55 and 64 years13.2
65 years or above2.1
EducationPrimary/elementary school0.8
High school37.6
Vocational school35.1
College/higher education9.1
University9.9
Other7.4
Role on the farmOwner of the farm83.1
Manager of the farm/cooperative (employed)16.9
Other0.0
Use of IT on the farmUses smartphone for business98.8
Uses computer for business97.9
Farm characteristics
Farm categoryLong-established family farm95.4
First generation family farm2.5
Part of a farming company or cooperative2.1
Farming systemConventional farming87.2
Organic farming12.4
Other0.4
Farm sizeless than 5 ha0.0
between 5 and 25 ha9.9
between 26 and 50 ha24.4
between 50 and 100 ha39.3
between 100 and 500 ha25.6
between 500 and 1000 ha0.0
more than 1000 ha0.0
Don’t know/no answer0.8
Yearly income before taxless than 10.000 EUR5.0
between 10.001 and 25.000 EUR22.7
between 25.001 and 50.000 EUR19.8
between 50.001 and 75.000 EUR9.9
between 75.001 and 100.000 EUR5.4
more than 100.000 EUR2.5
Don’t know/no answer34.7
Successor for the farmAverage probability of having a successor0.65
Table 4. Results of multinomial logit and mixed logit models.
Model I: Multinomial Logit (MNL) Attributes OnlyModel II: Mixed Multinomial Logit (MMNL) Attributes OnlyModel III: MMNL Extended Model
Explanatory VariablesParameter EstimateParameter EstimateSt. Dev. Random ParametersParameter EstimateSt. Dev. Random Parameters
Choice attributes
Non-automated−0.0013 (0.172)−0.0925 (0.200)1.139 *** (0.355)−0.122 (0.254)1.095 *** (0.352)
Partially automated−0.0802 (0.156)−0.1328 (0.183)1.099 *** (0.303)−0.269 (0.230)0.797 ** (0.402)
Fully automated−0.5189 ** (0.220)−0.5547 *** (0.250)0.047 (0.641)−0.710 ** (0.295)0.162 (0.538)
Increase yield 3%−0.2992 * (0.159)−0.2633 (0.183)0.395 (0.610−0.275 (0.179)0.247 (0.779)
Increase yield 5%0.1670 (0.123)0.1471 (0.153)1.442 *** (0.285)0.133 (0.148)1.275 *** (0.289)
Fertiliser save 5%0.3342 *** (0.128)0.4086 *** (0.154)1.123 *** (0.384)0.386 ** (0.152)1.005 *** (0.368)
Fertiliser save 10%−0.1338 (0.144)−0.0863 (0.165)0.076 (0.419)−0.111 (0.162)0.079 (0.403)
Medium improvement water quality0.3821 *** (0.125)0.4778 *** (0.153)0.1298 *** (0.324)0.465 *** (0.148)1.118 *** (0.327)
Strong improvement water quality0.2944 ** (0.146)0.3804 ** (0.174)0.465 (0.762)0.365 ** (0.168)0.446 (0.660)
Personal advice0.2813 *** (0.084)0.294 *** (0.098)0.302 (0.610)0.287 *** (0.098)0.511 (0.377)
Purchase cost−0.0099 ** (0.005)−0.1446 ** (0.005)0.005 (0.008)−0.012 ** (0.005)0.004 (0.007)
Characteristics
Farm medium*non automated 0.175 (0.270)
Farm medium*partially automated 0.395 (0.247)
Farm medium*fully automated 0.267 (0.264)
Farm large*non automated 0.479 (0.305)
Farm large*partially automated 0.745 *** (0.283)
Farm large*fully automated 0.649 ** (0.298)
Organic*non automated −0.992 *** (0.341)
Organic*partially automated −1.326 *** (0.326)
Organic*fully automated −0.643 * (0.331)
Model summary statistics
Log Likelihood−1256.21−1240.78 −1226.71
Pseudo R-square0.060.075 0.076
N968968 968
Notes: *** significant at 1%, ** significant at 5%, * significant at 10%. Standard errors in parentheses. Farm small = less than 50 ha; Farm medium = between 50–100 ha; Farm large = larger than 100 ha.
Table 5. Importance of attributes in choice tasks measured on a scale from 1 to 5 (ranking in parentheses).
AttributeNMeanStd.dev.Min.Max.
Degree of automation2383.06 (6.)1.1015
Increase in yields2383.84 (3.)1.0615
Reduced use of fertiliser2373.86 (2.)1.1315
Improved water qual2383.51 (4.)1.2015
Personal advice2373.23 (5.)1.2315
Cost2384.35 (1.)1.1315
Table 6. Results of the latent class model.
Explanatory VariablesClass 1 (75.2%)
Parameter Estimates
Class 2 (24.8%)
Parameter Estimates
Choice attributes
Non-automated0.523 ** (0.229)−1.497 *** (0.539)
Partially automated0.512 ** (0.214)−1.799 *** (0.531)
Fully automated0.235 (0.294)−2.824 *** (0.883)
Increase yield 3%0.183 (0.243)−1.715 *** (0.532)
Increase yield 5%0.561 *** (0.203)−1.133 ** (0.475)
Fertiliser save 5%0.251 (0.173)1.156 ** (0.453)
Fertiliser save 10%0.002 (0.184)0.212 (0.435)
Medium improvement water quality0.675 *** (0.163)−0.293 (0.417)
Strong improvement water quality0.809 *** (0.233)−1.194 ** (0.537)
Personal advice0.185 (0.113)0.833 ** (0.325)
Purchase cost−0.029 *** (0.008)0.042 *** (0.015)
Class probability modelClass 1
Parameter estimates
Class 2
Parameter estimates
Constant2.887 *** (0.800)fixed parameter
Farmer aged 55 or older−0.716 (0.606)fixed parameter
Organic farmer−1.899 *** (0.659)fixed parameter
Strongly concerned about nitrification of groundwater−1.676 (1.086)fixed parameter
Interviewed by Interviewer 2−1.716 *** (0.665)fixed parameter
Interviewed by Interviewer 4−2.082 *** (0.749)fixed parameter
Interviewed by Interviewer 5−1.392 ** (0.701)fixed parameter
Model summary statistics
Log Likelihood−1205.54
Pseudo R-square0.102
N968 servations (242 respondents)
Notes: *** significant at 1%, ** significant at 5%. Standard errors in parentheses.
Publisher’s Note: MDPI stays neutral with regard to jurisdictional claims in published maps and institutional affiliations.

