Article

Rate and Timing of Meat and Bone Meal Applications Influence Growth, Yield, and Soil Water Nitrate Concentrations in Sweet Corn Production

1
Institute of Food and Agricultural Sciences, University of Florida, Orlando, FL 32812, USA
2
Department of Tropical Plant and Soil Sciences, University of Hawai’i, Honolulu, HI 96822, USA
3
Department of Plant and Environmental Protection Sciences, University of Hawai’i at Manoa, Honolulu, HI 96822, USA
*
Author to whom correspondence should be addressed.
Agronomy 2021, 11(10), 1945; https://doi.org/10.3390/agronomy11101945
Submission received: 14 August 2021 / Revised: 15 September 2021 / Accepted: 20 September 2021 / Published: 28 September 2021
(This article belongs to the Special Issue Innovations in Tropical Vegetable Agroecosystems)

Abstract

:
Using local resources and minimizing environmental impacts are two important components of sustainable agriculture. Meat and bone meal (MBM), tankage, is a locally produced organic fertilizer. This study was conducted to investigate the response of sweet corn (Zea mays L. var. saccharata Stuart.) and soil water nitrate (NO3-N) concentration to MBM application at two locations, Waimānalo and Poamoho, on the island of O’ahu. The objectives were to determine effects of six application rates (0, 112, 224, 336, 448 and 672 kg N ha−1) and two application timings (preplant and split application) on: (1) sweet corn growth, yield, and quality, and (2) soil water nitrate concentration within and below the root zone. The split-plot was designed as four replicates randomly arranged in a complete block. Plant growth of roots and shoots, yield, and relative leaf chlorophyll content of sweet corn increased with increasing application rates of MBM in both locations. At Poamoho, yield was 13.6% greater in preplant versus split application. Nitrate-nitrogen losses were reduced by 20% at Waimānalo and 40% at Poamoho when MBM was applied in split applications. These findings suggest that MBM is an effective nitrogen source for sweet corn and a split application of MBM may reduce the potential for pollution.

1. Introduction

Utilizing locally-produced inputs to efficiently provide plant nutrition is important for sustainable agriculture systems, especially in an isolated island such as Hawai’i [1]. Applying organic waste by-products as fertilizer also serves as a strategy to safely recycle nutrients that would otherwise need to be disposed of [2,3]. Meat and bone meal (MBM), or tankage, is the solid by-product of animal rendering. The combined annual production of MBM in U.S. and Canada was 2.5 million metric tons in 2004 [4]. After the outbreak of bovine spongiform encephalopathy, or mad cow disease, MBM was banned from animal feed and alternative uses were emphasized. Non-feed uses of MBM include soil amendment, biofuel [5], and feed supplement for fish, poultry, and non-ruminant animals [6]. Meat and bone meal has been an attractive choice as an organic fertilizer because of its high (9–10%) nitrogen (N) content [7]. The nitrogen content of MBM is comparable to other animal-based fertilizers such as blood and feather meal with N content ranging from 6–12% [8]. The low carbon to nitrogen ratio, ranging from 4:1 to 5:1 indicates MBM has a relatively high N mineralization rate when compared with other organic amendments. When MBM is applied, crops also benefit from other macronutrients and micronutrients that enhance plant growth [9], increase microbial population and activity, and suppress plant pathogens [10]. Furthermore, MBM is allowed under the National Organic Program (NOP) and is locally available in many regions of the world. The use of MBM to fertilize organic crops can aid in agricultural intensification that helps meet increasing consumer demand for local and organically-grown produce [11]. Previous studies have reported MBM as an effective N source for wheat and rapeseed, cereals and oilseed rape [12,13], and comparable to mineral fertilizer on barley and oat [14]. However, few studies have investigated the effect of application timing of MBM within a cropping season.
Applying nutrients needed for crop growth while minimizing nutrient losses to the environment is an essential part of sustainable nutrient management [15]. However, synchronizing N supply with crop-N uptake is challenging when organic fertilizers are used. Nitrogen in organic materials must first be mineralized to inorganic form, mainly NO3, by soil bacteria. Mineralization is a complex process that depends on factors such as feedstock, temperature, moisture levels, soil type, and pH [16]. Many organic amendments have low N content resulting in slow mineralization of nitrogen and tying up of nitrogen initially by the mineralizing microbes. However, this is not the case with materials such as BMB and feather meal, that mineralize faster due to their high N content. In-season N application from feather meal was shown to increase sweet corn yield [17]. For MBM mineralization, Ahmad et al. [18] found the N release to be 20% in the first 14 days and up to 75% within 90 days, in a leachate column with two Hawai’ian soils. Similarly, Chaves et al. [19] reported 18% to 37% of the N was released in the first 14 days after soil application in Spain.
The C:N ratio is a good predictor of N mineralization and leaching risk [20]. Split application of high N fertilizer is encouraged to improve synchronization of N availability with crop demands [21]. Totsi et al. [22] found split application of blood meal on wheat increased yield and reduced N runoff to the watershed. Meat and bone meal is a good candidate for split application in organic systems because of its rapid N mineralization potential [23]. However, reports of the effect of split application of MBM on crop growth and soil solution NO3-N concentrations have not been found.
Sweet corn (Zea mays L. var. saccharata Sturt.) is an agriculturally important crop worldwide and is planted year-round in the tropics [24]. Recommended fertilization rates for sweet corn range from 168–224 kg N ha−1 [25,26]. Specific objectives of this study were to examine the effect of MBM application rates (0, 112, 224, 336, 448 and 672 kg N ha−1) and application timing (preplant and split) on (1) sweet corn growth, yield, and quality, and (2) nitrate concentration within and below the root zone. The study was conducted in two locations with different soil types common in agriculture in Hawai’i.

2. Materials and Methods

2.1. Study Area

This experiment was conducted at two research stations of the University of Hawai’i: Waimānalo and Poamoho Agriculture Research Stations on the island of O’ahu. At Waimānalo (21°19′57″ N; 157°42′49″ W), the study was conducted from 6 June to 31 August 2015. The Waimānalo station is located at 23 m elevation with a 20-year mean annual temperature of 22 °C and annual rainfall of 1397 mm. The soil was a Waialua series (very fine, mixed, superactive, isohyperthermic Pachic Haplustolls). At Poamoho (21°32′38″ N; 158°05′17″ W), the study was conducted from 20 April to 12 July 2016. The time of the planting was different due to a delay in field preparation at Waimānalo. However, planting date was not a major problem since corn can be grown year-round in Hawai’i. The elevation at Poamoho station is 140 m with a 20-year mean annual temperature of 22 °C and annual rainfall of 889 mm. The soil was a Wahiawa soil series (very fine, kaolinitic, isohyperthermic Rhodic Haplustox). Daily total rainfall and daily average air temperatures were collected from weather stations at each of the sites.

2.2. Experimental Design

The two experiments were arranged in a split-plot randomized complete block design. Main plot treatments of application timing included preplant (applied 100% before planting) and split (applied 50% before planting and 50% one month after planting). Nitrogen (N) application rates of 0, 112, 224, 336, 448, and 672 kg ha−1 were randomly distributed in experimental units 3 × 3 m (9 m2) in size. The experimental design differed slightly between location. Poamoho had 6 application rates and 2 timings and fully replicated 4 times with main plot size 3 × 18 m (54 m2) with a total of 48 subplots. At Poamoho, the additional N rate of 672 kg ha−1 was included to reach a yield plateau that was not fully defined at Waimānalo. Waimānalo was the experimental site of the first year and had 5 N application rates (0, 112, 224, 336 and 448 kg ha−1) and 2 application timings. The 0 and 112 kg N ha−1 rate treatments were replicated only twice due to limited space, and rates of 224, 336 and 448 kg ha−1 were replicated 4 times. Main plot size was 3 × 15 m (45 m2) with a total of 32 subplots.

2.3. Fertilizer Application Rate and Timing

Meat and bone meal (MBM) was obtained from Baker Commodities Inc. (Kapolei Industrial Park, HI), contained an average of 9.7% N, 3.27% P, and 0.84% K [18]. Initial soil (Table 1) and MBM samples (Table 2) for each location were submitted to the Agricultural Diagnostic Service Center (ADSC) at the University of Hawai’i at Manoa for nutrient analysis.
Field sites were tilled and treatments of MBM were incorporated manually to a depth of 10 cm one week before planting. Preplant fertilization occurred 100%, right before planting and split application of fertilizer occurred 50% preplant followed by applying the remaining 50% one month later. Sweet corn ‘UH Supersweet #10′ was direct-seeded along drip irrigation lines with 19 cm between plants and 75 cm between rows, approximately 62,500 plants ha−1. Corn seeds were sown using a handheld jabber planter on 6 June 2015 and 20 April 2016 for Waimānalo and Poamoho, respectively. The two seeds per hole were thinned to one plant per hole one week after germination. Corn was harvested manually on 31 August 2015 and 12 July 2016 for Waimānalo and Poamoho, respectively. Pests and weeds were controlled at each site as needed. At Poamoho, lime (Microna Agricultural Lime, Crop Protection Services, Kunia, HI, USA) was applied at a rate of 1 Mg ha−1 to adjust pH from 5.4 to 6.4 according to the liming curve for this soil type [27]. For the split application, MBM fertilizer was applied on the soil surface 7 cm from corn plants and incorporated manually in the top 5–10 cm depth without damaging the roots.

2.4. Suction Cup Lysimeter Installation and Soil Solution Collection

Two suction cup lysimeters (Soil Moisture Corp, Santa Barbara, CA, USA) were installed between the center rows of each plot for weekly collection of soil pore water during the study period. Holes were drilled at two depths, with 60 cm between the two lysimeters, using an auger: within the root zone (30 cm) and below the root zone (60 cm). Hydrologic contact between the soil and lysimeter was achieved by making a slurry (1:2 soil:water) to fill the space between the bottom of the hole and the ceramic cup at the base of the lysimeter. A manual vacuum pump was used to create a pressure of 80 kPa and the neoprene tubing was clamped to maintain suction. Suction cup lysimeters were emptied weekly and a 50 mL sample from each was saved for analysis. After each collection, the lysimeters were rinsed with deionized water, emptied, a vacuum was created (80 kPa) and the tubing again clamped.

2.5. Soil Solution Analyses

The soil solution samples were collected weekly from lysimeters for 8 consecutive weeks during the study period. After collection, samples were cooled for transport, stored at 4 °C to prevent N transformation before analysis, and then analyzed within 36 h of sample collection [28]. Vernier ion-selective electrodes (Vernier Software, Beaverton, OR, USA) were used to measure nitrate (NO3-N) and ammonium (NH4-N) ions. Electrodes were soaked for at least 30 min before each use and calibrated to high (100 mg L−1) and low (1 mg L−1) standard solutions. Samples were brought up to ambient temperature (25 °C) before analyses. Data from the electrodes were collected using LabQuest® interface (Vernier Software, Beaverton, OR, USA) used as a standalone device. All sensors were rinsed with deionized water between samples and blotted dry before reading the next sample.

2.6. Plant Growth, Yield, and Quality Measurements

Plant growth, yield, and quality parameters were collected from the two center rows of the four rows of corn per plot. Relative leaf chlorophyll content was measured weekly for 8 consecutive weeks during the study periods using a Minolta-502 SPAD meter (Spectrum Technologies, Plainfield, IL, USA). One reading was taken from the top collared leaf of each of 3 plants per plot, and the average was recorded. This corresponded with the time for growers to make decisions about side dress fertilization [29]. Leaf chlorophyll content measurements were converted to an N sufficiency index (S.I.) to express in relative terms to evaluate sufficiency of leaf N in corn as compared to a well-fertilized reference using the Equation (1) [30]:
Nitrogen   S . I .   %   = average   reading average   reference × 100 %
In both locations, S.I. was calculated by dividing average readings from each plot by the average reference using averages of plots with the N rate of 448 kg ha−1. The S.I. corresponding N status was then interpreted according to the guidelines of Varvel et al. [31]. Plant growth data included post-harvest measurements of leaf area and fresh and dry weights of shoot and root biomass. Leaf area and below-ground root biomass were taken from a sub-sample of 3 randomly selected plants per plot. A drain spade shovel (15 × 40 cm) was used to collect the roots of 3 randomly selected plants per plot and soil was removed with a water spray. Above-ground shoot biomass was taken from a sub-sample of 5 randomly selected plants cut 10 cm above ground level. Shoot and root biomass fresh weights were recorded, then oven-dried at 70 °C for 72 h, and dry weights recorded. Yield data included total fresh weight (husk on, untrimmed) of marketable ears per plot, corn ear fresh weights and dry weights, and soluble solids content (SSC). Ear fresh weights were recorded from a sub-sample of 3 representative ears per plot then dried at 70 °C for 72 h and dry weights recorded. An additional sub-sample of 3 ears per plot was selected to estimate kernel SSC. Kernels were cut from a 5 cm cross-section in the center of the cob and the composite sample was squeezed with a garlic press onto a digital refractometer (Model 96811, Hanna Instruments, Woonsocket, RI, USA).

2.7. Statistical Analysis

Data analysis was performed with split-plot analysis of variance (ANOVA) using SAS Version 9.4 (SAS Institute Inc., Cary, NC, USA, 2013). Soil water NO3-N and leaf chlorophyll measurements were subjected to repeated measure analysis using PROC MIXED procedure. All variables were checked for normality using PROC UNIVARIATE and transformed accordingly if needed. Only true means were presented. When treatment effects were significant, means were separated by Waller–Duncan k-ratio (k = 100) t-test. Statistical significance (α) was set a priori at 5% (0.05). Regression analysis between rates of MBM application and corn growth, yield, and soil water NO3-N parameters were conducted using JMP® Version 13.1 (SAS Institute, Inc., Cary, NC, USA, 2013).

3. Results

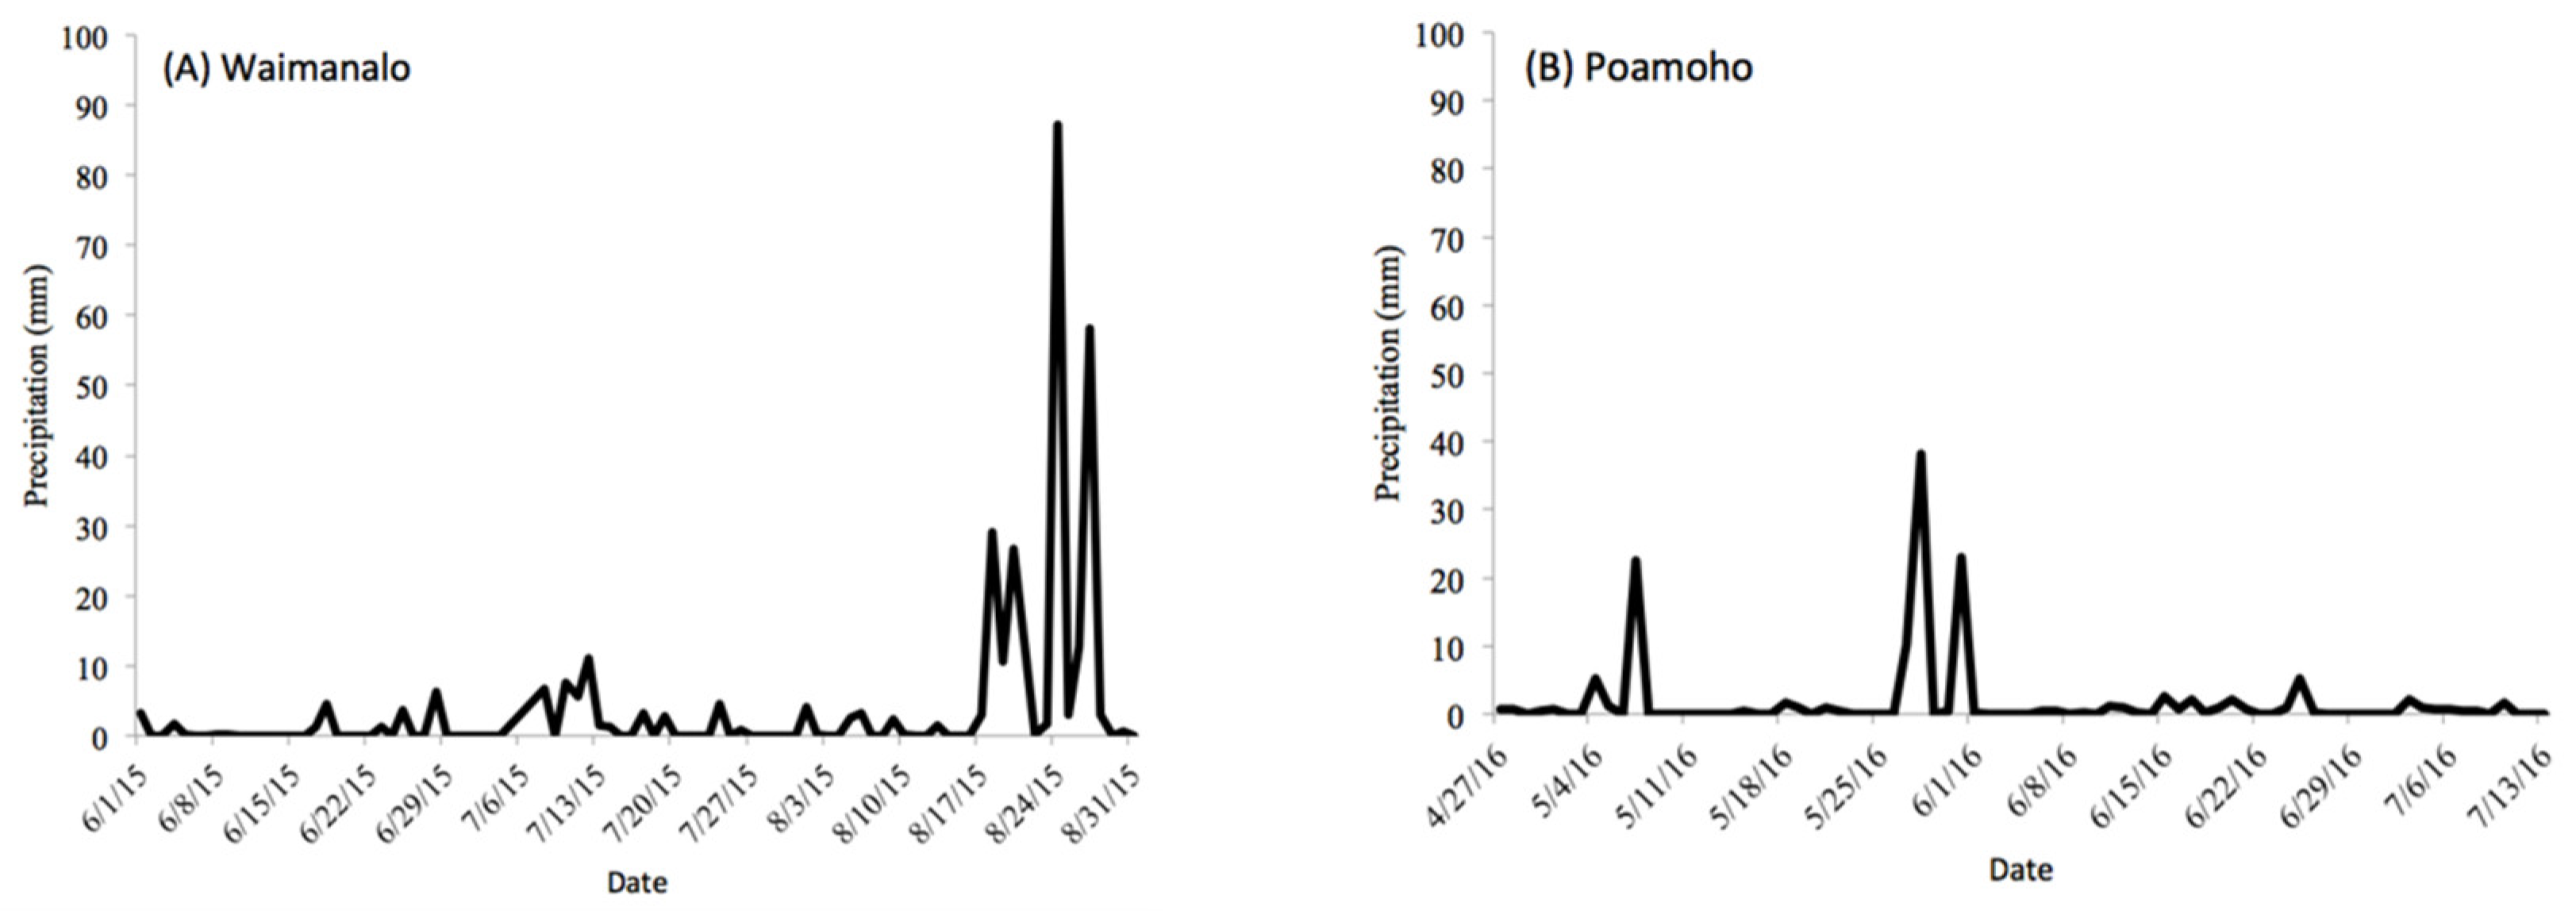
3.1. Air Temperature and Precipitation

The mean precipitation during the study period at Waimānalo was 3.7 mm d−1, ranging from 0 to 87 mm d−1 with several heavy rainfall events related to a tropical storm occurring during the last 14 days of the study (Figure 1A). This was six times the amount of rainfall as compared to multiyear averages. The temperature ranged from 21 °C to 28 °C with a mean temperature of 25.9 °C during the study period at Waimānalo; this is 0.87 °C warmer than the multiyear average temperature during these months. Poamoho received less precipitation than Waimānalo with a mean of 2 mm d−1 and a range of 0 to 38 mm d−1 during the study period (Figure 1B). At Poamoho, the mean daily temperature ranged from 21 °C to 26 °C and the mean temperature was 24 °C during the study period. The temperature at Poamoho was generally similar to multiyear averages and precipitation was about double the multiyear average due to two heavy rainfall events at the end of May 2016.

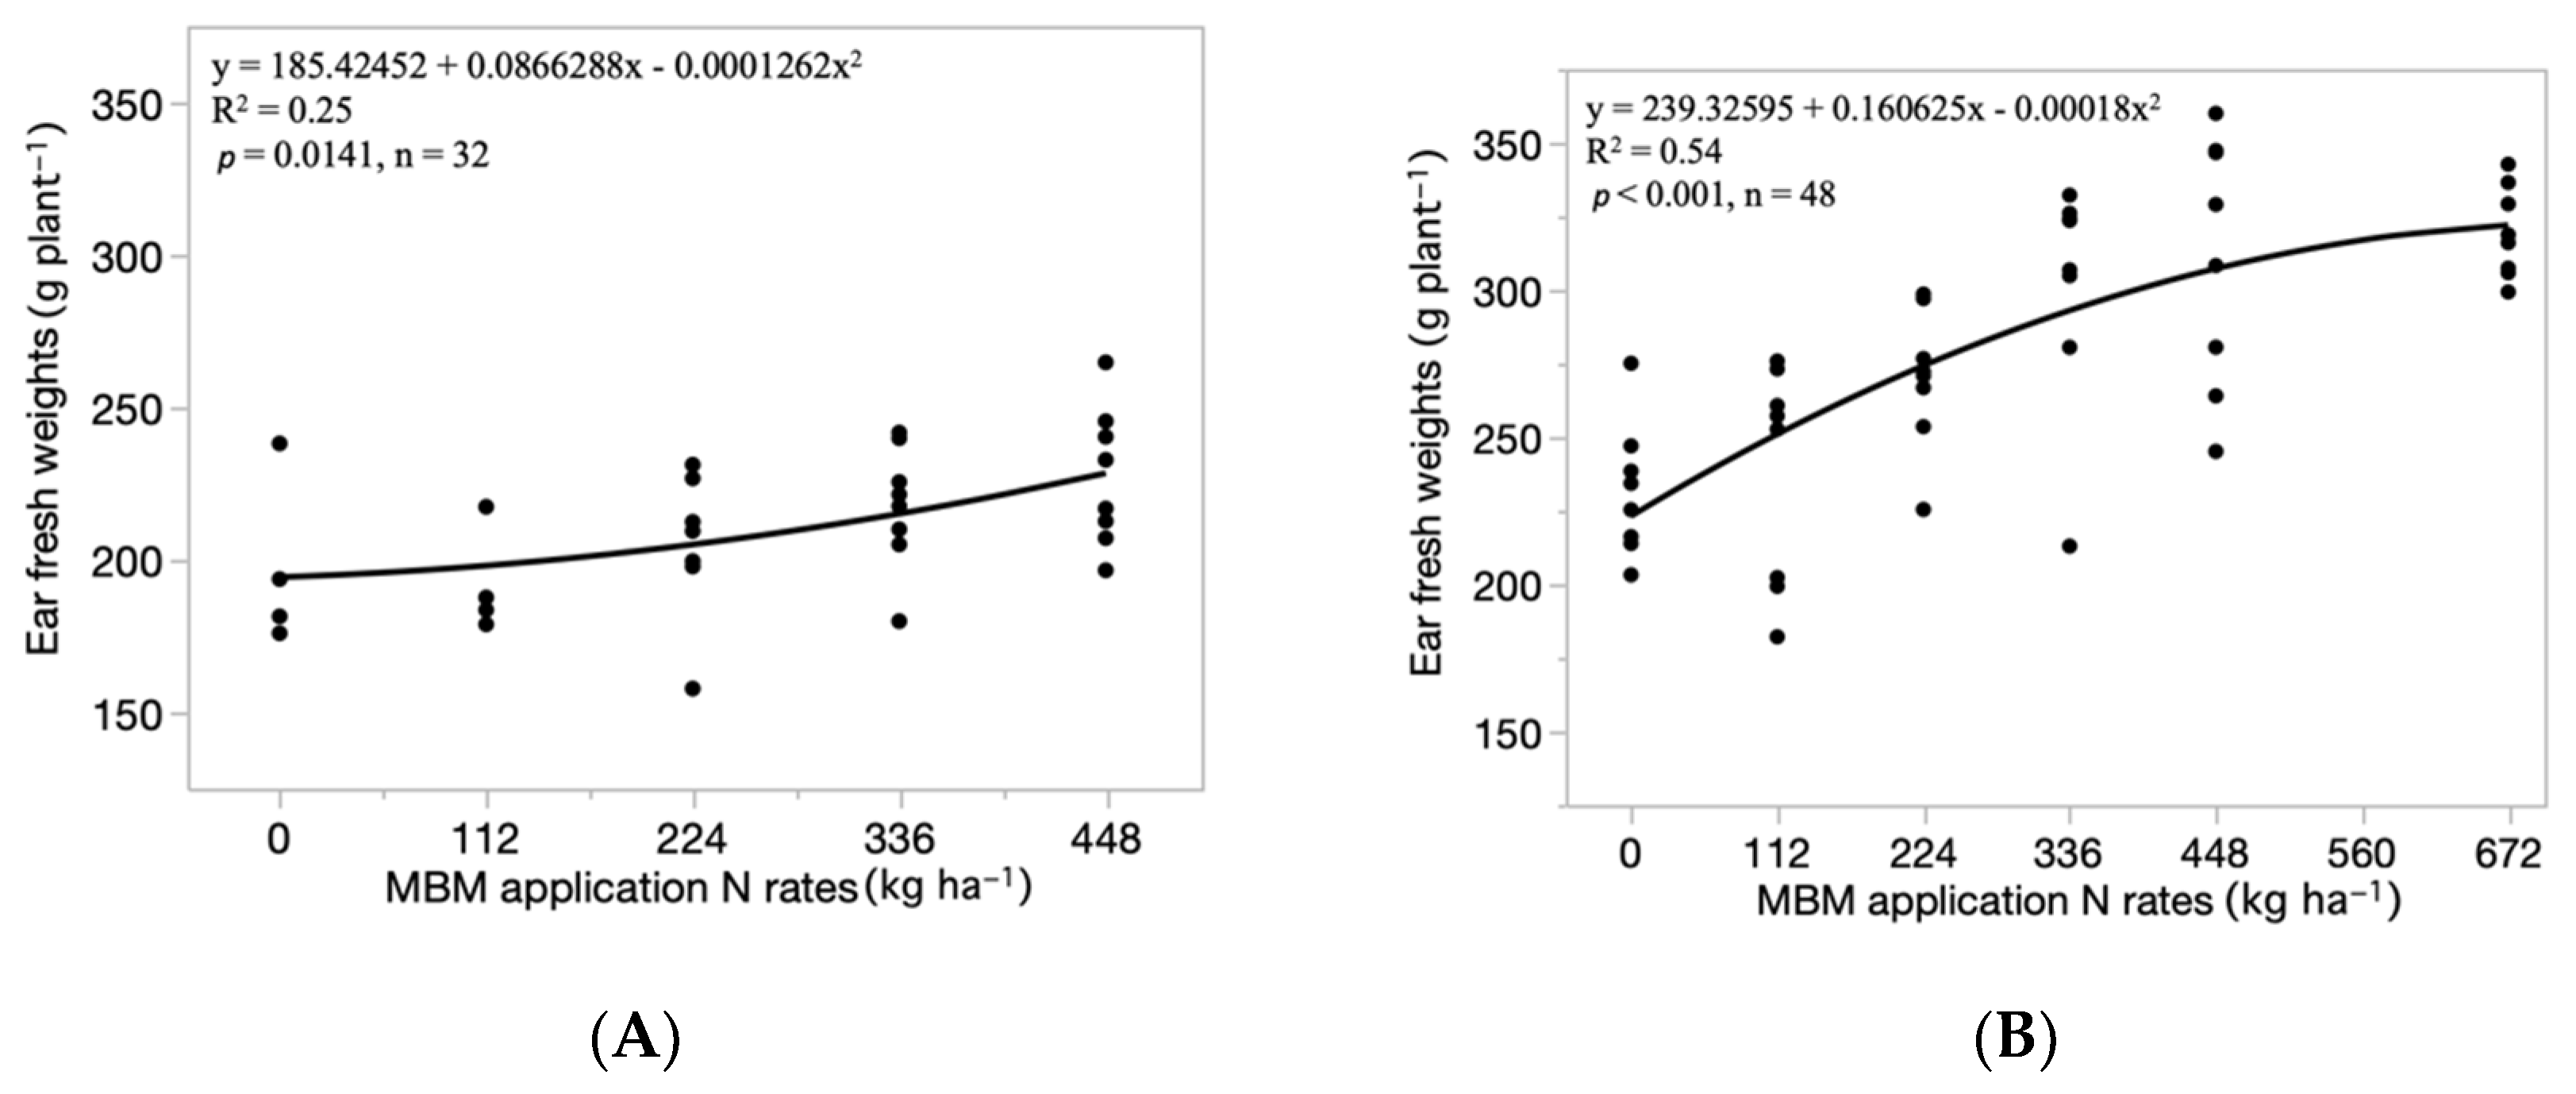
3.2. Growth, Yield, and Quality

At Waimānalo, MBM rates had a highly significant effect (p ≤ 0.01) on sweet corn yield, shoot dry weights, root dry weights, and leaf area (Table 3). Shoot and root biomass increased with increasing MBM rate. Although the highest yield of marketable sweet corn (213 g plant−1) was achieved with the application rates of 448 kg N ha−1, yields from the MBM rates of 224 to 448 kg N ha−1 were not significantly different from each other. Corn ear fresh weights regressed with MBM rate quadratically (p = 0.0141, R2 = 0.25; Figure 2A). Shoot dry weights, root dry weights, and leaf area regressed with MBM similarly. Application timing had no effect on any of the parameters measured. Kernel quality based on SCC averaged 13.3% (±1.15) and was not different among the treatments.
At Poamoho, MBM rates had a highly significant effect on sweet corn yield, ear fresh and dry weights, root dry weights, leaf area (p ≤ 0.01), and shoot dry weights (p ≤ 0.05; Table 3). The highest sweet corn yield (288 g plant−1) was achieved with the highest MBM application rate (672 kg N ha−1) and was significantly different from the yield from the unfertilized and 112 kg N ha−1 rate. Unlike Waimānalo, application timing of MBM had a significant effect (p ≤ 0.05) on yield, where corn yield declined from 255 to 220 g plant−1 for preplant compared to split application. Corn ear fresh weights regressed with MBM rates quadratically (p < 0.001, R2 = 0.54; Figure 2B). Kernel quality based on SCC averaged 12.7% (±1.16) and did not differ among the treatments.

3.3. Relative Chlorophyll Content

At both study locations, relative leaf chlorophyll content was different among MBM application rates by week (p ≤ 0.01), with no difference between application timing. At Poamoho, a significant interaction of week × rate × timing (p ≤ 0.01) was observed. The SPAD readings ranged from 25.3–65.3 over the growing season (data not shown). At Waimānalo, the mean Sufficiency Index (S.I.) over 7 weeks of SPAD readings showed fertilization rates of 336 and 448 kg N ha−1 which were considered sufficient as they were above 95% when compared to the 448 kg N ha−1 reference plots. Conversely, the MBM rates of 224 and 112 kg N ha−1, and unfertilized plots’ S.I. levels were at 93, 89, and 85% of S.I., respectively. When S.I. is below 95%, it is recommended to apply N to achieve maximum agronomic yields. At Poamoho over 8 weeks, the rate of 336 kg N ha−1 was considered sufficient at 96% while rates of 224 and 112 kg N ha−1, and unfertilized plots indicated a S.I. of 89, 84, and 79%, respectively, when compared to the 448 kg N ha−1 reference plots.

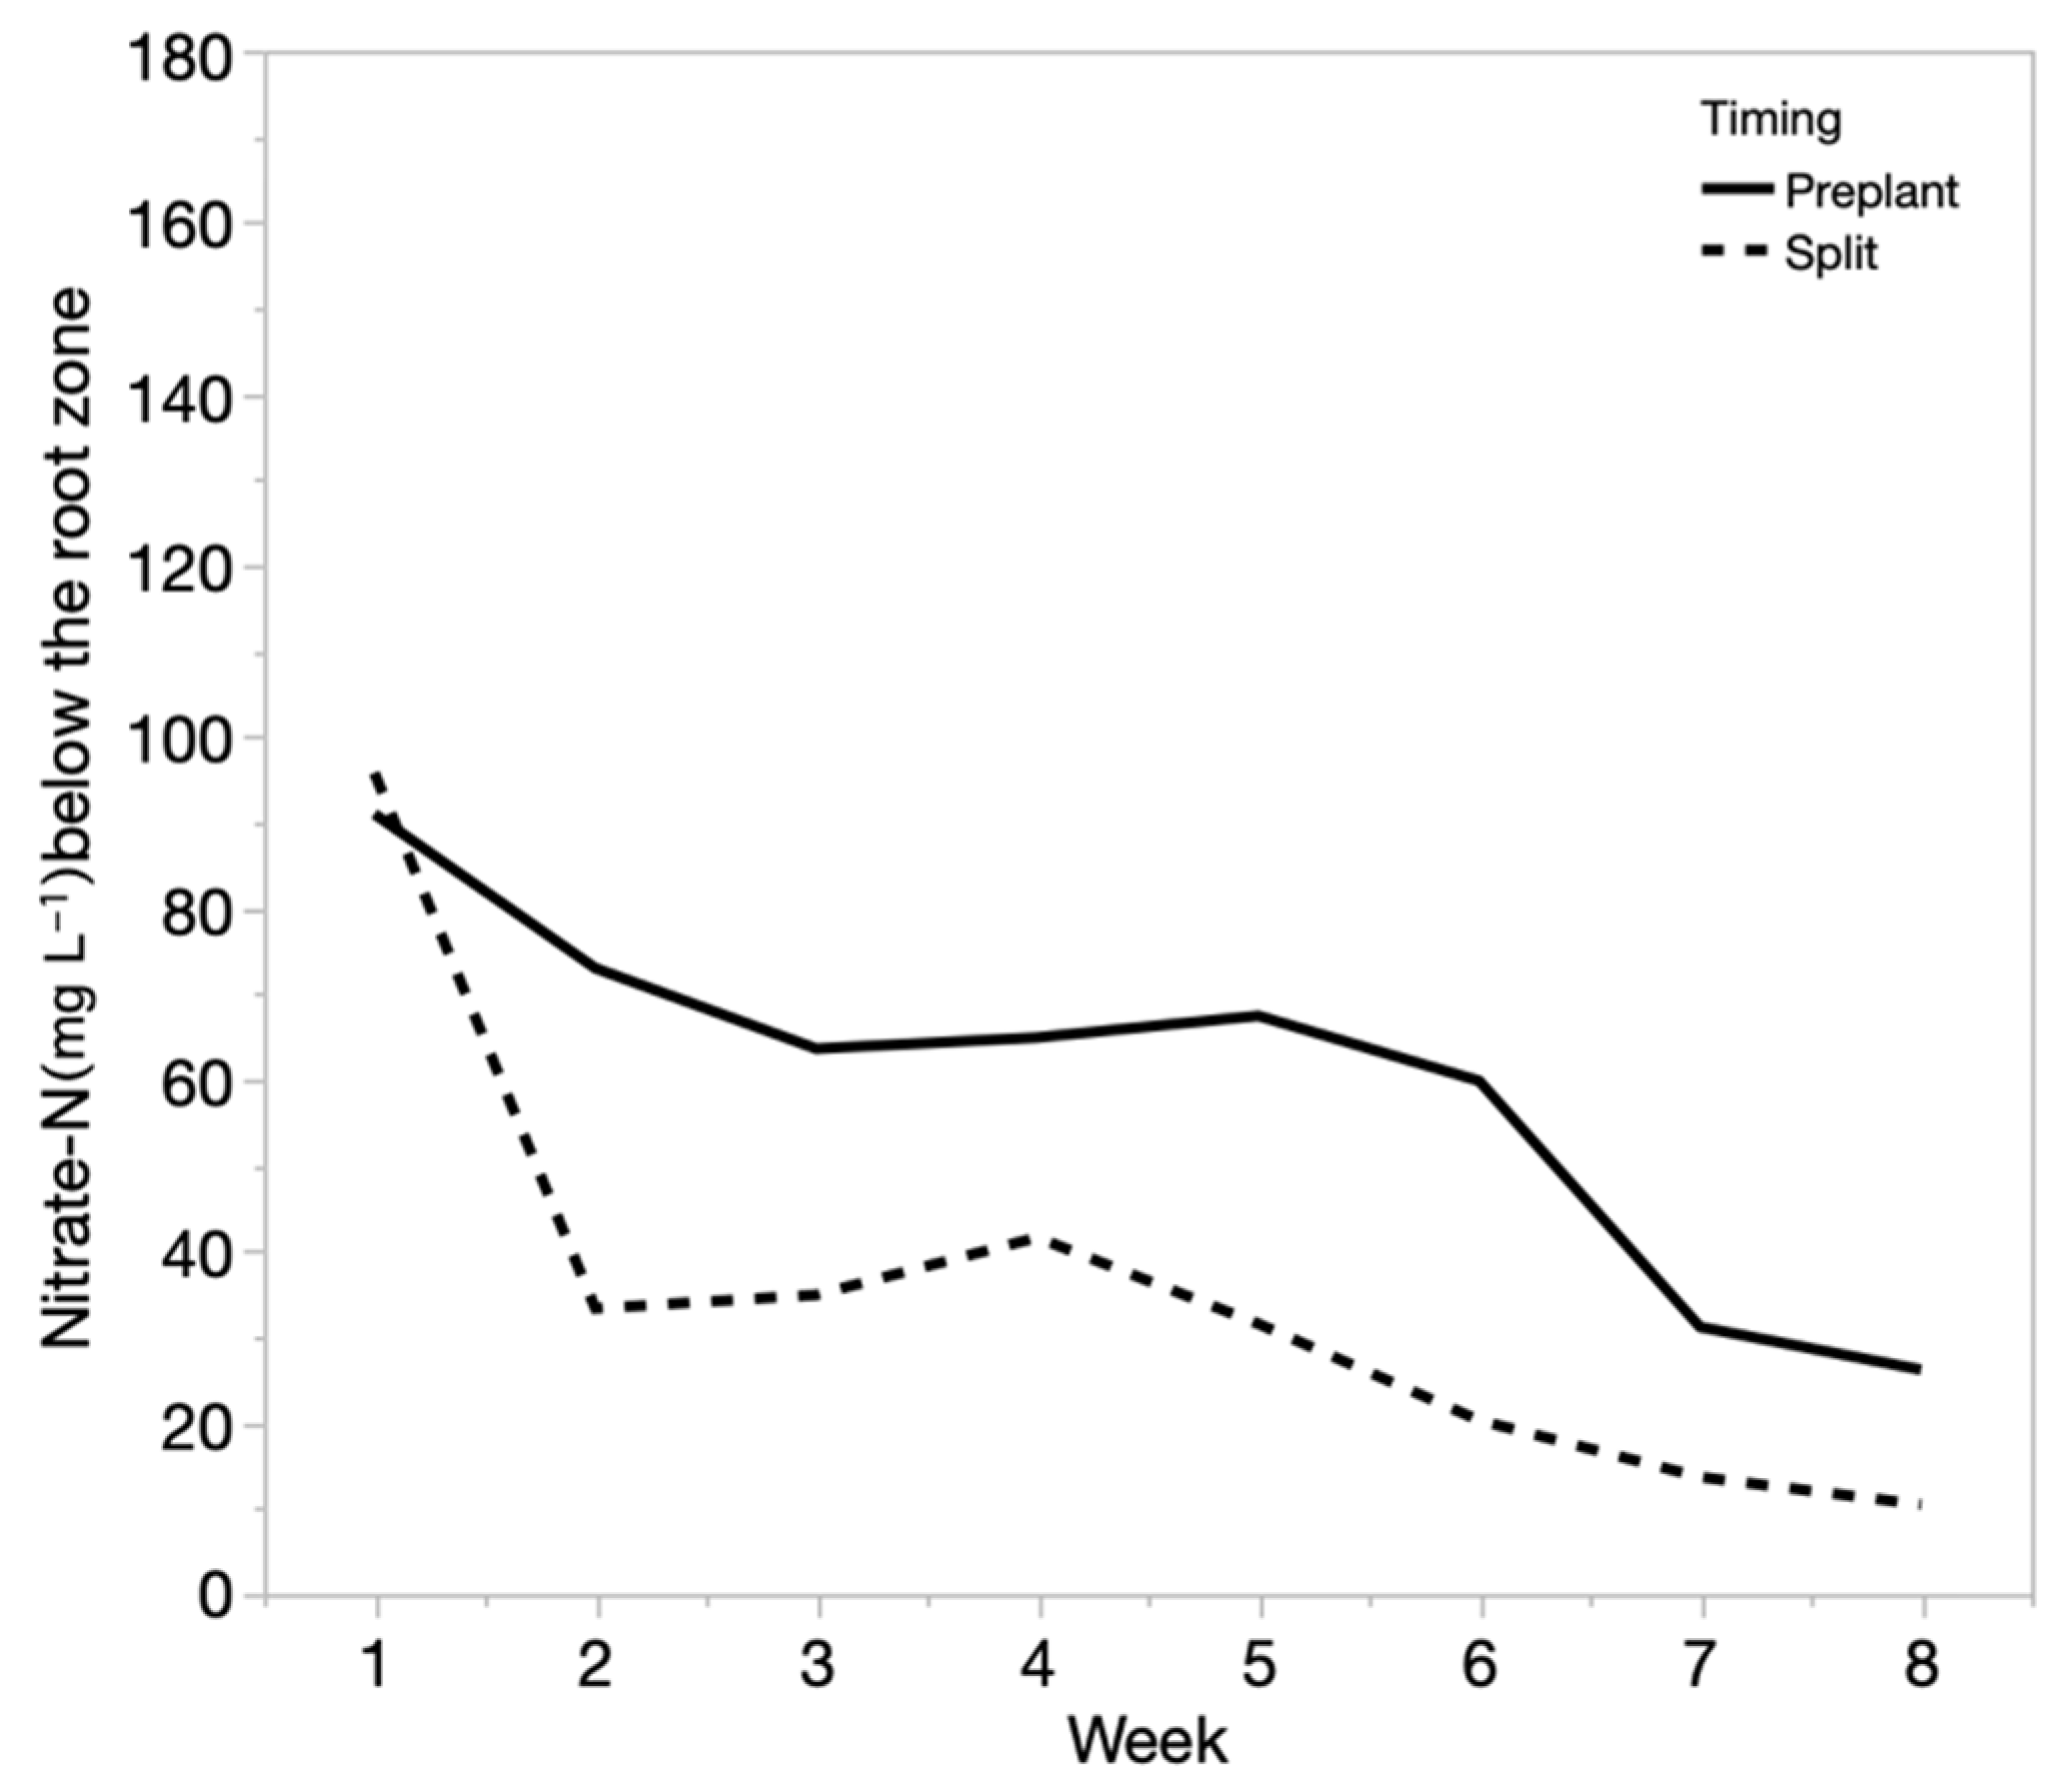
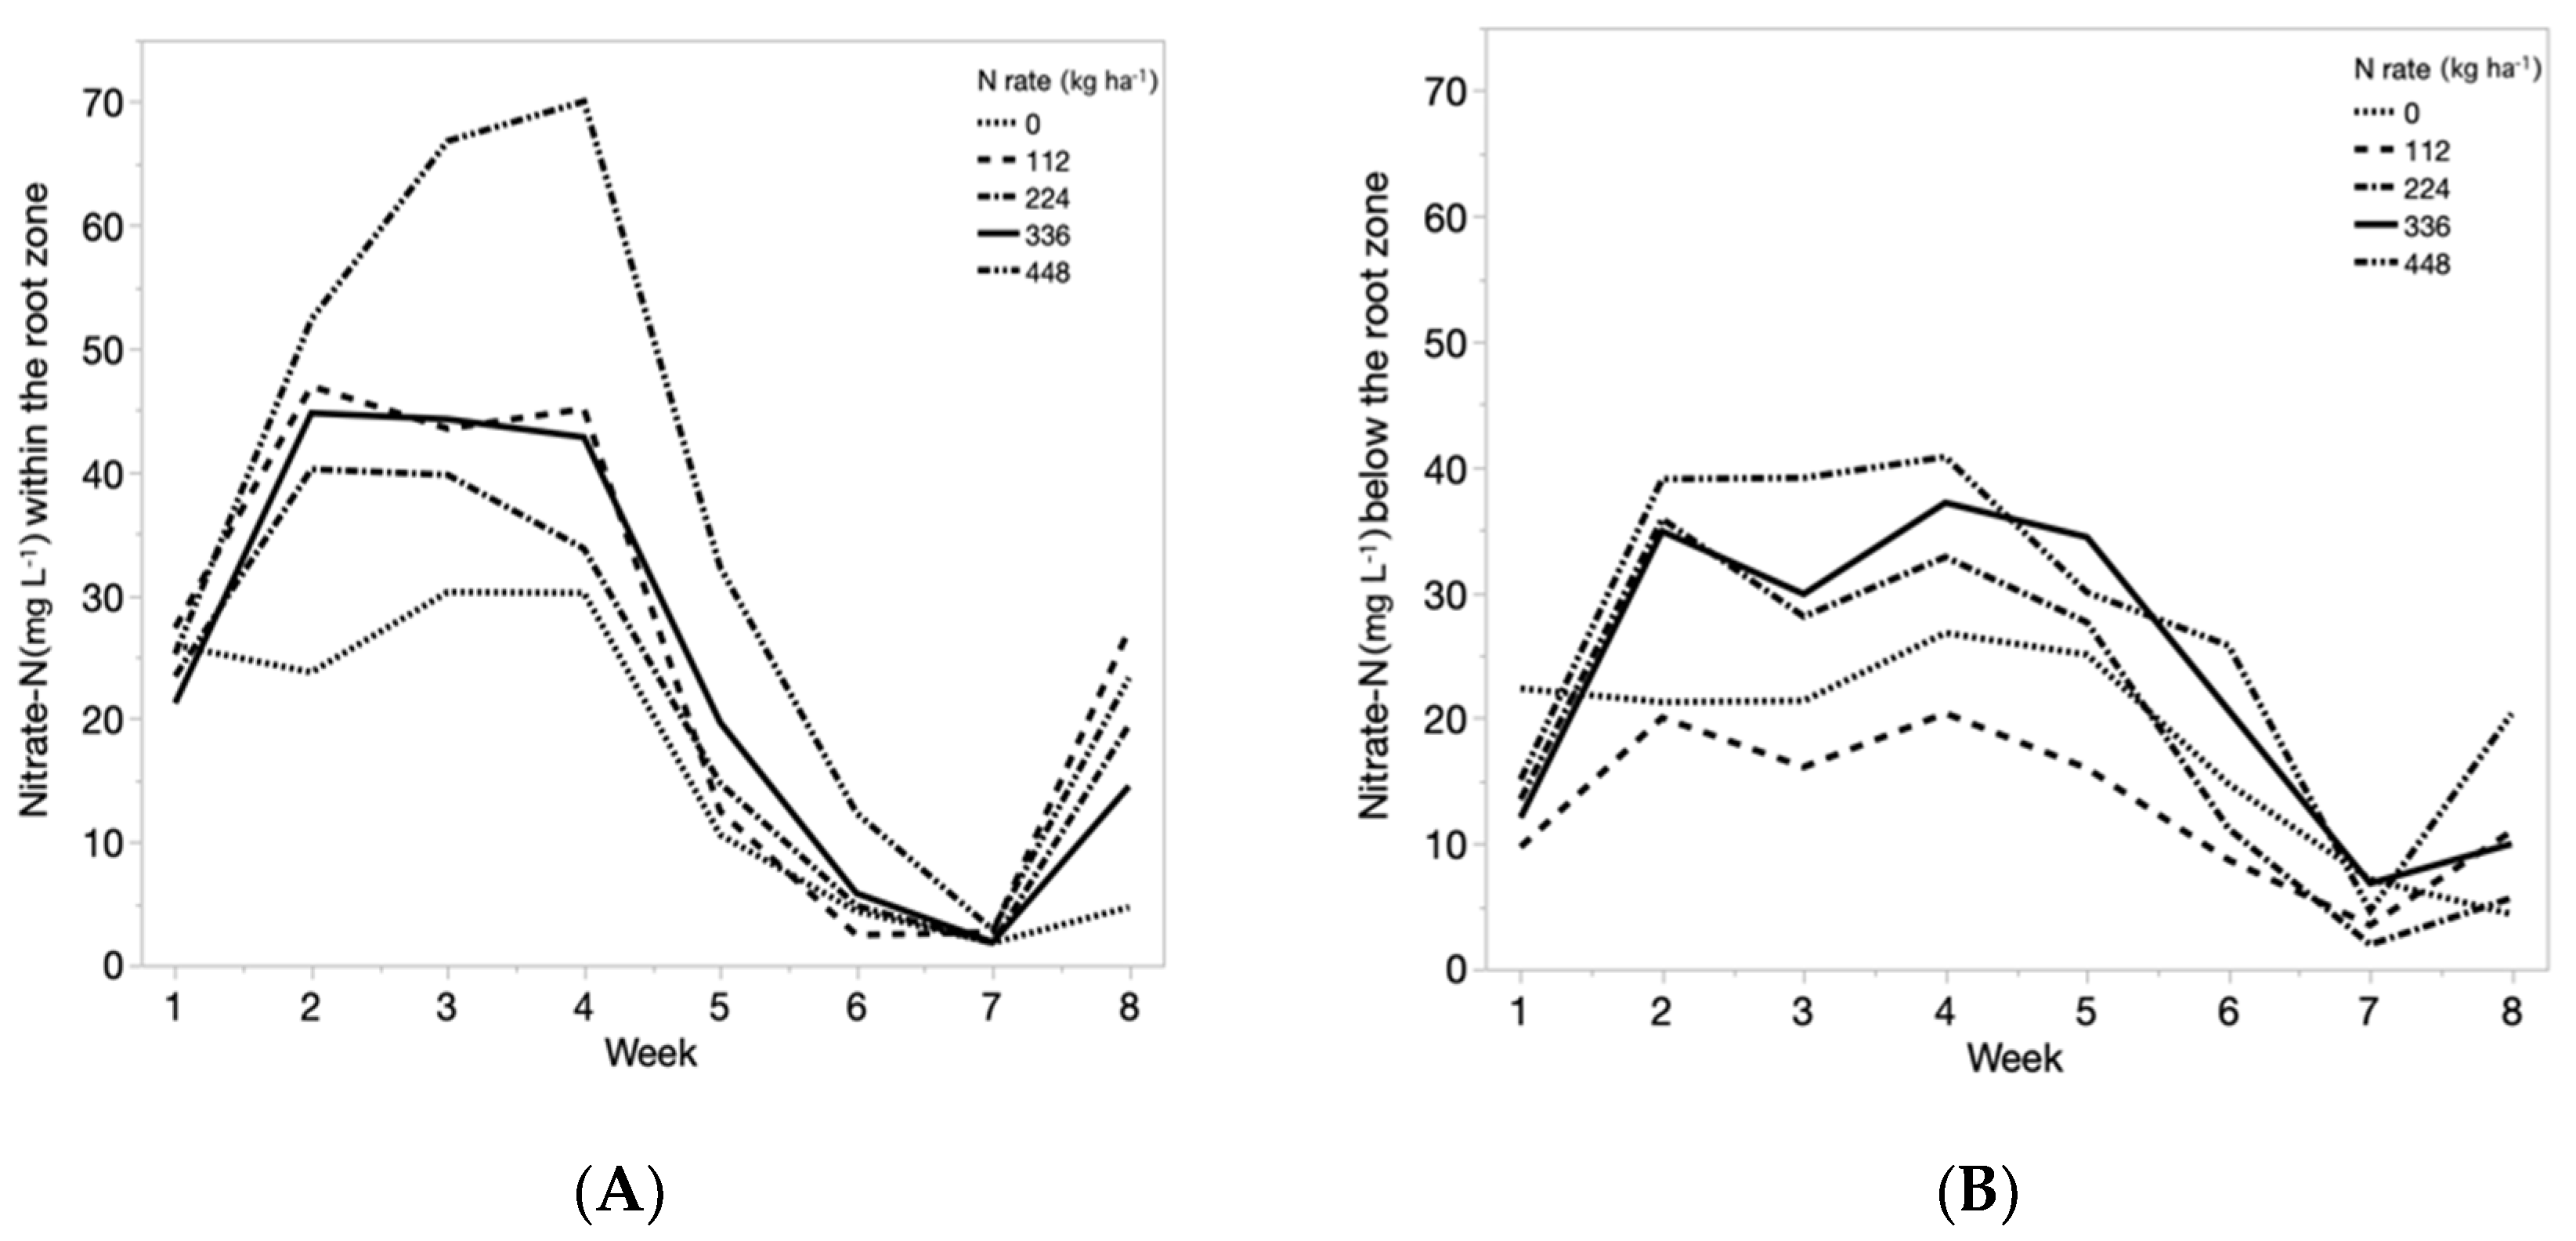
3.4. Nitrate Concentrations

At Waimānalo, soil water NO3-N content within the root zone was significantly different by weeks. Significant interactions of rate × timing and week × rate × timing were observed (p ≤ 0.05). During the study period, most of the NO3-N availability followed the application rate trend from high to low MBM application rate treatments. Nitrate-N concentrations within the root zone (30 cm depth) were highest during weeks 2 to 4 (Figure 3A). Split application of MBM reduced NO3-N load within the root zone during the first 1–4 weeks after application compared to preplant application. The effect of a high rainfall event in week 8 resulted in increased N availability, where the MBM fertilized plots were different from the control treatment. For NO3-N below the root zone at Waimānalo, significant effects of rates and week, as well as the interactions between rate × timing and week × rate × timing were observed (p ≤ 0.05). Nitrate-N concentrations below the root zone (60 cm depth) were highest in weeks 2 to 5 and levels dropped towards the end of the study (Figure 3B). In weeks 6 and 7, mean values of NO3-N were significantly higher in treatments of preplant application timing and application rates of 336 and 448 kg N ha−1 as compared to the control, 112, and 224 kg N ha−1 plots. Overall, split application of MBM reduced potential NO3-N losses by 20% at Waimānalo.
At Poamoho, soil water NO3-N concentrations within the root zone were affected by MBM application timing (p ≤ 0.05) and week (p ≤ 0.01), and significant interaction between rate × timing (p ≤ 0.01) was also observed. In general, NO3-N levels were higher at Poamoho than at Waimānalo and were highest in the first 5 weeks of the study. The trend of NO3-N availability followed the application rates of MBM from high to low. In week 4, NO3-N levels within the root zone were significantly higher in preplant as compared to MBM applied in split. Similarly, NO3-N levels below the root zone were significantly higher in preplant as compared to split application. The effect varied by week where NO3-N levels below the root zone were different when MBM was applied in split as compared to preplant in weeks 2, 3, 5, and 6. Nitrate-N losses were reduced by 40% at Poamoho when MBM was applied in split applications (Figure 4).

4. Discussion

This study evaluated the response of MBM application rates (0, 112, 224, 336, 448, and 672 kg N ha−1) and fertilization timing (preplant, split) on sweet corn growth, yield, and quality, and soil water NO3-N concentrations within and below the root zone in two locations in O’ahu, Hawai’i. Overall, yield was comparable to other tropical sweet corn hybrids [24]. At Waimānalo, yields from rate of 224 kg N ha−1 were not different from N rates of 336 or 448 kg ha−1, suggesting that 224 kg N ha−1 was sufficient to meet crop uptake needs. Measurements of leaf chlorophyll content at both locations revealed that the corn plants subjected to rates of 224 kg N ha−1 and below did not reach their full yield potential as compared to the well-fertilized rates. This validated the previous work on MBM mineralization that showed ~75% of N was released within 90 days [18,19] where 75% of the amount of N applied from MBM will be mineralized and available for plant uptake. Application rates lower than 224 kg N ha−1 did not supply the sweet corn with sufficient N for optimum growth and yield. Plant growth may have been limited at lower fertilization rates due to low concentrations of NO3-N observed in the root zone during periods of peak plant growth.
In concurrence with Chen [14], we found increased yield with increasing rate of MBM. However, others have reported yield increases with increasing rate of MBM, but no further yield increase beyond MBM rates of 117 kg N ha−1 on cereal crops in Poland [13] and 120 kg N ha−1 with jicama in Hawai’i [32]. Maresma et al. [33] reported yield increase when more than 240 kg N ha−1 was applied to maize grown with various organic and synthetic fertilizers. High rates of fertilization have been used in sweet corn crops to achieve high yield and corn, as in many types of grass, they have been known to be able to consume large amounts of nitrogen [34].
Lazicki et al. [35] reported that organic fertilizers with high N and low C have rapid mineralization rate and were good candidates to side dress N. In our attempt to use MBM for side dress N, we found split application reduced the potential for NO3-N leaching while it did not have much of an effect on yield. At Waimānalo, the N rates of 224 kg ha−1 preplant and 336 kg ha−1 split provided the target range of NO3-N (20 to 30 mg L−1) to the rhizosphere of the corn plants during the growing season, although higher rates of N have been known to increase corn yield closer to maximum yield. At both locations, N rate of 448 kg ha−1 and above provided beyond the SPAD sufficiency range for NO3-N in the root zone subsequently had considerable leaching as evidenced by the high NO3-N concentrations below the root zone. Considering costs and environmental impacts of MBM, we suggest that the application rate of 224 kg N ha−1 is sufficient at preplant, while higher rates of 336 kg N ha−1, when applied in split, can provide fertility for increased yields without increasing the leaching risks to the environment. Recent research has shown that addition of biochar can reduce N leaching [36]. Neem and karanga were also found to be natural nitrogen inhibitors that can modify the mineralization rate of MBM [37]. Further research of these additives to MBM could allow all fertilizer application at preplant and reduce the labor needed to apply the second dose as a split while protecting the environment.
The increase in yield at Poamoho may be attributed to the climate of higher elevation including cooler temperatures and increased solar radiation, which may have allowed more time for grain fill, ~2 °C as compared to Waimānalo. The weather was warmer than the multiyear averages at Waimānalo and that may have promoted quicker physiological development that resulted in a shorter period of grain fill. Similar to the results of Ahmad et al. [38], we found that soil water NO3-N concentrations were higher in Poamoho than in Waimānalo for depths of 30 and 60 cm. The increased leaching at Poamoho could be due to the differences in soil physical and mineral properties between the two locations [39]. Nitrate-nitrogen losses were reduced by 20% at Waimānalo and 40% at Poamoho when MBM was applied in split applications compared to a single preplant application.
Although N is often the most limiting nutrient in farming systems, other essential nutrients also need to be available in adequate quantities to realize crop yield potential. Meat and bone meal contains very little K+ (<1%) and farming systems may benefit from supplemental fertilization with invasive algae to provide K+ and replace imported inputs further [40]. Liquid fertilization using MBM is another promising alternative to reduce the labor inputs associated with incorporation of side dress fertilizer [18]. In-season nutrient monitoring is very important in organic production systems where N release can be variable as affected by soil temperature, moisture, and microbial activity [41].
In conclusion, this research contributes to the development of crop-specific best management practices to predict the rate and timing of MBM application as an organic fertilizer. These findings suggest that MBM was an effective source of N for sweet corn production in the tropics and a split application of MBM may reduce potential groundwater pollution.

Author Contributions

Conceptualization, A.A.A., T.S. and T.J.K.R.; methodology, A.A.A.; validation, A.A.A., T.S. and T.J.K.R.; formal analysis, K.-H.W., T.S. and A.A.A.; investigation, T.S.; resources, T.J.K.R.; writing—original draft preparation, T.S.; writing—review and editing, A.A.A. and T.J.K.R.; supervision, T.J.K.R.; project administration, T.J.K.R.; funding acquisition, T.J.K.R. and A.A.A. All authors have read and agreed to the published version of the manuscript.

Funding

Funding for this project was provided by the Hawai’i Department of Agriculture. Additional support was provided by USDA Sustainable Agriculture Research and Education (SARE) program project SW11-055 and University of Hawai’i at Manoa College of Tropical Agriculture and Human Resources Hatch projects HAW0833-H and HAW09048-H.

Institutional Review Board Statement

Not applicable.

Informed Consent Statement

Not applicable.

Data Availability Statement

Publicly available datasets were analyzed in this study. These data can be found here: https://data.mendeley.com/datasets/v55hvt6jft/2. Accessed on 15 June 2021.

Acknowledgments

We thank Kent Kobayashi and Michael Kantar for internal review of the manuscript.

Conflicts of Interest

The authors declare no conflict of interest. The funders had no role in the design of the study; in the collection, analyses, or interpretation of data; in the writing of the manuscript, or in the decision to publish the results.

References

  1. Radovich, T.J.K.; Pant, A.; Gurr, I.; Hue, N.V.; Sugano, J.; Sipes, B.; Arancon, N.; Tamaru, C.; Fox, B.K.; Kobayashi, K.D.; et al. Innovative Use of Locally Produced Inputs to Improve Plant Growth, Crop Quality, and Grower Profitability in Hawai’i. Horttechnology 2012, 22, 738–742. [Google Scholar] [CrossRef] [Green Version]
  2. Fetter, J.C.; Brown, R.N.; Gorres, J.H.; Lee, C.; Amador, J.A. Nitrate and Phosphate Leaching under Turfgrass Fertilized with a Squid-based Organic Fertilizer. Water Air Soil Pollut. 2012, 223, 1531–1541. [Google Scholar] [CrossRef]
  3. Long, R.J.; Brown, R.N.; Amador, J.A. Growing Food with Garbage: Effects of Six Waste Amendments on Soil and Vegetable Crops. HortScience 2017, 52, 896–904. [Google Scholar] [CrossRef] [Green Version]
  4. Garcia, R.A.; Rosentrater, K.A. Concentration of key elements in North American meat & bone meal. Biomass Bioenergy 2008, 32, 887–891. [Google Scholar] [CrossRef]
  5. Mondini, C.; Cayuela, M.L.; Sinicco, T.; Sanchez-Monedero, M.A.; Bertolone, E.; Bardi, L. Soil application of meat and bone meal. Short-term effects on mineralization dynamics and soil biochemical and microbiological properties. Soil Biol. Biochem. 2008, 40, 462–474. [Google Scholar] [CrossRef]
  6. Song, F.; Xu, D.D.; Mai, K.S.; Zhou, H.H.; Xu, W.; He, G. Comparative Study on the Cellular and Systemic Nutrient Sensing and Intermediary Metabolism after Partial Replacement of Fishmeal by Meat and Bone Meal in the Diet of Turbot (Scophthalmus maximus L.). PLoS ONE 2016, 11, e0165708. [Google Scholar] [CrossRef] [PubMed]
  7. Jeng, A.S.; Haraldsen, T.K.; Gronlund, A.; Pedersen, P.A. Meat and bone meal as nitrogen and phosphorus fertilizer to cereals and rye grass. Nutr. Cycl. Agroecosyst. 2006, 76, 183–191. [Google Scholar] [CrossRef]
  8. Gaskell, M. Nitrogen sources for organic vegetable crops. Horttechnology 2007, 17, 431–441. [Google Scholar] [CrossRef] [Green Version]
  9. Stepien, A.; Wojtkowiak, K. Effect of Meat and Bone Meal on the Content of Microelements in Soil, Wheat Grains and Oilseed Rape Seeds. J. Elem. 2015, 20, 999–1010. [Google Scholar] [CrossRef]
  10. Lazarovits, G. Management of soil-borne plant pathogens with organic soil amendments: A disease control strategy salvaged from the past. Can. J. Plant Pathol. 2001, 23, 1–7. [Google Scholar] [CrossRef]
  11. Meas, T.; Hu, W.Y.; Batte, M.T.; Woods, T.A.; Ernst, S. Substitutes or Complements? Consumer Preference for Local and Organic Food Attributes. Am. J. Agric. Econ. 2015, 97, 1044–1071. [Google Scholar] [CrossRef]
  12. Stępień, A.; Wojtkowiak, K. Variability of mineral nitrogen contents in soil as affected by meat and bone meal used as fertilizer. Chil. J. Agric. Res. 2015, 75, 105–110. [Google Scholar] [CrossRef]
  13. Nogalska, A.; Chen, L.; Sienkiewicz, S.; Nogalski, Z. Meat and bone meal as nitrogen and phosphorus supplier to cereals and oilseed rape. Agric. Food Sci. 2014, 23, 19–27. [Google Scholar] [CrossRef]
  14. Chen, L.; Kivela, J.; Helenius, J.; Kangas, A. Meat Bone Meal as Fertiliser for Barley and Oat. Agric. Food Sci. 2011, 20, 235–244. [Google Scholar] [CrossRef]
  15. Zhou, M.H.; Zhu, B.; Bruggemann, N.; Dannenmann, M.; Wang, Y.Q.; Butterbach-Bahl, K. Sustaining crop productivity while reducing environmental nitrogen losses in the subtropical wheat-maize cropping systems: A comprehensive case study of nitrogen cycling and balance. Agric. Ecosyst. Environ. 2016, 231, 1–14. [Google Scholar] [CrossRef]
  16. Hartz, T.K.; Johnstone, P.R. Nitrogen availability from high-nitrogen-containing organic fertilizers. Horttechnology 2006, 16, 39–42. [Google Scholar] [CrossRef] [Green Version]
  17. West, J.R.; Ruark, M.D.; Bussan, A.J.; Colquhoun, J.B.; Silva, E.M. Nitrogen and Weed Management for Organic Sweet Corn Production on Loamy Sand. Agron. J. 2016, 108, 758–769. [Google Scholar] [CrossRef]
  18. Ahmad, A.A.; Radovich, T.; Hue, N.V.; Uyeda, J.; Arakaki, A.; Cadby, J.; Paull, R.; Sugano, J.; Teves, G. Use of Organic Fertilizers to Enhance Soil Fertility, Plant Growth, and Yield in a Tropical Environment. In Organic Fertilizers: From Basic Concepts to Applied Outcomes; Larramendy, M.L., Soloneski, S., Eds.; InTech: Rijeka, Croatia, 2016; p. 382. [Google Scholar]
  19. Chaves, C.; Pomares, F.; Albiach, R.; Canet, R. Rates of Nitrogen Mineralization of Meat and Bone Meals in Mediterranean Soils. Commun. Soil Sci. Plant Anal. 2014, 45, 2258–2267. [Google Scholar] [CrossRef]
  20. Lazicki, P.; Geisseler, D.; Lloyd, M. Nitrogen mineralization from organic amendments is variable but predictable. J. Environ. Qual. 2020, 49, 483–495. [Google Scholar] [CrossRef]
  21. Montemurro, F.; Diacono, M. Towards a Better Understanding of Agronomic Efficiency of Nitrogen: Assessment and Improvement Strategies. Agronomy 2016, 6, 31. [Google Scholar] [CrossRef]
  22. Tosti, G.; Farneselli, M.; Benincasa, P.; Guiducci, M. Nitrogen Fertilization Strategies for Organic Wheat Production: Crop Yield and Nitrate Leaching. Agron. J. 2016, 108, 770–781. [Google Scholar] [CrossRef] [Green Version]
  23. Bustamante, S.C.; Hartz, T.K. Nitrogen Management in Organic Processing Tomato Production: Nitrogen Sufficiency Prediction Through Early-season Soil and Plant Monitoring. HortScience 2015, 50, 1055–1063. [Google Scholar] [CrossRef] [Green Version]
  24. Brewbaker, J.L. Six Tropical Supersweet Corn Inbreds. HortScience 2010, 45, 1388–1391. [Google Scholar] [CrossRef] [Green Version]
  25. Brewbaker, J.L. Corn Production in the Tropics: A Hawai’i Experience; College of Tropical Agriculture and Human Resources, University of Hawai’i at Manoa: Honolulu, HI, USA, 2003; Available online: https://www.ctahr.hawaii.edu/oc/freepubs/pdf/corn2003.pdf (accessed on 15 May 2019).
  26. Hochmuth, G.J.; Hanlon, E. A Summary of N, P, and K Research with Sweet Corn in Florida. EDIS 2010. Available online: https://journals.flvc.org/edis/article/view/118808 (accessed on 25 June 2019).
  27. Hue, N.V.; Ikawa, H. Liming Acid Soils of Hawai’i; College of Tropical Agriculture and Human Resources, University of Hawai’i at Manoa: Honolulu, HI, USA, 1997; Available online: https://www.ctahr.hawaii.edu/oc/freepubs/pdf/AS-1.pdf (accessed on 21 April 2019).
  28. Crabtree, C.G.; Seaman, T.M. Suction Lysimeter Modifications to Improve Sampling Efficiency and Prevent Wildlife Damage. Vadose Zone J. 2006, 5, 77–79. [Google Scholar] [CrossRef]
  29. Heckman, J.R.; Hlubik, W.T.; Prostak, D.J.; Paterson, J.W. Pre-Sidedress Soil Nitrate Test for Sweet Corn. HortScience 1995, 30, 1033–1036. [Google Scholar] [CrossRef] [Green Version]
  30. Varvel, G.E.; Schepers, J.S.; Francis, D.D. Ability for in-season correction of nitrogen deficiency in corn using chlorophyll meters. Soil Sci. Soc. Am. J. 1997, 61, 1233–1239. [Google Scholar] [CrossRef]
  31. Varvel, G.E.; Wilhelm, W.; Shanahan, J.F.; Schepers, J.S. An Algorithm for Corn Nitrogen Recommendations Using a Chlorophyll Meter Based Sufficiency Index. Agron. J. 2007, 99, 701–706. [Google Scholar] [CrossRef] [Green Version]
  32. Valenzuela, H.R.; Goo, T.; Hamasaki, R.H.; Radovich, T. The effect of bone meal on the yield of jicama, Pachyrhizus erosus, in O’ahu Hawai’i. Proc. Fla. State Hortic. Soc. 2000, 113, 222–226. [Google Scholar]
  33. Maresma, A.; Ariza, M.; Martinez, E.; Lloveras, J.; Martinez-Casasnovas, J.A. Analysis of Vegetation Indices to Determine Nitrogen Application and Yield Prediction in Maize (Zea mays L.) from a Standard UAV Service. Remote Sens. 2016, 8, 973. [Google Scholar] [CrossRef] [Green Version]
  34. Amanullah, J.; Shah, P. Timing and rate of nitrogen application influence grain quality and yield in maize planted at high and low densities. J. Sci. Food Agric. 2010, 90, 21–29. [Google Scholar] [CrossRef]
  35. Lazicki, P.; Geisseler, D. Soil nitrate testing supports nitrogen management in irrigated annual crops. Calif. Agric. 2016, 71, 90–95. [Google Scholar] [CrossRef]
  36. Kiani, M.; Raave, H.; Simojoki, A.; Tammeorg, O.; Tammeorg, P. Recycling lake sediment to agriculture: Effects on plant growth, nutrient availability, and leaching. Sci. Total Environ. 2020, 753, 141984. [Google Scholar] [CrossRef] [PubMed]
  37. Jatana, B.S.; Kitchens, C.; Ray, C.; Tharayil, N. Regulating the nutrient release rates from proteinaceous agricultural byproducts using organic amendments and its effect on soil chemical and microbiological properties. Biol. Fertil. Soils 2020, 56, 747–758. [Google Scholar] [CrossRef]
  38. Ahmad, A.A.; Fares, A.; Abbas, F.; Deenik, J.L. Nutrient concentrations within and below root zones from applied chicken manure in selected Hawaiian soils. J. Environ. Sci. Health B 2009, 44, 828–843. [Google Scholar] [CrossRef]
  39. Filho AC, C.; Crusciol, C.A.; Guimarães, T.M.; Calonego, J.C.; Mooney, S.J. Impact of Amendments on the Physical Properties of Soil under Tropical Long-Term No Till Conditions. PLoS ONE 2017, 12, e0173011. [Google Scholar] [CrossRef]
  40. Gangaiah, C.; Ahmad, A.; Nguyen, H.V.; Wang, K.H.; Radovich, T.J.K. Evaluating Three Invasive Algal Species as Local Organic Sources of Potassium for Pak Choi (Brassica rapa, Chinensis Group) Growth. HortScience 2017, 52, 436–440. [Google Scholar] [CrossRef] [Green Version]
  41. Aziz, T. Nutrient Availability and Maize (Zea mays) Growth in Soil Amended with Organic Manures. Int. J. Agric. Biol. 2010, 12, 621–624. [Google Scholar]
Figure 1. Daily mean precipitation over the study period at (A) Waimānalo and (B) Poamoho Research Stations in O’ahu, Hawai’i.
Agronomy 11 01945 g001
Figure 2. Regression analysis between meat and bone meal (MBM) application N rates and fresh weights, and of sweet corn ears at (A) Waimānalo and (B) Poamoho Research Stations.
Agronomy 11 01945 g002
Figure 3. The concentration of NO3-N (A) within the root zone (30 cm) and (B) below the root zone (60 cm) at Waimānalo during the study period for the application N rates of meat and bone meal.
Agronomy 11 01945 g003
Figure 4. The concentration of NO3-N below the root zone (60 cm) at Poamoho throughout the study period for the application timing (preplant and split) of meat and bone meal.
Agronomy 11 01945 g004
Table 1. Soil analyses from field trials at two locations in O’ahu, Hawai’i.
P zKCaMgMnFeCuZnNC
LocationpHmg g−1mg dm−3%
Waimānalo6.63063934510146538419111110.142.1
Poamoho5.42886238871796954128260.071.2
z The Modified Truog procedure was used for extractable P.
Table 2. Nutrient analyses from meat and bone meal fertilizer z used in field trials.
NPKCaMgFeMnZnCuBC
Location%ug g−1%
Waimānalo8.92.80.675.50.1599212793.01246.7
Poamoho10.02.70.835.00.16152617873.05.047.1
z Meat and bone meal fertilizer obtained from Baker Commodities in Kapolei, HI, USA.
Table 3. Mean (SE) growth and yield components of sweet corn grown in field trials receiving meat and bone meal at two locations in Oahu, Hawaii.
Yield (g plant−1)Ear FW (g plant−1)Ear DW (g plant−1)Shoot DW (g plant−1)Root DW (g plant−1)Leaf Area (cm−3)
Waimanalo
N Rate (kg ha−1)
0156.49 (29.74) b z198.88 (14.11)43.50 (4.21)50.38 (3.12) c7.58 (0.48) c239.25 (11.84) d
112162.81 (10.81) b190.38 (8.69)44.33 (3.18)75.88 (2.86) b13.67 (0.42) bc272.25 (15.64) cd
224185.10 (8.64) ab205.50 (7.97)45.38 (2.35)80.25 (4.44) b13.13 (1.15) bc260.88 (9.33) bc
336208.06 (6.68) a217.75 (7.06)50.54 (2.65)88.50 (4.08) a16.88 (1.93) ab295.75 (8.13) ab
448213.88 (8.42) a227.13 (8.02)52.38 (2.54)95.13 (3.76) a20.75 (1.97) a309.38 (4.70) a
Timing
Preplant179.25 (9.18)207.65 (7.01)47.00 (2.18)80.10 (6.28)15.30 (1.55)277.65 (8.92)
Split191.29 (8.27)208.20 (5.13)47.30 (1.66)75.95 (7.66)13.50 (1.23)273.35 (7.60)
Ratesp = 0.0046p = 0.0559p = 0.1202p < 0.0001p = 0.002p = 0.0004
TimingNSNSNSNSNSNS
Rates × timingNSNSNSNSNSNS
Poamoho
N Rate (kg ha−1)
0183.23 (24.52) c231.50 (7.99) c66.25 (4.25) c101.88 (7.56) c13.38 (1.93) b298.64 (10.02) d
112212.80 (31.91) bc237.88 (13.13) c71.38 (5.03) bc107.04 (8.80) bc17.13 (1.76) b306.68 (11.07) cd
224224.99 (19.65) abc270.25 (8.31) b84.88 (4.71) ab132.50 (7.13) abc24.25 (2.15) a333.57 (12.72) bc
336261.31 (15.41) ab301.41 (13.93) a90.75 (5.91) a135.52 (12.52) abc26.88 (3.80) a329.78 (12.33) bc
448258.26 (19.26) ab310.13 (15.11) a95.63 (6.86) a141.38 (12.88) ab24.38 (2.37) a357.97 (14.56) ab
672288.08 (11.66) a319.50 (5.47) a99.25 (2.61) a147.01 (14.06) a27.88 (2.74) a366.41 (11.64) a
Timing
Preplant255.52 (12.59) a278.13 (9.50)84.38 (3.99)134.75 (12.09)25.50 (1.87)337.64 (8.93)
Split220.71 (14.12) b278.79 (9.46)85.00 (3.54)120.33 (9.57)19.13 (1.44)326.70 (7.73)
Ratesp = 0.015p < 0.0001p = 0.0006p = 0.0247p = 0.0002p = 0.0003
Timingp = 0.0479NSNSp = 0.1113p = 0.1703NS
Rates × timingNSNSNSNSNSNS
Abbreviations: N = nitrogen, FW = fresh weight, DW = dry weight. Bold text indicates a statistically significant difference with a p ≤ 0.05. z Mean separation by Waller-Duncan k-ratio (k = 100) t test at p ≤ 0.05. Means in a column followed with the same letter are not significantly different.
Publisher’s Note: MDPI stays neutral with regard to jurisdictional claims in published maps and institutional affiliations.

