Article

A Research Method for Semi-Automated Large-Scale Cultivation of Maize to Full Maturity in an Artificial Environment

1
Department of Agronomy, Purdue University, West Lafayette, IN 47907, USA
2
National Soil Erosion Research Laboratory, USDA Agricultural Research Service, 275 S. Russell St., West Lafayette, IN 47907, USA
*
Author to whom correspondence should be addressed.
Agronomy 2021, 11(10), 1898; https://doi.org/10.3390/agronomy11101898
Submission received: 11 August 2021 / Revised: 10 September 2021 / Accepted: 15 September 2021 / Published: 22 September 2021

Abstract

:
There are unique advantages and disadvantages to using the field, greenhouse, growth chamber, and media-less techniques for growing maize (Zea mays L.) for research purposes. Soil-buffered nutrients such as phosphorus (P) do not allow for precise control of solution concentrations in the field, while greenhouses, growth chambers, and hydroponics provide limiting conditions. The objectives of this study were to develop a practical technique for productively cultivating several maize plants from seed to physiological maturity (R6) in a grow room environment, with precise control of nutrient availability and timing, and evaluate its utility for the purpose of measuring plant responses to variations in nutrient concentrations. The construction and testing of a semi-automated grow room for conducting nutrient studies on 96 maize plants utilizing simulated or artificial conditions are described. Plant growth response to a range of solution phosphorus (P) concentrations was tested to evaluate the utility of the technique. Maize yield components were measured and compared to values for field-grown plants. Due to ideal conditions and successful simulation of light intensity, diurnal fluctuations in temperature and RH, and changing photoperiod, grain yield and tissue nutrient concentrations were comparable to field-grown maize, although with greater shoot biomass. Plants responded positively to increased P concentrations in fertigation. The technique can be used for large-scale plant nutrient studies that require precise control of bioavailability and timing as well as manipulation of light intensity and photoperiod duration.

1. Introduction

The ability to grow maize in an artificial environment is extremely useful because it allows for year-round experimentation with a high level of repeatability and precise control of nutrient and water availability and light conditions, which is impossible to obtain in a field environment. Depending on the purpose of experimentation, field variability in soil moisture, soil chemical and physical properties, sunlight, and temperature could present a difficulty in the ability to discern treatment effects. In addition, the dynamic nature of soils can present further variability in cases where the objective is to focus on the plant instead of the soil. For this reason, the traditional alternatives to field experiments that allow for focus on plant growth are growth chambers and greenhouses. Growth chambers offer year-round experimentation under any desired conditions with precise control of all plant growth parameters such as, temperature; relative humidity; light quality, quantity, and duration, along with the ability to program all these parameters to change temporally. However, space is generally limited to cube shaped boxes measuring approximately 1 to 2 m in the x, y, and z dimensions, which limits the number of plants and treatments that can be grown simultaneously [1,2,3,4]. Additionally, maize plants grow tall and the size restrictions of growth chambers limit the stage of growth that maize plants can achieve. Greenhouses provide greater space than growth chambers, but less control over the environment, especially sunlight, which is governed by the time of year. Greenhouse experiments typically supplement light with metal halide and/or high-pressure sodium lighting [5]. One disadvantage with these types of lighting is their variation in light quality distribution across the wavelengths of the electromagnetic spectrum and light quantity production when compared to natural sunlight. The second major problem with these types of lighting is the high amount of heat they produce to reach a given light intensity and the consequent problem of dissipating this heat [6].
Not only do traditional field studies present great variability in environmental conditions, but soils themselves are extremely dynamic with regard to nutrient solubility. The dynamic nature of soil nutrients can be a major source of variability in crop nutrient studies that are intended to focus specifically on the impact of the nutrient on plant growth, excluding soil interactions. Specifically, soils are complex media that can participate in a variety of processes that will both remove and release nutrients to solution; for example, anion and cation exchange, adsorption and desorption, mineralization and immobilization, and precipitation and dissolution [7]. With regard to nutrient uptake, it is the solution concentration that the plant is truly drawing from, with the soil behaving as a “warehouse” that supplies that solution. Thus, when using soils, scientists have little control over the solution conditions that directly impact the plant root. The most obvious example of this is found with phosphorus (P), in which several soil-P pools equilibrate with the solution permitting adsorption, desorption, precipitation, and dissolution [8]. The buffering nature of soils can be especially difficult in studies intended to focus on nutrient timing, specifically induction of a nutrient deficiency at a certain growth stage, as a nutrient may be added to the soil, but cannot be taken away appreciably over a short time period. Another confounding issue in using soils is that the uptake of several nutrients (such as P and trace metals) are partly dictated by soil physical properties that control diffusion to the plant root [7].
For plant studies that require precise control of the plant root-solution environment, this issue was overcome with hydroponics experiments where plants are grown with roots placed in a nutrient solution with the shoots physically supported [9]. While this allows for precise control of solution nutrient concentrations at all growth stages, roots generally behave differently when growing in a medium of water for extended time and also have poor anchoring of the shoots [10,11,12]. Another problem with traditional hydroponic systems is the need to constantly monitor solution nutrients and pH, which are changing as the plant roots uptake nutrients [13,14]. Thus, scientists will test the nutrient solution frequently and then re-adjust accordingly in order to maintain a constant concentration.
Thus, there is a need to develop a system to study plant growth isolated from the soil, maximizing the same advantages found in hydroponics, greenhouse, and growth chamber experiments, while minimizing their disadvantages. The objective of this study was to (i) develop a practical technique for productively cultivating several maize plants from seed to physiological maturity (R6) in a growth room environment, with precise control of nutrient availability and timing, and (ii) evaluate its utility for the purpose of measuring plant responses to a range of nutrient concentrations (specifically P).

2. Materials and Methods
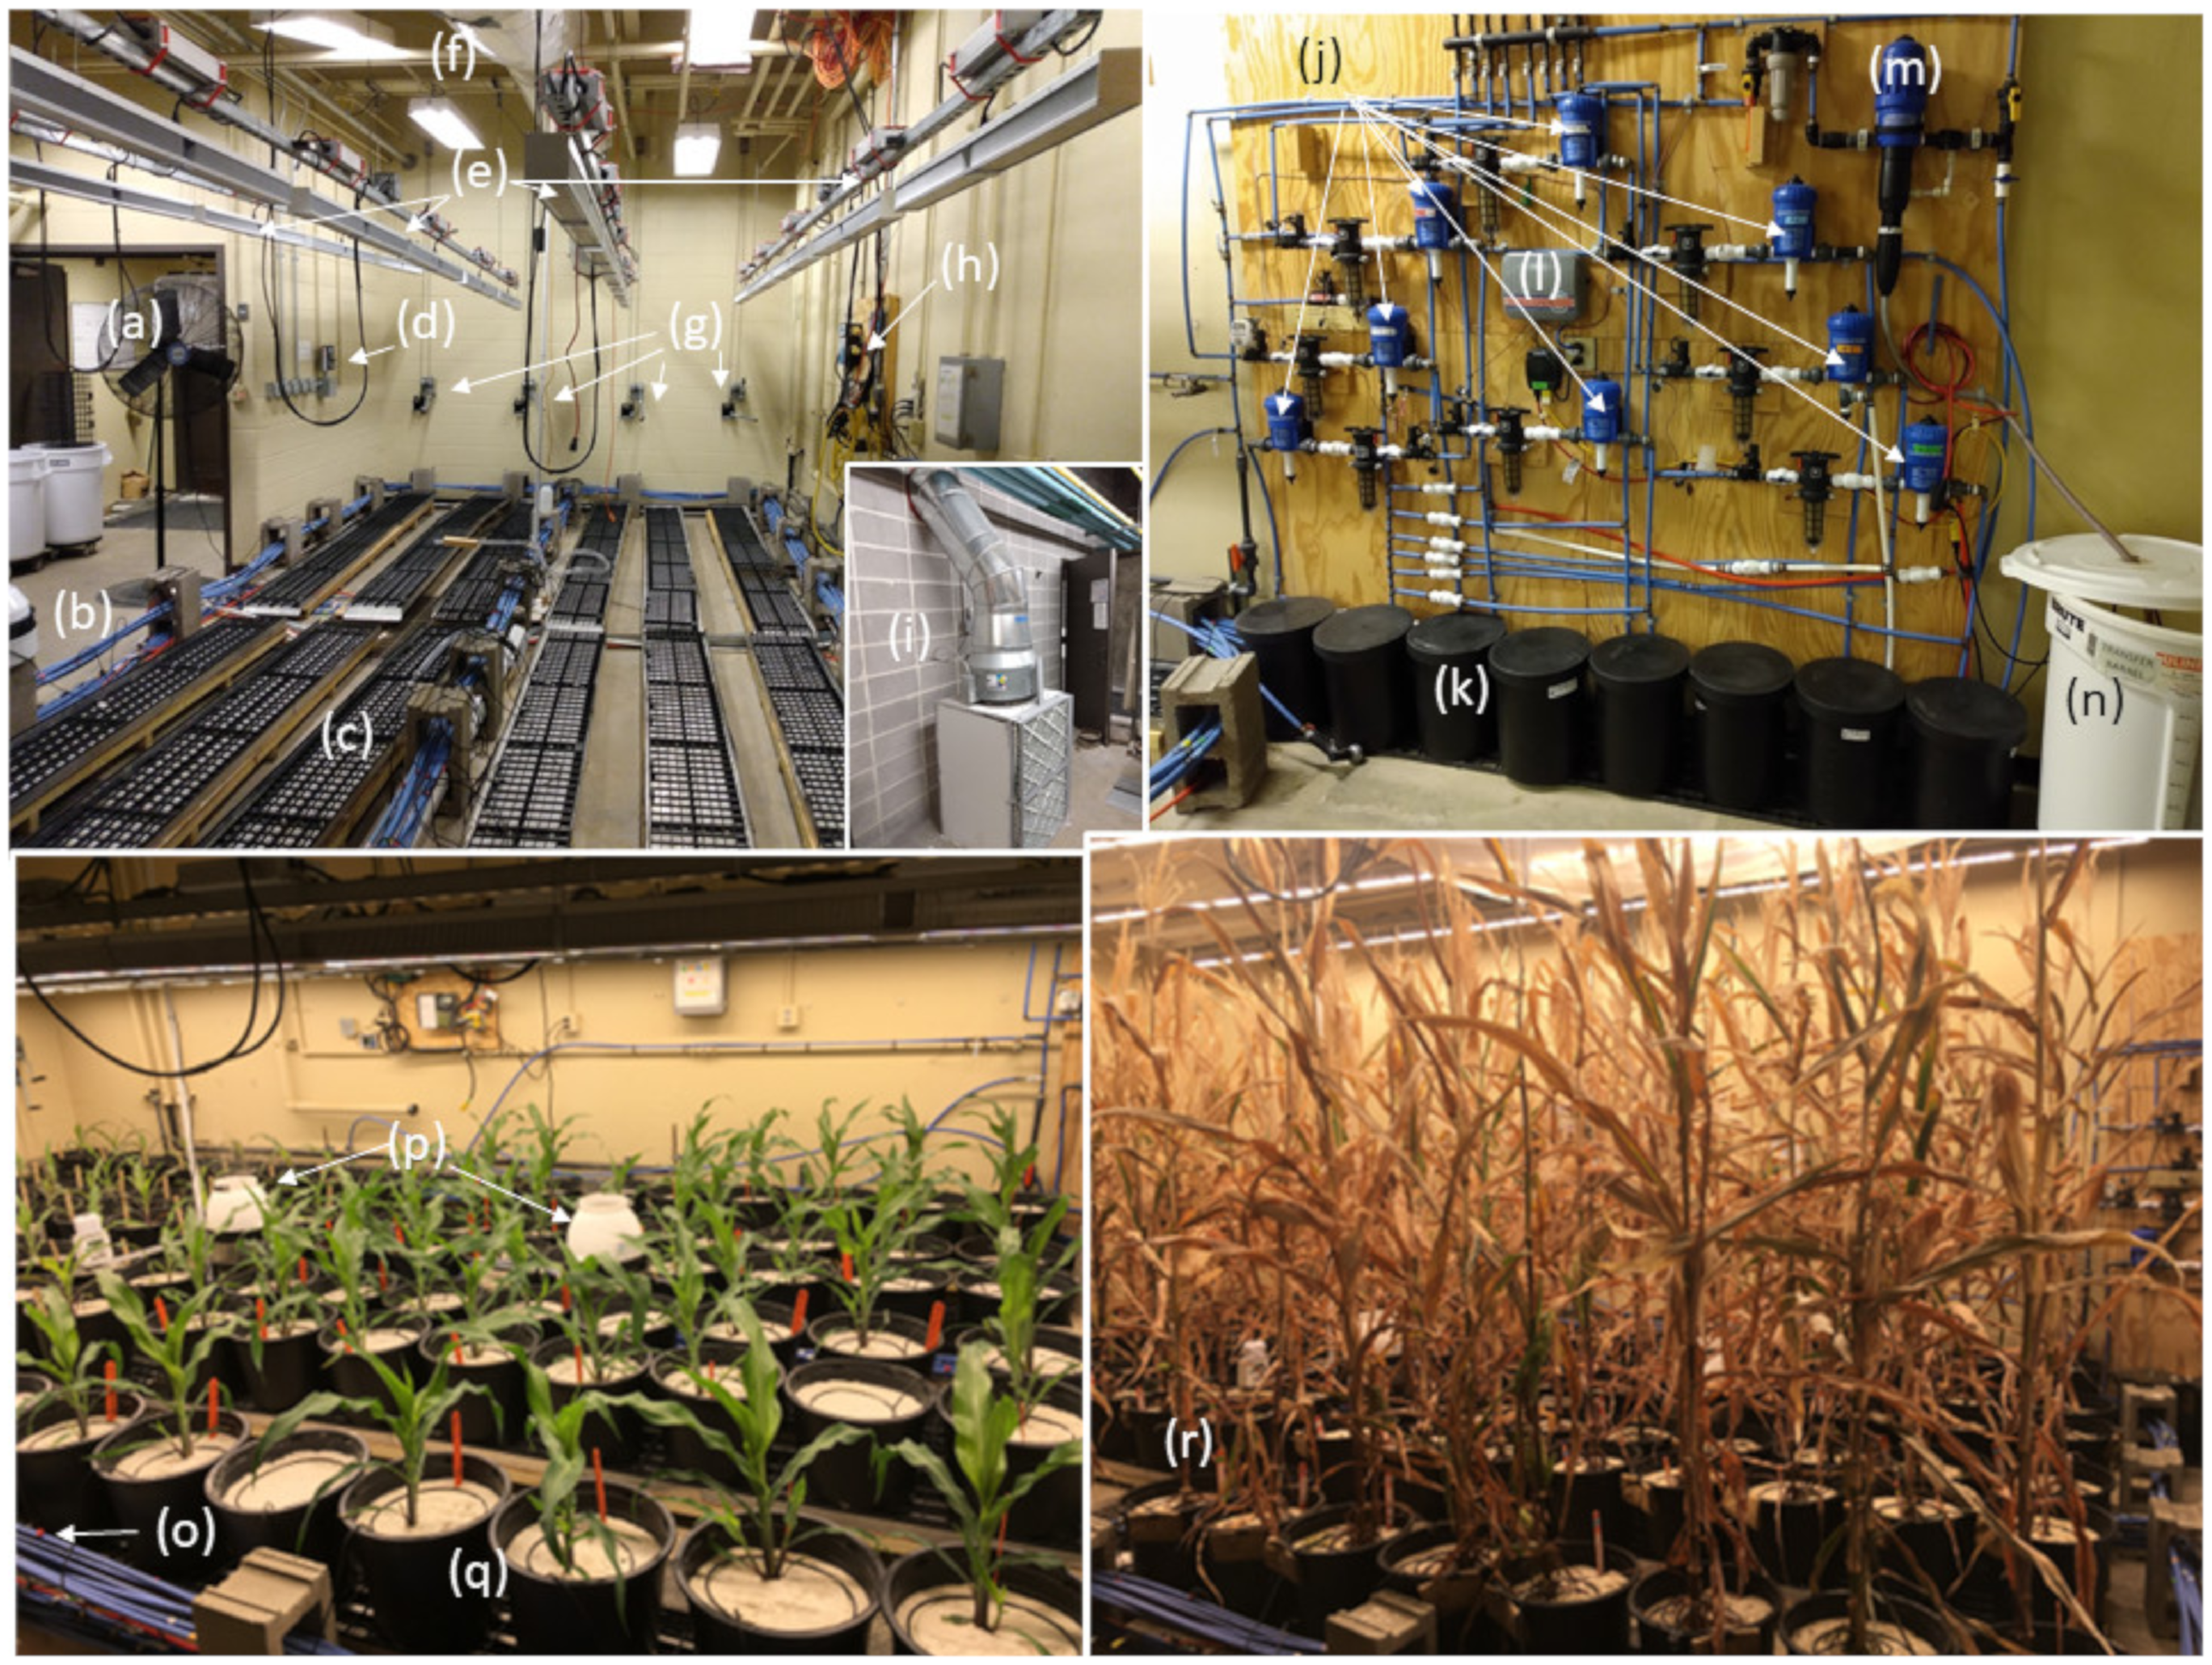
2.1. Grow Room

The study was conducted at the USDA-ARS, National Soil Erosion Research Laboratory (NSERL) on the Purdue University campus in West Lafayette, IN, USA. Maize growth experiments were conducted in a grow room located in the basement of the NSERL laboratory facilities (Figure 1). There was no natural light reaching the grow room. The dimensions of the grow room were 7.0 × 4.0 × 4.0 m (length × width × height; 112 m3), which allowed for enough space to accommodate 96 individual maize plants grown to maturity.
Four rows of six LED light fixtures were evenly spaced across the width of the grow room with each fixture within a row butting directly up against the previous (Figure 1). Each light bank consisted of six individual 107 cm long light fixtures wired together in a circuit that functioned as a single unit. Light fixtures emitted a full spectrum ranging from 400 to 780 nanometers in wavelength (model VYPRx, Fluence Bioengineering, Austin, TX, USA). The light banks were hung from the ceiling and attached to pulleys on each end, allowing each bank to be raised as plants grew (Figure 1). Lights were positioned directly above the plants with the height adjusted periodically to maintain an upper canopy photosynthetic photon flux density (PPFD) level of approximately 1800 to 2000 μmoles m−2 s−1; this target intensity was met when lights were approximately 40–50 cm above the leaf surface of uppermost leaves. Photoperiod was controlled to approximate photoperiod for this location (West Lafayette, IN, USA; 40.4237° N, 86.9212° W) using an Intermatic ET90000 Series Astronomical Timer (Intermatic Inc., Spring Grove, IL, USA). The light timer was set in this experiment to a start date of 15 May and simulated daily changes in photoperiod for the entirety of the growing season.
Plants were established in individual pots, with a top diameter of 38 cm and 24 cm depth and a volume of ~28 L. Each pot was filled with 30 kg of silica sand growing media (described below). Pots were arranged in six rows down the length of the room and placed on top of fabricated aluminum drainage trays (Figure 1). The drainage trays were set upon wooden frames with approximately 2% slope. This provided drainage to a central floor drain and prevented water ponding on the concrete floor. Whenever irrigation was applied, all excess water was removed by the underlying trays through gravity drainage so that no pots would remain in standing water. Prevention of water ponding was also necessary to prevent cross-treatment contamination and potential pest problems.
The air handling and exchange system was a two-part system. The first part was air handling within the grow room and the second was exchange with outside air. The atmosphere of the grow room was continuously monitored by a Saturn 6 Digital Environmental Controller with CO2 concentration control (Titan Controls, Sunlight Supply, Vancouver, Washington, DC, USA). This controller, mounted to the wall, was used to maintain humidity, CO2, and temperature at the desired levels (Figure 1). Sensors for the unit were hung from the ceiling at a central location. The output from this controller was wired to an electrical relay that, when energized by the controller, would engage the main exhaust fan for the room bringing in outside air to replace the grow room air. The grow room’s main exhaust fan (Figure 1) was a 16-inch diameter fan capable of exchanging air at a rate of ~83 m3 min−1 (model FKD16, Fantech, Lenexa, KS, USA), 74% of the grow room’s volume. The Saturn controller was programmable for separate day and night settings. During the daylight hours the main exhaust fan was triggered by the controller to bring in fresh air if the CO2 concentration fell below 350 ppm, or if temperature was >35 or <20 °C. During the night hours the main exhaust fan was triggered by the controller to bring in fresh air if the CO2 concentration fell below 350 ppm, or if temperature was >30 or <15 °C. The Saturn controller contained a photocell that determined day and night to trigger the appropriate CO2 and temperature controls. In addition, the exhaust fan was programmed to operate for 10 min, twice per day. The main exhaust fan was able to achieve the targeted temperatures in part because it did not draw air directly from outside, but through an adjoined basement space at the NSERL facilities that acted as a “lung room”. The lung room provided air via the building’s HVAC system. Temperatures in the lung room were generally around 20 °C; this supplied air at a stable temperature, which allowed cooling of the grow room during the day, and warming at night based on the settings for the Saturn controller previously described. The grow room was as air-tight as possible, with the exception being one set of louvers measuring 1.57 by 0.78 m (height × width) that opened with the creation of positive pressure in the room (allowing air to escape from the room) when the exhaust fan was triggered by the Saturn controller to bring in fresh air from the lung room.
To further assist with room cooling during the day and to create diurnal temperature variation at night, two free standing air conditioners (AC; Frigidaire Model FFPH1422T1) were operated during all daylight hours and one unit was operated at night. During both day and night operation, the unit(s) were set to cool to 22 °C. The units were 14,000 BTU units rated to cool up to approximately 65 m2 each. In addition to cooling, the units also offered a dehumidifying setting and a heating setting (not used in these experiments). The heating capability is only mentioned because, if desired for high temperature stress and/or water deficit/desiccation stress experiments, extreme temperatures could be created with the supplemental heating in combination with heat generated by light banks that approach 40 °C. Although the dehumidifying setting was not used, it is important to note that free standing AC cooling units remove a great deal of moisture from the air through condensation. To overcome excess moisture removal by the AC units and removal through the exhaust fan, two supplemental humidifiers (DropAir, DL Wholesale Inc., Livermore, CA, USA) were operated continuously (4 L h−1) under control of an independent humidistat set to engage when relative humidity dropped below 65%. Each humidifier (Figure 1) was rated to cover up to approximately 185 m2. The air was continuously mixed in the room by free standing, 0.5–1.0 m diameter oscillating shop pedestal fans (Figure 1). Air mixing helped to equalize temperature and humidity throughout the grow room and provided mechanical stimulation to plants. Two pedestal fans operated continuously during peak daylight hours and alternated hourly throughout the night hours, with the only exceptions being one hour of no operation from 18:00–19:00 h and from 4:00–6:00 h in order to allow the motors to cool. The estimated monthly electricity use for operating the grow room from planting to harvest was about 9000 kW-h, which cost approximately USD 550 per month at this location.
In order to prevent pest and disease outbreaks, several precautions were taken. First, the entire room was sprayed initially with a 1% bleach (hypochlorite) solution. At the entrance to the grow room, a 10 cm-wide and 1 cm-high layer of diatomaceous earth was placed on the ground to deter insects from crawling into the room; this material was also applied to a door mat for the purpose of coating the soles of a person’s shoes upon entrance to the room. Diatomaceous earth is considered an organic insecticide. Just beyond the entrance doors (which contained one-way louvers) to the room was a narrow hallway; hanging from the ceiling was a standard box fan wired to a motion detector, causing air to blow out of the room while someone entered. In order to prevent insect infestation, anyone entering the room was required to wear a lab coat, and there was a three-day period of no-entrance for those who had been in the field or greenhouse with actively growing plants. All air entering the room through the previously described intake exhaust fan was filtered with a blended polyester air filter (Camfil 30/30 Dual 9 ISO 16890 ePM10–55%; Stockholm, Sweden). The successful prevention of pest outbreaks was also made possible by avoiding use of field soils.

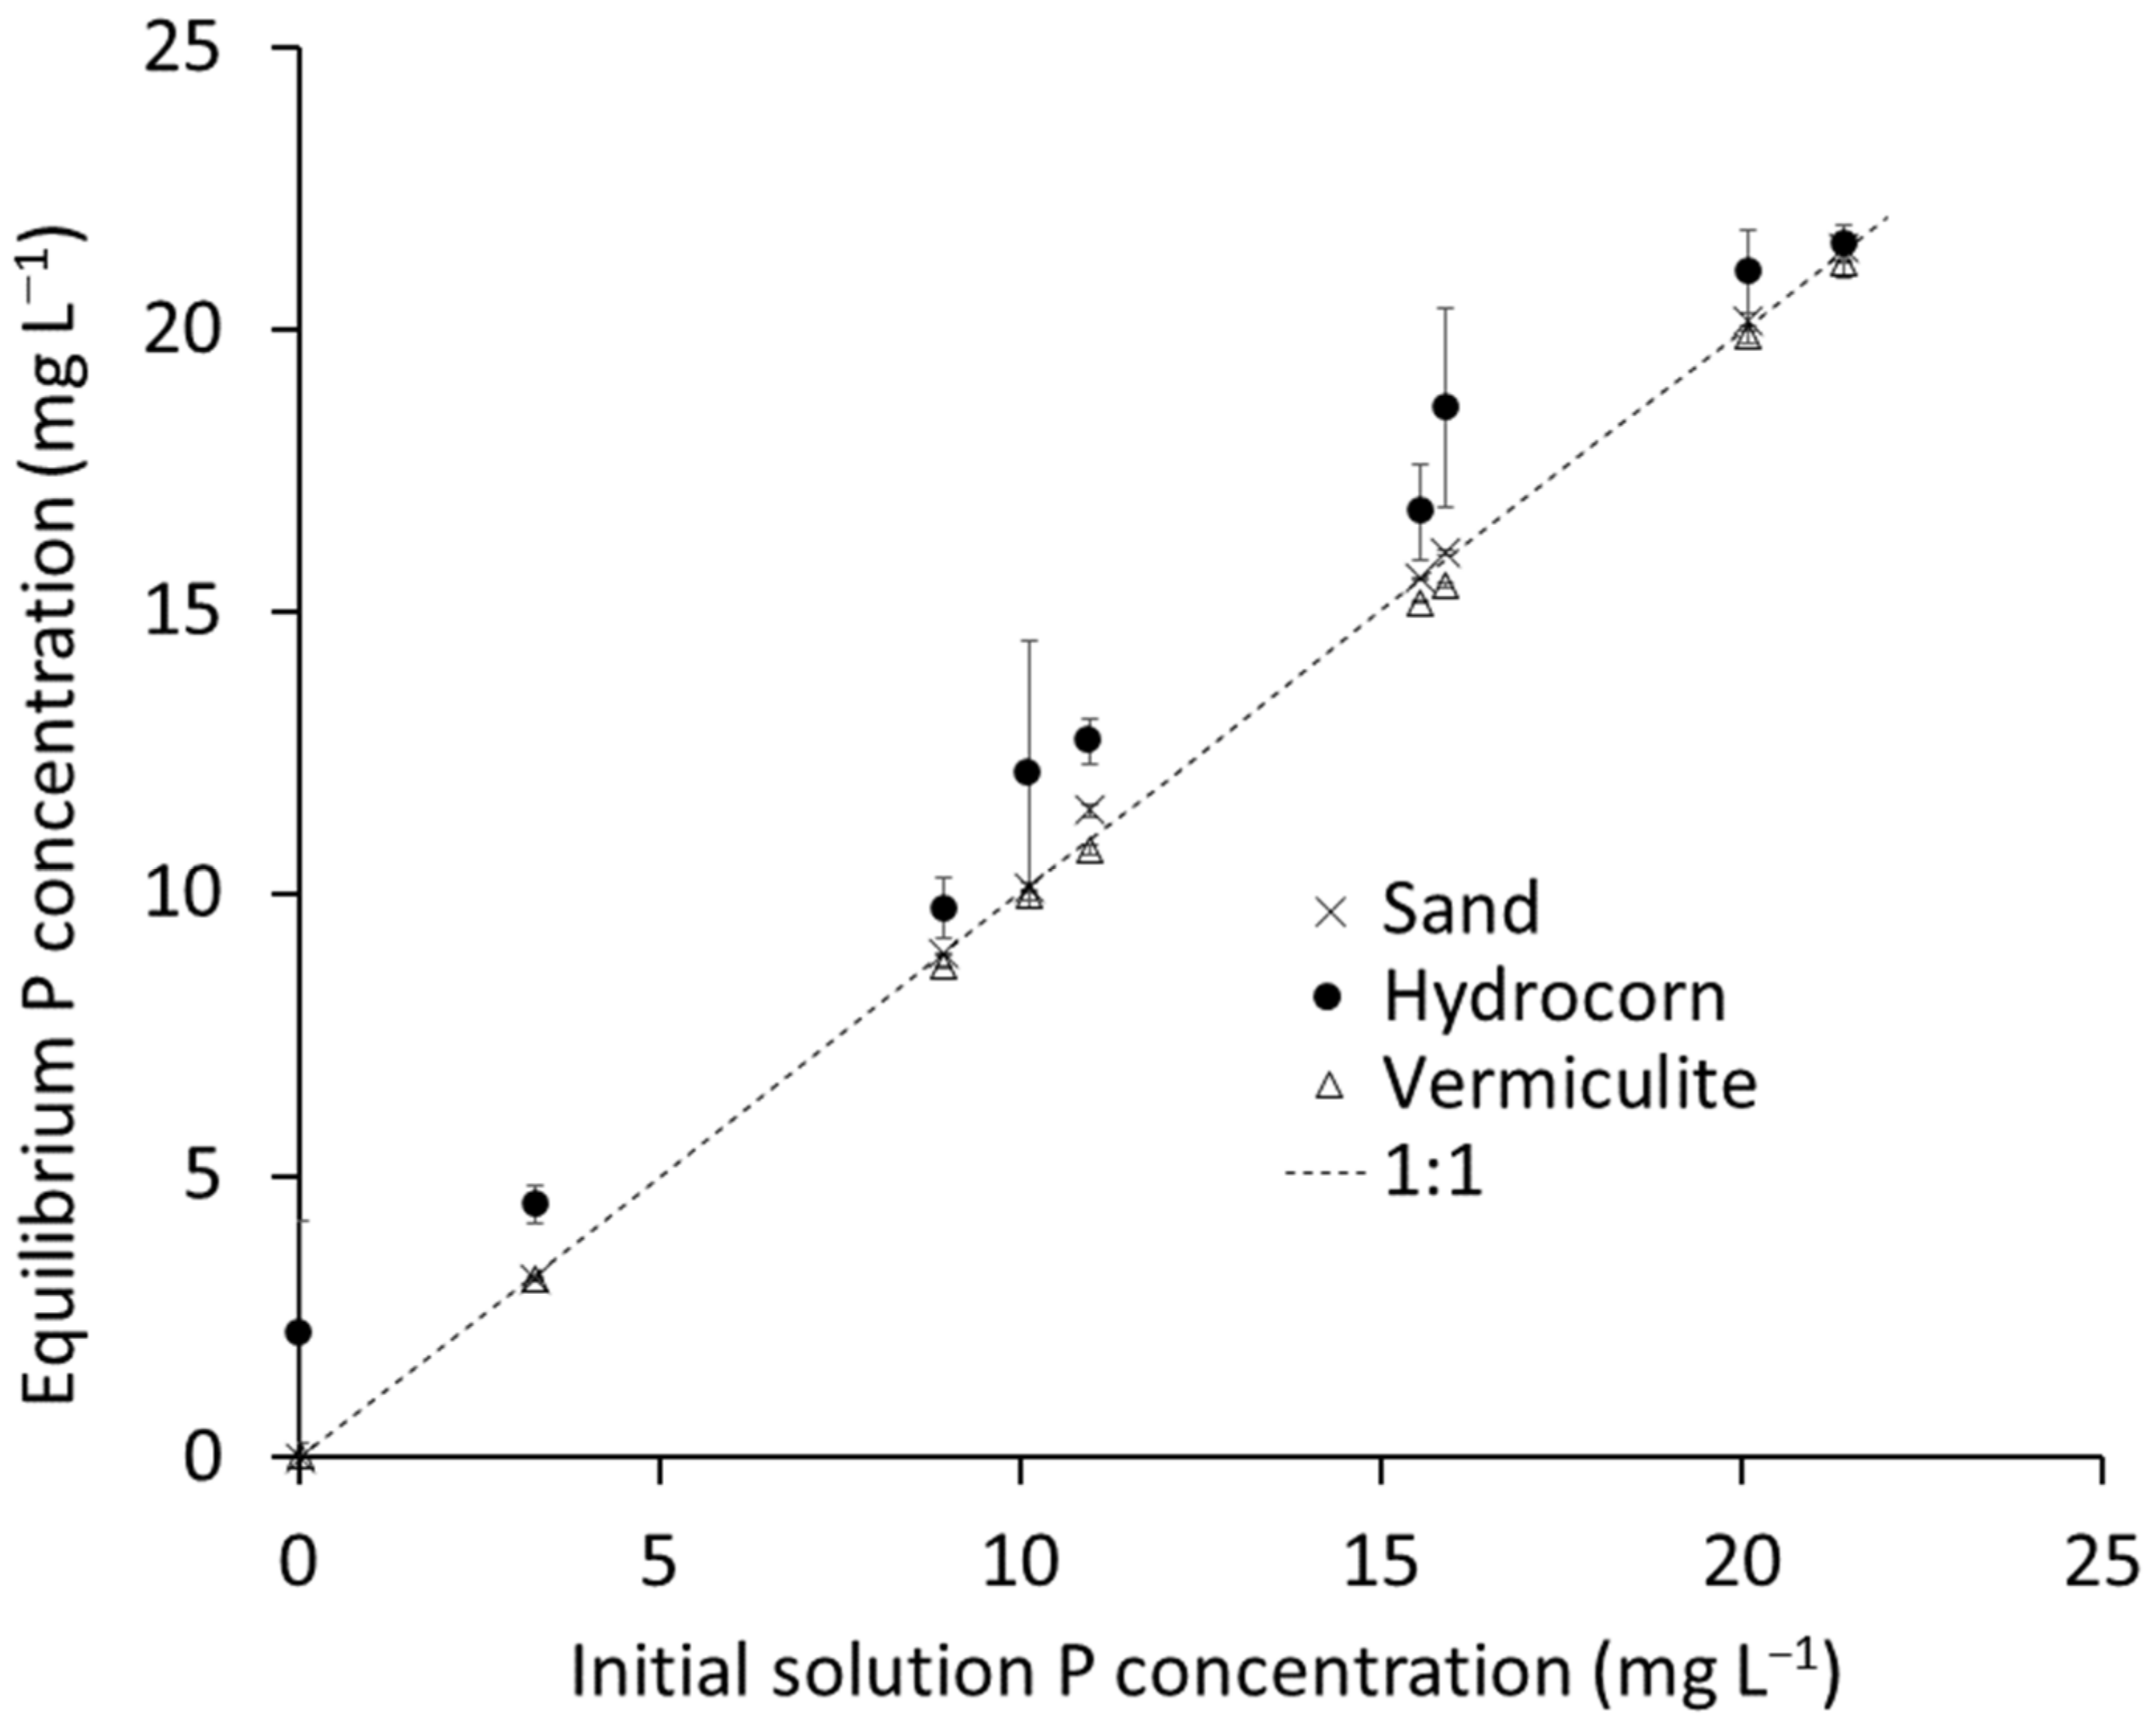
2.2. Nutrients and Irrigation

Maize plants were grown to full maturity (R6) with each pot occupied by one individual mature maize plant at harvest (Figure 1). Plants were grown with solution-culture methodology using a nutrient solution developed at the NSERL lab specifically for these experiments (Table 1). Concentrations of all nutrients listed in Table 1 were additionally checked for meeting target concentrations through inductively coupled plasma atomic emission spectroscopy (ICP-AES; Optima 8300, Thermo Fisher Scientific Inc., Waltham, MA, USA). In addition, P was also tested colorimetrically [15].
Note that Table 1 indicates the final nutrient solution concentration discharged to the plant, not the concentration of the stock concentrate used in the nutrient injection system described below. The P concentrations tested were 4, 8, 10, 12, 15, 18, 20, and 22 mg L−1. However, due to malfunction of two nutrient injectors that was not discovered for several weeks, data from the 10 and 18 mg L−1 treatments were excluded due to application of non-target P concentrations. In the case of this study, solution-culture is defined as a method of plant growth where all plant essential nutrients are delivered in plant-available forms through liquid fertilizer injection into the irrigation water. Irrigation lines (Figure 1) were established using a 1.27 cm-diameter cross-linked polyethylene pipe (commonly known as “PEX”) plumbed directly into the deionized (DI) water system of the NSERL building. Water from the building’s DI water system flowed directly into the PEX piping followed by a nutrient injection system for liquid fertilizer. Irrigation lines were established with a circular plumbing circuitry that made a loop to all pots in a treatment and then connected back to itself immediately before the first pot in the line. This was carried out to equalize the pressure throughout the pipe. Additionally, a by-pass was installed so that all plants could receive supplemental watering with pure DI water, if needed.
Nutrients were injected into the irrigation lines containing DI water. Injectors were a water-powered piston-pump design and allowed for precise injection of nutrients (Figure 1). Two different types of injectors were used: a single unit for delivering all nutrients except for the treatment nutrient to be studied, and several smaller units for delivering the treatment nutrient of interest. In this case, the nutrient studied was P. The bulk non-P nutrient solution was made as a concentrate in 100 L batches and injected at a 1:10 ratio using a Dosatron D14MZ520 injector (Dosatron International, Inc., Clearwater, FL, USA).
Following the bulk non-P nutrient solution being injected into the DI water supply, the flow was split to eight different nutrient injectors (Dosatron, model D25F1, 1:100 fixed ratio injector) that injected the P solution. Each of the eight injectors represented a different P concentration. The final blended nutrient solution was then directed into each pot via irrigation lines culminating in a dribble ring in each pot (25.4 cm in diameter, Dramm Corp., Manitowoc, WI, USA) that allowed for even distribution of the nutrient solution around the plant (Figure 1).
The nutrient solution contained within the growth media pore volume was replaced throughout the day to maintain a near-constant nutrient level as each irrigation event displaced the pore water (flow rate, distribution, and frequency described below). Irrigation was controlled by an Irritrol RD1200-EXT-R solenoid irrigation timer (The Toro Company, Bloomington, MN, USA), which allows for programing of frequency and duration of events. Irrigation duration and timing were designed around crop water needs. The irrigation system was initially programmed to discharge four times daily for one minute per event. This provided approximately 0.5 to 0.6 L per day. At V5-VT, irrigation was increased to 1 L per day. After VT was reached, supplemental water was added daily through the DI system for an additional 1 L. Use of an inert growing media (described below) allowed for mass-flow to become the dominant nutrient-root transport mechanism, mainly because diffusion was mostly eliminated since it is strongly dependent on the nutrient buffer capacity of soil [16]. Essentially, the root nutrient environment was equivalent to fertigation water for a non-sorptive media.
Several emitter volumes were tested prior to use in the growth experiment as described below. Emitters controlled flow rate, while dribble rings served only to evenly distribute water on the pot surface. For growth experiments, the “RainBird 2 gph” (7.6 L h−1) barbed emitter (RainBird, Azusa, CA, USA) was used. Using this emitter, one-minute duration of the irrigation system delivered approximately 100 mL of nutrient solution to each pot per event. Displacement of the nutrient-depleted pore water was achieved through irrigation as evident from water leaching from the pot with every irrigation event.
Six different “RainBird” brand emitters (listed as 2, 5, 7, 10, 12, and 18 gph barbed emitters) were tested with the nutrient injection system for assessing the impact of flow rate on the ability of the nutrient injectors to accurately deliver the proper concentration. We hypothesized that accuracy of nutrient injectors could vary with flow rate, and because emitters limited the flow rate of the irrigation system, it was hypothesized that injection accuracy would vary between emitters designed for different flow rates. This also allowed for evaluation of the volume of water delivered with each emitter. Flow rate and P concentration from emitters were tested using the same plumbing system described for the grow room, with 12 emitters on a single irrigation line and a concentrated P solution of 1000 mg L−1 injected into DI water using the Dosatron model D25F1, 1:100 fixed rate injector. During a simulated irrigation event, discharge was collected from each emitter for one minute, with three replications among irrigation events. Collected irrigation water was tested and measured to assess volume delivery and P concentration accuracy. Phosphorus concentration in solution was analyzed colorimetrically [15].

2.3. Growth Media

The goal was to utilize a growing media that (i) facilitated approximately normal mechanical root growth analogous to a field-soil environment, (ii) provided an inert growing media that neither adsorbed nor desorbed nutrients (particularly P), and (iii) physically anchored and supported the plant analogous to a field-soil environment. Several materials were tested for their ability to sorb or desorb P from solution. Phosphorus was specifically tested because a secondary objective of this experiment, not discussed in detail herein, was to study the effects of varying P concentrations on maize growth and yield without the complications of a soil-buffered environment affecting P availability. The following media were considered: (i) 99% pure round grain silica sand that ranged in diameter from 600 to 53 µm (FairmountSantrol, Wedron, IL, USA), (ii) traditional vermiculite greenhouse potting media (Therm-O-Rock West, Inc., Chandler, AZ, USA), and (iii) “Hydrocorn” expanded clay pebbles (Gold Label B.V., De Rijp, The Netherlands), 16–25 mm diameter, used in commercial and research solution-culture hydroponics systems [17]. A P isotherm was conducted using 1 g of media equilibrated for 1 h with 30 mL of P solution on a reciprocating shaker. Phosphorus solutions were made from KH2PO4 to create initial P concentrations of 0, 4, 8, 10, 12, 15, 18, 20, and 22 mg P L−1. Equilibrated samples (n = 3) were filtered with 0.45 µM membranes and analyzed colorimetrically for P [15]. The difference between initial and final solution P concentrations was P sorbed. Based on the results of the isotherm (Figure 2), which showed no P sorption and more “soil-like” physical properties, silica sand was chosen for use in the growth experiment.

2.4. Plant Establishment and Management

Approximately 30 kg of silica sand was placed in each 28 L pot (39 cm diameter) to accommodate the root mass of one individual maize plant per pot. Pots were placed next to each other so distance between stems was 39 cm; distance between rows was 61 cm. Prior to planting, each pot was thoroughly flushed with deionized water to adequately remove any salts that might be present as impurities in the silica-sand media. Following flushing, sand was saturated until significant ponding occurred, and allowed to drain for 24 h. Following the 24 h drainage period, the sand was considered to be at “field capacity” and volumetric water content (VWC) was measured to establish a baseline reference for irrigation purposes. The average VWC across the 96 pots was 0.17 m3 m−3 at a depth of 7.5 cm and 0.25 m3 m−3 at a depth of 20 cm. Maize seed was planted on 21 June 2018 with the media at field capacity. Three hybrids were tested with four replications. Three seeds were planted in each pot evenly spaced apart at a depth of 3.2 cm.
Maize hybrids varied by seed brand and genetically modified traits to observe the effects of P fertility on hybrids from different genetic backgrounds. The comparative relative maturity ranged from 113 to 117 days for the hybrids. The experiment had eight different P fertigation treatments that ranged from 4 to 22 mg P L−1. However, as previously described, two of the eight nutrient injectors were discovered to have malfunctioned for several weeks, delivering incorrect concentrations, and therefore those two (10 and 18 mg L−1) were excluded from data analysis.
Plant emergence (VE) began on 24 June (3 days after planting, DAP); and within the following 24 h period, all 96 pots had a minimum of one emerged (VE) plant. Multiple plants were allowed to grow in each pot until 3 July (12 DAP), at which time each pot was thinned to one plant per pot. The apparent healthiest plant in each pot was subjectively selected and all others were carefully uprooted.
The silking stage (R1) was observed on 14 August (54 DAP). Maximizing grain yields in the grow room environment is heavily dependent on successful pollination. Plants should be extensively checked daily at the first observation of silk emergence and/or when pollen shed is noted. Detailed observations of plant silk emergence can help to determine whether plants are pollinated. If silks on a plant are noted to keep elongating over multiple days, pollination has not occurred. Pollination will not be a problem for some plants, as they will readily shed pollen down on the exposed silks, especially if there is adequate air movement in the room to aid pollen shed and dispersion. If a plant is noted to have not pollinated, most likely by observation of excessive silk elongation, those particular plants will need to be manually pollinated.
During the growing cycle, plant measurements and observations included plant height, distance from plant base to ear, canopy width, stalk diameter, and denotations of crop growth stage [18,19]. Other parameters measured included VWC of pots at 7.5 and 20 cm, plant temperature, and PPFD levels at different heights throughout the crop canopy (56, 112, and 168 cm). In addition, PPFD was measured at 13 vertical (from 5 to 210 cm) and horizontal distances from the light surface with no vegetation present. A WatchDog 2000 Series Mini Station monitored photosynthetically active radiation (PAR), relative humidity (RH), and temperature (model 2475, Spectrum Technologies, Inc., Aurora, IL, USA). This unit was placed on an adjustable pole located in the center of the room with its height increased to maintain mid-canopy position. Daily high and low temperatures were recorded and the corresponding growing degree days (GDD) were calculated. Data from the WatchDog were logged at 30 min intervals for the entire growing season. The majority of maize plants were observed to be at the dent (R5) growth stage on 17 September (88 DAP), and physiological maturity (R6) on 12 October (113 DAP).

2.5. Plant Harvest and Analysis

Plants were harvested on 19 October (120 DAP). Plant tissue was separated into stem (including tassel and cob), leaves, grain, and roots. Collected plant tissues were weighed immediately for wet weight and then weighed again after being dried at 65 °C for 5 d for calculation of moisture content. Dried plant tissues were then ground to pass a 0.50 mm screen using a Thomas Wiley Mill model ED-5 (Arthur H. Thomas Co., Philadelphia, PA, USA). Plant tissue (2 g for grain and 1 g for other tissue types) were digested with 15 mL of concentrated nitric acid on a BD40HT graphite heating block (Lachat Instruments, Milwaukee, WI, USA). Samples were heated to 140 °C for 60 min, followed by addition of 2 mL of 30% hydrogen peroxide, then heated for another 60 min at 160 °C, followed by a final heating cycle at 180 °C for 60 min, resulting in complete digestion. Fully digested samples were brought to a final volume of 25 mL with nanopure DI water and P, K, S, Mg, Ca, Fe, Zn, B, Mn, Cu, and Mo determined with inductively coupled plasma atomic emission spectroscopy (ICP-AES; Optima 8300, Thermo Fisher Scientific Inc., Waltham, MA, USA). Samples were analyzed without dilution and with 7-fold dilution for obtaining accurate measurement of all nutrients. Macronutrients and micronutrients are difficult to analyze simultaneously in the same solution due to ~1000-fold differences in their concentrations in plant tissue. Concentrations of elements in plant tissue samples from ICP-AES analysis were used with sample weights to calculate mass uptake of nutrients for different plant tissues and partitioning of nutrients between different types of plant tissues. Plant tissues were also analyzed for total C and N content by dry combustion (LECO, St. Joseph, MI, USA). Grain yield results are adjusted to 15.5% moisture content; all other plant parts are presented on a dry basis. Nutrient concentrations in all plant parts are presented on a dry weight basis.

2.6. Statistical Analysis

The grow room was planted in a split-block randomized complete block design where hybrids were the main block and P treatments were randomized within the blocks. Analysis of Variance (ANOVA) was performed using statistical analysis software (SAS) [20] for determining whether there was a significant (p < 0.05) interaction between hybrid and P treatment among the yield parameters and plant tissue nutrient concentrations. Because there were no such interactions, simple statistics (min, max, median, mean, standard deviation) are presented across hybrids within each P treatment. The PROC GLM statement was used to determine whether grain yield was significantly different (p < 0.05) among P treatments. The PROC NONLIN (i.e., linear plateau) procedure of SAS was conducted to estimate the “breakpoint” P concentration in which there was a significant change in grain yield and total biomass, i.e., the threshold concentration at which higher concentrations would not produce significantly greater grain yield or total biomass.

3. Results and Discussion

The estimated cost of the entire system is listed in Table 2. Not including monthly electric costs, the total was about USD 41,000. The majority of the cost was associated with LED lights and nutrient injectors. Other than the need for an electrician to complete wiring for LED lights and associated timer, no outside labor was utilized. Compared to conventional growth chambers that generally cost USD 20,000 to 30,000, are limited in the number of plants they can house, and prevent full plant height development, the cost of the grow room was relatively inexpensive. It is important to note that the purpose of this grow-room technique was to conduct research, not as viable food production, as such a purpose would be cost-prohibitive.
As expected, the silica sand was superior to the vermiculite and Hydrocorn growth media due to its inert nature displayed in its lack of P sorption and desorption (Figure 2) and soil-like physical properties. Hydroponics media such as Hydrocorn and Turface (Profile Products LLC, Buffalo Grove, IL, USA) consist of clay minerals that have an ability to sorb and buffer solution P. For example, Barry and Miller [21] experienced problems maintaining desired solution P concentrations with Turface since it sorbed P from the fertigation solution, decreasing concentrations, and then later increased P concentrations after the P treatment was changed to a lesser input concentration.

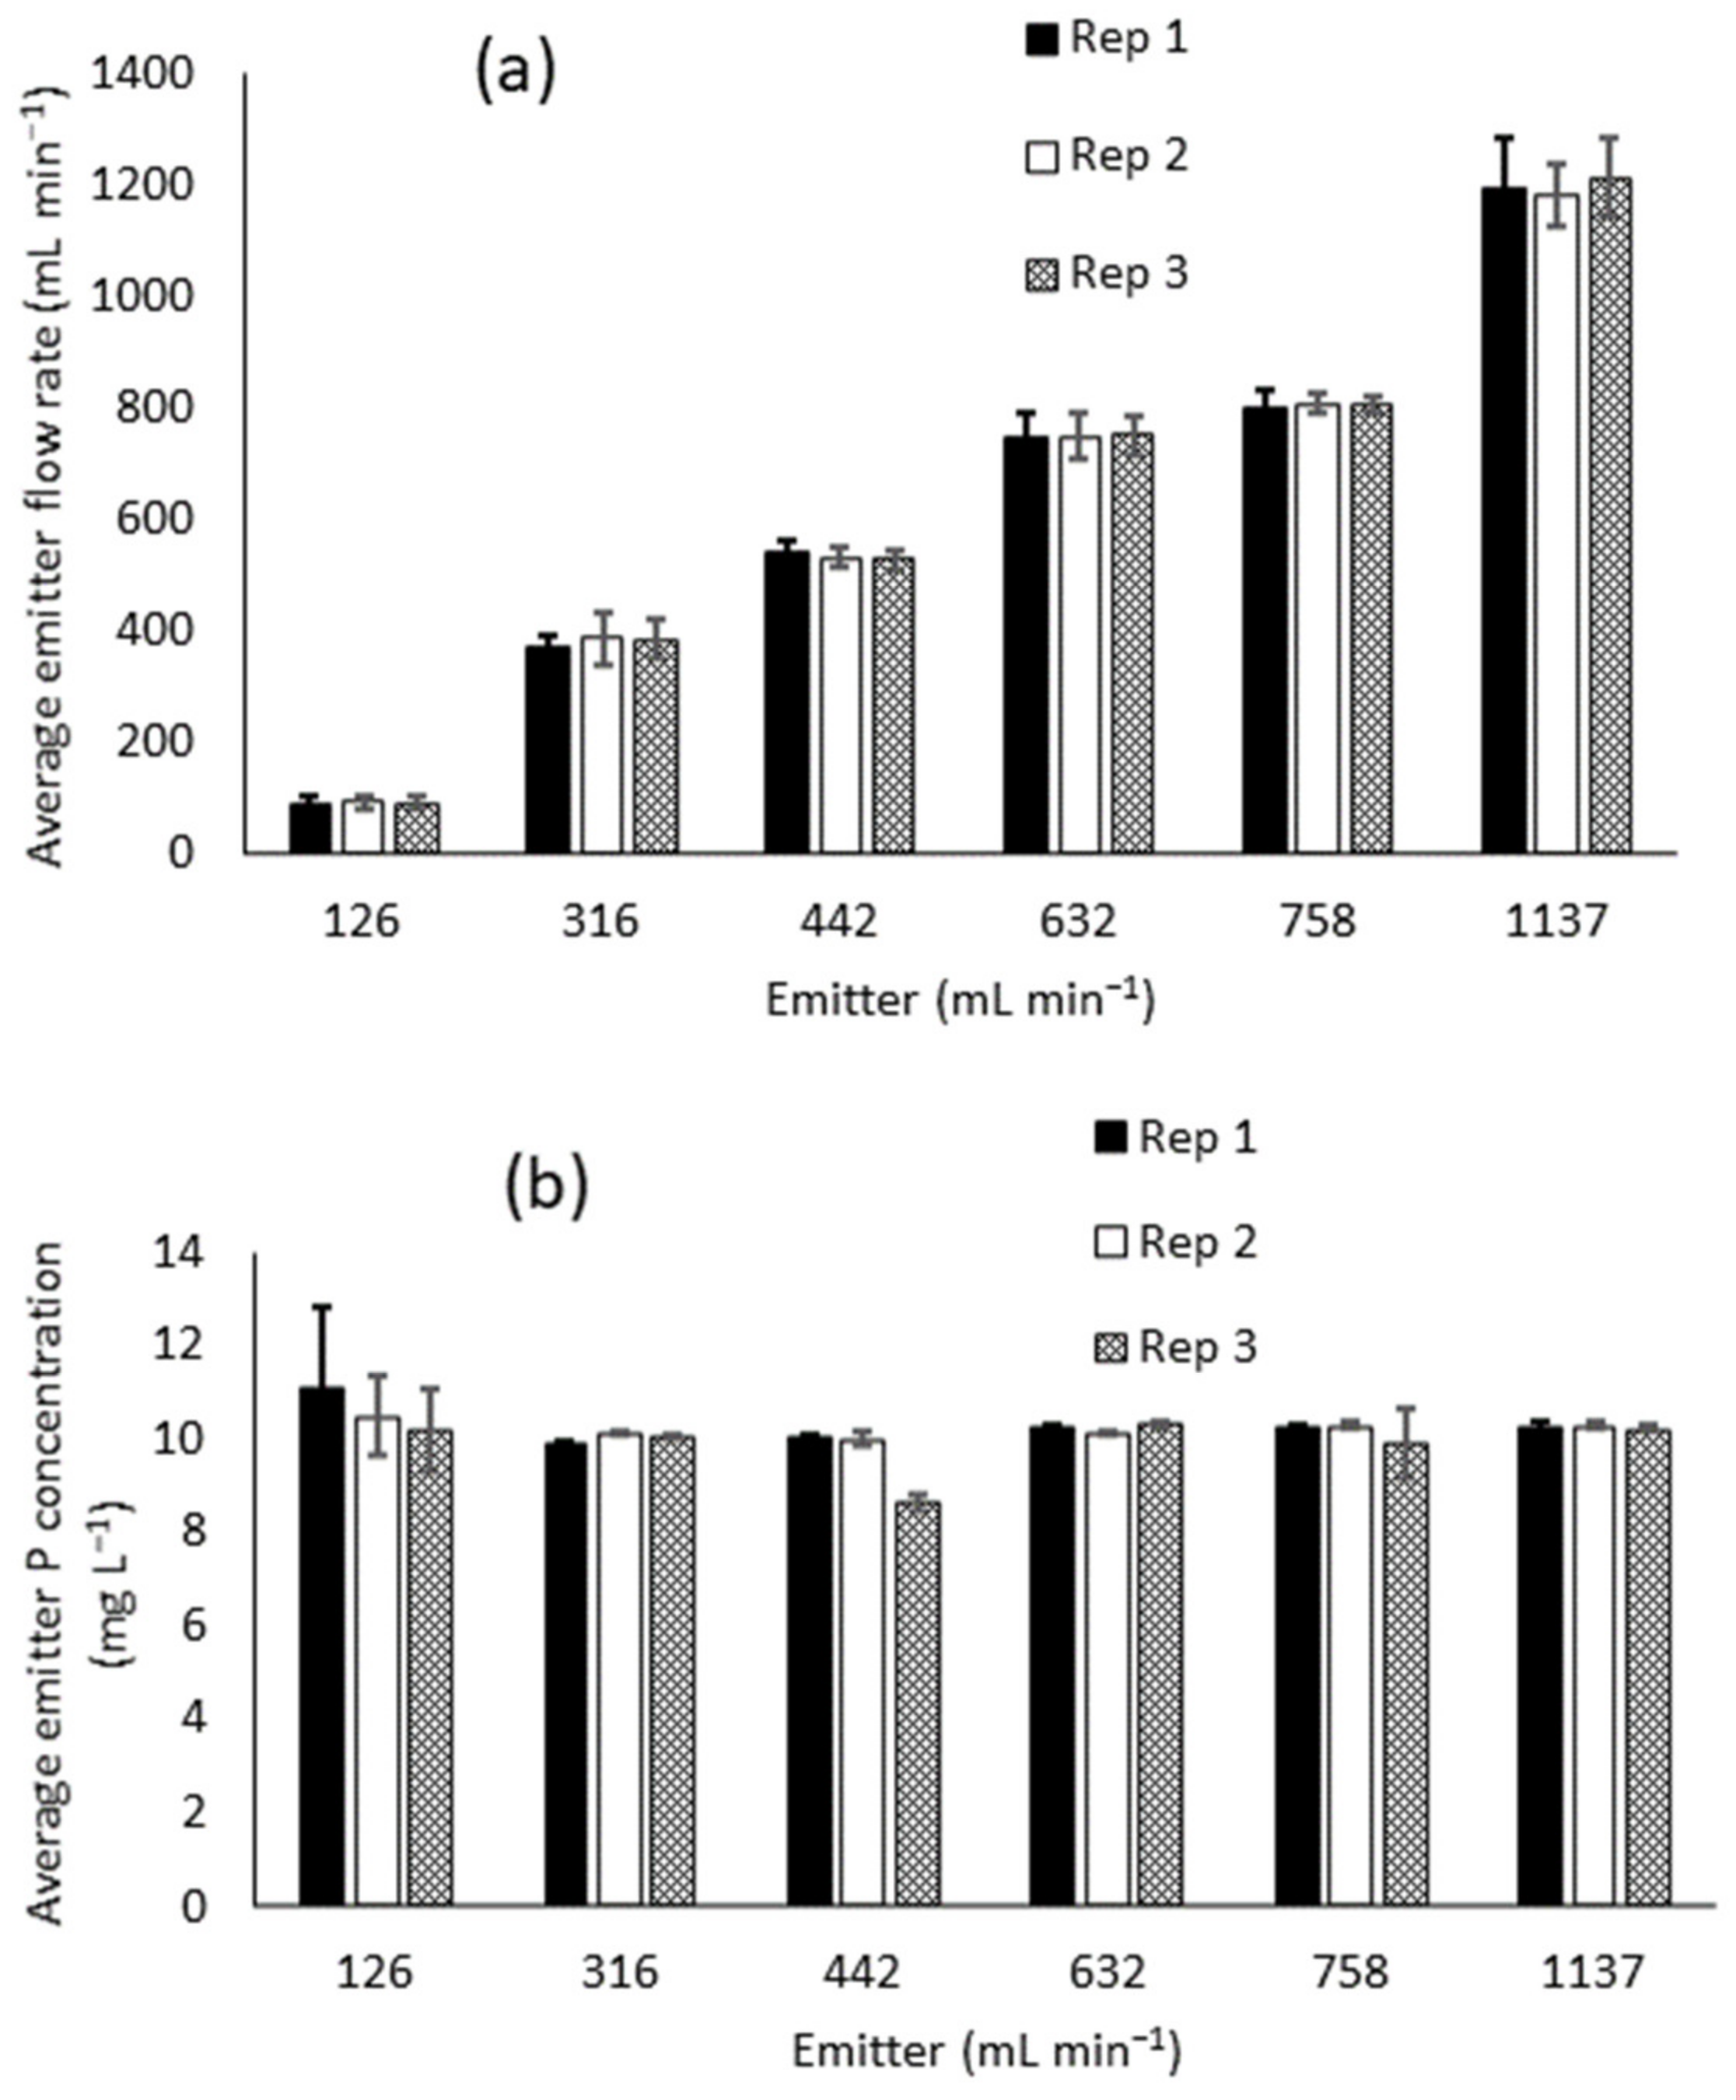
3.1. Emitter Performance

Emitter flow rates showed little variability within the 12 emitters on an irrigation line, although they exceeded advertised rates for all but one emitter (Figure 3). The 5, 7, 10, 12, and 18 gph emitters (19, 26.5, 37.9, 45.5, and 68.2 L h−1) exceeded stated values by 21, 20, 24, 6, and 4%, respectively. In contrast, the 2 gph (126 mL min−1) emitter flowed 88 mL min−1, 70% of the advertised flow rate.
The 2 gph emitter produced the greatest variability in P concentration within the 12 emitters of an irrigation line (Figure 3). The reason for less accurate injection performance with 2 gph emitters was likely due to limitation in flow rate and time of operation, which limits the rate of the piston pumping action inside the injector resulting in variable nutrient injection. At each vertical movement of the piston, which is driven by the flowing water, a dose of concentrate is injected into the flow line, but is not perfectly mixed at lower flow rates. However, with flow moving at higher rates, the piston injects more concentrate per unit time, thereby providing better mixing in one sense. For example, at a low flow rate and short operating time, sample collection may be dominated with the water passing through the injector which has not received the “dose” with the piston movement, or it may be dominated with a slug that has received the dose.
When operating over a long flow or sampling period, these balance out and the resulting solution is well mixed with accurate values; our controlled test was for only one minute to be consistent with the flow time used during fertigation. At high flow rates, on the other hand, the piston dosing action occurs at a much higher rate and acts to provide a better “mixed” final solution. Consistency in P concentration within emitters ranged from an average of 0.09 to 6% difference. The variability observed with 2 gph emitters (average difference of 6%) may or may not be problematic, depending on the context and needs of the study. If the variability in nutrient injection is not acceptable for a given intended use, it can be overcome by either using larger emitter sizes to increase the flow rate to individual plants or by adding more emitters of the same size to a given irrigation line that increases the overall flow through the line. Either of these solutions can increase the total flow rate to improve injector piston pumping action and thereby increase the nutrient dosing accuracy. For the purpose of the growth experiment, the variability of the 2 gph emitter was acceptable.

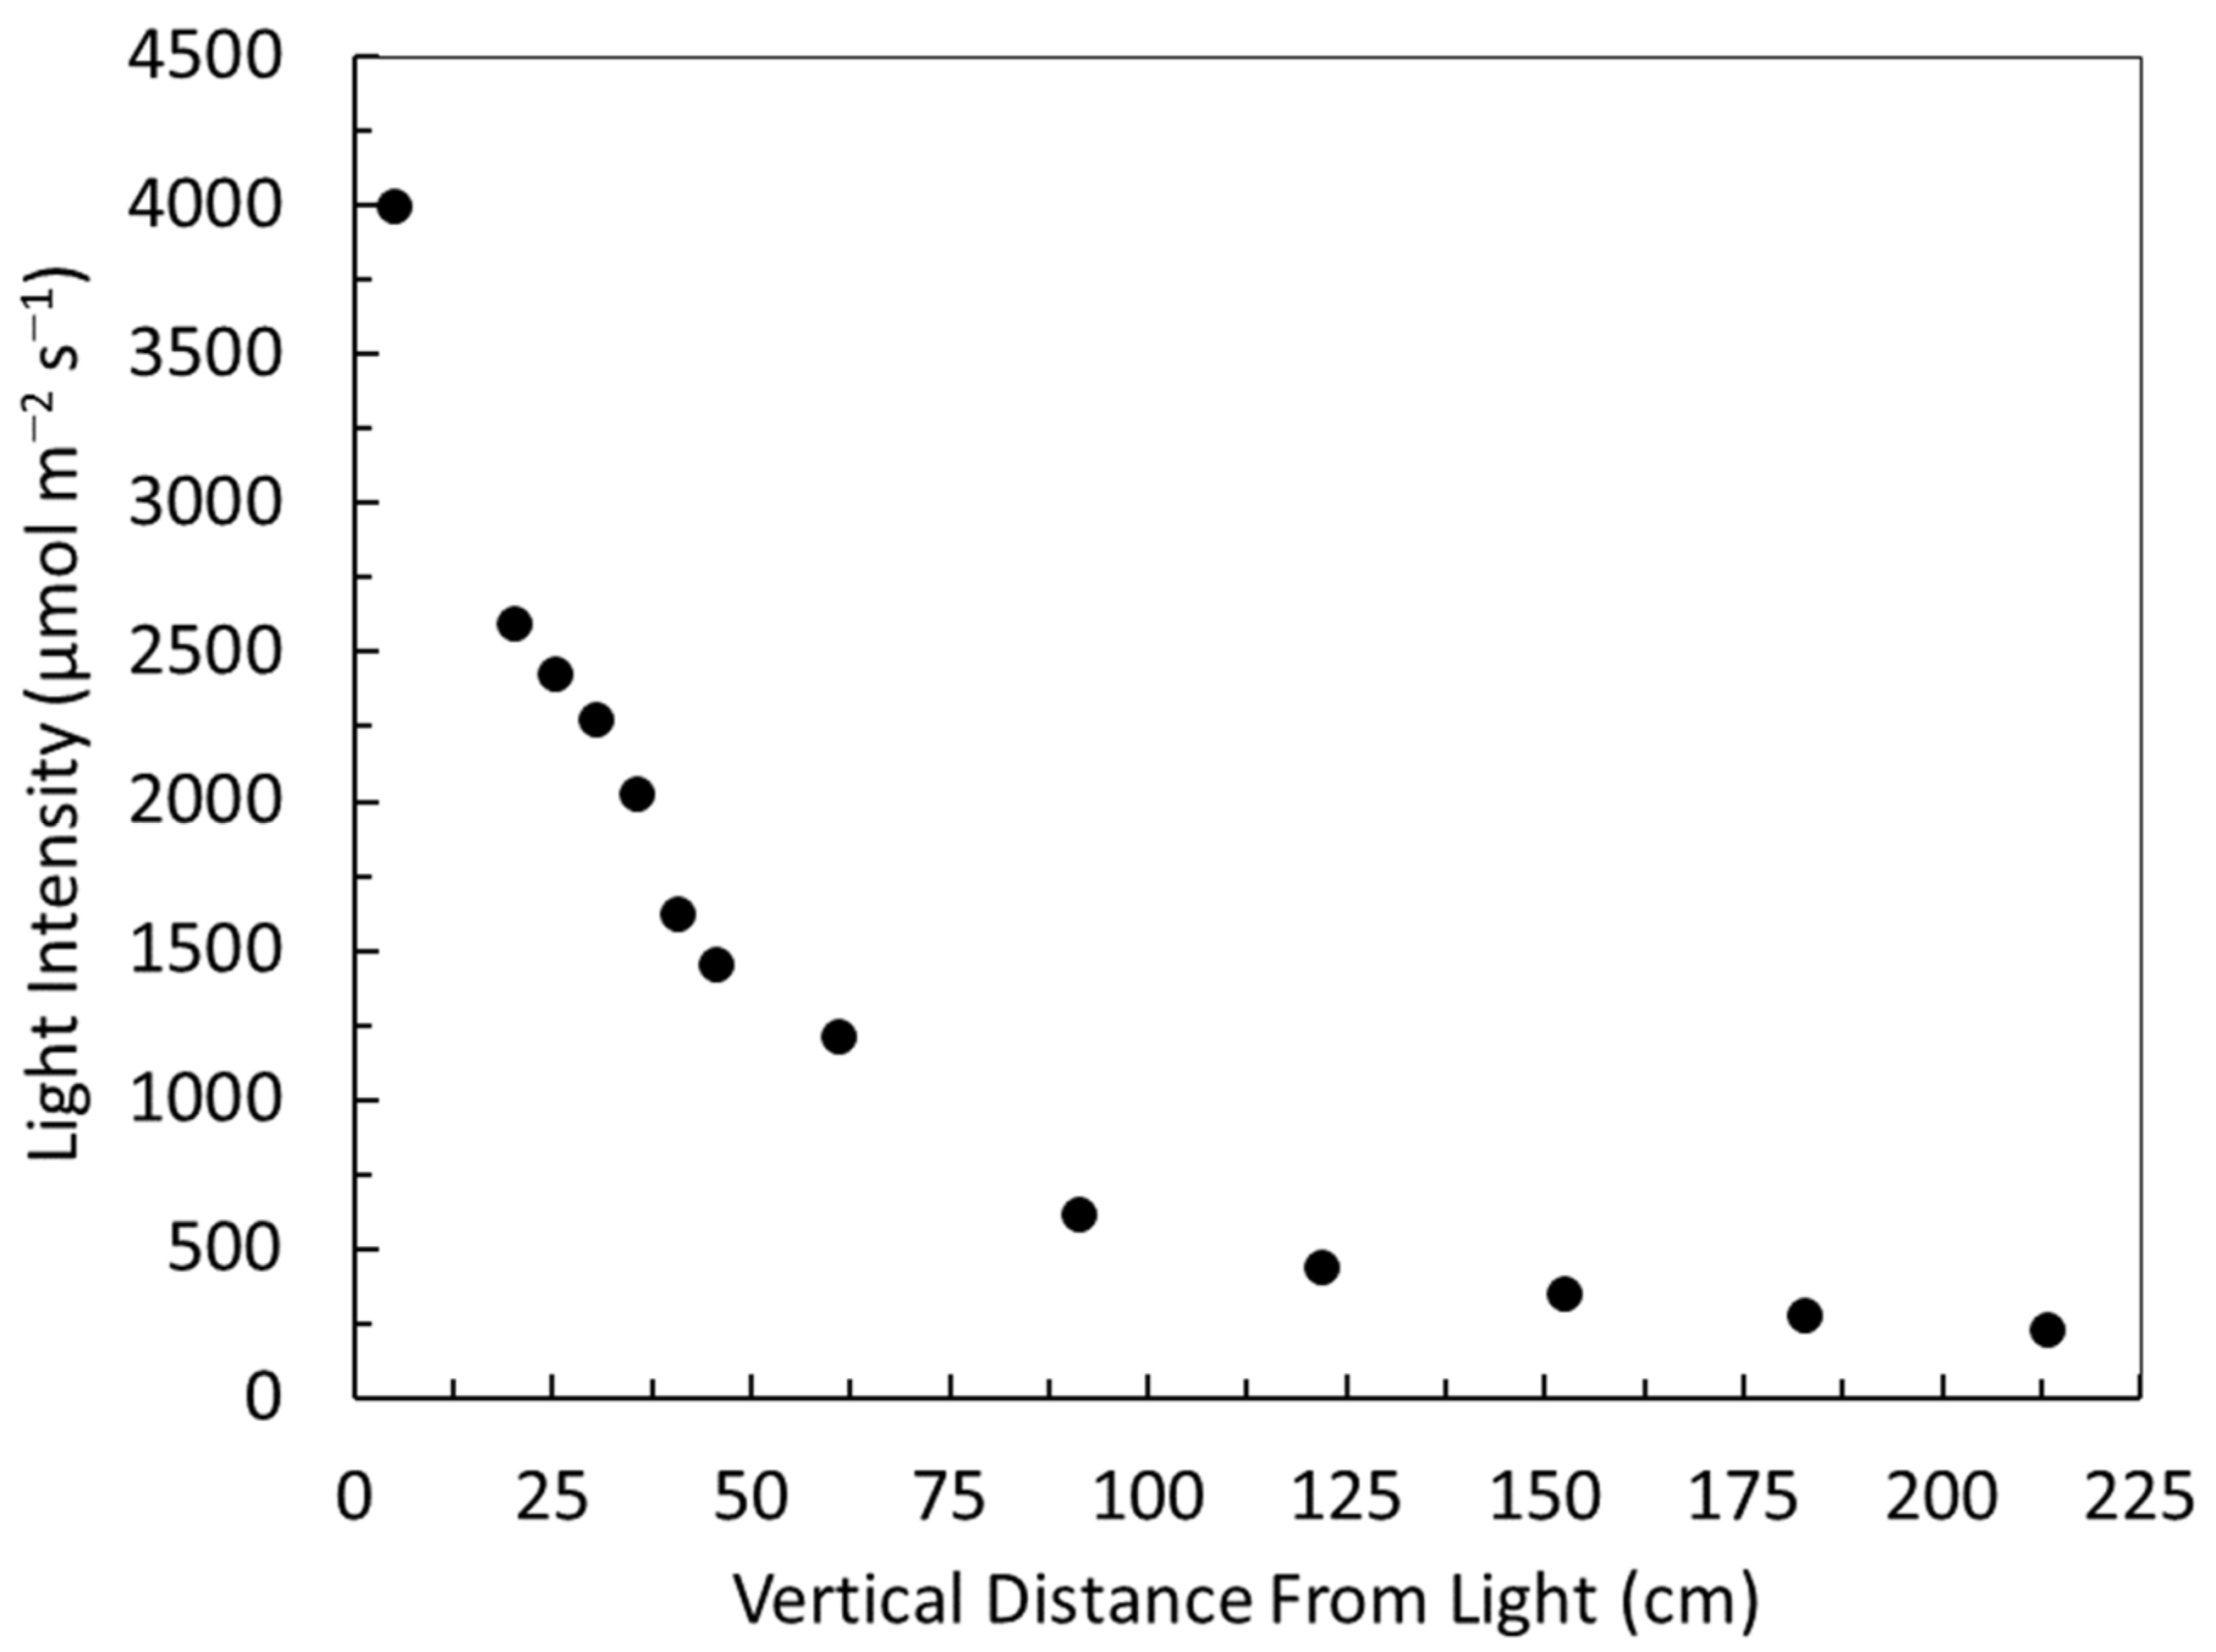
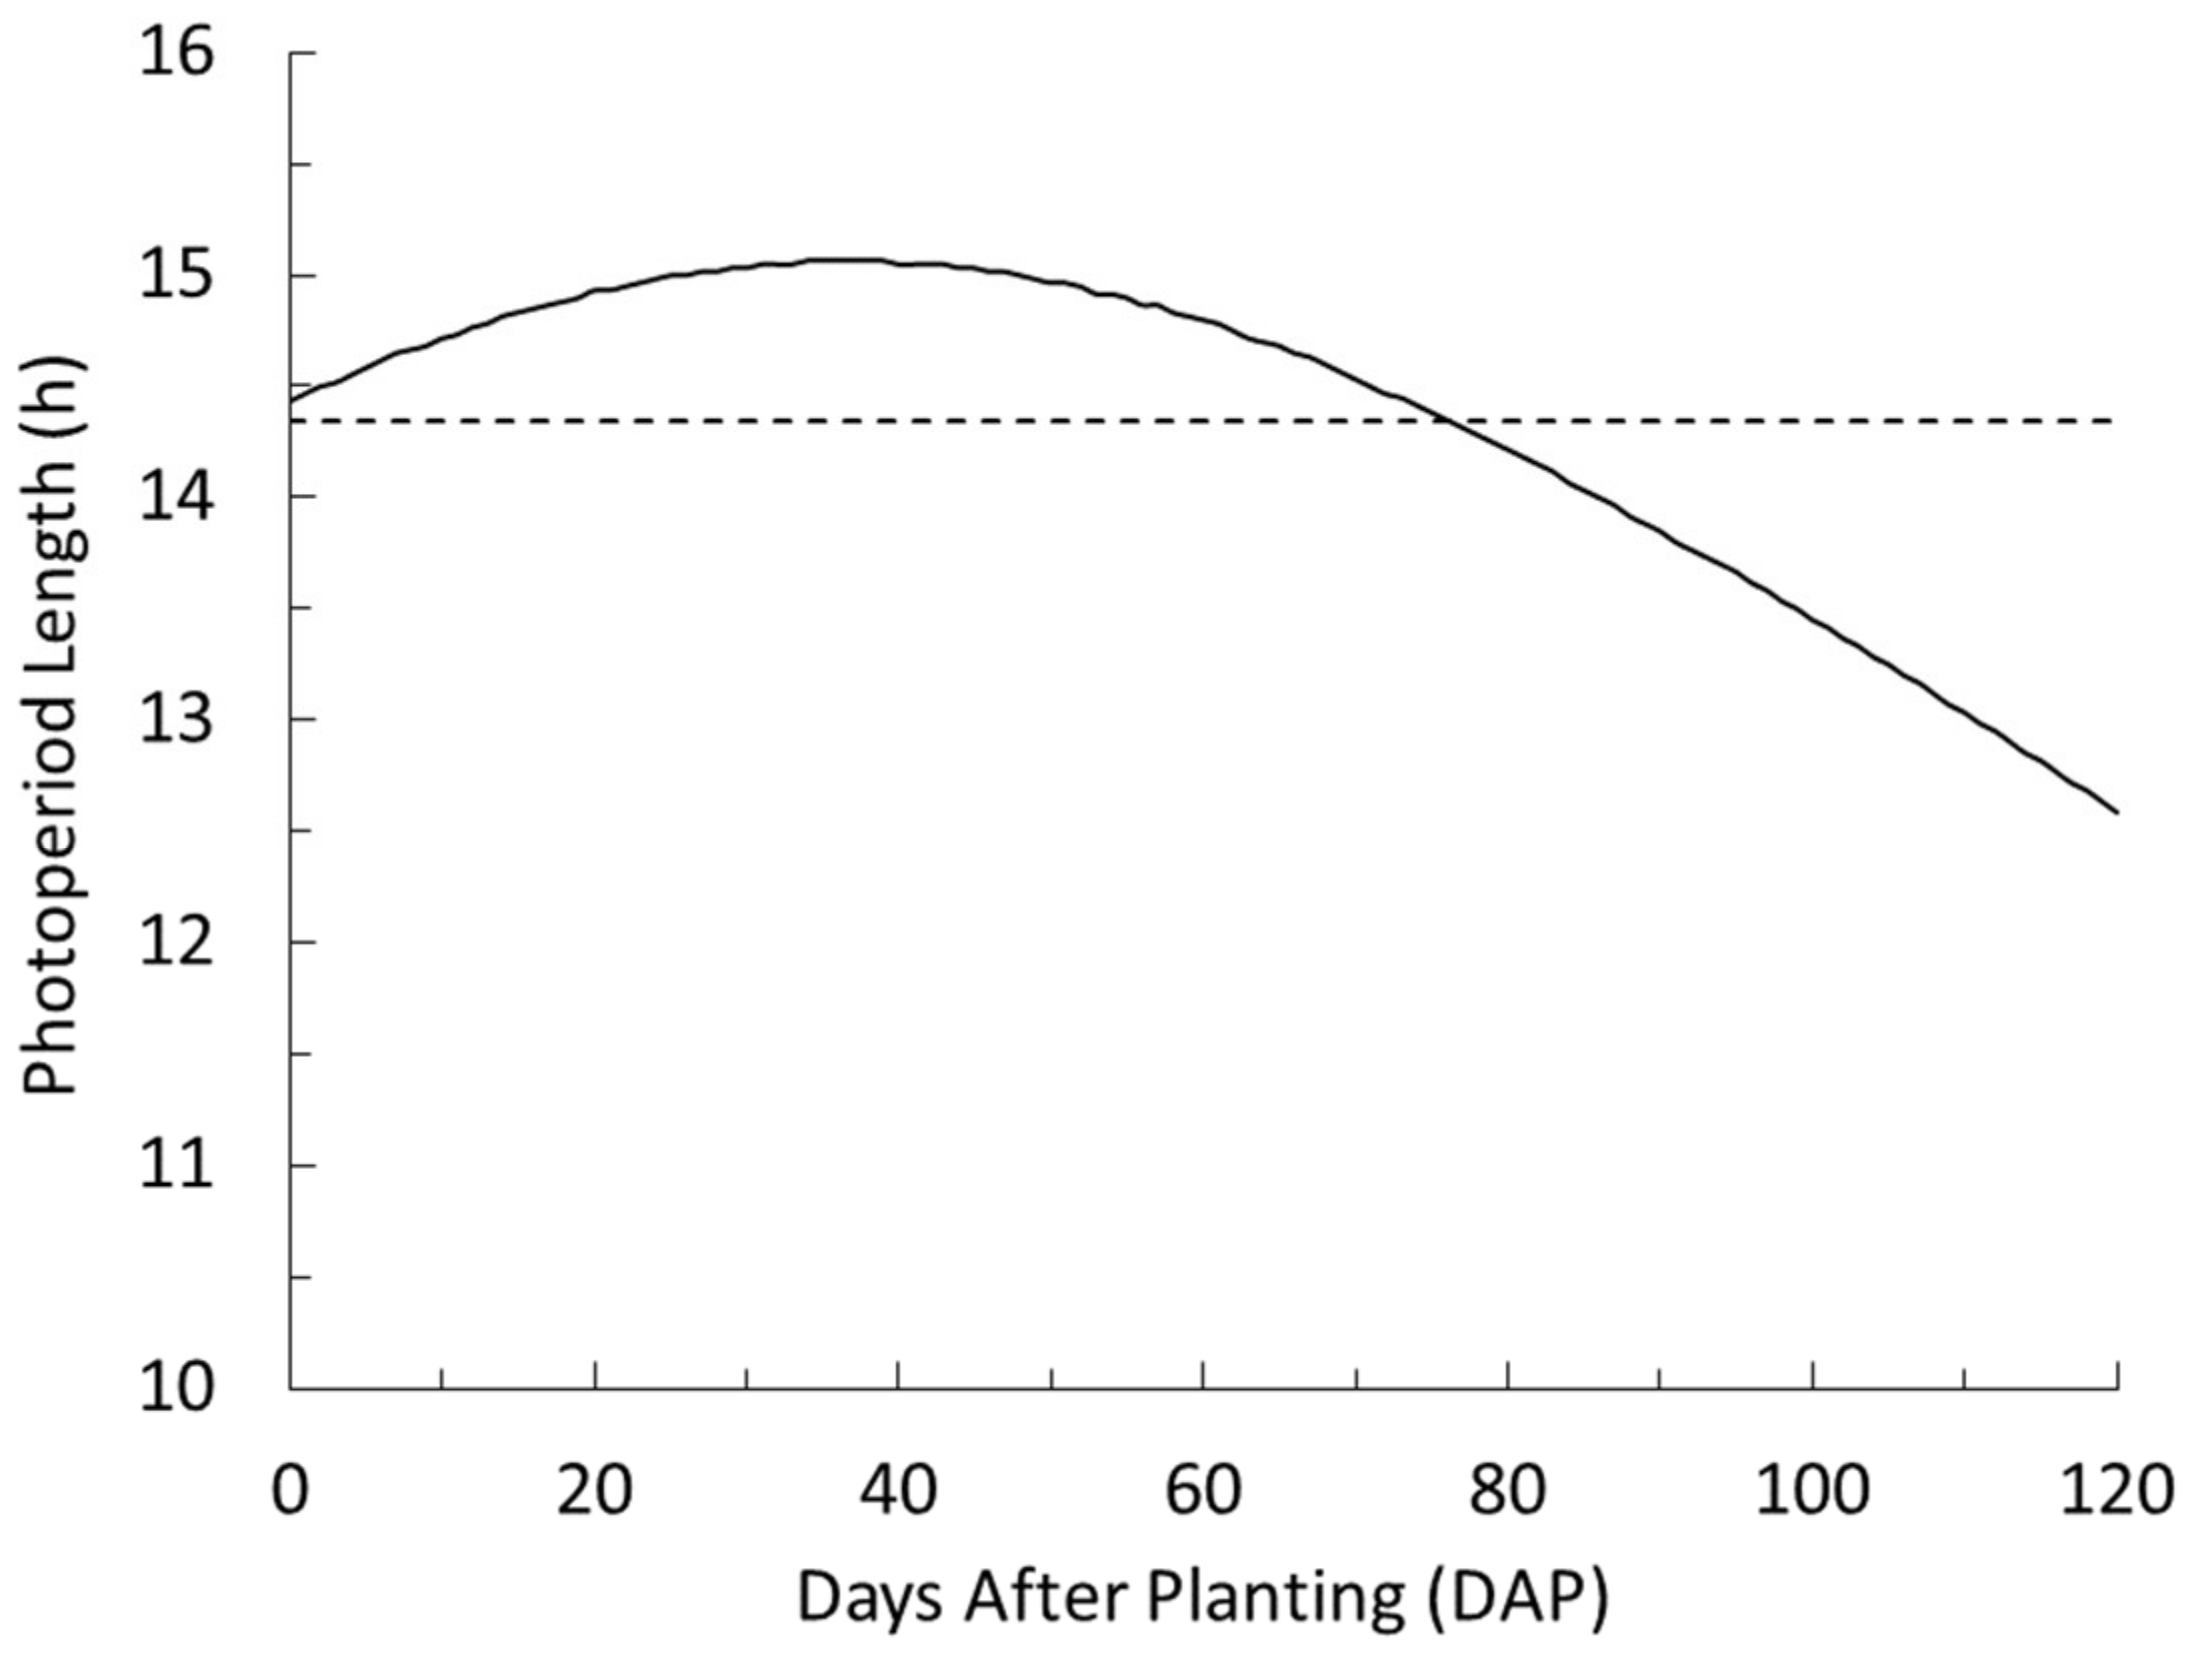
3.2. Light Quantity, Quality, Distribution and Duration

The source of photosynthetically active radiation is likely the most important factor when attempting to grow plants under artificial conditions. When choosing a light source, the most significant aspect is the ability of a light source to produce the desired maximum intensity, while minimizing the heat generated. Secondary and tertiary considerations revolve around more complex considerations of light intensity as affected by distribution of light throughout the plant canopy and light quality (i.e., specific wavelengths (λ) of light output). Improvements in light-emitting diode (LED) lamps allow higher light intensities with less heat output than was possible with traditional metal halide lights [22,23]. This experiment used four banks of LED lights in the grow room that provided the only source of light for the plants (i.e., no sunlight), which allowed for precise photoperiod control.
A more detailed look at how the intensity of these specific LED lights declined in intensity with increasing distance from the light fixture is shown in Figure 4; this illustrates light intensity directly from the fixture before any canopy interception. Detailed light measurements were also taken at R1 at the bottom, middle, and top of each plant (n = 96 for each location; 288 total observations), corresponding to a height within the canopy (from the ground-upward) of 56, 112, and 168 cm. The average plant height at the time of light intensity measurement was 225 cm across all 96 plants. The average light intensity at the bottom, middle, and upper canopy area of the plant was approximately 120, 265, and 855 µmol m−2 s1, respectively. On fully mature field plants at several locations in Xinjiang, China, Xue et al. [24] measured PAR of about 100–200, 175–200, 350–400, 800–900, and 1600–1700 µmol m−2 s−1 above senescing leaves and below green leaves, halfway between soil surface and the ear, ear height, halfway between ear and canopy top, and 20 cm above the canopy, respectively. Measured light intensities around the upper canopy level in the grow room were similar to values reported for field maize [24].
Along with the intensities, the natural photoperiod was also simulated, as opposed to a fixed average number of hours of light per day (Figure 5). The solid black line in Figure 5 represents the photoperiod model simulated, and the dashed line represents what the average photoperiod would be based on all the data points in the curved line, illustrating the high degree of variation from the single constant value. A constant photoperiod is typically applied to greenhouse studies and some growth chambers, typically 14 h [5]. This realistic simulation of the changing natural photoperiod is necessary for production of field-similar plant yields, whereas constant excess supplemental lighting will produce abnormally high yields [25]. When using an average fixed length photoperiod instead of simulation of a natural changing photoperiod, the plant will receive more or less light than it normally would at different growth stages. For example, if this experiment had used a fixed average photoperiod, it would have deprived the plant of light at early growth stages and oversupplied light for the VT and R growth stages. This directly affects plant assimilation which partly determines yield, as grain biomass is largely dependent on post-silking photosynthesis [26,27,28].

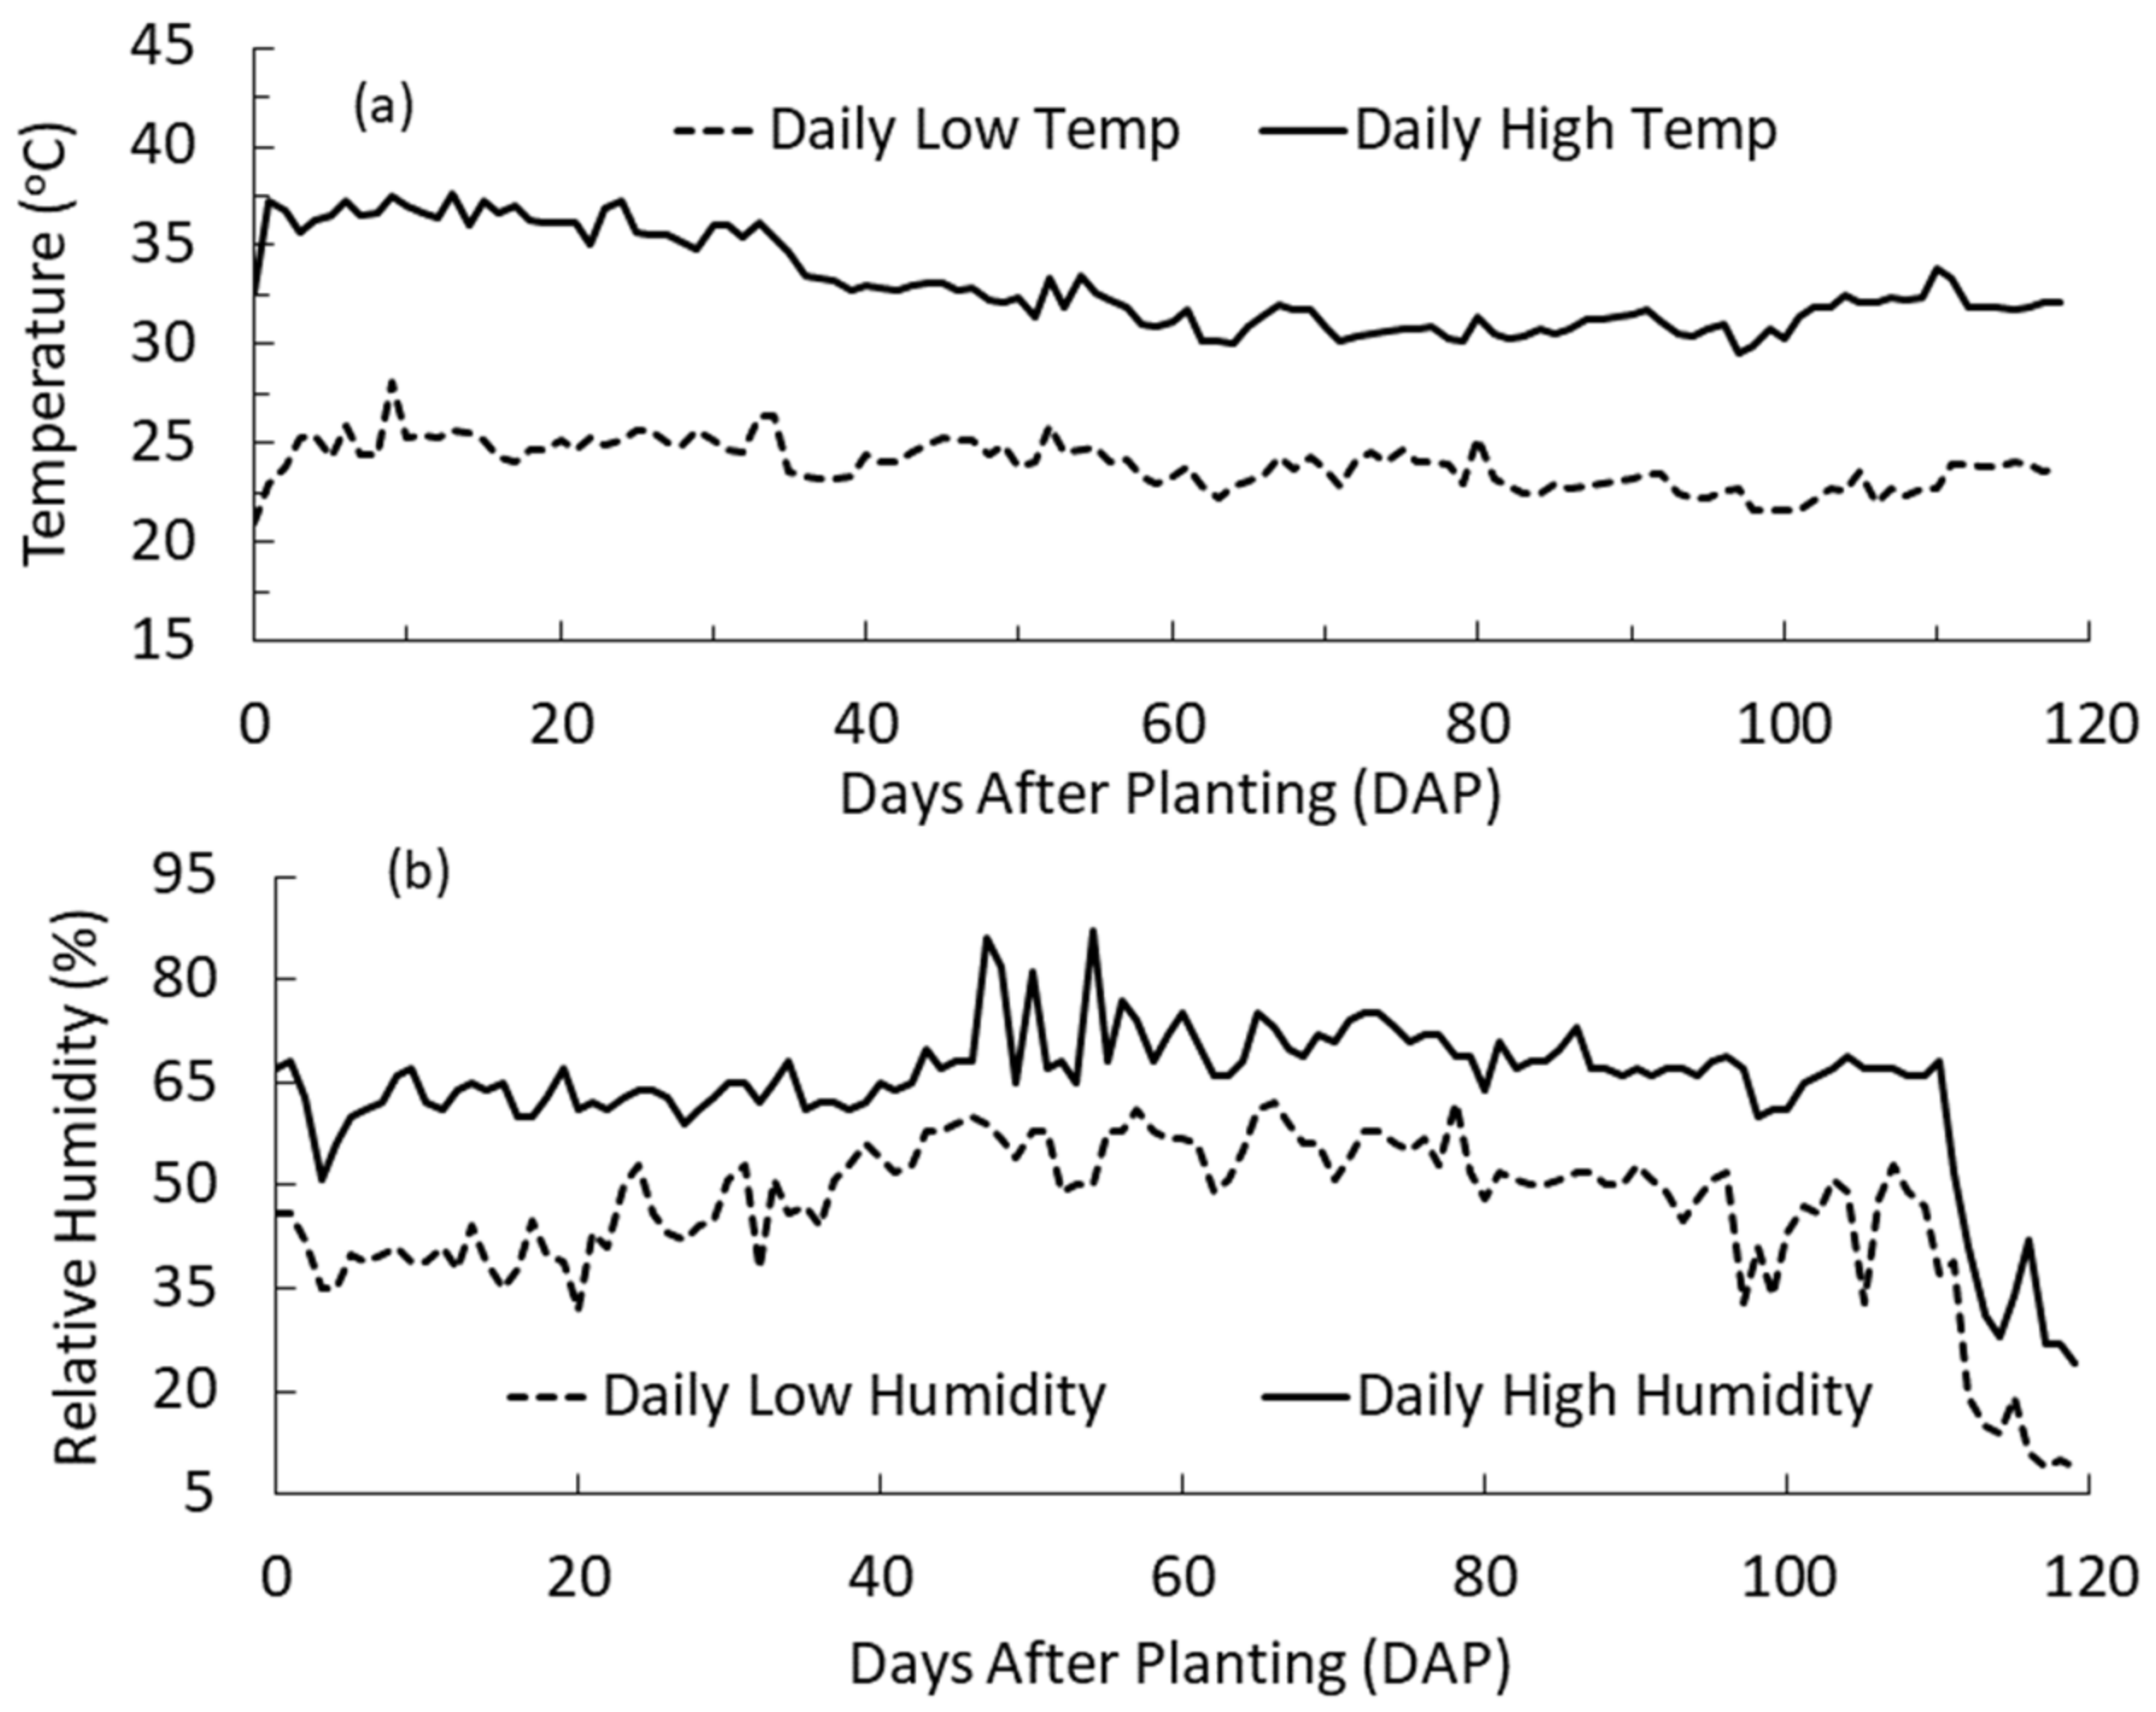
3.3. Temperature, Humidity and Air Exchange

Temperature is one of the most difficult conditions to manage in a grow room because of the high heat output of lights. Although the heat output of LED lights is considerably lower than traditional lighting options, the temperature at an LED light fixture can still approach 40 °C. In this study, daytime temperatures were targeted to be maintained between 25 and 35 °C. On most occasions, this ideal range was maintained and temperatures were stable around 31–32 °C. Daytime temperatures in the 25 to 35 °C range were successfully lowered at night with AC units, achieving nighttime temperatures between 18 and 22 °C to simulate natural diurnal variations. Temperature management was slightly affected by the outdoor environment following a seasonal pattern from planting until harvest (Figure 6a). For example, consistent outdoor temperatures of >33 °C early in the experiment (mid to late June) impacted the temperature inside the building, particularly the lung room from which air was drawn from for the grow room; this caused the grow room temperature to be elevated early in the experiment (Figure 6a). Daily temperatures always met or exceeded the maximum effective temperature for maize growth, allowing for near maximum accumulation of growing degree units each day. One might consider to also adjust maximum/minimum target temperatures seasonally in future research.
Managing humidity is interrelated with managing temperature and light. When plants are grown with high light intensity, it is crucial for RH to be ≥40% [5]. For this experiment, two humidifiers were operated under the control of a humidistat set at 65% RH. Setting the humidistat to 65% achieved an average humidity for a 24 h period of around 50%. It is important to keep in mind that an AC unit condenses a great deal of water vapor from the air, which explains why the average humidity for a 24 h period was sometimes less than the humidistat setting. This can generally be considered a fortuitous interaction because removing moisture from the air helps prevent possible dew formation when the temperature is cooling down at night, while simulating a diurnal temperature variation. Figure 6b shows the degree of diurnal differences in RH during the growth experiment due to the combined effects of temperature management and moisture addition (greater RH occurred at night).
Air exchange and movement is much simpler to control than temperature and humidity. The rule of thumb for air exchange is generally that the exhaust fan should be capable of exchanging the entire room’s volume in approximately 1 min. Exhaust fans can also be wired to temperature sensors in an effort to help dissipate heat; but keep in mind that this removes a great deal of moisture from the air as well, which can make it difficult to maintain the desired humidity. The exhaust fan should be timed to operate periodically for an interval long enough to exchange all the air in the room for the purpose of replenishing the atmosphere with CO2 and O2. This was particularly important in our case since our room was well sealed. Although CO2 concentration was not logged, a reading was hand-recorded from the sensor each day; the concentration was never below 350 ppm. As far as air movement within the grow room is concerned, 3 to 4 large oscillating fans were used 21 h per day. These fans were intended for air mixing and providing spatially uniform temperature, gas, and humidity, but they also provided adequate artificial wind simulation so that all plants were as structurally sound as a field-grown plant [29,30]. All plants had normal development of brace roots with no lodging.

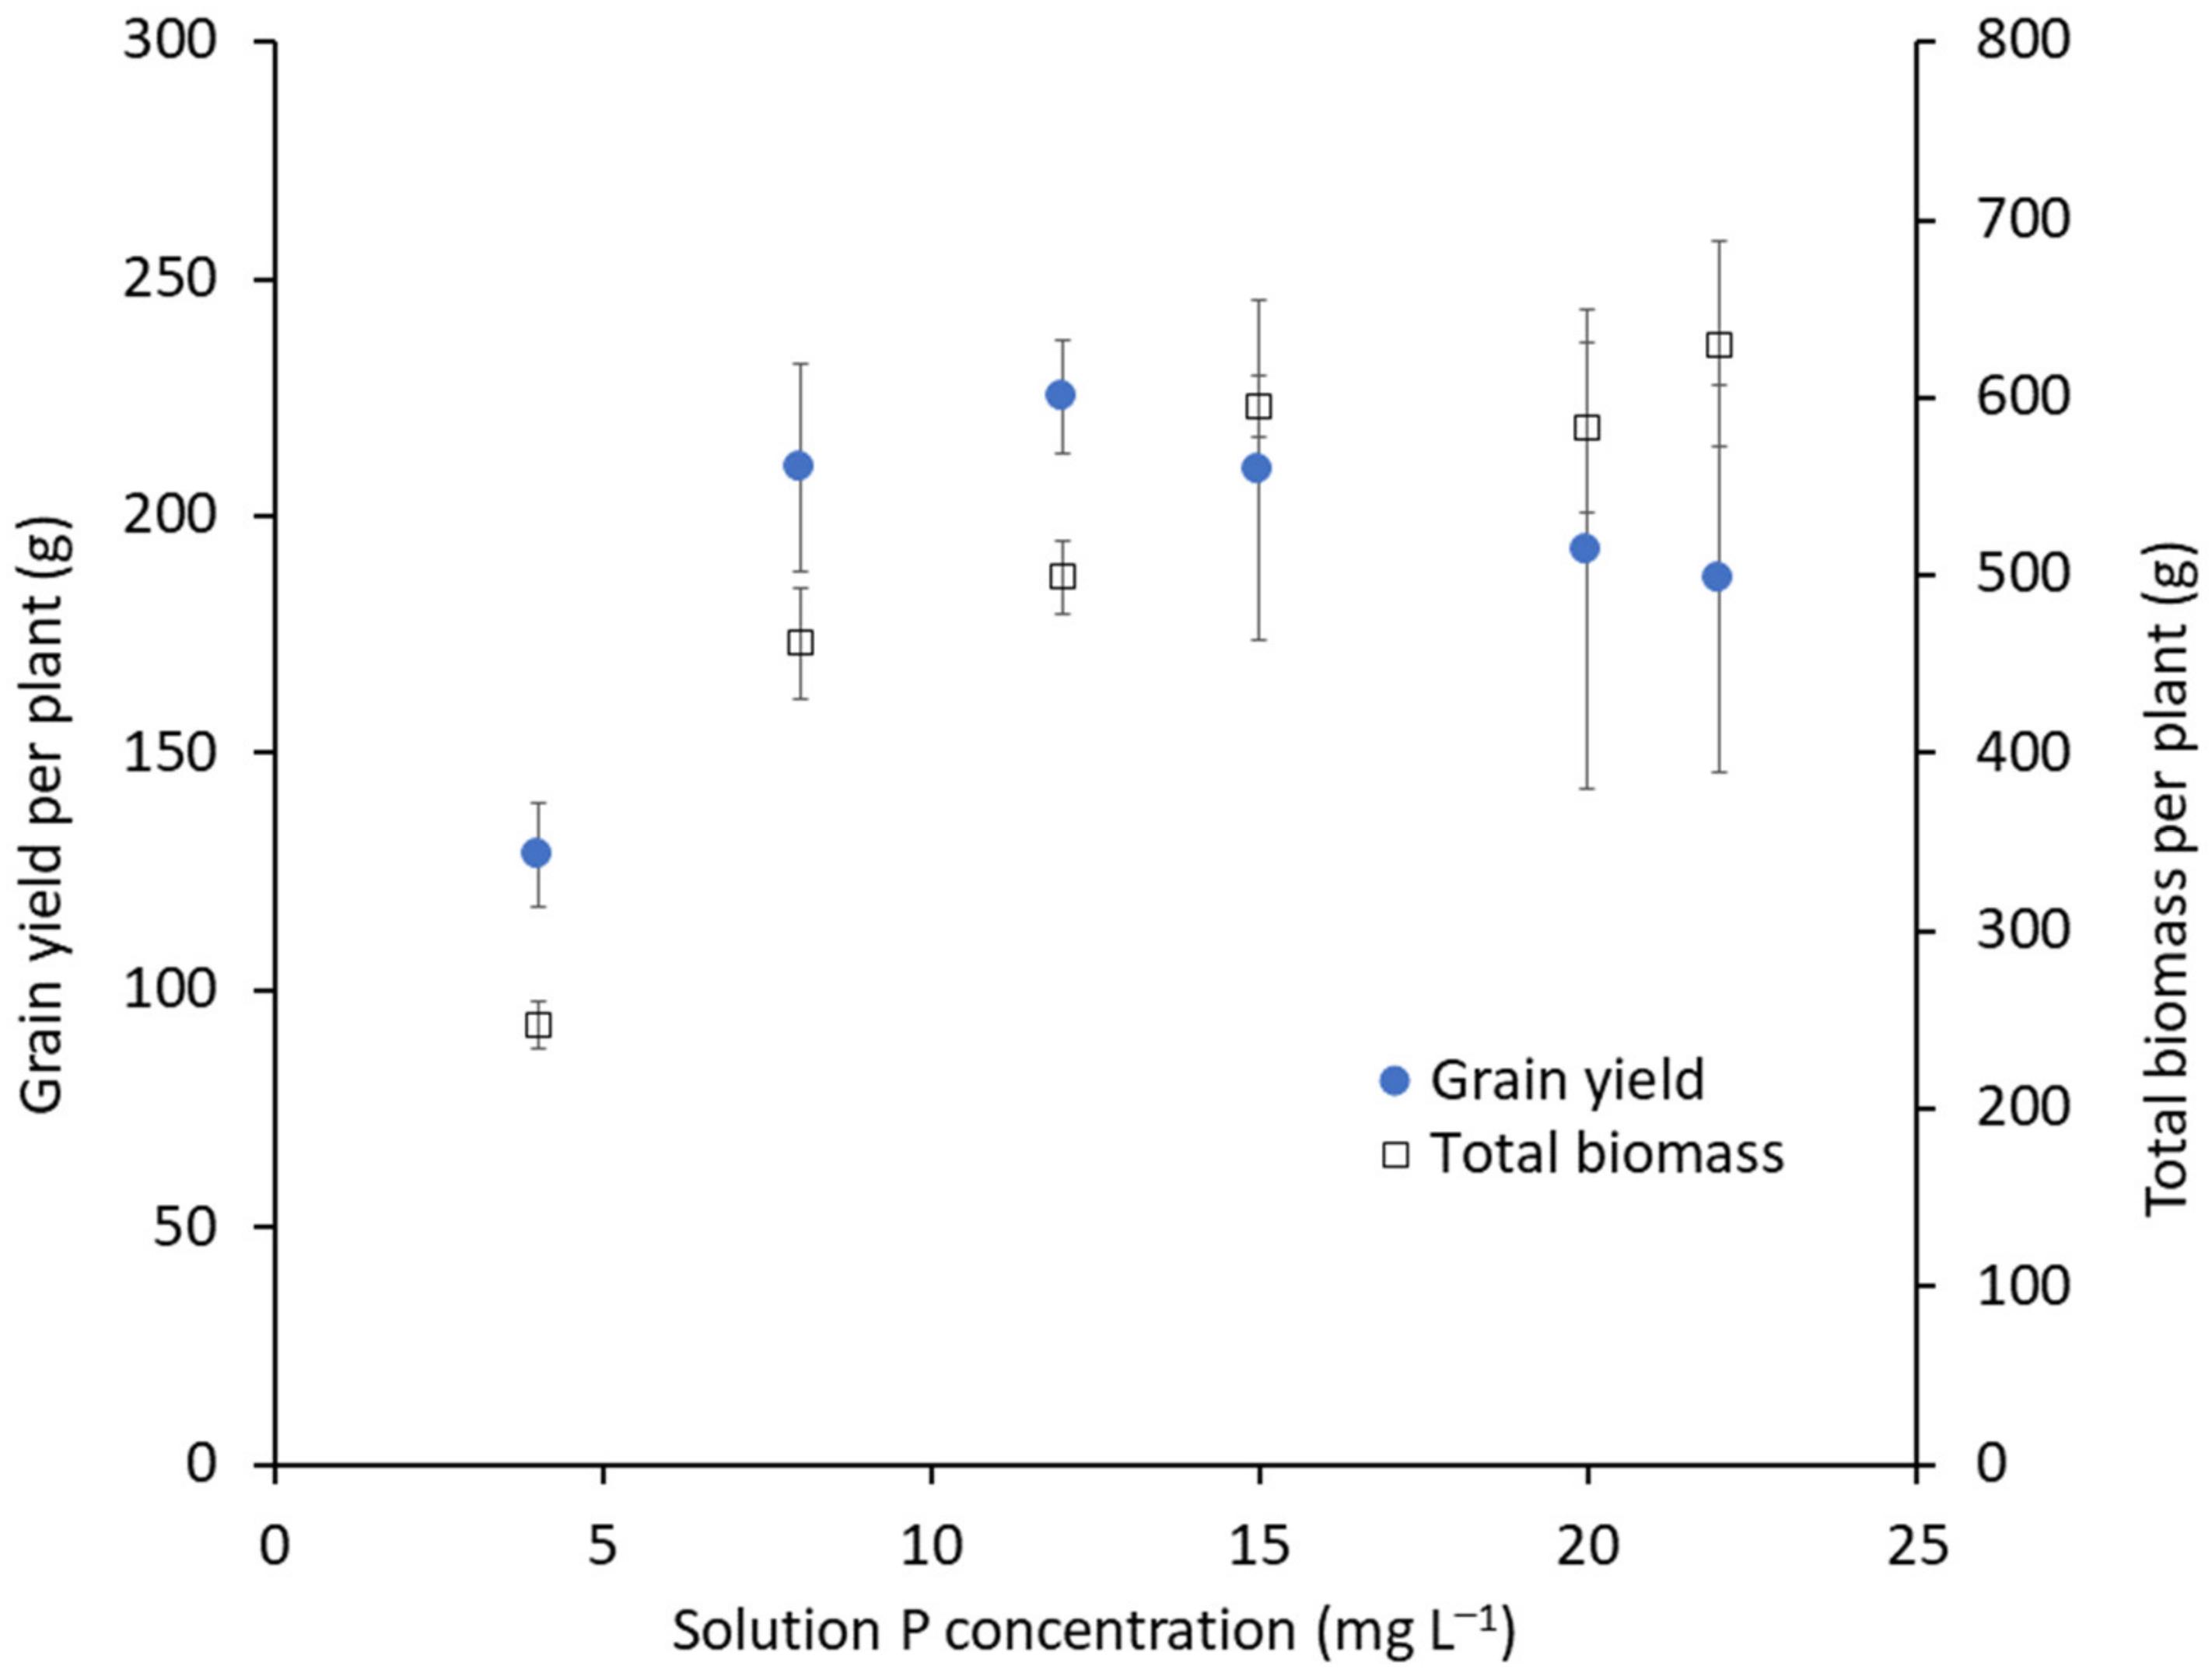
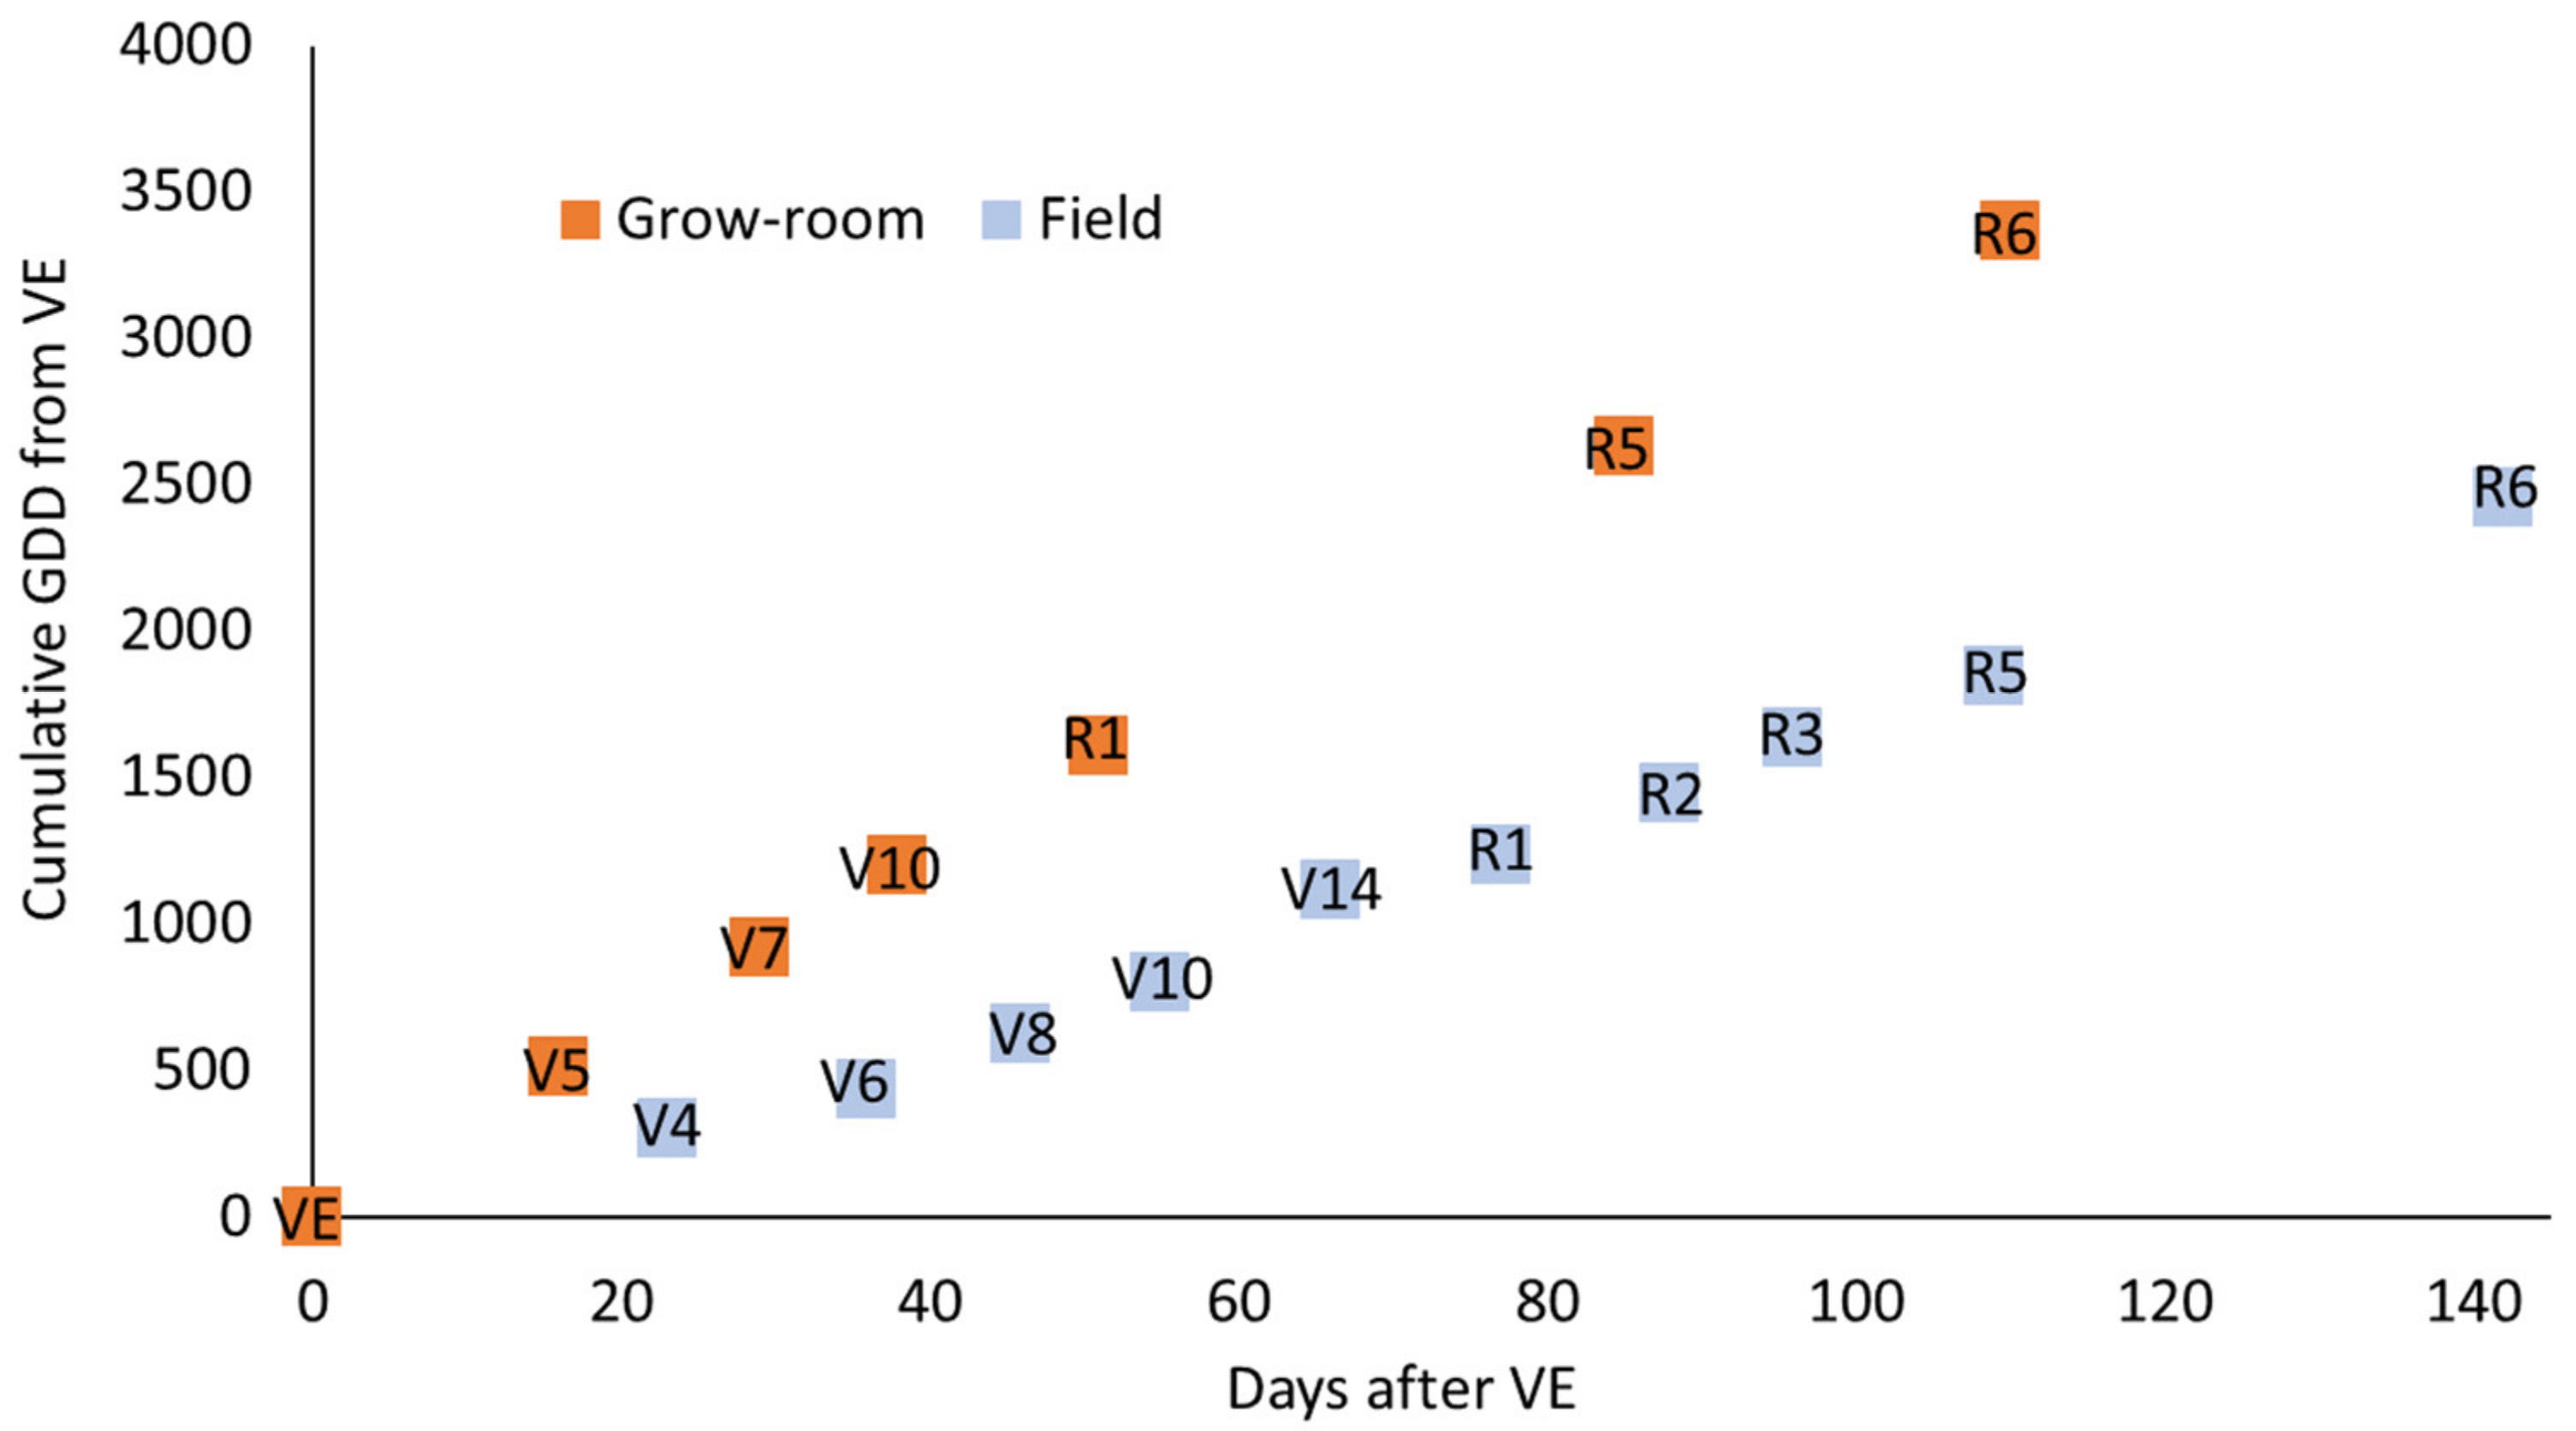
3.4. Plant Performance Data

Plants were grown with a range of P treatments from 4 to 22 mg P L−1. Figure 1 shows plant arrangement in the grow room and photographic growth progression over time in conjunction with the components of the system. Overall, the plants appeared normal compared to field-grown maize, although they reached several growth stages in a shorter calendar time compared to field plants. Figure 7 shows the progression of GDD accumulation from days after emergence (VE) in which V5, V7, V10, R1, R5, and R6 were achieved. For example, grow-room plants reached V10 at 38 d compared to Abendroth et al. [31], who listed 55 d as the typical value. The higher growth rate of grow-room maize was due to the greater accumulation of GDD occurring over a shorter time period; for example, GDD was about 1200 at V10 compared to a value of 800 as reported by Abendroth et al. [31]. The ideal temperature, moisture, and light intensity conditions of the grow room allowed plants to mature at a faster rate than field-grown plants.
Plants clearly responded to P treatments as expected, with an increase in both biomass and grain yield (Figure 8); this illustrates the utility of this system for nutrient studies. A primary goal of this experiment was to establish the minimum mass uptake of P required to achieve maximum grain yield. However, the objective of this paper is to establish and present the methodology for successful and realistic maize growth in a controlled environment; therefore, P treatment-specific data are not discussed in detail and will instead be presented elsewhere. Grain yield from the 8 mg P L−1 treatment was significantly greater (p < 0.05) than lesser P concentrations, but not different from the higher P treatments. Therefore, all results and discussion of data focus on plants from the 8 mg P L−1 treatment (averaged over three maize hybrids and four replicates), as this treatment coincided with the grain yield plateau (Figure 8). Results of the linear-plateau analysis showed that the “breakpoint” P concentration in which no further increases in concentration would increase grain yield was 7.8 mg L−1 (p < 0.001). However, further increases in solution P concentration continued to increase total biomass until a P concentration of 14.4 mg L−1 (p < 0.001). This suggests that crop genetic potential limited the grain yield while the plant was able to continue to produce further biomass with more added P. Measurements at harvest (R6) of plant tissue mass, plant height, canopy width, harvest ear height, and stem diameter are shown in Table 3. Grain yield was normalized to a field environment by expressing as equivalent yield in kg (grain or biomass) 1000 plants−1. The average grain yield across all hybrids in the 8 mg P L−1 treatment group was 210 kg of grain yield per 1000 plants. At the typical planting density of 79,000 plants ha−1 for Indiana, this equals 16.4 Mg grain ha−1, which exceeded maize grain yields at the national (US), state (Indiana), and county (Tippecanoe) level from 2009–2019. The maximum yields recorded in each of those categories occurred in different years and were 11.1, 11.9, and 13.0 Mg ha−1 for 2017, 2018, and 2014, respectively, for US, Indiana, and Tippecanoe Co. [32]. This yield comparison is made possible by using yield and plant populations given by the USDA-NASS and the findings of Nielsen et al. [33] which found that maximum maize yields were obtained at a final harvest stand of approximately 79,000 plants ha−1 and that final crop yields varied by only +/− 2.5 bushel ha−1 at plant populations that ranged from 69,000 to 86,000 plants ha−1. Boomsma et al. [34] reported several plant parameters from a study in Indiana that investigated N rates and plant density. Grain yield (15.5% moisture) ranged from 125 to 225 g plant−1, in comparison to the mean of 210 g plant−1 found in the current study. Several other studies reported similar field-grown grain yield: Greveniotis et al. [35], Karlen et al. [36], Woli et al. [37], and Bender et al. [38] reported 202, 174, 176, and 153–164 g plant−1, respectively.
Field studies generally do not include root biomass in reporting total biomass. The mean biomass at the optimum P concentration in this study, not including roots, was 367 g plant−1, which was somewhat greater than field-grown values reported by Boomsma et al. [34], Karlen et al. [36], Woli et al. [37], and Bender et al. [38] at values of 200–375, 288, 250, and 247–282 g plant−1, respectively. Because the grow-room maize tended to produce similar grain yield but slightly greater above-ground biomass, harvest index values were lower compared to field-grown maize. For example, Boomsma et al. [34], Robles et al. [39], and Bender et al. [38] reported 0.55, 0.53–0.56, and 0.48–0.54, respectively, compared to the mean value of 0.48 for grow-room maize. The lower harvest index value for grow-room maize compared to field-grown maize appears due to production of similar grain yield, but much greater above-ground biomass for the former. Further comparison of other plant parts may explain this observation.
Leaf biomass for grow-room maize was appreciably greater than field-grown maize: Karlen et al. [36], Swanson and Wilhelm [40], Overman et al. [41], and Woli et al. [37] reported only 50, 36–51, 27, and 30 g plant−1, respectively, compared to 82 g plant−1 for grow-room maize. Stem mass was also larger for grow-room maize at 109 g plant−1 compared to 92–130, 54, 58, and 66 g plant−1 reported by Swanson and Wilhelm [40], Overman et al. [41], Karlen et al. [36], and Woli et al. [37]. Stem diameter, however, was similar for grow-room maize at a mean of 26.1 mm compared to field-grown reported by Boomsma et al. [34] and Robles et al. [39] at 21–27.5 and 22–25 mm, respectively. Similarly, plant height of grow-room maize (mean of 230 cm) was similar to Indiana field-grown maize reported by Boomsma et al. [34] and Robles et al. [39] at 230–262 and 193–207 cm. Based on the grain yield, total biomass, and above-ground plant components, it appears that the harvest index is slightly lower for grow-room maize than field-grown because the former produced similar grain yield, but also a denser plant that possessed greater leaf and stem mass, yet similar height and stem diameter.
Studies quantifying total root biomass of mature maize in the field are rather limited. Mengel and Barber [42] conducted a root study on field-grown maize on a Chalmers silt loam by two different methods: soil cores and whole-plant excavation. A greater root mass was determined by whole-plant excavation with a maximum root mass (fresh weight) of 330 g per plant. Dry root mass for this study is reported in Table 3, with a mean of 94 g per plant; since root moisture content was consistently 70%, this makes the mean fresh weight of 313 g per plant comparable to that of Mengel and Barber [42]. Other field studies have reported much less root mass, but it is likely that the entire root system was not excavated in those cases [43,44,45].
Nutrient concentration of grow-room maize plant tissues (Table 4) were comparable to those in field-grown plants. Heckman et al. [46] studied grain nutrient concentrations of maize plants for a combined total of 23 site years across five US states and a variety of soil types. The authors analyzed the grain nutrient content for all plant macro- and micro-nutrients, with the exception of Mo. Their findings demonstrated the wide range of nutrient concentrations that could occur within maize plants of the same hybrid.
Grain from grow-room maize plants fell within all expected nutrient concentration ranges given by Heckman et al. [46] and Bender et al. [38], with the exception of N, S, and Ca. Nitrogen content in grain was slightly elevated (19.5 g kg−1) compared to what was found by Heckman et al. [46] and Bender et al. [38], who reported 13 and 14 g kg−1, respectively. This is likely an indication of luxury consumption and emphasizes the impact of nutrient delivery timing, particularly in an environment where N was continuously added throughout the entire growth cycle, unlike field-grown maize where the amount of plant available N decreases drastically with time from application. Sulfur was only slightly higher (1.4 g kg−1) than values from Heckman et al. [46] and Bender et al. [38], at 1.1 and 1.25 g kg−1, respectively. Grow-room maize plants had mean grain Ca concentrations of 0.02 g kg−1. It is not known why Ca grain nutrient concentrations were less than those reported in previous studies [46,47,48]. Calcium deficiencies were never visibly observed in grow-room plants at any growth stage, and yields were well within what is typically observed in the field. Additionally, the mean leaf Ca concentration (6.8 g kg−1) of grow-room maize plants were within sufficiency level between 6.1 to 15.0 g kg−1. It is interesting to note that grow-room Ca grain concentrations were similar to those reported by Codling et al. [49], Avila-Segura et al. [50], and Duarte et al. [51]. Total nutrient analysis via chemical digestions are almost always analyzed on ICP-AES, but precise measurements of multiple nutrients can only be determined if analyzed at several different dilutions. For example, analysis of P requires an appreciable dilution, but analysis at that same dilution would not be suitable for trace nutrients and grain Ca; a lesser dilution or zero dilution is required for elements found in such low concentrations. Perhaps the lower grain Ca concentrations reported in this study, Codling et al. [49], Avila-Segura et al., [50], and Duarte et al., [51], compared to Heckman et al. [46] are due to differences in analytical techniques.
Fewer data are available on nutrient concentrations by plant part (Table 4). Here, we provide a comparison with Karlen et al. [36] who aimed to determine maximum yield and nutrient partitioning for maize grown in South Carolina. Leaf concentrations of N, P, and Ca listed in Table 4 were similar to, but less than, the figures from Karlen et al. [36], who reported 16.7, 1.55, and 8.1 g kg−1, compared to 11.5, 0.62, and 7.1 g kg−1, for grow-room maize, respectively. Leaf Fe and Mn were much less in this study (46 and 34 mg kg−1) compared to in Karlen et al. [36], but were well within the sufficiency range for mature maize [52]. Values of K, Mg, S, Cu, and Zn (Table 4) were higher in this study compared to Karlen et al. [36]. Concentrations of nutrients in the stalk and ear were very similar between studies with the exception of B, which was highly elevated in all plant parts for reasons unknown (Table 4); no signs of B toxicity were observed.
Overall, maize in the grow room was comparable to high-yielding field-grown maize regarding development and physical and chemical composition. One exception is that grow-room maize tended to produce more above ground biomass (not including grain) compared to field-grown, producing a lower harvest index than field-grown maize.

4. Summary and Implications

Ninety-six maize plants were grown to full maturity (R6) under fully artificial conditions with semi-automation and produced realistic maize plants with corresponding grain yields, thereby achieving all the benefits without the disadvantages of field, greenhouse, growth chamber, and traditional hydroponics studies, with regard to nutrient research. Plant growth was responsive to changes in nutrient fertigation concentrations, illustrating the highly inert behavior of the silica sand growth media and the efficiency and bioavailability of the nutrient delivery system. Nutrient injectors used in this study were less accurate when operated at lower flow rates or flow times compared to higher flow rates.
Compared to field-grown maize, maturity occurred earlier, likely due to the higher accumulation rate of GDD and overall ideal conditions including constant N addition. While the technique produced similar grain yield, height, root biomass, and stem diameter, appreciably greater values for total, leaf, and stem biomass were observed for grow-room plants compared to reported field values. The production of a denser plant but with similar grain yield to field-grown plants resulted in lower HI values for grow-room maize. Nutrient concentrations in all plant parts were similar to values reported for field-grown maize with few exceptions. Based on statistical analysis, maximum grain yield was achieved in this system with a P concentration of 7.8 mg L−1, but total biomass continued to significantly increase with increasing P concentration until 14.4 mg L−1, suggesting that genetic potential limited grain yield.
Using this solution-culture methodology, plants can be grown with precise control of nutrient bioavailability due to the use of inert silica sand coupled with nutrient application in solution form, as demonstrated by its ability to not sorb any added P, whereas traditional hydroponics media were fairly sorptive. In practice, this means that the solution environment of plants could be altered within a matter of minutes in order to study the effects on plant physiological function and processes. This feature alone gives this solution-culture method immense potential for plant nutrient timing studies. Growing plants in this type of artificial environment has immediate applications for nutrient and physiological studies. The system described also allows for precise manipulation of light, specifically light intensity, quality, and photoperiod duration. Additionally, one of the most important features of this growth environment is that regardless of study type, a relatively large number of plants (96 in this instance) can be grown and observed at one time. In theory, this number could be scaled up where there is adequate space.
Potential limitations with this methodology are associated with financial costs that are incurred, although at approximately USD 41,000 and considering the limitations and high cost of growth chambers, this cost is reasonable. The initial equipment purchases, specifically the LED lighting, are expensive and come with the reoccurring costs of energy consumption. Electricity use was 9000 kW-h which cost USD 550 per month at this location. In conclusion, the methods described herein provide an adequate methodology for practically growing many maize plants to full maturity and achieving maximum growth with semi-automation in an artificial environment that allows for precise control of several factors, while overcoming the disadvantages of greenhouses, growth chambers, and media-less hydroponics.

Author Contributions

Writing—original draft preparation, M.W.; methodology, data curation, M.W. and C.P.; conceptualization, supervision, investigation, C.P.; review and editing, C.P. and J.C.; visualization, C.P. and J.C. All authors have read and agreed to the published version of the manuscript.

Funding

This research was a contribution from the Long-Term Agroecosystem Research (LTAR) network. LTAR is supported by the United States Department of Agriculture.

Institutional Review Board Statement

Not Applicable.

Informed Consent Statement

Not Applicable.

Data Availability Statement

Data is contained within the article.

Disclaimer

Mention of a commercial product is solely for the purpose of providing specific information and should not be construed as a product endorsement by the authors or the institutions with which the authors are affiliated.

Conflicts of Interest

The authors declare no conflict of interest. The funders had no role in the design of the study; in the collection, analyses, or interpretation of data; in the writing of the manuscript, or in the decision to publish the results.

References

  1. Wang, L.; Wang, B. Greenhouse microclimate environment adaptive control based on a wireless sensor network. Int. J. Agric. Biol. Eng. 2020, 13, 64–69. [Google Scholar]
  2. Katagiri, F.; Canelon-Suarez, D.; Griffin, K.; Petersen, J.; Meyer, R.K.; Siegle, M.; Mase, K. Design and construction of an inexpensive homemade plant growth chamber. PLoS ONE 2015, 10, e0126826. [Google Scholar]
  3. Potvin, C.; Tardif, S. Sources of variability and experimental designs in growth chambers. Funct. Ecol. 1988, 2, 123–130. [Google Scholar]
  4. Jones, P.; Jones, J.W.; Allen, L.H.; Mishoe, J.W. Dynamic computer control of closed environmental plant growth chambers. Design and verification. Trans. ASAE 1984, 27, 879–888. [Google Scholar]
  5. Eddy, R.; Hahn, D.T. Optimizing Greenhouse Corn Production: What Is the Best Lighting and Plant Density? Purdue University e-Pubs: West Lafayette, IN, USA, 2010. [Google Scholar]
  6. Fang, L.; Ma, Z.; Wang, Q.; Nian, H.; Ma, Q.; Huang, Q.; Mu, Y. Plant growth and photosynthetic characteristics of soybean seedlings under different led lighting quality conditions. J. Plant Growth Regul. 2021, 40, 668–678. [Google Scholar]
  7. Barber, S.A. Soil Nutrient Bioavailability: A Mechanistic Approach; John Wiley & Sons: Hoboken, NJ, USA, 1995; ISBN 0471587478. [Google Scholar]
  8. Penn, C.J.; Camberato, J.J. A critical review on soil chemical processes that control how soil pH affects phosphorus availability to plants. Agriculture 2019, 9, 120. [Google Scholar] [CrossRef] [Green Version]
  9. Hoagland, D.R.; Arnon, D.I. The water-culture method for growing plants without soil. Circ. Calif. Agric. Exp. Stn. 1950, 347, 32. [Google Scholar]
  10. Groleau-Renaud, V.; Plantureux, S.; Guckert, A. Influence of plant morphology on root exudation of maize subjected to mechanical impedance in hydroponic conditions. Plant Soil 1998, 201, 231–239. [Google Scholar]
  11. Nantawisarakul, T.; Newman, I.A. Growth and gravitropism of corn roots in solution. Plant Cell Environ. 1992, 15, 693–701. [Google Scholar]
  12. Abdalla, A.M.; Hettiaratchi, D.R.P.; Reece, A.R. The mechanics of root growth in granular media. J. Agric. Eng. Res. 1969, 14, 236–248. [Google Scholar]
  13. Ryan, P.R.; Newman, I.A.; Shields, B. Ion fluxes in corn roots measured by microelectrodes with ion-specific liquid membranes. J. Memb. Sci. 1990, 53, 59–69. [Google Scholar]
  14. Smith, G.S.; Johnston, C.M.; Cornforth, I.S. Comparison of nutrient solutions for growth of plants in sand culture. New Phytol. 1983, 94, 537–548. [Google Scholar]
  15. Murphy, J.; Riley, J.P. A modified single solution method for the determination of phosphate in natural waters. Anal. Chim. Acta 1962, 27, 31–36. [Google Scholar]
  16. Kovar, J.L.; Barber, S.A. Reasons for differences among soils in placement of phosphorus for maximum predicted uptake. Soil Sci. Soc. Am. J. 1989, 53, 1733–1736. [Google Scholar]
  17. Kanai, H.; Sakai, A. An obligate-halophytic mangrove, Rhizophora mucronate, does not require Na+ for the uptake of nutrient ions in their roots. Aquat. Bot. 2021, 169, 103328. [Google Scholar]
  18. Timlin, D.J.; Naidu, T.C.M.; Fleisher, D.H.; Reddy, V.R. Quantitative effects of phosphorus on maize canopy photosynthesis and biomass. Crop Sci. 2017, 57, 3156–3169. [Google Scholar]
  19. Ritchie, S.W.; Hanway, J.J.; Benson, G.O. How a Corn Plant Develops; Special Report No. 48; Iowa State University: Ames, IA, USA, 1986. [Google Scholar]
  20. SAS/STAT. SAS/STAT User’s Guide, Version 9.1; SAS Institute Inc.: Cary, NC, USA, 2003. [Google Scholar]
  21. Barry, D.A.J.; Miller, M.H. Phosphorus nutritional requirement of maize seedlings for maximum yield. Agron. J. 1989, 81, 95–99. [Google Scholar]
  22. Katzin, D.; Marcelis, L.F.M.; van Mourik, S. Energy savings in greenhouses by transition from high-pressure sodium to LED lighting. Appl. Energy 2021, 281, 116019. [Google Scholar]
  23. Nelson, J.A.; Bugbee, B. Economic analysis of greenhouse lighting: Light emitting diodes vs. high intensity discharge fixtures. PLoS ONE 2014, 9, e99010. [Google Scholar]
  24. Xue, J.; Gou, L.; Zhao, Y.; Yao, M.; Yao, H.; Tian, J.; Zhang, W. Effects of light intensity within the canopy on maize lodging. Field Crop. Res. 2016, 188, 133–141. [Google Scholar]
  25. Ottman, M.J.; Welch, L.F. Supplemental radiation effects on senescence, plant nutrients, and yield of field-grown corn. Agron. J. 1988, 80, 619–626. [Google Scholar]
  26. He, P.; Zhou, W.; Jin, J. Effect of nitrogen application on redistribution and transformation of photosynthesized 14C during grain formation in two maize cultivars with different senescence appearance. J. Plant Nutr. 2002, 25, 2443–2456. [Google Scholar]
  27. Cliquet, J.-B.; Deleens, E.; Mariotti, A. C and N mobilization from stalk and leaves during kernel filling by 13C and 15N tracing in Zea mays L. Plant Physiol. 1990, 94, 1547–1553. [Google Scholar]
  28. Swank, J.C.; Below, F.E.; Lambert, R.J.; Hageman, R.H. Interaction of carbon and nitrogen metabolism in the productivity of maize. Plant Physiol. 1982, 70, 1185–1190. [Google Scholar] [PubMed] [Green Version]
  29. Goodman, A.M.; Ennos, A.R. The effects of mechanical stimulation on the morphology and mechanics of maize roots grown in an aerated nutrient solution. Int. J. Plant Sci. 2001, 162, 691–696. [Google Scholar]
  30. Goodman, A.M.; Ennos, A.R. A comparative study of the response of the roots and shoots of sunflower and maize to mechanical stimulation. J. Exp. Bot. 1996, 47, 1499–1507. [Google Scholar]
  31. Abendroth, L.J.; Elmore, R.W.; Boyer, M.J.; Marlay, S.K. Corn Growth and Development; Iowa State University Extension Publication PMR1009: Ames, IA, USA, 2011. [Google Scholar]
  32. NASS, U. Quick Stats; USDA National Agricultural Statistics Service: Washington, DC, USA, 2017.
  33. Nielsen, R.L.; Camberato, J.; Lee, J. Yield Response of Corn to Plant Population in Indiana. Purdue University Department of Agronomy Applied Crop Production Research Update. 2019. Available online: http://www.kingcorn.org/news/timeless/CornPopulations.pdf (accessed on 19 June 2021).
  34. Boomsma, C.R.; Santini, J.B.; Tollenaar, M.; Vyn, T.J. Maize morphophysiological responses to intense crowding and low nitrogen availability: An analysis and review. Agron. J. 2009, 101, 1426–1452. [Google Scholar]
  35. Greveniotis, V.; Zotis, S.; Sioki, E.; Ipsilandis, C. Field population density effects on field yield and morphological characteristics of maize. Agriculture 2019, 9, 160. [Google Scholar]
  36. Karlen, D.L.; Flannery, R.L.; Sadler, E.J. Aerial accumulation and partitioning of nutrients by corn. Agron. J. 1988, 80, 232–242. [Google Scholar]
  37. Woli, K.P.; Sawyer, J.E.; Boyer, M.J.; Abendroth, L.J.; Elmore, R.W. Corn era hybrid macronutrient and dry matter accumulation in plant components. Agron. J. 2018, 110, 1648–1658. [Google Scholar]
  38. Bender, R.R.; Haegele, J.W.; Ruffo, M.L.; Below, F.E. Nutrient uptake, partitioning, and remobilization in modern, transgenic insect-protected maize hybrids. Agron. J. 2013, 105, 161–170. [Google Scholar]
  39. Robles, M.; Ciampitti, I.A.; Vyn, T.J. Responses of maize hybrids to twin-row spatial arrangement at multiple plant densities. Agron. J. 2012, 104, 1747–1756. [Google Scholar]
  40. Swanson, S.; Wilhelm, W. Planting date and residue rate effects on growth, partitioning, and yield of corn. Agron. J. 1996, 88, 205–210. [Google Scholar]
  41. Overman, A.R.; Wilson, D.M.; Vidak, W.; Allhands, M.N.; Perry, T.C., Jr. Model for partitioning of dry matter and nutrients in corn. J. Plant Nutr. 1995, 18, 959–968. [Google Scholar]
  42. Mengel, D.B.; Barber, S.A. Development and distribution of the corn root system under field conditions. Agron. J. 1974, 66, 341–344. [Google Scholar]
  43. Ren, X.; Chen, X.; Jia, Z. Effect of rainfall collecting with ridge and furrow on soil moisture and root growth of corn in semiarid northwest China. J. Agron. Crop Sci. 2010, 196, 109–122. [Google Scholar]
  44. Eghball, B.; Maranville, J.W. Root development and nitrogen influx of corn genotypes grown under combined drought and nitrogen stresses. Agron. J. 1993, 85, 147–152. [Google Scholar]
  45. Ordóñez, R.A.; Castellano, M.J.; Danalatos, G.N.; Wright, E.E.; Hatfield, J.L.; Burras, L.; Archontoulis, S.V. Insufficient and excessive N fertilizer input reduces maize root mass across soil types. Field Crop. Res. 2021, 267, 108142. [Google Scholar]
  46. Heckman, J.R.; Sims, J.T.; Beegle, D.B.; Coale, F.J.; Herbert, S.J.; Bruulsema, T.W.; Bamka, W.J. Nutrient removal by corn grain harvest. Agron. J. 2003, 95, 587–591. [Google Scholar]
  47. A & L Laboratories; Ankerman, D.; Large, R. Agronomy Handbook: Soil and Plant Analysis; A & L Laboratories: Modesto, CA, USA, 2001. [Google Scholar]
  48. Zublena, J.P. Nutrient Removal by Crops in North Carolina; AG-North Carolina Agriculture Extension Services North Carolina State University: Raleigh, NC, USA, 1991. [Google Scholar]
  49. Codling, E.E.; Mulchi, C.L.; Chaney, R.L. Grain yield and mineral element composition of maize grown on high phosphorus soils amended with water treatment residual. J. Plant Nutr. 2007, 30, 225–240. [Google Scholar]
  50. Avila-Segura, M.; Barak, P.; Hedtcke, J.L.; Posner, J.L. Nutrient and alkalinity removal by corn grain, stover and cob harvest in Upper Midwest USA. Biomass Bioenergy 2011, 35, 1190–1195. [Google Scholar]
  51. Duarte, A.P.; Abreu, M.F.D.; Francisco, E.A.B.; Gitti, D.D.C.; Barth, G.; Kappes, C. Reference values of grain nutrient content and removal for corn. Rev. Bras. Ciênc. Solo 2019, 43, e0180102. [Google Scholar]
  52. Campbell, C. Reference Sufficiency Ranges for Plant Analysis in the Southern Region of the United States; Southern Cooperative Series Bulletin #34; Food and Agriculture Organization: Raleigh, NC, USA, 2000. [Google Scholar]
Figure 1. Several components of the grow room. (a) Oscillating fan; (b) irrigation pipe containing drip emitters; (c) six rows of sloped trays for holding pots and draining water; (d) astronomical timer; (e) four rows of LED lights and power sources mounted on struts; (f) air duct for incoming air plus temperature, humidity, and CO2 sensors hanging from ceiling; (g) pulleys for raising/lowering LED lights; (h) controls for activating air handler and humidifiers; (i) air handler with filter located in “lung room” connected to air duct; (j) eight small nutrient injectors for applying treatments; (k) containers for treatment concentrate solution; (l) timer/controller for irrigation; (m) large nutrient injector for all non-treatment nutrients; (n) container for non-treatment nutrient concentrate; (o) drip emitter, one per pot; (p) humidifiers; (q) pots containing silica sand and drip rings; (r) mature and dry maize ready for harvest. Not shown: “Watch Dog” daily logger station for radiation, relative humidity and temperature, air conditioners, and louvers for exit air.
Agronomy 11 01898 g001
Figure 2. Phosphorus (P) sorption isotherm for silica sand, a commercially available hydroponics media known as “Hydrocorn”, and traditional vermiculite used in greenhouse pots. Dashed line is a 1:1 relationship which indicates zero P sorption or desorption. Error bars indicate standard deviation at n = 3.
Agronomy 11 01898 g002
Figure 3. Average emitter flow volume (a) and phosphorus (P) concentration (b) for seven different emitters (x-axis), within a single irrigation line containing 12 emitters, connected to a Dosatron model D25F1 1:100 fixed rate injector that injected a 100 mg P L−1 solution. The seven different emitters were “Rainbird” 2, 5, 7, 10, 12, and 18 gph (126, 316, 442, 632, 758, and 1137 mL min−1, respectively). Error bars indicate standard deviation at n = 12.
Agronomy 11 01898 g003
Figure 4. Measured light intensity in the grow room with no plants, as a function of vertical distance from the light source.
Agronomy 11 01898 g004
Figure 5. Photoperiod length in relation to days after planting (DAP), where day zero represents 15 May for West Lafayette, IN, USA (40.4237° N, 86.9212° W). Dashed line (y = 14.34) represents the average day length for the simulated photoperiod (solid line).
Agronomy 11 01898 g005
Figure 6. Grow room daily high and low (a) temperatures and (b) relative humidity throughout the experiment from 0 to 120 days after planting (DAP).
Agronomy 11 01898 g006
Figure 7. Maize growth stage in the indoor grow room compared to field-grown maize as a function of time (days after emergence, VE) and cumulative growing degree days (GDD). Field-grown data adapted from Abendroth et al. [31].
Agronomy 11 01898 g007
Figure 8. Grain (15.5% moisture content) and total biomass (dry basis) plant yield from harvested maize plants grown synthetically in the indoor grow room during a fertility trial. Values represent averages among three replications and three different hybrids grown using six different concentrations of P in fertigation (4, 8, 12, 15, 20, and 22 mg P L−1). Error bars indicate standard deviation.
Agronomy 11 01898 g008
Table 1. Concentrations of plant essential elements in nutrient solution supplied to pots for fertigation and chemicals used to make the solutions. Final solution pH was 7.1 to 7.2.
NutrientSolution Concentration (mg L−1)Primary Source(s)
N180.00NH4NO3 & Ca(NO3)2 ● 4H2O
P4.00 to 22.00KH2PO4
K120.00KCl
S73.90(NH4)2SO4
Mg35.00MgSO4 ● 7H2O
Ca80.00Ca(NO3)2 ● 4H2O
Fe2.00Fe DTPA
Zn0.05ZnSO4 ● 7H2O
B0.25H3BO3
Mn0.25MnCl2 ● 4H2O
Cu0.02CuSO4 ● 5H2O
Mo0.01(NH4)6Mo7O24 ● 4H2O
Table 2. Costs (USD) associated with components of grow-room construction, including monthly electric use.
ItemCost
Electric bill (monthly)USD 550
Lights (USD 1000) × 24USD 24,000
Astronomical timer—lightsUSD 500
Timer—main exhaust fanUSD 200
Timer-for AC and pedestal fans × 4USD 200
Saturn 6 controllerUSD 500
Electrician laborUSD 1900
Irrigation ControllerUSD 300
Dosatron injectors D25F1 1% (USD 280) × 8USD 2240
Dosatron adjustable injector D14MZ520USD 1960
Exhaust fanUSD 1100
AC Unit (USD 600) × 2USD 1200
Humidifier (USD 300) × 2USD 600
Pedestal fans 30″ dia. (USD 250) × 2USD 500
PotsUSD 240
Silica sandUSD 865
Plumbing supplies (PEX, Fittings, hardware, misc.)USD 1200
Wood, Aluminum sheeting (drainage trays)USD 1950
Materials for light mount system: galvanized struts, pulleys, wire rope, worm gear winchesUSD 1515
TOTAL (not including monthly electric)USD 40,970
Table 3. Summary of plant yield components from harvested maize plants grown synthetically in the indoor grow room during a fertility trial. Values are expressed on a per plant basis and represent averages among three replications and three different hybrids grown using a concentration of 8 mg P L−1 in fertigation solution.
Yield ComponentUnitsMin.Max.MeanStd. Dev.Median
Grain yield †g plant−1149.9251.8210.232.1212.3
Leaf biomassg plant−167.699.481.810.779.9
Stem biomassg plant−177.9164.9108.729.693.1
Root biomassg plant−135.9233.393.853.684.1
Total biomassg plant−1364.5619.0461.867.2445.1
Harvest index 0.350.550.480.070.51
Plant heightcm195.0267.0230.024.1223.0
Ear heightcm64.0102.080.710.778.5
Stem diametermm21.330.926.12.925.8
† Grain yield at 15.5% moisture content; plant tissues are on dry weight basis.
Table 4. Nutrient concentrations in leaf, stem, root, and grain from harvested maize plants grown synthetically in the indoor grow room during a fertility trial. Values represent averages among three replications and three different hybrids grown using a concentration of 8 mg P L−1 in fertigation solution.
LeafStemRootGrain
NutrientUnitsMinMaxMeanMedMinMaxMeanMedMinMaxMeanMedMinMaxMeanMed
N g kg−110.114.211.511.49.217.412.311.95.616.69.79.117.421.719.519.6
Pg kg−10.510.760.620.600.240.660.430.400.250.530.380.361.903.032.302.24
Kg kg−111.7224.1816.1814.007.5328.9017.1516.842.3811.297.458.602.864.253.383.35
Sg kg−13.476.394.444.280.922.141.461.431.463.862.762.661.211.551.391.40
Mgg kg−12.834.423.483.400.912.131.381.370.071.270.750.730.710.950.820.83
Cag kg−15.7210.187.056.780.732.351.541.590.741.721.321.380.000.040.020.03
Femg kg−131.470.746.245.317.839.226.022.3202.9670.6350.0312.912.922.918.318.2
Znmg kg−125.776.845.045.57.042.314.311.79.726.516.915.014.119.616.415.8
Bmg kg−173.8106.587.285.411.263.129.321.02.812.07.47.04.915.27.87.4
Mnmg kg−125.644.733.732.63.512.96.25.52.810.66.26.22.75.33.83.6
Cumg kg−113.534.425.025.93.234.97.85.69.525.816.814.60.810.62.71.7
Momg kg−10.000.000.000.000.000.000.000.000.002.521.060.580.000.000.000.00
Publisher’s Note: MDPI stays neutral with regard to jurisdictional claims in published maps and institutional affiliations.

