Article

Physiological Basis of Combined Stress Tolerance to Low Phosphorus and Drought in a Diverse Set of Mungbean Germplasm

1
Division of Plant Physiology, ICAR-Indian Agricultural Research Institute, New Delhi 110012, India
2
Division of Germplasm Evaluation, ICAR-National Bureau of Plant Genetic Resources, New Delhi 110012, India
3
Division of Genetics, ICAR-Indian Agricultural Research Institute, New Delhi 110012, India
*
Author to whom correspondence should be addressed.
Present address: ICAR-Indian Institute of Pulse Research, Regional Research Station Bikaner, Rajasthan, India.
Agronomy 2021, 11(1), 99; https://doi.org/10.3390/agronomy11010099
Submission received: 30 November 2020 / Revised: 26 December 2020 / Accepted: 30 December 2020 / Published: 7 January 2021
(This article belongs to the Special Issue Improving Mineral Nutrition to Obtain Stress Tolerant Crops)

Abstract

:
To understand the physiological basis of tolerance to combined stresses to low phosphorus (P) and drought in mungbean (Vigna radiata (L.) R. Wilczek), a diverse set of 100 accessions were evaluated in hydroponics at sufficient (250 μM) and low (3 μM) P and exposed to drought (dehydration) stress. The principal component analysis and ranking of accessions based on relative values revealed that IC280489, EC397142, IC76415, IC333090, IC507340, and IC121316 performed superior while IC119005, IC73401, IC488526, and IC325853 performed poorly in all treatments. Selected accessions were evaluated in soil under control (sufficient P, irrigated), low P (without P, irrigated), drought (sufficient P, withholding irrigation), and combined stress (low P, withholding irrigation). Under combined stress, a significant reduction in gas exchange traits (photosynthesis, stomatal conductance, transpiration, instantaneous water use efficiency) and P uptake in seed and shoot was observed under combined stress as compared to individual stresses. Among accessions, IC488526 was most sensitive while IC333090 and IC507340 exhibited tolerance to individual or combined stress. The water balance and low P adaptation traits like membrane stability index, relative water content, specific leaf weight, organic acid exudation, biomass, grain yield, and P uptake can be used as physiological markers to evaluate for agronomic performance. Accessions with considerable tolerance to low P and drought stress can be either used as ‘donors’ in Vigna breeding program or cultivated in areas with limited P and water availability or both.

1. Introduction

Mungbean (Vigna radiata (L.) R. Wilczek) is a short duration pulse crop grown by marginal and poor farmers as a grain and fodder crop, primarily in the arid and semi-arid regions of India that are prone to numerous abiotic stresses and greatly hampers seed yield [1]. Mungbean is preferred for its high nutritional value and for improving soil fertility. Phosphorus (P) is a non-renewable resource and the second most important macronutrient for plant growth and development after nitrogen (N). Deficiency of P has deleterious effects on plant growth, development, and reproduction. Limitation in plant growth and seed yield under P deficiency is mainly attributed to its heterogenous distribution and low mobility in soil. Most of the world’s arable lands exhibits high P retention potential that leads to poor bioavailability of P for plant uptake [2]. It is generally accepted that the uptake of P by crop plants is reduced in limited moisture condition through changes in mass flow and diffusion, reduced root proliferation, and by altered P uptake capacity [3,4,5,6]. Drought can reduce plant growth by limiting N and P uptake, transport, and their redistribution [7]. Under water deficient condition, P application can enhance root growth, nutrient uptake, and water use efficiency (WUE) resulting in increased yield [8]. Drought can be ameliorated by increasing the availability of N, P, and potassium (K) that leads to higher root proliferation, water uptake, and WUE [9,10].
P plays essential roles in energy metabolism, biosynthesis of nucleic acids, membranes phospholipids, cellular signal transduction, and regulation of several key enzymes [11]. It also has an important role in improving root growth, maintaining cell turgidity with high water potential, and increases the stomatal conductance with higher WUE during moisture deficit condition [12]. Optimum P nutrition can contribute to a controlled and proper adjustment of the physiological, morphological, and biochemical processes of a plant to promote growth. Enhanced growth rate at higher P levels could be attributed to the increase in photosynthetic rate associated with the increase in stomatal conductance [13] as reported in cotton (Gossypium hirsutum L.) and Rhodes grass (Chloris gayana Kunth) under water deficit stress [14,15]. Tolerance to low soil P availability is associated with increased P acquisition efficiency, which is achieved by modification in root architecture capable of foraging the nutrients from the upper soil layer [16,17,18]. P deficiency in rice caused a rapid decline in chlorophyll a content, while chlorophyll b decreased gradually over the period of P deprivation [19]. The reduction in chlorophyll content with moisture stress level have also been reported in common bean (Phaseolus vulgaris L.) [20], cluster bean (Cyamopsis tetragonoloba (L.) Taub) [21], and mungbean [22].
The relative water content (RWC) is one of the key traits associated with drought stress and is reduced in response to drought as reported in several crops like soybean (Glycine max (L.) Merr.) [23,24], alfalfa (Medicago sativa L.) [25], and mungbean [22,26,27]. Another trait, excised leaf weight loss (ELWL), is often used as a selection criterion for drought tolerance in many crops. Genotypic variation for ELWL can be due to both the residual water loss from stomatal complex and epicuticular transpiration as reported among black gram (Vigna mungo (L.) Hepper) genotypes [28]. Mungbean genotypes with contrasting ELWL were explored for the variation in physiological and molecular responses to water deficit which revealed that efficient stomatal regulation was found in genotypes with low ELWL [29]. Further, a negative correlation between moisture retention capacity (MRC) and stomatal conductance was reported in common bean [30]. Under drought, a significantly positive correlation between MRC and yield attributes was reported in wheat (Triticum aestivum L.) [31]; on the contrary, a poor correlation between MRC and seed yield or dry matter was observed in common bean [32]. The negative effect of moisture deficit on yield and its attributes are well reported in legume crops [27,33,34]. Since P nutrition plays an important role in pod filling thereby enhancing seed yield [35], it is therefore recommended to apply P under drought stress as observed in as cluster bean [36,37], cowpea (Vigna unguiculata (L.) Walp) [38], chickpea (Cicer arietinum L.) [39], and soybean [40,41].
Generally, mungbean is cultivated under rainfed condition with minimal or without application of fertilizers. Moisture deficit affects soil P mobility towards the root while P deficiency influences growth and physiology of plants. Therefore, identification of mungbean accessions possessing physiological mechanisms to acquire and utilize P from soil having less soil moisture in rainfed regions would be useful in improving mungbean seed yield. In the present study, efforts were made to phenotype the diverse mungbean set (selected from 1232 diverse accessions) in hydroponics under controlled condition followed by thorough physiological evaluation of contrasting groups to low P and drought stress in soil under natural growing conditions. The aim was to identify the traits that could be used as physiological markers, and the ‘donor’ accessions may be included in the Vigna breeding program to develop varieties with enhanced water and P use efficiencies for cultivation under limited availability of water or P or both.

2. Materials and Methods

The diverse mungbean set comprising 100 accessions (Table S1) was selected from a total of 1232 diverse mungbean germplasm [42]. These diverse germplasms were scored for the morpho-physiological and yield traits in the field experiment located at Issapur Farm, ICAR-National Bureau of Plant Genetic Resources (NBPGR), New Delhi, India between latitudes 28°32′11′′ N and 28°42′45′′ N; longitudes 76°49′41′′ E and 77°02′53′′ E; 218 m above mean sea level (Figure S1a–c). Two separate experiments were conducted on this diverse set to investigate the effect of low P and drought on growth and physiology of mungbean.

2.1. Experiment 1: Screening in Hydroponics

The diverse mungbean set was phenotyped in hydroponics at Controlled Environment Facility, Division of Plant Physiology, ICAR-IARI, New Delhi. Seeds of mungbean were surface sterilized with 0.1% HgCl2 and rolled in moistened germination towel. Upon appearance of cotyledonary pair of leaves after five days, six seedlings were transferred to nutrient medium in each treatment. Seedlings were grown with two P levels, sufficient (250 μM) and low P (3 μM) throughout the experiment. The composition of nutrient solution was as follows: MgSO4.7H2O (1 mM), CaCl2.2H2O (1.65 mM), K2SO4 (0.7 mM), Fe-Na-EDTA (0.03 mM), Urea (2.5 mM), and micronutrients H3BO3 (2.9 μM), MnSO4.H2O (2.8 μM), ZnSO4.7H2O (0.5 μM), CuSO4.5H2O (0.47 μM), and Na2MoO4.2H2O (0.6 μM). The pH of the nutrient solution was adjusted between 6.0 and 6.2 (using either 1.0 N KOH or 1.0 N HCl). To find out the sufficient and low P levels, a preliminary experiment was conducted using two accessions (IPM 2-3 and MH 421) with different P concentrations (0 to 450 μM) using KH2PO4 as P source. Growth traits like biomass, leaf area, and chlorophyll were recorded on 21 days old seedlings and finally selected sufficient or optimum and low P concentrations (Figure S2). The growth conditions maintained in the Controlled Environment Facility was day/night temperature at 30/27 °C, relative humidity of 85%, photoperiod of 12 h at a photosynthetic photon flux density (PPFD) 1000 μmol m−2 s−1.
Plants were exposed to treatments as control (sufficient P, no drought), low P (no drought), drought (with sufficient P), and combined stress (low P, drought). Drought stress was imposed after a week of transferring the plants to nutrient solution by hanging the roots in air (dehydration) following the method of Singh et al. [43]. Initially, seedling roots were exposed to air for 1 h for acclimatization after which the exposure time was increased to 3 h. Every time after the dehydration treatment, roots were returned to the nutrient solution. This dehydration treatment was repeated consecutively for a period of five days for the same plant to lower the water potential. The exposure time to air was from 10.00 h to 13.00 in drought treatment. Two weeks post-dehydration treatment, the morpho-physiological parameters were recorded for screening the accessions for combined tolerance to drought and low P stress. Out of 100, 10 accessions were selected based on their performance under combined stress in hydroponics culture for further evaluation in low P soil.

2.2. Experiment 2: Evaluation of Selected Accessions in Soil

Ten mungbean accessions selected from Experiment 1 belonging to contrasting groups were grown in soil during summer (22 March to 15 June) 2018 to assess growth, yield, physiological, and biochemical basis of low P, drought, and combined stress tolerance. Plants were grown in soil with sufficient and low P availability. The plastic pots (30 cm diameter) were filled with sandy loam soil containing 7.8 mg P kg−1 soil as available P [44]. The pH (soil: water, 1:5) and electrical conductivity (EC) of soil was 7.8 and 0.155 mS m−1, respectively. Initially, eight seeds were sown in the pots and 15 days after germination, three healthy plants with uniform growth were retained per pot. For each accession and treatment, 10 pots were maintained, and one pot was treated as one replicate. Recommended rate of nitrogen (20 kg N ha−1) and potash (60 kg K2O ha−1) as urea and muriate of potash, respectively, for mungbean were mixed with soil. Single super phosphate was applied at the recommended rate (40 kg P2O5 ha−1) to create sufficient P level while no external P was added to low P pots. The treatment combinations were control (sufficient P, irrigated), low P (7.8 mg P kg−1 soil, irrigated), drought stress (sufficient P, with-holding irrigation), and combined stress (low P, with-holding irrigation). Two more treatments were added as recovery from stress: Drought-recovery, and combined stress-recovery. Drought stress was imposed after 35 days of sowing by withholding irrigation for 10 days, which resulted in 10–11% reduction in soil moisture while the soil moisture content in control was maintained at 16–17% (measured by gravimetric method). The water deficit condition was maintained in drought stressed plants for two days and sampling was done for control, low P, drought, and combined stress on the same day. Subsequently, plants were re-watered to recover from drought and combined stresses followed by sampling for stress recovery treatment. Three pots from each treatment were used for destructive sampling and the remaining seven pots were kept for recording yield attributes.

2.3. Water Relation Traits and Membrane Stability Index (MSI)

Scanning and image analysis for root traits in hydroponically grown 100 accessions was carried out by EPSON scanner and WinRhizo program (Regent Instruments Inc., Sainte-Foy, QC, Canada), respectively. The traits such as total root length (cm plant−1), total root surface area (cm2 plant−1), root volume (cm3 plant−1), and root average diameter (cm) were obtained. Chlorophyll concentration was measured by an optical chlorophyll content meter (MC-100, Apogee Instruments, Logan, UT, USA) in the second trifoliate leaf of the seedlings and expressed as μmol chlorophyll m−2 leaf area.
Rate of water loss (RWL) from leaf was estimated according to [45]
RWL (g H2O g−1 dry weight h−1) = (W0 min − W140 min)/dry wt. (g) × time (h)
Moisture retention capacity (MRC) calculated using the following formulae:
MRC (%) = (weight after 140 min − dry weight)/(fresh weight − dry weight) × 100
Excised leaf weight loss (ELWL) after 30, 90, and 140 min was calculated as water lost per unit of initial water content in the leaf according to [46] as follows:
ELWLW0−30min = (FW0 − FW30)/(FW0 − DW)
ELWLW30−90min = (FW30 − FW90)/(FW30 − DW)
ELWLW90−140min = (FW90 − FW140)/(FW140 − DW)
where FW is fresh weight and DW is dry weight of leaf tissue.
The RWC [47] and MSI [48] were measured as per the standard methodologies in the fully expanded third trifoliate leaf.

2.4. Tissue Phosphorus Concentration

P concentration was estimated in stem, leaf, seed, and root using oven dried tissue. The ground samples were digested with di-acid mixture (HNO3: HClO4, 9:4), volume made up to 50 mL, and filtered through Whatman No. 42. The samples were run on an inductively coupled plasma optical emission spectrometer (ICP-OES; model 5110, Agilent technologies, Santa Clara, CA, USA) calibrated using standard solutions. The P concentration was expressed as mg g–1 dry weight.

2.5. Photosynthetic Pigment and Gas Exchange Measurements in Selected Accessions Grown in Soil

Chlorophyll and carotenoid content were estimated on fully expanded third trifoliate leaf by non-maceration method using dimethyl sulfoxide [49]. The gas exchange traits were measured using infrared gas analyzer (Li-6800, Li-COR Inc., Lincoln, NE, USA) on the second fully opened trifoliate leaf. The measuring conditions of leaf chamber was set at 1200 μmol m−2 s−1 of photosynthetic photon flux density, CO2 concentration set at 400 μmol mol−1, relative humidity at 65 ± 2% and temperature at 28 ± 1 °C. The measurements were recorded between 8.00–12.00 h. Instantaneous water use efficiency (IWUE, µmol mol−1) was calculated by the photosynthetic rate divided by transpiration rate. The gas exchange measurements were recorded in all four treatments as well as in stress-recovery plants after 24 h of re-watering.

2.6. Characterization and Quantification of Organic Acid in Root Exudates in Selected Accessions

After imposition of drought, the plants were uprooted carefully, and roots washed with deionized water. The roots were immersed in 50 mL of trap solution (0.5 mM CaCl2 solution, pH 4.5) contained in 100 mL Erlenmeyer flask wrapped in black paper and kept under natural condition for 4 h (8.00 to 12.00 h). Root fresh weight was recorded after removing the plants from the trap solution and the quantification of organic acid was carried out following the method of [50]. The root exudate (20 mL) was passed through a cation exchange column (Amberlite IR-120 H+ form) followed by passing through an anion-exchange column (DEAE-cellulose). The anions were eluted with 2.0 mL of 1.0 M HCl and after drying, the pellet was re-suspended in 500 μL of 5.0 mM H2SO4. Samples were analyzed using HPLC (Agilent Technologies, 1200 Infinity) with Hi-Plex H column as the stationary phase. The column temperature was set at 70°C. Mobile phase (5 mM H2SO4) was used at a flow rate of 0.6 mL min−1. Individual samples were run for 25 min and peaks captured by a refractive index detector (RID) with an optical temperature of 55 °C. For peak identification, standard solutions of oxalic, citric, pyruvic, α-ketoglutaric, malic, maleate, malonate, succinic, lactic, acetic, and fumaric acids were used (procured from Sigma). Concentration of individual acids were quantified from the calibration curves of standards and expressed as μmol g−1 root fresh weight while total organic acid was calculated as the sum of individual acids. The relative organic acid was computed by total organic acid exudation under treated conditions divided by total organic acid exudation under control.

2.7. Grain Yield and Its Attributes in Selected Accessions

At maturity, pods were harvested in two pickings, viz. at 42 and 55 days after sowing. Total seed yield was determined by summing up both pickings from single plant, weighed, and expressed as g plant−1. The total number of pods was counted for each plant and expressed as pods per plant. Six pods were randomly selected and threshed, number of seeds were counted, and expressed as number of seeds per pod. For 100-seed weight (test weight), seeds were counted manually and weighed.

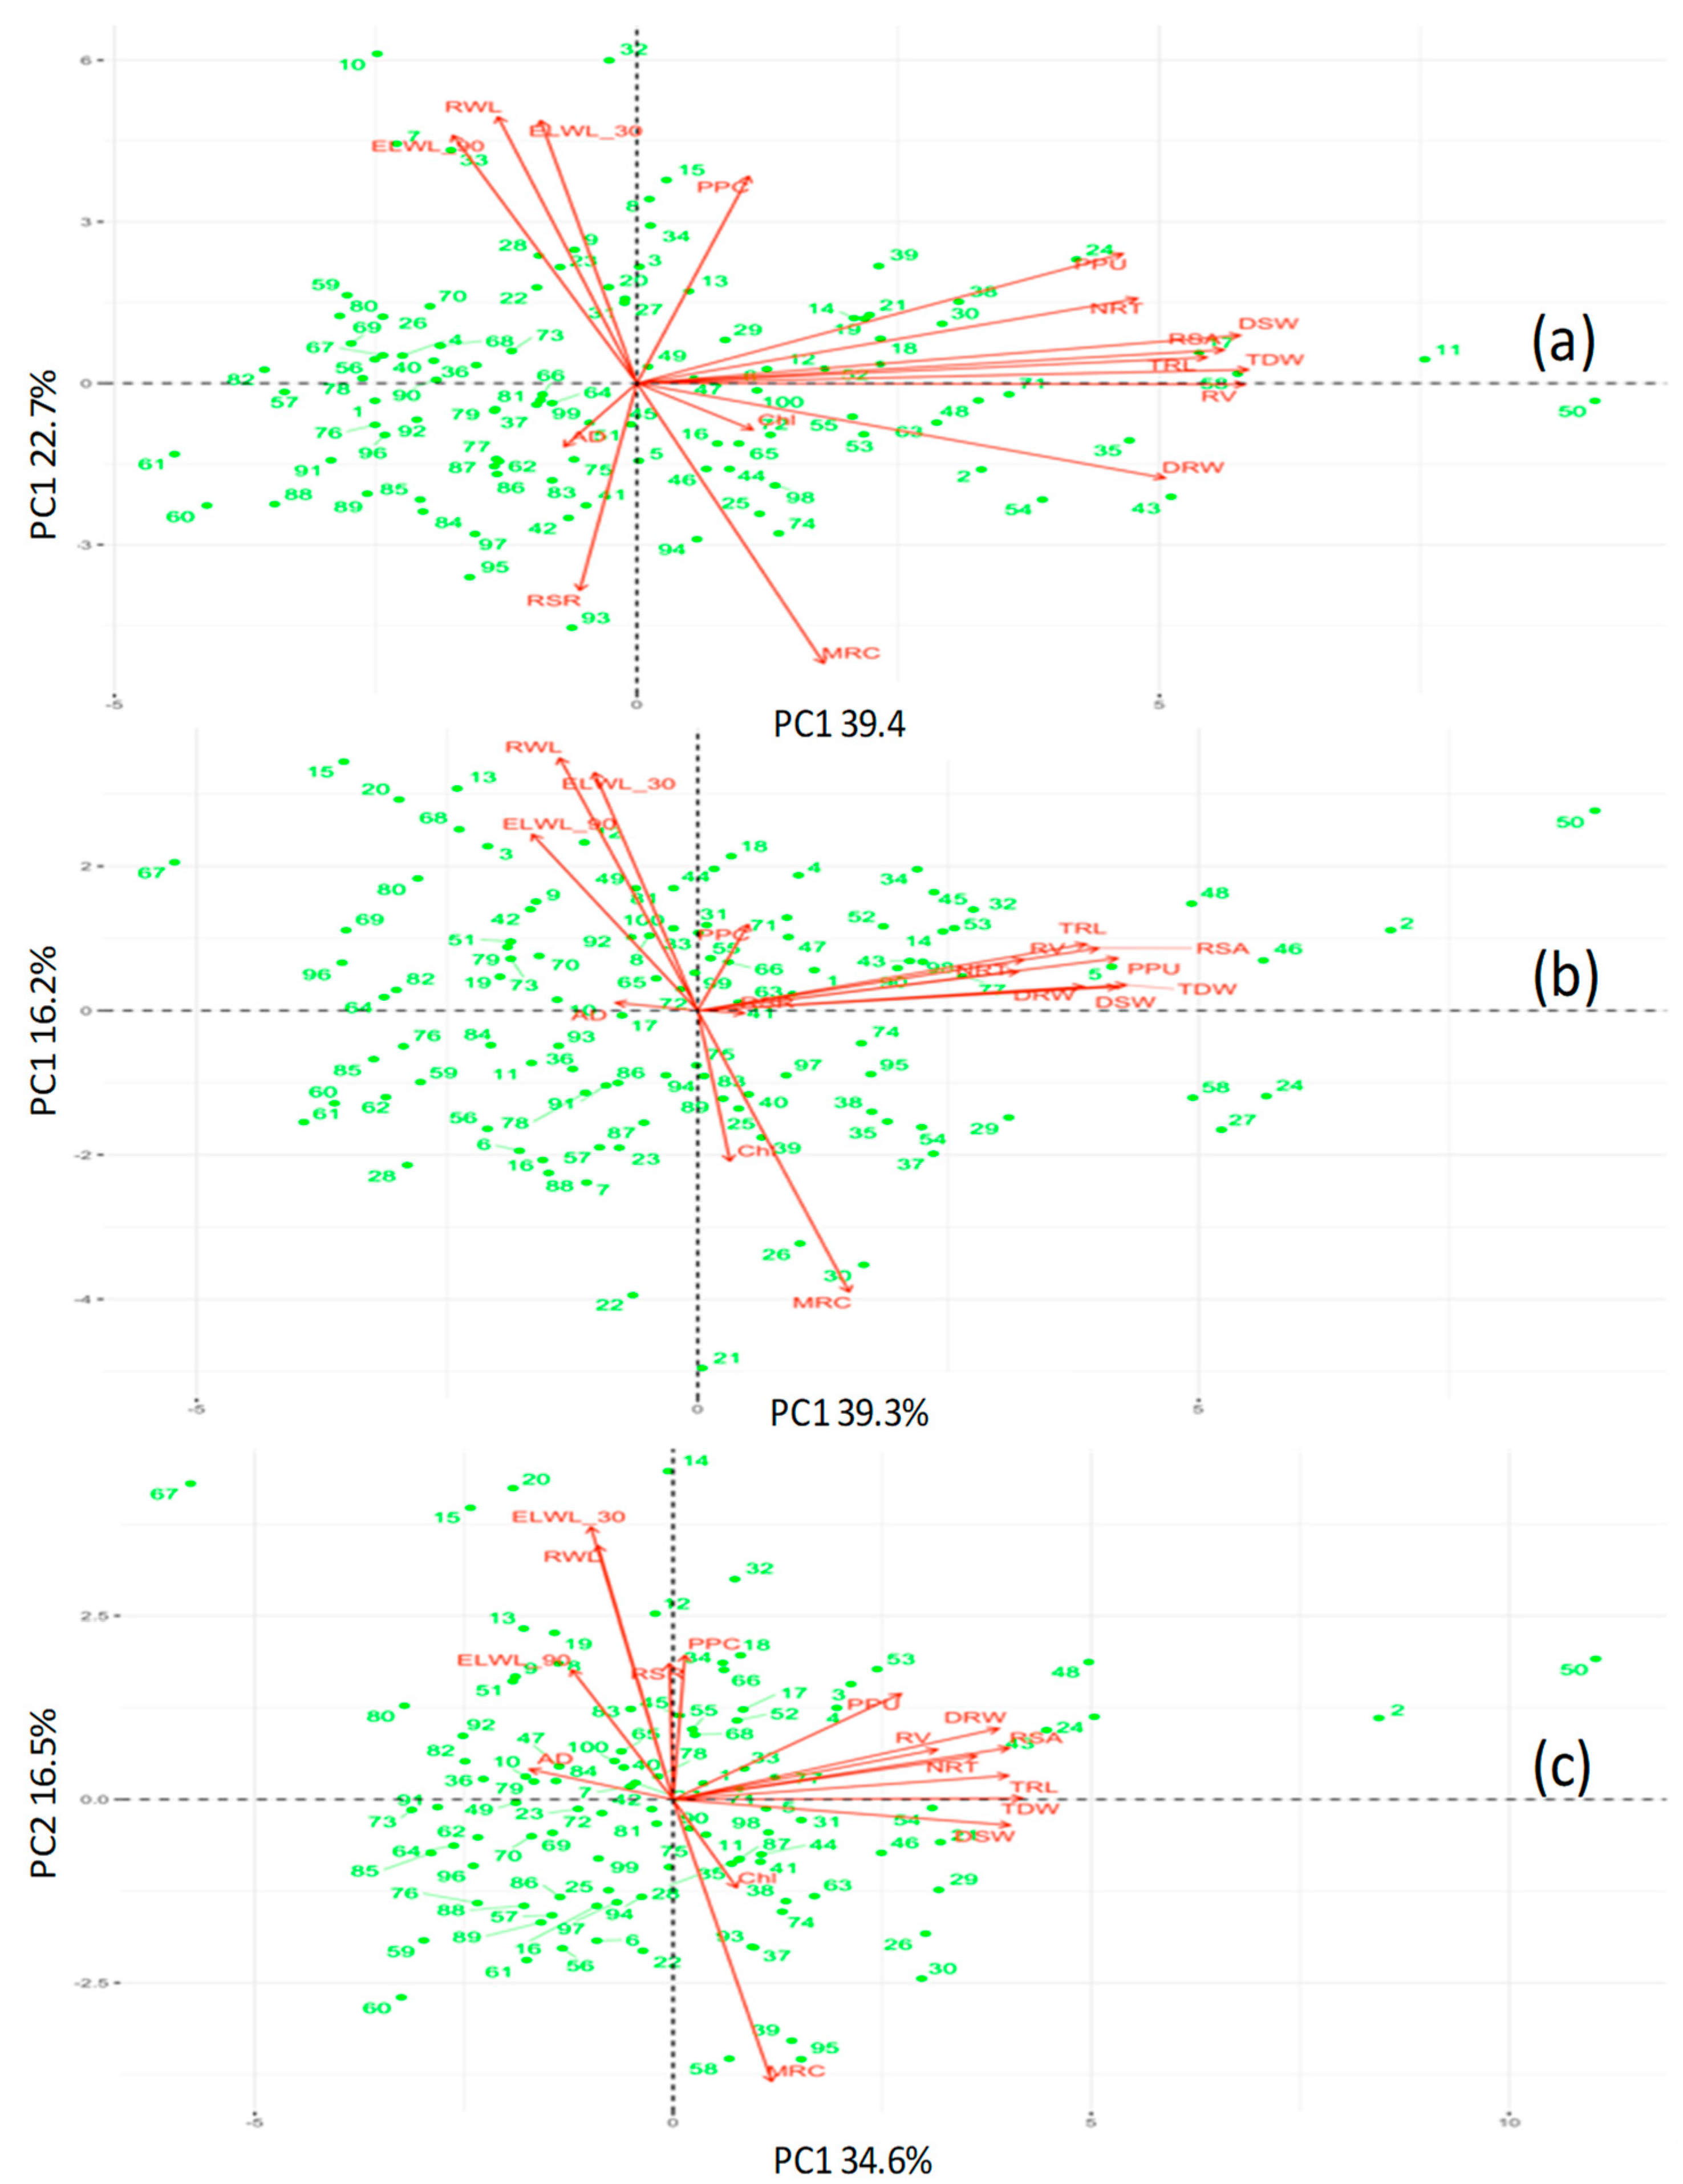
2.8. Stress Tolerance Evaluation in Hydroponics (PCA Ranking)

The stress tolerance of accessions under different treatments were evaluated by calculating the relative value, which was obtained by the formula:
Relative value = (trait value under treatment)/(trait value under controlled) × 100
The principal component analysis (PCA) ranking value was used for assessing stress tolerance of accessions under different treatments. For each mungbean accession, ranking value was determined by the formula [51]:
PCA ranking value = (contribution of PC1 (%) × PC1) + (contribution of PC2 (%) × PC2) + (contribution of PC3 (%) × PC3) + (contribution of PC4 (%) × PC4)

2.9. Statistical Analysis

The experiments were laid out in three-factor factorial completely randomized design (CRD) with two P levels, two water regimes, and mungbean accessions. For basic statistical calculations, three-way analysis of variance (ANOVA) was carried out in the statistical software R version 3.6.1 [52]. Comparison among treatments were performed using critical difference (CD) at the 0.05 probability level. All measured traits were subjected to principal component analysis (PCA) to identify common trend of the multidimensional datasets. PCA was performed using the FactoMineR [53] whereas GraphPad Prism 5.0 and R software were used for data visualization as boxplots and heatmap, respectively.

3. Results

3.1. Evaluation of Diverse Mungbean Set in Hydroponics

The 100 mungbean accessions screened under different treatments in hydroponics culture for traits related to drought stress (excised leaf weight loss, rate of water loss, and moisture retention capacity), biomass (shoot dry weight, root dry weight, total plant dry weight, and root-to-shoot ratio), root morphology (total root length, root surface area, average root diameter, root volume, and number of root tips), and P indices (P concentration and total plant P uptake) were evaluated. The effect of various levels of P, moisture regime, and genotypes as well as their interactive effects (P × W, P × G and W × G) were significant (p ≤ 0.05) for all traits except ELWL (Supplementary Table S2). To evaluate the relative contribution of each trait under different treatments, relative values of all traits were subjected to PCA. It was found that under low P stress, PC1 and PC2 explained 39.4 and 22.7% genotypic variation, respectively (Figure 1a). The traits contributing to this variation under low P stress were total dry weight, shoot dry weight, root dry weight, total root length, root surface area, root volume, moisture retention capacity, rate of water loss, number of root tips, and total plant P uptake. Under drought stress, PC1 and PC2 explained 39.3 and 16.2% genotypic variation, respectively (Figure 1b). The major contributing traits under drought stress were total dry weight, shoot dry weight, root surface area, total root length, total plant P uptake, moisture retention capacity, and rate of water loss. Under combined stress, the PC1 and PC2 explained 34.6% and 16.5% phenotypic variation, respectively (Figure 1c). The most contributing traits to the genetic variation under combined stress were found as total dry weight, shoot and root dry weight, root surface area, total root length, total plant P uptake, moisture retention capacity, and excised leaf weight loss. However, the contributing traits common between three stress treatments were the same as those mentioned for drought stress except for the rate of water loss.

3.2. Differential Response of Contrasting Groups to Low P, Drought and Combined Stress

The PCA ranking values were calculated using loading scores from the relative values of all traits under low P, drought, and combined stresses in the hydroponically grown plants (Table S3). Based on the PCA ranking values, the top 25 accessions with higher rank values were grouped as tolerant and bottom 25 accessions with low rank values were grouped as sensitive to drought, low P, and combined stress (Table 1). The tolerant accessions under all three treatments exhibited higher relative values in comparison to the sensitive ones. In the tolerant group, the average of shoot biomass was reduced by 25, 61, and 76% while in the sensitive group, the reduction was 62, 79, and 82%, respectively, under low P, drought, and combined stress in comparison to control. Similarly, the mean of total biomass in tolerant group was reduced by 14, 58, and 73% whereas in the sensitive group, it decreased by 55, 78, and 81% under low P, drought, and combined stress, respectively, as compared to control. Increase in chlorophyll concentration, a low P stress specific trait, was observed in tolerant group while it decreased under drought in both groups (Figure S3a–c).
The total root length decreased drastically in both groups in all treatments except in tolerant group at low P, which was non-significant (Figure S3d). Under drought and combined stresses, more than 90% reduction was noted in group mean for total root length as compared to control. The mean of root surface area in the tolerant group increased under low P while it decreased in the sensitive group (Figure S3e). Likewise, root surface area also decreased (>80%) under drought and combined stress as compared to control. The average root diameter in both tolerant and sensitive groups increased markedly under drought and combined stress while under low P, less than 15% increase was noted indicating root thickening under drought and combined stress (Figure S3f). The average for root-to-shoot ratio increased in both tolerant and sensitive groups under all treatments as compared to control, maximum being in sensitive group under low P (Figure S3g). A reduction in total P uptake in both groups was observed but it was drastically reduced in sensitive group compared to tolerant group (Figure S3h). On average, the rate of water loss from leaves was lower in both groups under low P stress as compared to control (Figure S3i).
From Table 1, we selected those accessions that were common in all three stress treatments as tolerant and sensitive (Table 1). So, based on the PCA rankings we found six tolerant (IC280489, EC397142, IC76415, IC333090, IC507340, and IC121316) and four (IC119005, IC73401, IC488526, and IC325853) sensitive accessions from the hydroponics experiment. The actual performance of these selected accessions in hydroponics are presented in Figure S4a–i. These accessions were used for detailed physiological studies in soil culture.

3.3. Stress Susceptibility Index of Selected Mungbean Accessions Grown in Soil Culture

The selected 10 accessions from Experiment I were grown in soil under different treatment combinations. We calculated the stress susceptibility index (SSI) for these accessions taking into consideration the above ground dry matter and seed yield in control and low P soil with and without drought stress (Table 2). The ranking was done using online toolkit iPASTIC (https://manzik.com/ipastic/). Based on mean ranking values, these accessions were grouped as tolerant (IC333090, IC507340, IC73401, IC121316, IC76415) and sensitive (IC280489, EC397142, IC119005, IC325853, IC488526). There was a slight change in the groupings of tolerant and sensitive accessions according to SSI as against PCA ranking. However, we followed the tolerant and sensitive groupings derived from SSI values to present the various physiological responses and yield to stress treatments in soil culture.

3.4. Biomass, RWC, and MSI Influenced by Low P, Drought and Combined Stress

Significant (p ≤ 0.05) influence of P levels, drought, and accessions were observed on RWC, MSI, and dry matter accumulation but the P × W interaction was not significant for MSI (Table S4). Averaged over accessions, the above ground dry matter decreased by 16.4, 24.7, and 32.3% in the tolerant group, whereas in the sensitive group, the reduction was 27.4, 33.0, and 48.6% under low P, drought, and combined stress, respectively, as compared to control (Figure 2a). Marked reduction in dry matter accumulation was observed in accession IC488526 followed by IC325853, whereas the least reduction was noted in accession IC333090 followed by IC507340 under combined stress.
Under combined stress, lesser reduction in RWC (13.5%) and MSI (32.9%) was found in tolerant group as compared to sensitive group (RWC 22% and MSI 41.6%) (Figure 2b,c). Further, among the tolerant accessions, the least reduction in RWC was recorded in accessions IC76415 and IC73401 under combined stress. Similarly, the MSI was least affected in IC333090 and IC507340 among the tolerant group while accessions IC488526 and IC280489 were highly influenced by combined stress.

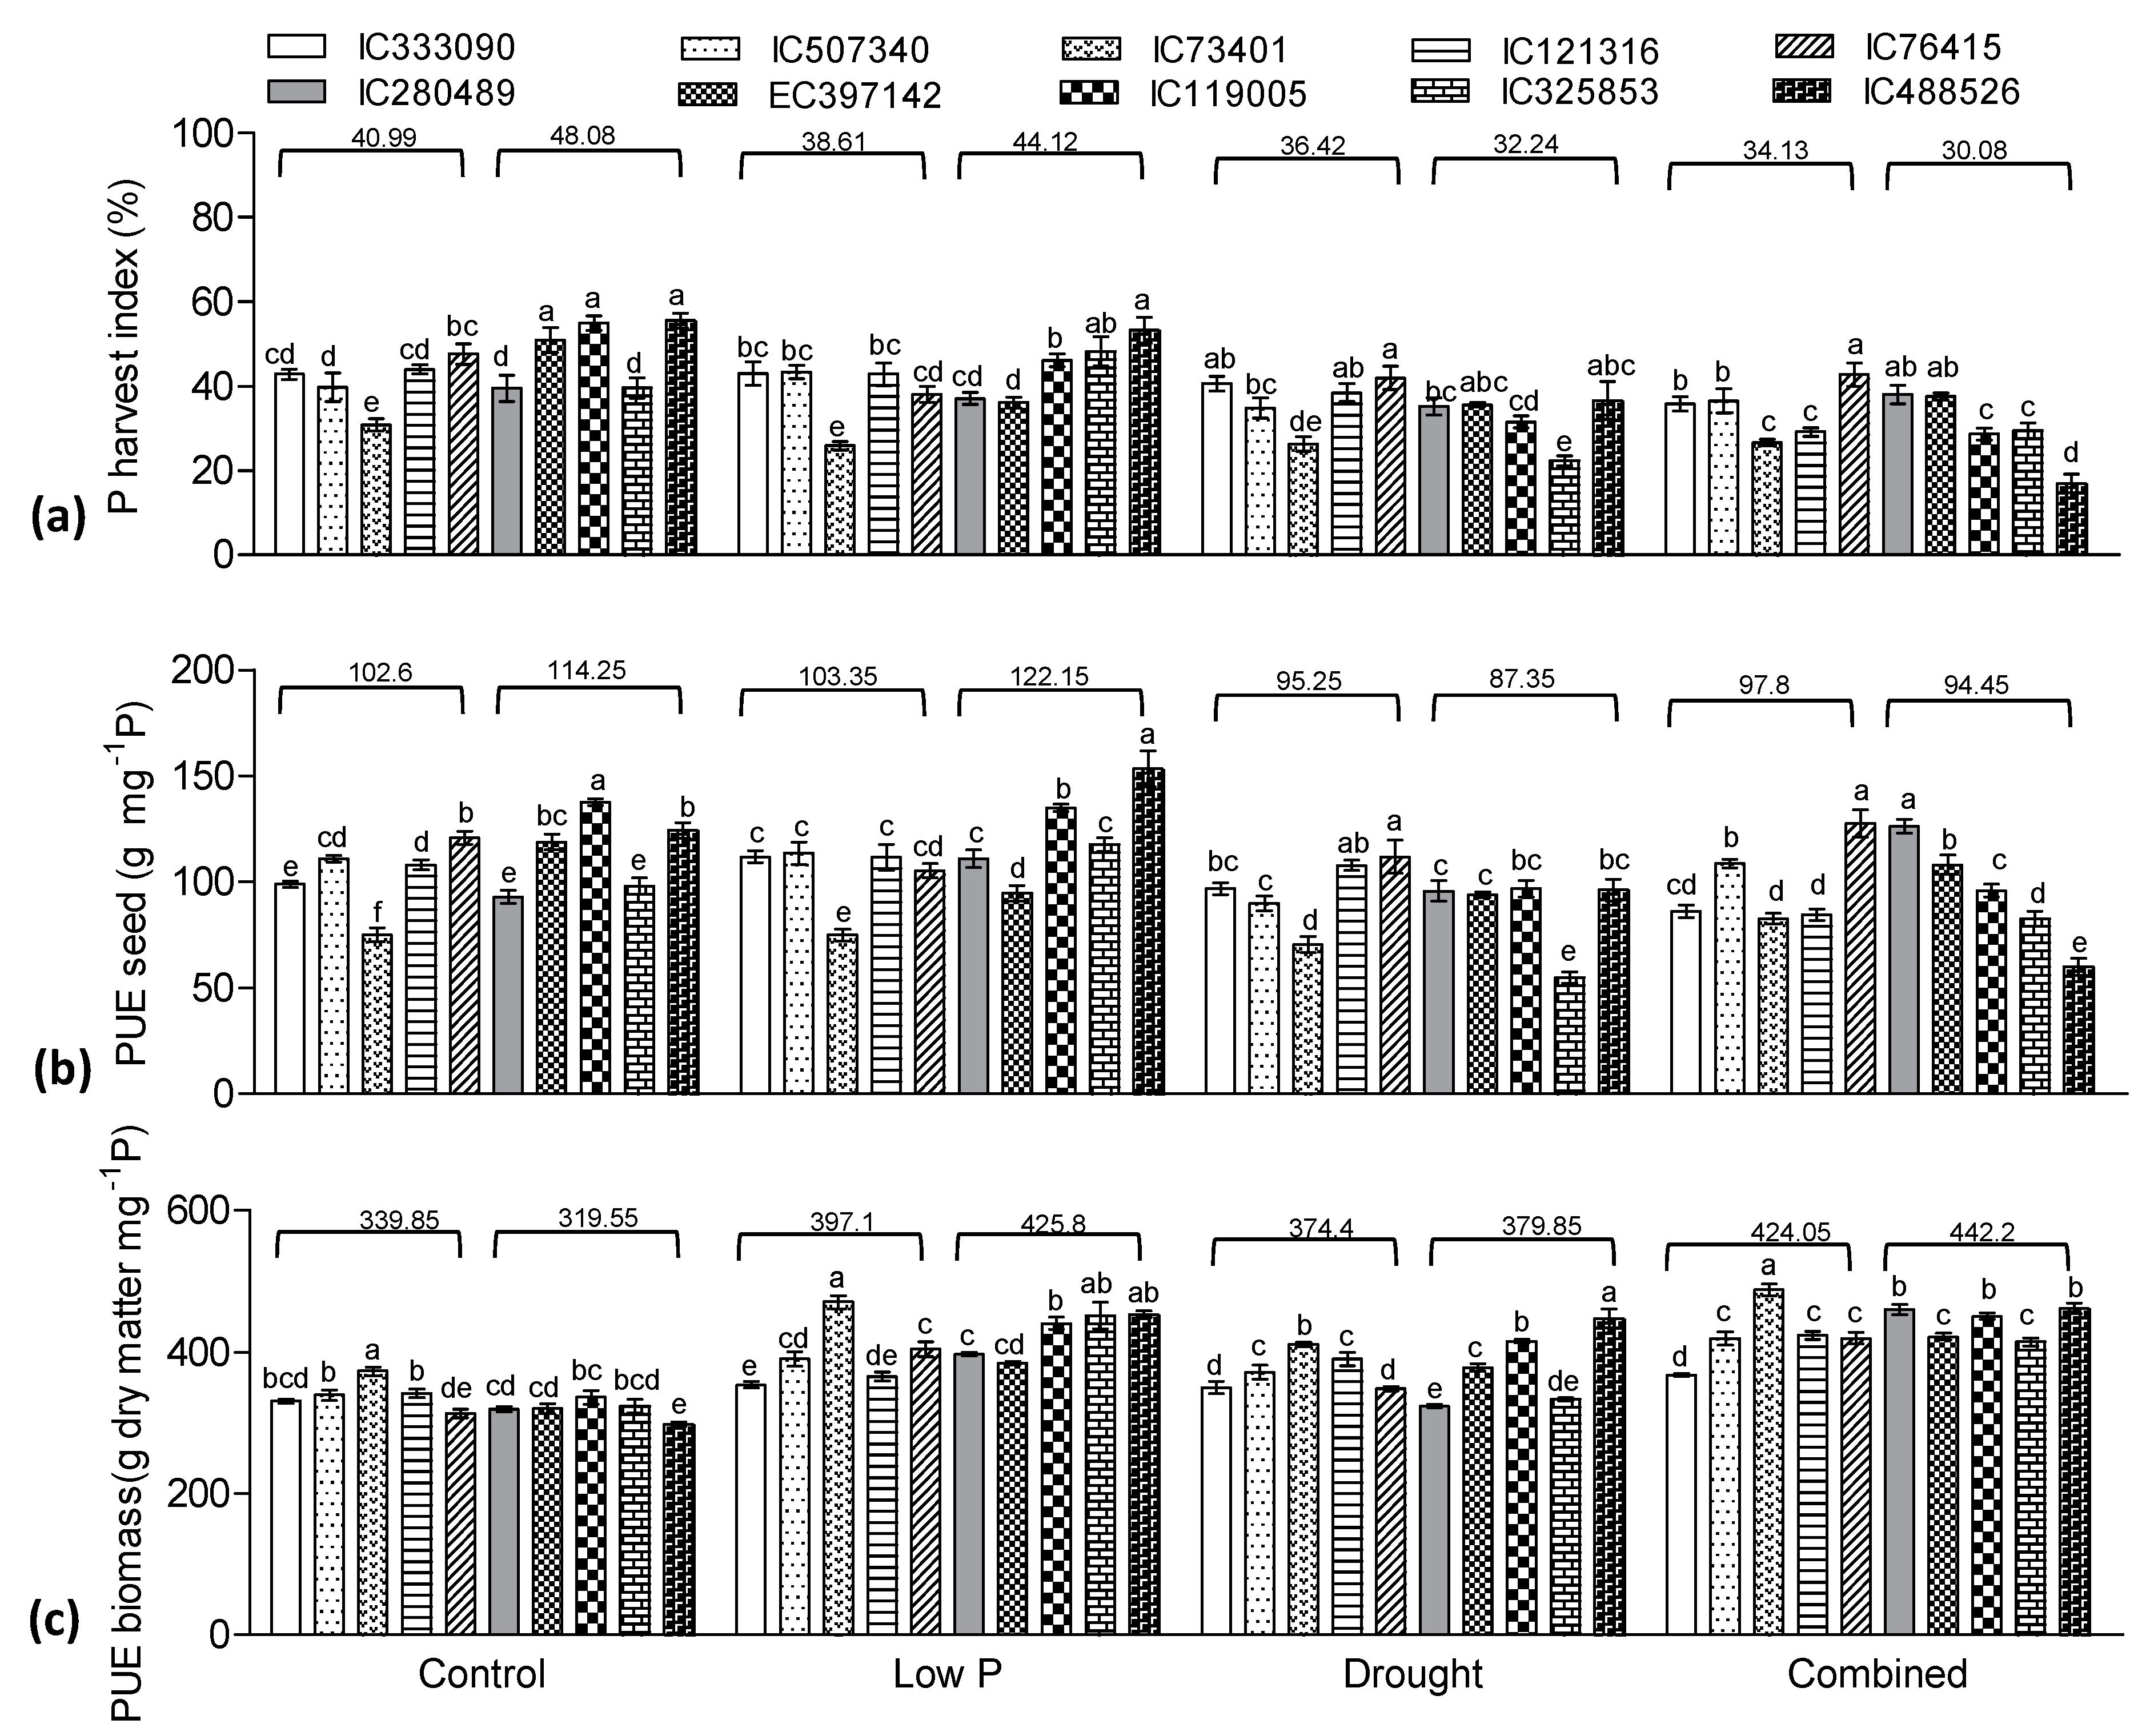
3.5. Effect of Low P, Drought, and Combined Stress on Phosphorus Indices

Though low P and drought significantly reduced the P concentration in shoot and seed, a drastic effect was observed in shoot tissue P concentration under combined stress (Table S4; Figure S3a,c). The reduction in P concentration in seed and shoot in IC333090 was non-significant whereas it was highest (31 to 40%) in IC488526 under combined stress as compared to control. The P uptake in seed and shoot were significantly reduced in all treatments (Figure 3b,d). Among treatments, the maximum reduction in shoot P uptake was noted in combined stress as compared to low P and drought (Figure 3b). Further, the accessions in sensitive group showed higher reduction than the tolerant group. Similarly, the seed P uptake in tolerant group was reduced by 30, 41, and 53% whereas it was 32, 63, and 77% in sensitive group under low P, drought, and combined stress, respectively, as compared to control (Figure 3d). Among accessions, the highest reduction in P uptake in seed and shoot was noted in IC488526 (sensitive) under individual or combined stresses while IC333090 and IC507340 (tolerant) showed least reduction.
The P harvest index (PHI) decreased significantly in all treatments with the highest reduction noted in drought stress as compared to control (Figure 4a). Among tolerant and sensitive groups, the PHI decreased by 37 and 17%, respectively, under combined stress in comparison to control. The PUEg (PUE for grain) averaged over accessions was higher under low P stress while it decreased under drought and combined stress (Figure 4b). This reduction was higher in sensitive rather than the tolerant group. More than a 50% decrease in PUEg under combined stress was noted in accession IC488526. Conversely, the PUEbm (PUE for biomass) was higher in all three treatments as compared to control (Figure 4c). Between treatments, low P stress resulted in higher PUEbm as compared to control while among accessions, the PUEbm was highest in IC488526 (55%) and EC397142 (44%) and least in IC333090 and IC507340.

3.6. Gas Exchange Traits and Photosynthetic Pigments Influenced by Drought and Low P Stress

The gas exchange traits were significantly (p ≤ 0.05) affected by P, W, G, as well as their interactions (P × W, P × G, W × G and P × W × G) except for P × W effect on transpiration (Table S5). Drought and low P stress showed an adverse effect while the combined stress drastically reduced photosynthesis (PN), transpiration (E), and stomatal conductance (gs) (Figure 5a–c). However, recovery from drought and combined stress resulted in a significant increase in PN, E, and gs, the recovery being higher in drought as compared to combined stress. The reduction in PN due to combined stress in sensitive group was 95–98% while it ranged 71–92% in the tolerant group (Figure 5a). Similarly, the rate of transpiration under low P, drought, and combined stress significantly decreased by 13, 70, and 83% in the tolerant group, and by 19, 73, and 92% in the sensitive group, respectively (Figure 5b). The response pattern for gs in all accessions was similar to E (Figure 5c). On the other hand, the IWUE increased under drought and combined stress in comparison to control (Figure 5d). Further, recovery from drought and combined stress resulted in increased IWUE as compared to control, which was the maximum in the sensitive group as compared to that in the tolerant group particularly under recovery from combined stress. Among accessions, IC333090 showed tolerance whereas IC488526 exhibited drastic reduction in gas exchange traits in response to drought, low P, and combined stresses.
Total chlorophyll and carotenoid concentration in leaves were significantly influenced by P, moisture regimes, and accessions as well as their interactions. However, the effect of P and P × W interaction was not significant for total chlorophyll (Table S5; Figure S5a,b). Averaged over accessions, total chlorophyll was higher in tolerant group under combined stress as compared to control. The value averaged over accessions for carotenoid showed increased concentration by 27.9 and 16.4% in tolerant and sensitive groups, respectively, under combined stress.

3.7. Organic Acid Exudation in Response to Low P, Drought and Combined Stress

The quantity of various organic acids in root exudate was significantly (p ≤ 0.05) influenced by P, W, and G, as well as their interaction effects (Table S6, Table 3, Table 4 and Table 5). In general, exudation of organic acid was higher under low P as compared to control except for pyruvate, which showed reduction under all treatments. Interestingly, no additive effect of drought under low P stress was found on total organic acid exudation in either groups. Oxalate was not detected in control and drought, but low P stress showed considerable exudation. However, combined stress induced significantly higher quantity of oxalate, but the accessions exhibited differential response. Similarly, citrate was induced under low P and combined stress but there was differential response of accessions under drought as 4 out of 10 accessions exuded remarkably higher quantity of citrate.
Under low P stress, exudation of maleate (4.8-fold), lactate (3.4-fold), α-ketoglutarate (2.9-fold), fumarate (1.8-fold), and succinate (1.3-fold) increased in the tolerant as compared to the sensitive group, but the quantity of acetate and malonate was higher in the sensitive group. Likewise, under drought stress, the amount of maleate (6.5-fold), lactate (3.4-fold), succinate (2.7-fold), malate (2.2-fold), and fumarate (1.4-fold) increased in the tolerant as compared to the sensitive group. Among these accessions, low P and drought stress induced maximum quantity of total organic acid in IC73401 while under combined stress, it was maximum in IC333090, which was higher than the average of the tolerant group. Likewise, IC325853 exuded consistently increased amount of total organic acid under all treatments, which was higher than the average of the sensitive group.

3.8. Yield Traits Influenced by Drought and Low P Stress

All the sources of variability (P, W, and G) had significant (p < 0.05) effects on yield and its attributes, except for the number of seed per pod, which was found to be non-significant for P × W interaction (Table S4). In general, yield traits showed a significant reduction under all stress treatments in comparison to control (Figure 6). Seed yield was the most adversely affected trait whereas 100-seed weight was least affected under low P, drought, or combined stress. The number of pods plant−1, number of seeds pod−1, seed yield, and HI were maintained higher in the tolerant group as compared to the sensitive group under stress treatments.
Among stress treatments, combined stress resulted in drastic reduction in seed yield, with the maximum reduction being noted in the sensitive (70%) rather than the tolerant (45%) group in comparison to control. Among accessions, the least reduction was observed in IC507340 (34%) and IC333090 (37%) whereas more than 90% decrease in seed yield was found in IC488526 and IC325853. Similarly, HI decreased by 21 and 44% in tolerant and sensitive groups, respectively, under combined stress in comparison to control.

4. Discussion

4.1. Interaction of Low P and Drought on Growth and Root Traits in Hydroponics

Trait identification is one of the important steps in selecting the tolerant genotypes for abiotic stresses. Phenotyping of diverse mungbean set under low P, drought, and combined stress was carried out in hydroponics. The PCA revealed the most contributing traits governing genotypic variability and common in all stresses were total plant dry weight, shoot dry weight, root surface area, total root length, moisture retention capacity, and plant P uptake (Figure 1). Further, the PCA ranking allowed categorization of accessions into tolerant and sensitive groups. Similar ranking approach was reported in barley, wheat, and switchgrass under drought stress [51,54,55].
The shoot and root traits were less affected by low P and drought stress in tolerant group as compared to sensitive group (Figure S3a–e). Our results are in accordance with those reported in lentil phenotyped in hydroponics as well as in soil culture and subjected to drought stress [43]. However, low P significantly reduced the shoot and root dry weight in chickpea [56]. Increased root growth is associated with improved ability of plants to mine soil moisture and nutrients. Our findings are in conformity with studies in lentil [57], green gram [58,59], soybean [60], and wheat [61] indicating low P alters root architectural traits such as total root length, surface area, and root-to-shoot ratio. Increased root-to-shoot ratio is associated with higher investment of photosynthates towards root growth, which further enhances P acquisition. Low P tolerant pigeon pea (Cajanus cajan) genotypes exhibited higher root surface area, total root length, root dry mass, root-to-shoot ratio, and leaf P content [62].
The average root diameter in tolerant group was significantly less under low P as compared to sensitive one indicating the importance of more fine roots in P acquisition. Our result is in agreement with reference [63] who also reported lesser root diameter under low P in lentil. It is shown that shallow root system with more basal roots is efficient in P acquisition in soil with less bioavailable P whereas deeper root system contributes to terminal moisture stress condition [64]. Our findings showed that combined stress significantly reduced the shoot and root dry weight, similar to that reported in soybean [65,66].

4.2. Combined Low P and Drought Stress Has Additive Effect on Organic Acid Exudation

We observed several folds increase in exudation of total organic acid consistently under low P, drought, and combined stress in accessions IC73401, IC121316, and IC333090 as compared to control. Among various organic acids analyzed, low P stress induced exudation of maleate, α-ketoglutarate, oxalate, citrate, succinate, lactate, acetate, and fumarate (Table 3, Table 4 and Table 5). Root released organic acids have been widely documented as a key physiological strategy to mobilize P in soils containing low bioavailable P [56,67]. These organic acids could mobilize soil P ranging between 20 to 30 mg P kg−1 soil whereas root exudates mobilized >40 mg P kg−1 soil [50]. This difference in soil P mobilization by root exudate and standard organic acids could be due to the fact that exudates are a mixture of many other carboxylates, which needs to be explored. Further, genotypic variability in organic acid exudation in response to low P have been reported in chickpea [68], mungbean [58], and soybean [50] among legume crops. A positive correlation between shoot P content and organic acid per plant in chickpea and mungbean were reported [69,70].
Drought stress also induced root exudation of maleate, citrate, and lactate in some accessions while acetate and fumarate were exuded in significant amounts in almost all accessions. However, the accessions responded differently to combined stress where succinate was also exuded significantly higher in 6 out of 10 accessions. In IC333090, the additive effect of drought and low P stress was noted for maleate, succinate, and fumarate while in IC121316, malonate, lactate, and acetate were significantly higher in root exudate. There are very few reports available on drought induced organic acid exudation into rhizosphere [71,72]. In crested wheatgrass (Agropyron cristatum) grown in sand, the drought induced exudation was composed of fumaric and succinic acids while oxalic, malic, and malonic acids were also detected [71]. On the other hand, corn plants grown hydroponically and osmotic stress imposed by using PEG-6000 resulted in highest exudation of malic acid [72]. They also detected significant quantities of lactic, acetic, citric, maleic, and succinic acids besides a 10-fold increase in fumaric acid in drought sensitive corn genotype. However, these experiments were performed under controlled conditions and the media used was other than the soil. These reports suggest that organic acids exuded under drought or osmotic stress could possibly mobilize the fixed-P, thereby improving the potential for P uptake by plants as the mobility of P in rhizosphere decreases during drought stress. We did not find any report of organic acid exudation in rhizosphere under combined stress of low P and drought grown in soil, which may result in altered composition of organic acids in the exudates.

4.3. Combined Stress Influences Water Relation, Pigment Concentration and Gas Exchange

In soil culture, mungbean accessions showed differential response to RWC and MSI, with the tolerant ones exhibiting higher values under combined stress (Figure 2b,c). Leaf RWC is a better indicator of plant water status than water potential under abiotic stress [73]. Further, we observed higher MSI values in drought stressed plants supplied with sufficient P than the combined stress. Similar positive effects of P application on African violet (Saintpaulia ionantha) plants grown under drought have been attributed to improved water relations and drought tolerance [74]. Increased MSI was found to be associated with osmotic adjustment at higher levels of P nutrition under water stress condition in maize [75].
In the present study, total chlorophyll was significantly reduced under drought stress in comparison to control in sensitive accessions (IC73401 and IC280489) (Figure S5a,b). Several reports mentioned a reduction in chlorophyll in several crops exposed to drought stress such as in common bean [20], cluster bean [21], soybean [76], chickpea [77], and mungbean [22]. Although increased chlorophyll concentration is a typical trait under low P stress, we did not find significant change, which corroborates with results in common bean [78].
The gas exchange traits (A, E and gs) decreased under drought but the reduction was drastic under combined stress (Figure 5a–c). Stomatal limitations reduced the gaseous exchange between leaf and atmosphere, which is the main cause for reduced A, E, and gs. These corroborates with earlier reports in legume crops such as Fababean [79], chickpea [77], common bean [80,81] and mungbean [22,82] under drought stress. The physiological mechanism has been explained in other studies, which states that stomatal closure mediated by ABA during drought stress is the primary limitation of photosynthesis [83,84]. In addition to sensitizing stomata to water stress, low P increased ABA accumulation during moisture stress in cotton [14]. Further, low P availability reduces the Pi concentration in chloroplast stroma, which inhibits ATP synthase activity and cause the lumen acidification due to proton accumulation, ultimately leading to linear electron flow inhibition [85] Plants with low P also showed a reduction in gas exchange traits in chickpea [86]. Higher P concentration in plants improve instantaneous WUE because it controls the suppression of photosynthesis per unit of water transpired [9,87] and maintains stomatal conductance [12]. A significant correlation was reported between transpiration ratio and leaf P concentration in tobacco (Nicotiana tabacum), wheat, and sunflower (Helianthus annuus) under sufficient P [88]. The transpiration ratio, the ratio of water transpired per unit carbon fixed, is considered as an important plant trait under dry condition. Similar to our results, the enhancement in photosynthetic activity through application of phosphatic fertilizer under drought stress was reported in cluster bean [37].

4.4. Influence of Combined Stress on Growth, Yield, P Uptake and P Use Efficiency

Accumulation of shoot biomass was adversely affected by low P and drought stress in the present study (Figure 2a). Similar reduction in shoot biomass was reported in mungbean [58] and soybean [50] under low P, and less dry matter in mungbean under drought [22]. We also noted reduction in P concentration and P uptake in shoot and grain under low P, drought, and combined stress, which is obviously due to low tissue P concentration and less soil moisture availability limiting P mobility. Drastic decrease in P uptake under combined stress was the result of less biomass accumulation but differential response of accessions was noted (Figure 3a–d). Shoot biomass and shoot P uptake were the most sensitive traits to P deficiency in common bean and soybean genotypes [89,90]. Similar reduction in P uptake and biomass accumulation in common bean under moisture deficit was reported earlier [91]. Drought stress drastically affects P uptake in wheat plants leading to 62% reduction, which is in accordance with our results [92]. Increased root growth and higher organic acid exudation in accessions IC333090, IC73401, and IC507340 might have resulted in the least reduction in P uptake under drought or combined stress leading to efficient P mobilization.
There are several reports stating significant reduction in yield in mungbean subjected to either drought stress [22,27,93,94] or low P [58,95]. Our results are in agreement with studies in clover [96], soybean [40,41,65], mungbean [97], and cowpea [98], which showed that P application to legumes exposed to drought improves yield and other attributes. An increased linear relationship was reported at different levels of P fertilization and grain yield and its attributes in chickpea [39] and soybean [41,65]. In cluster bean, faster recovery upon re-watering and enhanced grain yield was noticed in drought stressed plants grown with P as compared to without P fertilization [37].
In our study, the PHI and PUE was significantly affected by low P and drought in mungbean genotypes (Figure 4a–c). PHI decreased under low P and drought conditions, however the combined stress markedly affected the PHI and PUEg in both contrasting groups. The higher PHI and PUEg was found in tolerant accessions rather than sensitive ones (Figure 4a,b) indicating better translocation and remobilization of photosynthates and P from vegetative to reproductive parts. The PUEbm obtained higher in sensitive group as compared to tolerant where P uptake was less. These results were in conformity with reference [99] who reported a strong negative correlation between PUE for shoot biomass and P uptake in rice. PUEg have been considered as a better trait as compared to PUEbm due its more positive correlation with harvest index as well as PHI [99,100].

5. Conclusions

We systematically identified contrasting mungbean accessions from the diverse set based on their physiological performance under low P, drought, and combined stress conditions. IC333090 and IC507340 accessions showed considerable tolerance to low P and drought with significantly lesser reduction exhibited for gas exchange traits, dry matter, and grain yield under all stress treatments. Further, organic acid exudation from roots was enhanced significantly in these accessions, which aids in P uptake. These tolerant accessions can be used as ‘donors’ in the mungbean improvement programs for developing varieties with enhanced agronomic performance under combined stress. Further, the contrasting material may be used to identify the genes/genomic regions by developing mapping populations and design suitable markers to be used in the molecular breeding program. The major contributing traits for combined stress tolerance such as shoot dry weight, RWC, organic acid exudation, grain yield, and P uptake can be used as physiological markers for evaluating the germplasm for combined stress tolerance. Further, we confirmed that P application not only increases the PUE, but also improves growth and yield under drought conditions corroborating the role of P in amelioration of adverse effects of water deficit stress.

Supplementary Materials

The following are available online at https://www.mdpi.com/2073-4395/11/1/99/s1, Figure S1: (a) Experimental layout in the Issapur Farm, NBPGR, New Delhi with 1232 diverse mung bean accessions, (b) accession showing mid-day wilting, and (c) accession tolerant to mid-day wilting. Figure S2: Growth of mungbean seedlings in hydroponics at different phosphorus concentration to identify the optimum and low P levels. Growth traits such as (a) total chlorophyll, (b) leaf area, (c) total dry weight, and (d) root-to-shoot ratio were recorded on 21 days old seedlings in two accessions, MH 421 and IPM 2-3. Figure S3: Variation among contrasting group of mungbean genotypes with respect to (a) shoot biomass, (b) total biomass, (c) chlorophyll concentration, (d) total root length, (e) root surface area, (f) root average diameter, (g) root-to-shoot ratio, (h) total P uptake, (i) rate of water loss at control, low P, drought, and combined stress conditions. Figure S4: Effect of low P, drought, and combined stress on concentration of (a) total chlorophyll, and (b) carotenoid in 10 mungbean accessions. 1–5 and 6–10 represents tolerant and sensitive accessions, respectively. Table S1: Passport data of 100 diverse mungbean accessions grown in hydroponics culture to screen for low phosphorus and drought stress tolerance. Table S2: The significance of sources of variability for accessions (G, 100 accessions), phosphorus (P, 2 levels), moisture (W, 2 levels) and their interaction effects on growth, water balance and root traits of mungbean accessions grown in hydroponics. *** p < 0.001, ** p < 0.01, * p < 0.05, NS non-significant. Table S3: The PCA ranking values derived from principal components (PC) 1 to 4 using 14 physiological traits of mungbean under low P, drought, and combined stresses. Table S4: The significance of sources of variability for accessions (G, 10), phosphorus (P, 2 levels), moisture (W, 2 levels), and their interaction effects on growth and yield traits of mungbean accessions grown in soil. *** p < 0.001, ** p < 0.01, * p < 0.05, NS- not significant Table S5: The significance of sources of variability for accessions (G, 10), phosphorus (P, 2 levels), moisture (W, 2 levels), and their interaction effects on photosynthetic pigments and gas exchange traits of mungbean accessions grown in soil. *** p < 0.001, ** p < 0.01, * p < 0.05, NS- not significant Table S6: The significance of sources of variability for accessions (G, 10), phosphorus (P, 2 levels), moisture (W, 2 levels) and their interaction effect on root organic acid exudation of mungbean accessions grown in hydroponics. *** p < 0.001, ** p < 0.01, * p < 0.05, NS, not significant.

Author Contributions

Conceptualization, R.P.; methodology, S.K.M. and R.P.; investigation, S.K.M., S.S., T.K.; resources, R.P., M.P.S., G., and H.K.D.; data curation, S.K.M. and R.P.; writing—original draft preparation, S.K.M.; writing—review and editing, R.P., S.S., G., H.K.D., and M.P.S.; supervision, R.P.; project administration, R.P. All authors have read and agreed to the published version of the manuscript.

Funding

The APC was shared by all authors.

Institutional Review Board Statement

Not applicable.

Informed Consent Statement

Not applicable.

Conflicts of Interest

The authors declare no conflict of interest.

References

  1. Singh, D.P.; Singh, B.B. Breeding for tolerance to abiotic stresses in mungbean. Food Legumes 2011, 24, 83–90. [Google Scholar]
  2. Kochian, L.V. Plant nutrition: Rooting for more phosphorus. Nature 2012, 488, 466. [Google Scholar] [CrossRef] [PubMed]
  3. Dunham, R.J.; Nye, P.H. The influence of soil water content on the uptake of ions by roots. III. Phosphate, potassium, calcium and magnesium uptake and concentration gradients in soil. J. Appl. Ecol. 1976, 13, 967–984. [Google Scholar] [CrossRef]
  4. Mackay, A.D.; Barber, S.A. Soil moisture effects on root growth and phosphorus uptake by corn. Agron. J. 1985, 77, 519–523. [Google Scholar] [CrossRef]
  5. Pinkerton, A.; Simpson, J.R. Interactions of surface drying and subsurface nutrients affecting plant growth on acidic soil profiles from an old pasture. Aust. J. Exp. Agric. 1986, 26, 681–689. [Google Scholar] [CrossRef]
  6. Zhang, D.; Lyu, Y.; Li, H.; Tang, X.; Hu, R.; Rengel, Z.; Zhang, F.; Whalley, W.R.; Davies, W.J.; Cahill, J.F., Jr.; et al. Neighbouring plants modify maize root foraging for phosphorus: Coupling nutrients and neighbours for improved nutrient-use efficiency. New Phytol. 2020, 226, 244–253. [Google Scholar] [CrossRef]
  7. Rouphael, Y.; Cardarelli, M.; Lucini, L.; Rea, E.; Colla, G. Nutrient solution concentration affects growth, mineral composition, phenolic acids, and flavonoids in leaves of artichoke and cardoon. Hort Sci. 2012, 47, 1424–1429. [Google Scholar] [CrossRef] [Green Version]
  8. Zheng, H.F.; Chen, L.D.; Yu, X.Y.; Zhao, X.F.; Ma, Y.; Ren, Z.B. Phosphorus control as an effective strategy to adapt soybean to drought at the reproductive stage: Evidence from field experiments across northeast China. Soil Use Manag. 2015, 31, 19–28. [Google Scholar] [CrossRef] [Green Version]
  9. Singh, D.K.; Sale, P.W.; Pallaghy, C.K.; McKenzie, B.M. Phosphorus concentrations in the leaves of defoliated white clover affect abscisic acid formation and transpiration in drying soil. New Phytol. 2000, 146, 249–259. [Google Scholar] [CrossRef]
  10. Garg, B.K.; Burman, U.; Kathju, S. The influence of phosphorus nutrition on the physiological response of moth bean genotypes to drought. J. Plant Nutr. Soil Sci. 2004, 167, 503–508. [Google Scholar] [CrossRef]
  11. Hawkesford, M.; Horst, W.; Kichey, T.; Lambers, H.; Schjoerring, J.; Møller, I.S.; White, P. Functions of macronutrients. In Marschner’s Mineral Nutrition of Higher Plants, 3rd ed.; Academic Press: Amsterdam, The Netherlands, 2012; pp. 135–189. [Google Scholar]
  12. Waraich, E.A.; Ahmad, R.; Ashraf, M.Y. Role of mineral nutrition in alleviation of drought stress in plants. Aust. J. Crop Sci. 2011, 5, 764. [Google Scholar]
  13. Bruck, H.; Payne, W.A.; Sattelmacher, B. Effects of phosphorus and water supply on yield, transpirational water-use efficiency, and carbon isotope discrimination of pearl millet. Crop Sci. 2000, 40, 120–125. [Google Scholar] [CrossRef]
  14. Radin, J.W. Stomatal responses to water stress and to abscisic acid in phosphorus-deficient cotton plants. Plant Physiol. 1984, 76, 392–394. [Google Scholar] [CrossRef] [PubMed]
  15. Saneoka, H.; Fujita, K.; Ogata, S. Effect of phosphorus on drought tolerance in Chloris gayana Kunth and Coix lacryma-jobi L. Soil Sci. Plant Nutr. 1990, 36, 267–274. [Google Scholar] [CrossRef]
  16. Miller, C.R.; Ochoa, I.; Nielsen, K.L.; Beck, D.; Lynch, J.P. Genetic variation for adventitious rooting in response to low phosphorus availability: Potential utility for phosphorus acquisition from stratified soils. Funct. Plant Biol. 2003, 30, 973–985. [Google Scholar] [CrossRef] [Green Version]
  17. Beebe, S.E.; Rao, I.M.; Cajiao, C.; Grajales, M. Selection for drought resistance in common bean also improves yield in phosphorus limited and favourable environments. Crop Sci. 2008, 48, 582–592. [Google Scholar] [CrossRef]
  18. Cichy, K.A.; Snapp, S.S.; Blair, M.W. Plant growth habit, root architecture traits and tolerance to low soil phosphorus in an Andean bean population. Euphytica 2009, 165, 257–268. [Google Scholar] [CrossRef]
  19. Xu, H.X.; Weng, X.Y.; Yang, Y. Effect of phosphorus deficiency on the photosynthetic characteristics of rice plants. Russ. J. Plant Physiol. 2007, 5, 741–748. [Google Scholar] [CrossRef]
  20. Kusvuran, S.; Dasgan, H.Y. Effects of drought stress on physiological and biochemical changes in Phaseolus vulgaris L. Legume Res. Int. J. 2017, 40, 55–62. [Google Scholar]
  21. Shubhra, D.J.; Goswami, C.L.; Munjal, R. Influence of phosphorus application on water relations, biochemical parameters and gum content in cluster bean under water deficit. Biol. Plant. 2004, 48, 445–448. [Google Scholar] [CrossRef]
  22. Baroowa, B.; Gogoi, N.; Paul, S.; Baruah, K.K. Response of leaf water status, stomatal characteristics, photosynthesis and yield in black gram and green gram genotypes to soil water deficit. Funct. Plant Biol. 2015, 42, 1010–1018. [Google Scholar] [CrossRef] [PubMed]
  23. Manavalan, L.P.; Guttikonda, S.K.; Phan Tran, L.S.; Nguyen, H.T. Physiological and molecular approaches to improve drought resistance in soybean. Plant Cell Physiol. 2009, 50, 1260–1276. [Google Scholar] [CrossRef] [PubMed] [Green Version]
  24. Sarkar, K.K.; Mannan, M.A.; Haque, M.M.; Ahmed, J.U. Physiological basis of water stress tolerance in soybean. Bangladesh Agron. J. 2015, 18, 71–78. [Google Scholar] [CrossRef]
  25. Nunes, C.; de Sousa Araújo, S.; da Silva, J.M.; Fevereiro, M.P.S.; da Silva, A.B. Physiological responses of the legume model Medicago truncatula cv. Jemalong to water deficit. Environ. Exp. Bot. 2008, 63, 289–296. [Google Scholar] [CrossRef]
  26. Kumar, A.; Sharma, K.D. Physiological responses and dry matter partitioning of summer mungbean (Vigna radiata L.) genotypes subjected to drought conditions. J. Agron. Crop Sci. 2009, 195, 270–277. [Google Scholar] [CrossRef]
  27. Bangar, P.; Chaudhury, A.; Tiwari, B.; Kumar, S.; Kumari, R.; Bhat, K.V. Morphophysiological and biochemical response of mungbean (Vigna radiata (L.) Wilczek) varieties at different developmental stages under drought stress. Turk. J. Biol. 2019, 43, 58–69. [Google Scholar] [CrossRef] [PubMed]
  28. Lakshmi, N.J.; Vanaja, M.; Maheswari, M.; Yadav, S.K.; Reddy, P.R.; Venkateswarlu, B. Excised leaf water retention capacity (ELWRC) technique for screening blackgram genotypes for yield. J. Food Legumes 2009, 22, 211–212. [Google Scholar]
  29. Raina, S.K.; Govindasamy, V.; Kumar, M.; Singh, A.K.; Rane, J.; Minhas, P.S. Genetic variation in physiological responses of mung beans (Vigna radiata (L.) Wilczek) to drought. Acta Physiol. Plant. 2016, 38, 263. [Google Scholar] [CrossRef]
  30. Ramirez-Vallejo, P.; Kelly, J.D. Traits related to drought resistance in common bean. Euphytica 1998, 99, 127–136. [Google Scholar] [CrossRef]
  31. Clarke, J.M. Use of physiological and morphological traits in breeding programmes to improve drought resistance of cereals. In Proceedings of the An International Symposium on Improving Winter Cereals for Moisture-Limiting Areas, Capri, Italy, 27–31 October 1985. Chapter 14 (No. 94-096462. CIMMYT). [Google Scholar]
  32. Acosta-Gallegos, J.A.; Adams, M.W. Plant traits and yield stability of dry bean (Phaseolus vulgaris) cultivars under drought stress. J. Agric. Sci. 1991, 117, 213–219. [Google Scholar] [CrossRef]
  33. Zare, M.; Dehghani, B.; Alizadeh, O.; Azarpanah, A. The evaluation of various agronomic traits of mungbean (Vigna radiata L.) genotypes under drought stress and non-stress conditions. Int. J. Farming Allied Sci. 2013, 2, 764–770. [Google Scholar]
  34. Nadeem, M.; Li, J.; Yahya, M.; Sher, A.; Ma, C.; Wang, X.; Qiu, L. Research progress and perspective on drought stress in legumes: A Review. Int. J. Mol. Sci. 2019, 20, 2541. [Google Scholar] [CrossRef] [PubMed] [Green Version]
  35. Gupta, S.C.; Sukhlal, N.; Paliwal, K.K. Effect of phosphorus levels and microbial inoculants on symbiotic traits, N and P uptake, quality and yield of rainfed chickpea. All India Coordinated Project Improvement of Pulse. R.A.K. College of Agriculture Sehore. In Proceedings of the 3rd European Conference in Grain Legumes, Valladolid, Spain, 14–19 November 1998; pp. 418–419. [Google Scholar]
  36. Burman, U.; Garg, B.K.; Kathju, S. Interactive effects of thiourea and phosphorus on cluster bean under water stress. Biol. Plant. 2004, 48, 61–65. [Google Scholar] [CrossRef]
  37. Burman, U.; Garg, B.K.; Kathju, S. Effect of phosphorus application on cluster bean under different intensities of water stress. J. Plant Nutr. 2009, 32, 668–680. [Google Scholar] [CrossRef]
  38. Kwapata, M.B.; Hall, A.E. Effects of moisture regime and phosphorus on mycorrhizal infection, nutrient uptake, and growth of cowpeas (Vigna unguiculata (L.) Walp.). Field Crop. Res. 1985, 12, 241–250. [Google Scholar] [CrossRef]
  39. Neenu, S.; Ramesh, K.; Ramana, S.; Biswas, A.K.; Rao, A.S. Growth and yield of different varieties of chickpea (Cicer arietinum L.) as influenced by the phosphorus nutrition under rainfed conditions on Vertisols. Int. J. Bio-Resour. Stress Manag. 2014, 5, 53–57. [Google Scholar] [CrossRef]
  40. Gutierrez-Boem, F.H.; Thomas, G.W. Phosphorus nutrition and water deficits in field-grown soybeans. Plant Soil 1999, 207, 87–96. [Google Scholar] [CrossRef]
  41. Jin, J.; Wang, G.; Liu, X.; Pan, X.; Herbert, S.J.; Tang, C. Interaction between phosphorus nutrition and drought on grain yield, and assimilation of phosphorus and nitrogen in two soybean cultivars differing in protein concentration in grains. J. Plant Nutr. 2006, 29, 1433–1449. [Google Scholar] [CrossRef]
  42. Gayacharan; Tripathi, K.; Meena, S.; Panwar, B.S.; Lal, H.; Rana, J.C.; Singh, K. Understanding genetic variability in the mungbean (Vigna radiata L.) gene pool. Ann. Appl. Biol. 2020. [Google Scholar] [CrossRef]
  43. Singh, D.; Dikshit, H.K.; Singh, R. A new phenotyping technique for screening for drought tolerance in lentil (Lens culinaris M edik.). Plant Breed. 2013, 132, 185–190. [Google Scholar] [CrossRef]
  44. Olsen, S.R.; Cole, C.V.; Watanabe, F.S.; Dean, L.A. Estimation of Available Phosphorus in Soils by Extraction with Sodium Bicarbonate; USDA Circular: Washington, DC, USA, 1954; p. 939.
  45. Yang, R.C.; Jana, S.; Clarke, J.M. Phenotypic diversity and associations of some potentially drought-responsive characters in durum wheat. Crop Sci. 1991, 31, 1484–1491. [Google Scholar] [CrossRef]
  46. Clarke, J.M.; McCAIG, T.N. Excised-leaf water retention capability as an indicator of drought resistance of Triticum genotypes. Can. J. Plant Sci. 1982, 62, 571–578. [Google Scholar] [CrossRef]
  47. Barrs, H.D.; Weatherley, P.E. A re-examination of the relative turgidity technique for estimating water deficits in leaves. Aust. J. Biol. Sci. 1962, 15, 413–428. [Google Scholar] [CrossRef] [Green Version]
  48. Sairam, R.K.; Deshmukh, P.S.; Shukla, D.S. Tolerance to drought and temperature stress in relation to increased antioxidant enzyme activity in wheat. J. Agron. Crop Sci. 1997, 178, 171–177. [Google Scholar] [CrossRef]
  49. Hiscox, J.D.; Israelstam, G.F. A method for the extraction of chlorophyll from leaf tissue without maceration. Can. J. Bot. 1979, 57, 1332–1334. [Google Scholar] [CrossRef]
  50. Krishnapriya, V.; Pandey, R. Root exudation index: Screening organic acid exudation and phosphorus acquisition efficiency in soybean genotypes. Crop Pasture Sci. 2016, 67, 1096–1109. [Google Scholar] [CrossRef]
  51. Liu, Y.; Zhang, X.; Tran, H.; Shan, L.; Kim, J.; Childs, K.; Ervin, E.H.; Frazier, T.; Zhao, B. Assessment of drought tolerance of 49 switchgrass (Panicum virgatum) genotypes using physiological and morphological parameters. Biotechnol. Biofuels 2015, 8, 152. [Google Scholar] [CrossRef] [Green Version]
  52. R Core Team. R: A Language and Environment for Statistical Computing; R Foundation for Statistical Computing: Vienna, Austria, 2019. [Google Scholar]
  53. Sebastien, L.; Julie, J.; Francois, H. FactoMineR: An R Package for multivariate analysis. J. Stat. Softw. 2008, 25, 1–18. [Google Scholar]
  54. Nazari, L.; Pakniyat, H. Assessment of drought tolerance in barley genotypes. J. Appl. Sci. 2010, 10, 151–156. [Google Scholar] [CrossRef]
  55. Dehbalaei, S.; Farshadfar, E.; Farshadfar, M. Assessment of drought tolerance in bread wheat genotypes based on resistance/tolerance indices. Int. J. Agric. Crop Sci. 2013, 5, 2352–2358. [Google Scholar]
  56. Alloush, G.A. Responses of hydroponically-grown chickpea to low phosphorus: pH changes, nutrient uptake rates, and root morphological changes. Agronomie 2003, 23, 123–133. [Google Scholar] [CrossRef]
  57. Gahoonia, T.S.; Ali, O.; Sarker, A.; Nielsen, N.E.; Rahman, M.M. Genetic variation in root traits and nutrient acquisition of lentil genotypes. J. Plant Nutr. 2006, 29, 643–655. [Google Scholar] [CrossRef]
  58. Pandey, R.; Meena, S.K.; Krishnapriya, V.; Ahmad, A.; Kishora, N. Root carboxylate exudation capacity under phosphorus stress does not improve grain yield in green gram. Plant Cell Rep. 2014, 33, 919–928. [Google Scholar] [CrossRef]
  59. Reddy, V.R.P.; Aski, M.S.; Mishra, G.P.; Dikshit, H.K.; Singh, A.; Pandey, R.; Singh, M.P.; Ramtekey, V.; Rai, N.; Nair, R.M.; et al. Genetic variation for root architectural traits in response to phosphorus deficiency in mungbean at the seedling stage. PLoS ONE 2020, 15, e0221008. [Google Scholar] [CrossRef]
  60. Pan, X.W.; Li, W.B.; Zhang, Q.Y.; Li, Y.H.; Liu, M.S. Assessment on phosphorus efficiency characteristics of soybean genotypes in phosphorus-deficient soils. Agric. Sci. China 2008, 7, 958–969. [Google Scholar] [CrossRef]
  61. Soumya, P.R.; Sharma, S.; Meena, M.K.; Pandey, R. Response of diverse bread wheat genotypes in terms of root architectural traits at seedling stage in response to low phosphorus stress. Plant Physiol. Rep. 2020. [Google Scholar] [CrossRef]
  62. Sidhu, S.K.; Kaur, J.; Singh, S.; Grewal, S.K.; Singh, M. Variation of morpho-physiological traits in geographically diverse pigeonpea [Cajanus cajan (L.) Millsp] germplasm under different phosphorus conditions. J. Plant Nutr. 2018, 41, 1321–1332. [Google Scholar] [CrossRef]
  63. Sarker, B.C.; Rashid, P.; Jarmoker, J.L. Anatomical changes of lentil (Lens culinaris medik.) under phosphorus deficiency stress. Bangladesh J. Bot. 2015, 44, 73–78. [Google Scholar] [CrossRef] [Green Version]
  64. Ho, M.D.; Rosas, J.C.; Brown, K.M.; Lynch, J.P. Root architectural tradeoffs for water and phosphorus acquisition. Funct. Plant Biol. 2005, 32, 737–748. [Google Scholar] [CrossRef] [Green Version]
  65. He, J.; Jin, Y.; Du, Y.L.; Wang, T.; Turner, N.C.; Yang, R.P.; Siddique, K.H.; Li, F.M. Genotypic variation in yield, yield components, root morphology and architecture, in soybean in relation to water and phosphorus supply. Front. Plant Sci. 2017, 8, 1499. [Google Scholar] [CrossRef] [Green Version]
  66. He, J.; Jin, Y.; Turner, N.C.; Chen, Z.; Liu, H.Y.; Wang, X.L.; Siddique, K.H.; Li, F.M. Phosphorus application increases root growth, improves daily water use during the reproductive stage, and increases grain yield in soybean subjected to water shortage. Environ. Exp. Bot. 2019, 166, 103816. [Google Scholar] [CrossRef]
  67. Lambers, H.; Hayes, P.E.; Laliberte, E.; Oliveira, R.S.; Turner, B.L. Leaf manganese accumulation and phosphorus-acquisition efficiency. Trends Plant Sci. 2015, 20, 83–90. [Google Scholar] [CrossRef] [Green Version]
  68. Gahoonia, T.S.; Ali, R.; Malhotra, R.S.; Jahoor, A.; Rahman, M.M. Variation in root morphological and physiological traits and nutrient uptake of chickpea genotypes. J. Plant Nutr. 2007, 30, 829–841. [Google Scholar] [CrossRef]
  69. Pandey, R.; Krishnapriya, V.; Kishora, N.; Singh, S.B.; Singh, B. Shoot labelling with 14CO2: A technique for assessing total root carbon exudation under phosphorus stress. Indian J. Plant Physiol. 2013, 18, 250–262. [Google Scholar] [CrossRef]
  70. Pang, J.; Zhao, H.; Bansal, R.; Bohuon, E.; Lambers, H.; Ryan, M.H.; Siddique, K.H. Leaf transpiration plays a role in phosphorus acquisition among a large set of chickpea genotypes. Plant Cell Environ. 2018, 41, 2069–2079. [Google Scholar] [CrossRef]
  71. Henry, A.; Doucette, W.; Norton, J.; Bugbee, B. Changes in crested wheatgrass root exudation caused by flood, drought, and nutrient stress. J. Environ. Qual. 2007, 36, 904–912. [Google Scholar] [CrossRef] [Green Version]
  72. Song, F.; Han, X.; Zhu, X.; Herbert, S.J. Response to water stress of soil enzymes and root exudates from drought and non-drought tolerant corn hybrids at different growth stages. Can. J. Soil Sci. 2012, 92, 501–507. [Google Scholar] [CrossRef]
  73. Sinclair, T.R.; Ludlow, M.M. Who taught plants thermodynamics? The unfulfilled potential of plant water potential. Funct. Plant Biol. 1985, 12, 213–217. [Google Scholar] [CrossRef]
  74. Sawwan, J.; Shibli, R.A.; Swaidat, I.; Tahat, M. Phosphorus regulates osmotic potential and growth of African violet under in vitro-induced water deficit. J. Plant Nutr. 2000, 23, 759–771. [Google Scholar] [CrossRef]
  75. Premachandra, G.S.; Saneoka, H.; Fujita, K.; Ogata, S. Cell membrane stability and leaf water relations as affected by phosphorus nutrition under water stress in maize. Soil Sci. Plant Nutr. 1990, 36, 661–666. [Google Scholar] [CrossRef]
  76. Hao, L.; Wang, Y.; Zhang, J.; Xie, Y.; Zhang, M.; Duan, L.; Li, Z. Coronatine enhances drought tolerance via improving antioxidative capacity to maintaining higher photosynthetic performance in soybean. Plant Sci. 2013, 210, 1–9. [Google Scholar] [CrossRef] [PubMed]
  77. Mafakheri, A.; Siosemardeh, A.F.; Bahramnejad, B.; Struik, P.C.; Sohrabi, Y. Effect of drought stress on yield, proline and chlorophyll contents in three chickpea cultivars. Aust. J. Crop Sci. 2010, 4, 580. [Google Scholar]
  78. Lima, J.D.; Mosquim, P.R.; Da Matta, F.M. Leaf gas exchange and chlorophyll fluorescence parameters in Phaseolus vulgaris as affected by nitrogen and phosphorus deficiency. Photosynthetica 1999, 37, 113–121. [Google Scholar] [CrossRef]
  79. Abid, G.; Hessini, K.; Aouida, M.; Aroua, I.; Baudoin, J.P.; Muhovski, Y.; Mergeai, G.; Sassi, K.; Machraoui, M.; Souissi, F.; et al. Agro-physiological and biochemical responses of Faba bean (Vicia faba L. var. ‘minor’) genotypes to water deficit stress. Biotechnol. Agron. Soc. Environ. 2017, 21, 1–14. [Google Scholar]
  80. Zlatev, Z.S.; Yordanov, I.T. Effects of soil drought on photosynthesis and chlorophyll fluorescence in bean plants. Bulg. J. Plant Physiol. 2004, 30, 3–18. [Google Scholar]
  81. Mathobo, R.; Marais, D.; Steyn, J.M. The effect of drought stress on yield, leaf gaseous exchange and chlorophyll fluorescence of dry beans (Phaseolus vulgaris L.). Agric. Water Manag. 2017, 180, 118–125. [Google Scholar] [CrossRef] [Green Version]
  82. Nazran, A.; Ahmed, J.U.; Karim, A.J.M.S.; Ghosh, T.K. Physiological responses of mungbean (Vigna radiata) varieties to drought stress. Bangladesh J. Agric. Res. 2019, 44, 1–11. [Google Scholar] [CrossRef]
  83. Daszkowska-Golec, A.; Szarejko, I. Open or close the gate–stomata action under the control of phytohormones in drought stress conditions. Front. Plant Sci. 2013, 4, 138. [Google Scholar] [CrossRef] [Green Version]
  84. Flexas, J.; Medrano, H. Drought-inhibition of photosynthesis in C3 plants: Stomatal and non-stomatal limitations revisited. Ann. Bot. 2002, 89, 183–189. [Google Scholar] [CrossRef] [Green Version]
  85. Carstensen, A.; Herdean, A.; Schmidt, S.B.; Sharma, A.; Spetea, C.; Pribil, M.; Husted, S. The impacts of phosphorus deficiency on the photosynthetic electron transport chain. Plant Physiol. 2018, 177, 271–284. [Google Scholar] [CrossRef] [Green Version]
  86. Pang, J.; Bansal, R.; Zhao, H.; Bohuon, E.; Lambers, H.; Ryan, M.H.; Siddique, K.H. The carboxylate-releasing phosphorus-mobilizing strategy can be proxied by foliar manganese concentration in a large set of chickpea germplasm under low phosphorus supply. New Phytol. 2018, 219, 518–529. [Google Scholar] [CrossRef] [PubMed] [Green Version]
  87. Jones, C.A.; Jacobsen, J.S.; Wraith1, J.M. Response of malt barley to phosphorus fertilization under drought conditions. J. Plant Nutr. 2005, 28, 1605–1617. [Google Scholar] [CrossRef]
  88. Masle, J.; Farquhar, G.D.; Wong, S.C. Transpiration ratio and plant mineral content are related among genotypes of a range of species. Funct. Plant Biol. 1992, 19, 709–721. [Google Scholar] [CrossRef]
  89. Mourice, S.K.; Tryphone, G.M. Evaluation of common bean (Phaseolus vulgaris L.) genotypes for adaptation to low phosphorus. Isrn Agron. 2012, 2012. [Google Scholar] [CrossRef] [Green Version]
  90. Zhou, T.; Du, Y.; Ahmed, S.; Liu, T.; Ren, M.; Liu, W.; Yang, W. Genotypic differences in phosphorus efficiency and the performance of physiological characteristics in response to low phosphorus stress of soybean in southwest of China. Front. Plant Sci. 2016, 7, 1776. [Google Scholar] [CrossRef] [Green Version]
  91. Santos, M.G.D.; Ribeiro, R.V.; Oliveira, R.F.D.; Pimentel, C. Gas exchange and yield response to foliar phosphorus application in Phaseolus vulgaris L. under drought. Braz. J. Plant Physiol. 2004, 16, 171–179. [Google Scholar] [CrossRef]
  92. Raza, S.; Farrukh Saleem, M.; Mustafa Shah, G.; Jamil, M.; Haider Khan, I. Potassium applied under drought improves physiological and nutrient uptake performances of wheat (Triticum aestivun L.). J. Soil Sci. Plant Nutr. 2013, 13, 175–185. [Google Scholar]
  93. Baroowa, B.; Gogoi, N. Biochemical changes in two Vigna spp. during drought and subsequent recovery. Indian J. Plant Physiol. 2013, 18, 319–325. [Google Scholar] [CrossRef]
  94. Baroowa, B.; Gogoi, N. Biochemical changes in black gram and green gram genotypes after imposition of drought stress. J. Food Legumes 2014, 27, 350–353. [Google Scholar]
  95. Malik, M.A.; Hussain, S.; Warraich, E.A.; Habib, A.; Ullah, S. Effect of seed inoculation and phosphorus application on growth, seed yield and quality of mungbean (Vigna radiata L.) cv. NM-98. Int. J. Agric. Biol. 2002, 4, 515–516. [Google Scholar]
  96. Singh, D.K.; Sale, P.W.; McKenzie, B.M. Water relations of white clover (Trifolium repens L.) in a drying soil, as a function of phosphorus supply and defoliation frequency. Aust. J. Agric. Res. 1997, 48, 675–682. [Google Scholar] [CrossRef]
  97. Malik, A.M.J.A.D.; Waheed, A.; Qadir, G.; Asghar, R. Interactive effects of irrigation and phosphorus on green gram (Vigna radiata L.). Pak. J. Bot. 2006, 38, 1119. [Google Scholar]
  98. Uarrota, V.G. Response of cowpea (Vigna unguiculata L. Walp.) to water stress and phosphorus fertilization. J. Agron. 2010, 9, 87–91. [Google Scholar] [CrossRef]
  99. Rose, T.J.; Pariasca-Tanaka, J.; Rose, M.T.; Fukuta, Y.; Wissuwa, M. Genotypic variation in grain phosphorus concentration, and opportunities to improve P-use efficiency in rice. Field Crop. Res. 2010, 119, 154–160. [Google Scholar] [CrossRef]
  100. Rose, T.J.; Wissuwa, M. Rethinking internal phosphorus utilization efficiency: A new approach is needed to improve PUE in grain crops. Adv. Agron. 2012, 116, 185–217. [Google Scholar]
Figure 1. Biplot using relative values of 16 physiological traits of mungbean accessions grown hydroponically under (a) low phosphorus, (b) drought, and (c) combined stress. Arrow represents agro-physiological traits, its length corresponds to the contribution of each trait. Number represents 100 mung bean accessions corresponding to Supplementary Table S1. Abbreviation: ELWL_30 and ELWL_90, excised leaf water loss per unit initial water content after 30 min and 90 min; RWL, rate of water loss; MRC, moisture retention capacity; PPC, plant P concentration; PPU, plant P uptake; Chl, chlorophyll concentration; DSW, dry shoot weight; DRW, dry root weight; TDW, total dry weight; RSR, root-to-shoot ratio; TRL, total root length; RSA, root surface area; AD, average root diameter; RV, root volume; NRT, number of root tips.
Agronomy 11 00099 g001
Figure 2. Effect of low P, drought, and combined stress on (a) total above ground dry matter, (b) relative water content, and (c) membrane stability index in 10 mung bean accessions. Values on bars 1–5 and 6–10 represents mean of tolerant and sensitive accessions, respectively. The letters on each bar denotes significant difference between accessions in each treatment. Error bars indicate mean ± SEm.
Agronomy 11 00099 g002
Figure 3. Effect of low P, drought, and combined stress on (a) shoot P concentration, (b) seed P concentration, (c) shoot P uptake, and (d) seed P uptake in 10 mung bean accessions. Values on bars 1–5 and 6–10 represents mean of tolerant and sensitive accessions, respectively. The letters on each bar denotes significant difference between accessions in each treatment. Error bars indicate mean ± SEm.
Agronomy 11 00099 g003
Figure 4. Effect of low P, drought, and combined stress on (a) P harvest index (%), (b) PUEg (g seed mg−1 P), (c) PUEbm (g dry matter mg−1 P) in 10 mung bean accessions. Values on bars 1–5 and 6–10 represents mean of tolerant and sensitive accessions, respectively. The letters on each bar denotes significant difference between accessions in each treatment. Error bars indicate mean ± SEm.
Agronomy 11 00099 g004
Figure 5. Effect of low P, drought, and combined stress on (a) rate of photosynthesis, (b) transpiration, (c) stomatal conductance, and (d) instantaneous water use efficiency in 10 mung bean accessions. Values on bars 1–5 and 6–10 represents mean of tolerant and sensitive accessions, respectively. The letters on each bar denotes significant difference between accessions in each treatment. Error bars indicate mean ± SEm.
Agronomy 11 00099 g005
Figure 6. Effect of low P, drought, and combined stress on yield traits in 10 mung bean accessions. Values on bars 1–5 and 6–10 represents mean of tolerant and sensitive accessions, respectively.
Agronomy 11 00099 g006
Table 1. Selection of tolerant and sensitive mungbean accessions (25 each) based on their response to different stresses viz., low P, drought, and combined (low P and drought). These accessions were identified on the basis of principal component analysis ranking using loading score from relative values under treated conditions. The ranking values are presented in Table S3.
Low PDroughtCombined
TolerantSensitiveTolerantSensitiveTolerantSensitive
IC314606EC398916EC398916EC398907IC280489EC398907
EC396156EC398414IC314606IC565301IC76468EC396156
IC257571IC252008IC507276IC73112IC489015IC489004
IC401586IC305250IC507418IC76370IC76414IC148401
IC305222IC507526IC257571IC357035IC507321IC565301
IC565301IC76422IC401586IC305250EC397142IC73112
IC148442IC488849IC305222IC507526EC397141EC398131
IC280489IC488808IC148442IC488582IC76466IC488904
EC398131IC118993IC280489IC76346IC76499IC507504
IC76468IC119005IC507527IC398746IC76415IC76451
IC507527IC405261IC76414IC488808IC333090IC488582
EC397142IC73401IC507321IC118993IC507340IC76346
EC397141EC396413EC397142EC398880IC76422IC489093
IC285532IC488875EC397141IC119005IC488808IC121249
IC488813IC488526IC507320IC754464EC398937EC398880
IC507504IC119018IC76415IC73401EC398886IC119005
IC76415IC325853IC507483EC314285IC405261IC73401
IC333090IC76581IC333090IC488526IC305249EC314285
IC507340IC507296IC507340IC119018IC121316IC488526
IC507376IC590082IC76422IC325853EC396413IC325853
IC398746IC623704IC488966IC553566IC315045IC507296
IC282110IC623821EC398949IC507296IC623821IC590082
IC488966IC584699IC314512IC590082IC573083IC623704
EC398949IC415097IC121316IC623821IC623705IC415097
IC305249HUM-1IC507319IC393792IC512343IC393792
Bold text represents the tolerant accessions which were common under all three treatments while bold italics text represents the sensitive accession which were common under all three treatments.
Table 2. Stress susceptibility indices (SSI) of 10 selected mungbean accessions based on the above ground dry matter (AGDM) and seed yield. Rank 1 is the best performer, while rank 10 is worst performer.
Low PDroughtCombinedMean
AGDMSeed YieldAGDMSeed YieldAGDMSeed Yield
IC3330901111121.2
IC5073406222212.5
IC734013434744.2
IC1213165345675.0
IC764152777455.3
IC2804894886535.7
EC3971427593866.3
IC119005101068387.5
IC3258538659997.7
IC48852699101010109.7
Table 3. Effect of P nutrition and drought on exudation of organic acids (oxalate, citrate, maleate, and α-Ketoglutarate) from roots of selected mungbean accessions grown at two P levels (sufficient, 25.6 mg P kg−1 dry soil, and low P, 7.8 mg P kg−1 dry soil) and two moisture regimes (irrigated and drought). ‘nd’—not detectable; Con—Control; LP—Low phosphorus; Dt—Drought; CS—combined stress.
Accession Oxalate (µM g−1 Root FW)Citrate (µM g−1 Root FW)Maleate (µM g−1 Root FW)α-Ketoglutarate (µM g−1 FW)
ConLPDtCSConLPDtCSConLPDtCSConLPDtCS
IC333090nd6.11ndndnd17.5nd1.69nd13.85.025.31.94117.22.0936.2
IC507340nd2.71nd4.64nd0.92nd2.770.27171.127.42.882.0773.85.759.89
IC73401ndndndndnd0.9148.04.010.40137nd8.1914.054.25.133.75
IC121316nd11.1ndndnd25.0nd0.42nd58.214.01.85nd36.914.92.56
IC76415nd6.43nd9.85nd14.247.50.54nd20.42450.378.6533.40.130.65
Mean (Tolerant)--6.59--7.25--11.747.81.890.3480.172.97.726.6763.15.610.6
IC280489ndndndndnd7.68nd1.074.1440.33.504.348.9116.312.82.47
EC397142nd16.5nd20.2nd1.3354.12.560.0215.131.43.758.8312.422.9nd
IC119005nd8.57ndndnd5.60nd0.22nd18.28.430.2628.226.315.70.64
IC325853nd4.29ndndnd7.85nd7.897.938.125.5623.96.6017.46.960.22
IC488526nd5.42ndndnd2.2434.40.74nd1.817.566.6717.337.56.455.31
Mean (Sensitive)--8.70--20.2--4.9444.32.504.0316.711.37.7814.022.013.02.16
Table 4. Effect of P nutrition and drought on exudation of organic acid (pyruvate, malonate, malate, and succinate) from roots of selected mungbean accessions grown at two P levels (sufficient, 25.6 mg P kg−1 dry soil, and low P, 7.8 mg P kg−1 dry soil) and two moisture regimes (irrigated and drought). Con—Control; LP—Low phosphorus; Dt—Drought; CS—combined stress.
Accession Pyruvate (µM g−1 Root FW)Malonate (µM g−1 Root FW)Malate (µM g−1 Root FW)Succinate (µM g−1 Root FW)
ConLPDtCSConLPDtCSConLPDtCSConLPDtCS
IC333090199.621.46.1160.83.9810.70.466.491.7122.52.943.224.5514.90.3312.2
IC50734025.93.57.242.492.705.761.563.541.5228.50.523.580.1913.90.268.59
IC7340110.326.38.5360.83.0316.02.440.294.131.038.607.881.1321.09.8912.3
IC1213167.273.0817.353.30.185.120.9011.90.700.607.335.150.6819.519.24.95
IC764152123.1640.230.27.268.4714.54.236.0123.73.624.602.0745.31.4217.3
Mean (Tolerant)91.011.515.941.53.439.213.985.292.8115.34.604.891.7222.96.2211.1
IC280489125.72.408.921.3311.92.360.895.292.0317.22.514.751.828.400.011.61
EC397142230.641.58.4746.96.3321.76.192.851.491.110.514.200.177.160.4216.3
IC119005152.059.521.13.805.184.283.761.733.1551.04.322.760.547.710.522.41
IC325853212.169.655.873.516.512.54.2324.92.690.731.9511.11.3926.92.7522.4
IC4885264.1327.94.0046.71.4411.41.6515.05.660.111.069.095.0935.37.6218.7
Mean (Sensitive)144.940.219.734.58.310.43.3410.03.0014.02.076.381.8017.12.2612.3
Table 5. Effect of P nutrition and drought on exudation of organic acids (lactate, acetate, fumarate, and total organic acid) from roots of selected mungbean accessions grown at two P levels (sufficient, 25.6 mg P kg−1 dry soil, and low P, 7.8 mg P kg−1 dry soil) and two moisture regimes (irrigated and drought). ‘nd’—not detectable; Con—Control; LP—Low phosphorus; Dt—Drought; CS—combined stress.
Accession Lactate (µM g−1 Root FW)Acetate (µM g−1 Root FW)Fumarate (µM g−1 Root FW)Total Organic Acid (µM g−1 Root FW)
ConLPDtCSConLPDtCSConLPDtCSConLPDtCS
IC3330901.184.9423.02.3014.581.57.0417.40.4022.575.235.4227.9333.0122.2201.1
IC5073403.71197.318.53.936.8825.3228.58.512.7366.87.811.4346.0589.5297.452.2
IC734013.39252.281.70.533.0050.9110.24.663.7478.378.60.5543.1637.8353.0102.9
IC12131617.379.50.3234.51.365.4162.313.61.6475.558.72.7529.1319.9195.0130.9
IC764151.4666.035.61.4420.12.8090.611.52.9543.354.93.18260.5267.2533.783.9
Mean (Tolerant)5.4112031.88.549.1633.299.711.12.2957.355.08.66121.3429.5300.3114.2
IC2804890.476.1223.722.094.250.553.29.090.2119.430.21.93249.3170.7135.853.9
EC3971424.41116.423.50.525.4363.032.30.751.6241.40.092.41258.9337.6179.9100.5
IC1190053.0413.254.115.21.3522.6162.14.5619.216.534.01.60212.5233.4304.033.1
IC3258537.2637.131.812.712.392.8111.03.914.2935.370.42.10271.2312.6290.5182.6
IC4885261.650.7160.64.219.777.61165.024.61.9439.861.62.2047.0169.7349.9133.3
Mean (Sensitive)3.3734.738.710.924.647.3104.78.585.4430.539.32.05207.8244.8252.0100.7
Publisher’s Note: MDPI stays neutral with regard to jurisdictional claims in published maps and institutional affiliations.

