Article

Mapping Quantitative Trait Loci for Yield Potential Traits in Wheat Recombinant Inbred Lines

1
National Institute of Crop Science, Rural Development Administration, Wanju 55365, Korea
2
Department of Crop Science and Biotechnology, Jeonbuk National University, Jeonju 54896, Korea
3
Department of Agronomy and Medicinal Plant Resources, Gyeongnam National University of Science and Technology, Jinju 52725, Korea
*
Author to whom correspondence should be addressed.
These authors contributed equally to this work.
Agronomy 2021, 11(1), 22; https://doi.org/10.3390/agronomy11010022
Submission received: 28 November 2020 / Revised: 17 December 2020 / Accepted: 20 December 2020 / Published: 24 December 2020
(This article belongs to the Section Crop Breeding and Genetics)

Abstract

:
Selecting wheat with favorable spike characteristics has been a popular breeding strategy to improve sink capacity and yield potential. In the present study, quantitative trait loci (QTLs) for yield potential traits were identified using a recombinant inbred line (RIL) population derived from the cross between Taejoong and Keumkang, two Korean wheat cultivars. A linkage map encompassing a total genetic length of 6544.8 cM was constructed using 838 single nucleotide polymorphisms from the 35K Axiom Wheat Breeder’s Array. We detected eight QTLs for four yield potential traits that are consistently identified in at least two of the three environments, that is, one for days to heading date (QDHD-1 on chromosome 7B), three for spike length (QSL-1, QSL-2, and QSL-3 on chromosomes 1D, 5A, and 6A, respectively), one for tiller number (QTN-1 on chromosome 5B), and three for length of center rachis (QLCR-1, QLCR-2, and QLCR-3 on chromosomes 1B, 5B, and 6A, respectively). Notably, Taejoong contributed the alleles for long spike at all three spike length QTLs with the additive effects of 0.6 cm, 0.6 cm, and 0.9 cm at QSL-1, QSL-2, and QSL-3, respectively. No significant two-way or three-way interaction was observed among QSL-1, QSL-2, and QSL-3, indicating that pyramiding the Taejoong alleles at the three QTLs can increase spike length additively. While the Taejoong alleles at QSL-1, QSL-2, and QSL-3 were associated with increased days to heading date, more kernels per spike, and reduced tiller number per plant, the extent of the pleiotropic effects were different among the three QTLs. Due to the limited number of molecular markers and mapping resolution, further work is required to narrow down the identified QTLs and characterize their effects more precisely. Our results would provide useful information for modulating spike characteristics and improving yield potential in wheat breeding programs.
Keywords:
wheat; spike; yield; QTL; SNP

1. Introduction

Improving grain yield is an important goal in wheat breeding to secure stable food production under changing climate and increasing world population [1,2]. Wheat grain yield is a complex trait involving a number of genes and their interactions which are largely influenced by various environmental factors including temperature, photoperiod, rainfall, and fertilization [3,4]. Therefore, studies on wheat yield generally focus on specific yield component traits such as spikes (or tillers) per unit area, kernels per spike, and kernel weight that are more stably inherited than the final grain yield [5,6]. While studies genetically dissecting a specific yield component trait can provide useful molecular tools for breeding programs, optimizing the balance between different yield components is also critical as the yield component traits are interrelated and an increase in one component is frequently associated with a decrease in another, i.e., the yield improvement effect of an increase in kernels per spike can be canceled out by a decrease in kernel weight [7,8,9,10,11].
In many wheat breeding programs, kernels per spike has been a major target for improving yield as it often shows stronger positive correlation with the final grain yield compared with other yield components [12]. For example, the yield increasing trend of the major Argentinian wheat cultivars released between 1920 and 1990 was associated better with the increases in kernels per spike compared with those in spikes per unit area or grain weight [13]. Similarly, over 400 European winter wheat cultivars released since the 1950s showed continuous increases in kernels per spike over time [14]. At the International Maize and Wheat Improvement Center (CIMMYT), large spike wheat cultivars were developed by wide crossing between common wheat and accessions of Agropyron elongatum or Triticum polonicum to improve yield potential through increasing kernels per spike [15]. While these lines showed significant increases in both kernels per spike and kernel weight, the final grain yield fell short of expectations mainly due to the decrease in spikes per unit area [16,17].
In South Korea, a large spike wheat cultivar Taejoong was developed from the cross between the Chinese wheat Xian83 and the Korean cultivar Keumkang at the National Institute of Crop Science (NICS) [18,19]. In the regional yield trials conducted for three years (2014–2016) at the NICS, spike length and kernels per spike of Taejoong were 13.4 cm and 48, respectively, which were 76% longer and 66% more than those of Keumkang, respectively [19]. Taejoong also exhibited a ten-thousand kernel weight of 48.3 g, which was 5% heavier than Keumkang. Although Taejoong exhibited limited tillering capacity, i.e., 417 spikes per square-meter, which was 42% less than Keumkang, its final grain yield was moderately higher (13–21% higher depending on the cropping patterns) than Keumkang, mainly due to the superior spike characteristics in terms of kernel number and size [19]. As the genetic factors underlying the large spike characteristics of Taejoong remain unclear, we aimed to identify quantitative trait loci (QTLs) for yield potential characteristics of Taejoong using a recombinant inbred line (RIL) population derived from the cross between Taejoong and Keumkang and generate useful information for improving yield potential in wheat breeding programs.

2. Materials and Methods

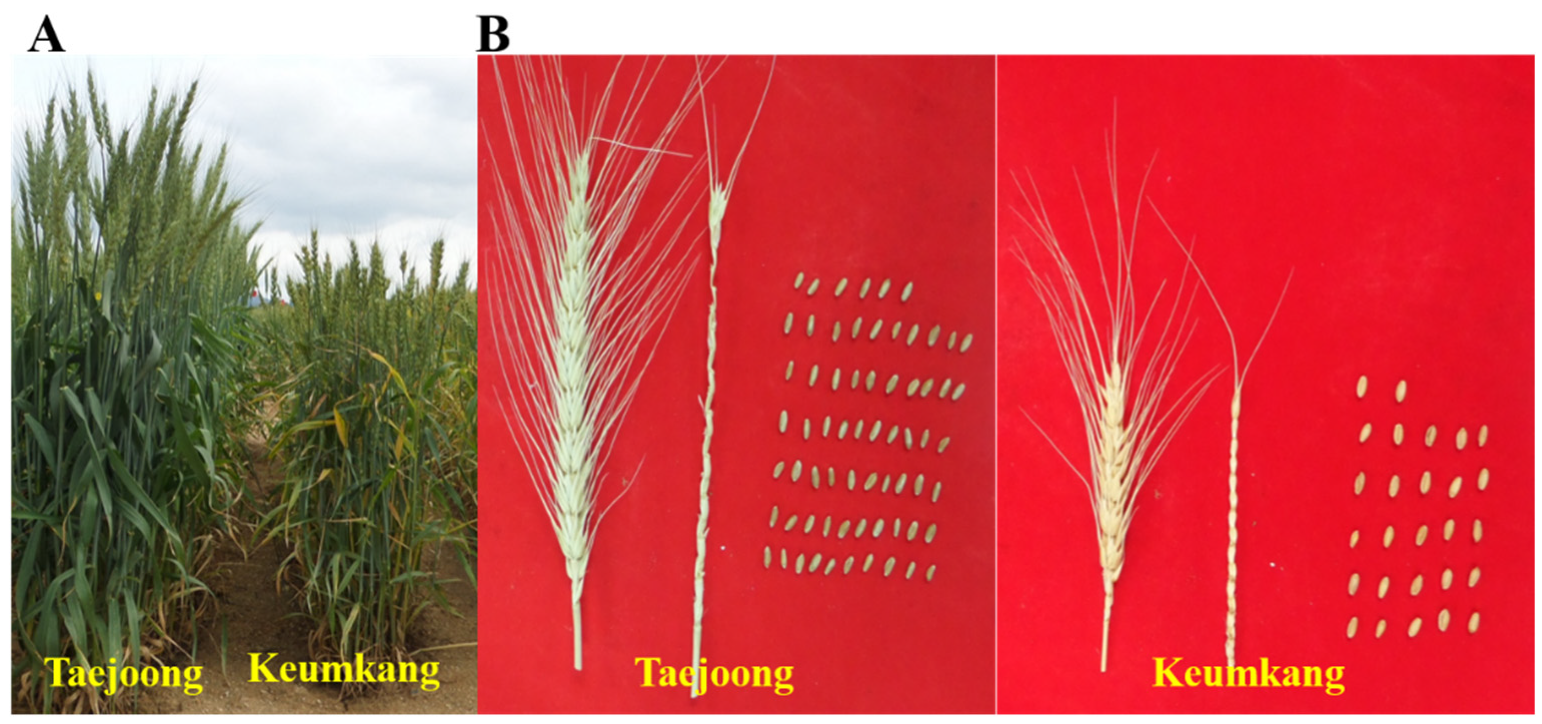
2.1. Plant Materials

A total of 94 F10 RILs were produced from the cross between two Korean wheat cultivars, Taejoong and Keumkang. The main phenotypic feature of Taejoong is a large spike (Figure 1) [19,20]. The RIL population was cultivated in upland conditions at Jeonbuk National University (35°85′ N 127°13′ E) in Jeonju, South Korea, during three growth seasons (2017, 2018, and 2019). The seeds were sown in late October each year, and each plot consisted of three 2-m rows spaced 25 cm apart. Application of fertilizers was conducted as 50–70–50 kg/ha of N–P2O5–K2O, and weeds, disease, and insect pests were stringently controlled according to the standard wheat cultivation manual of the Rural Development Administration (RDA), South Korea [RDA. 2012, standard of research and analysis for agricultural technology].

2.2. Measurement of Yield Potential Traits

Major agronomic traits affecting yield potential were recorded as follows: days to heading date (DHD) as the number of days from sowing to spike exsertion from the stem in 50% of a plot, culm length (CL) as the length from ground level to the base of the spike, spike length (SL) as the length of the spike excluding awn, number of tillers (TN) counted as the number of stems per plant, kernels per spike (KS) counted as the number of grains per spike, length of center rachis (LCR) as measured excluding flowerets, and the value of compactness (COM) as calculated according to the number of kernels per spike divided by spike length. CL, SL, and TN were measured from 20 plants randomly selected in each plot at maturity. KS, LCR and COM were determined from the main spikes of the same 20 plants.

2.3. Genotypic Analysis

Genomic DNA (gDNA) from the young leaves of the F10 RIL population was extracted using a DNA extraction kit (Solgent, Daejeon, Korea) according to the manufacturer’s instructions. Concentration of each gDNA was adjusted to 20 ng/μL with distilled water. The final concentration of gDNA was measured by Biodrop (Biodrop Ltd., Cambridge, UK). The 94 RILs were genotyped by DNA Link, Inc. (Seoul, Korea, http://www.dnalink.com) with AxiomTM 35K Wheat Breeder’s Genotyping Array (ThermoFisherScientific, Applied BiosystemsTM, Waltham, MA, USA) in a 384-array plate format. Genotype calling was conducted by Affymetrix Power Tools (APT, release 2.11.1).

2.4. QTL Mapping and Statistical Analysis

A linkage map was constructed using the IciMapping program version 4.2 [21]. To select polymorphic single nucleotide polymorphisms (SNPs), the genotyping result of the 35,042 SNPs was converted by the “SNP” function of the program. Out of 35,042 SNPs, 2061 were polymorphic between Taejoong and Keumkang, the parental lines of the RIL population. Using the “BIN” function in IciMapping, SNPs with more than 10% missing data and/or significant segregation distortion (Chi squared test p-value < 0.001) were deleted. Finally, 838 SNPs were used to construct a linkage map by the “MAP” function. QTL mapping for yield potential traits (DHD, CL, SL, COM, KS, TN, and LCR) was performed by composite interval mapping. Significant QTLs were initially identified based on the threshold logarithm of odds (LOD) score of 3.0 in each year, and those consistently identified in at least two of the three years were declared as stable QTLs. Statistical analyses including ANOVA and correlation analysis were conducted using R (The R Project for Statistical Computing version 3.4.4, https://www.r-project.org).

3. Results

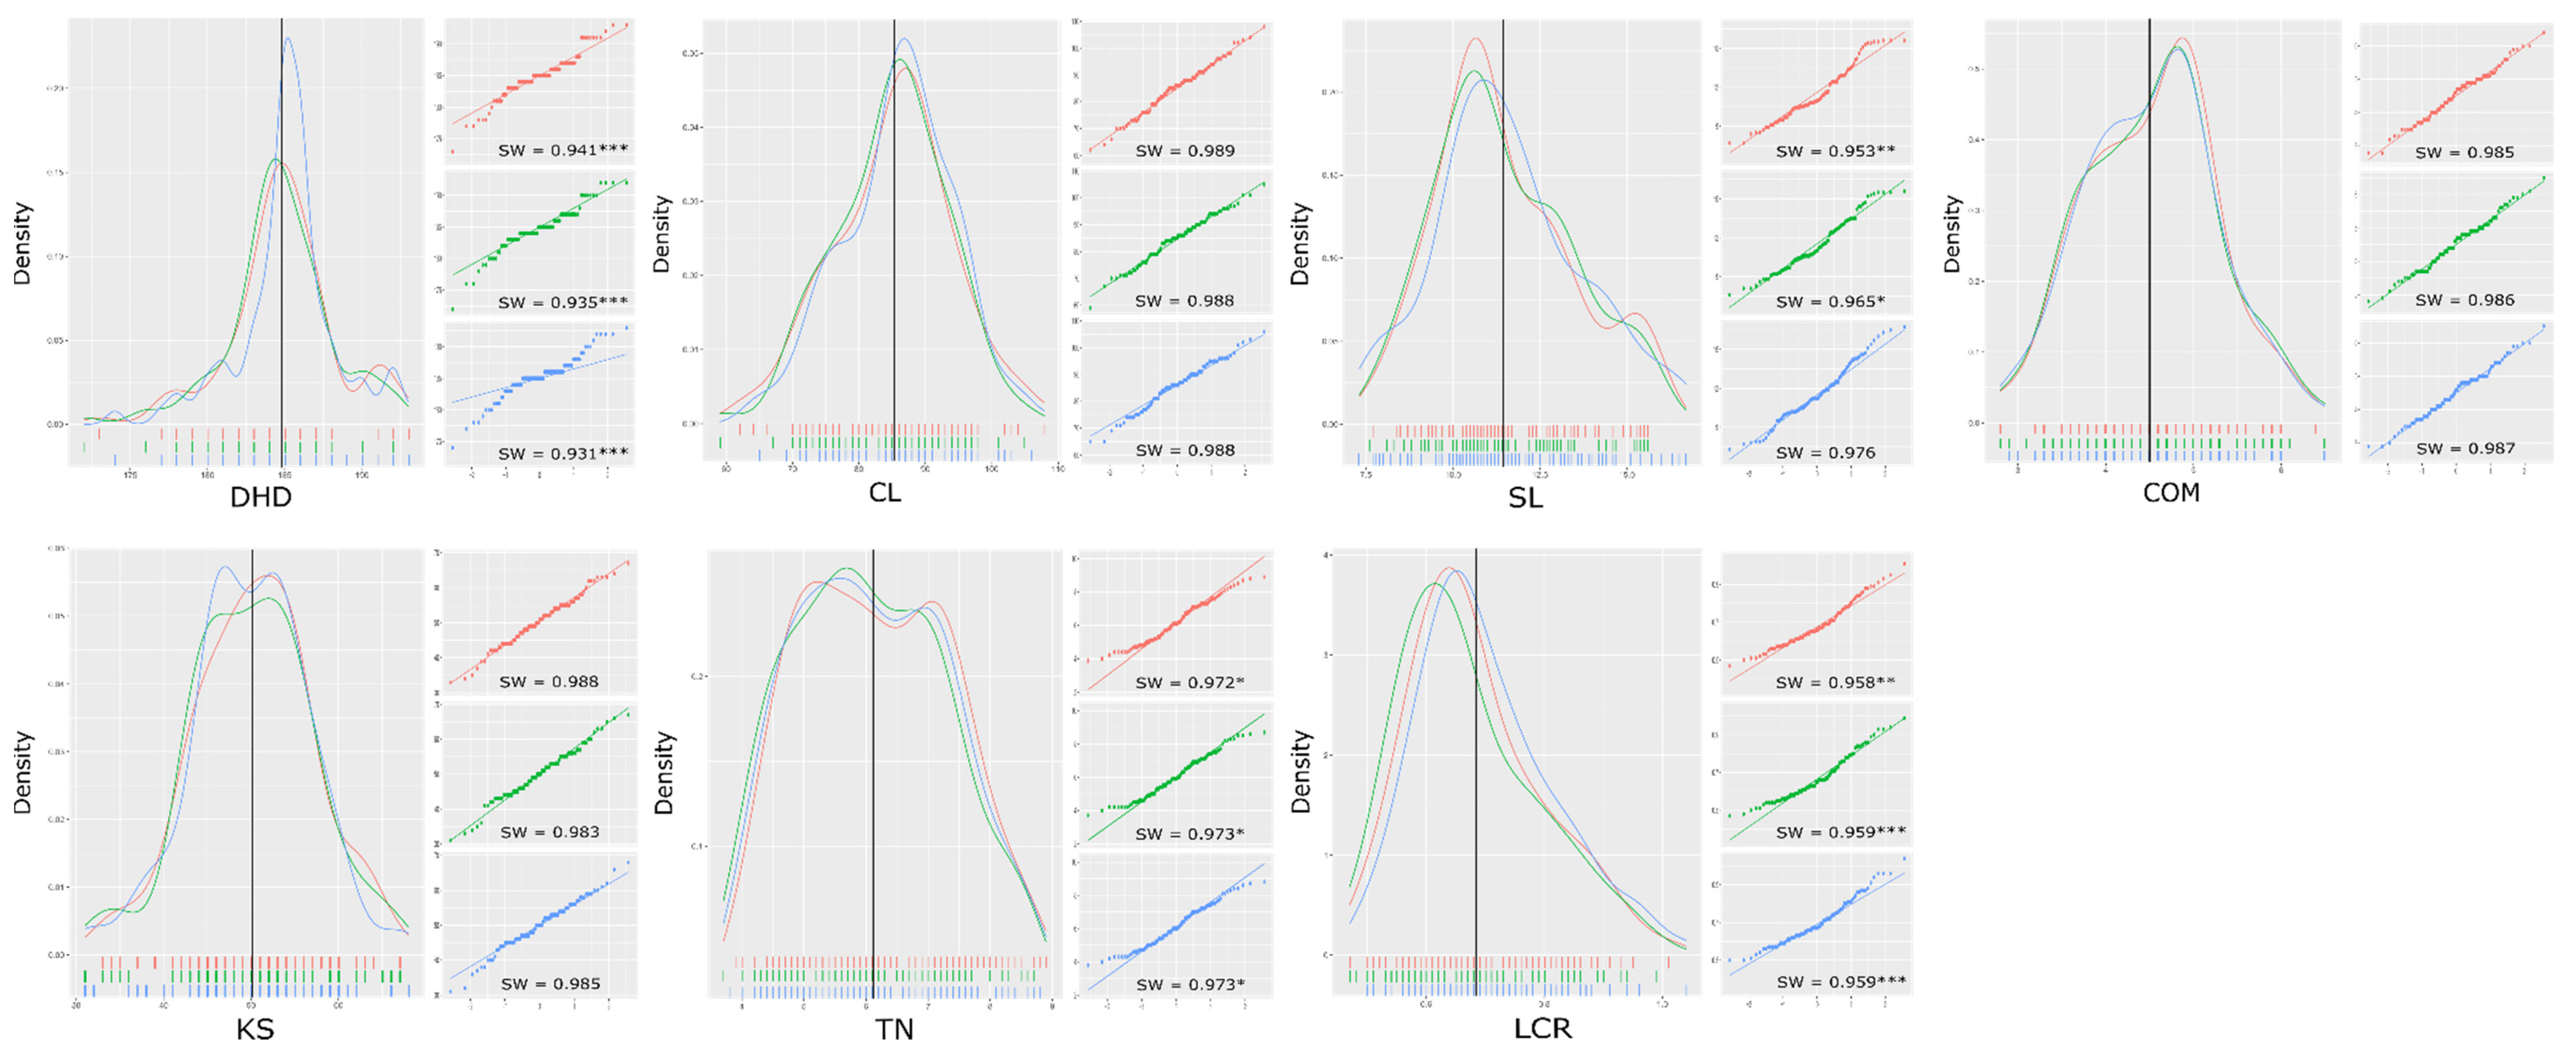
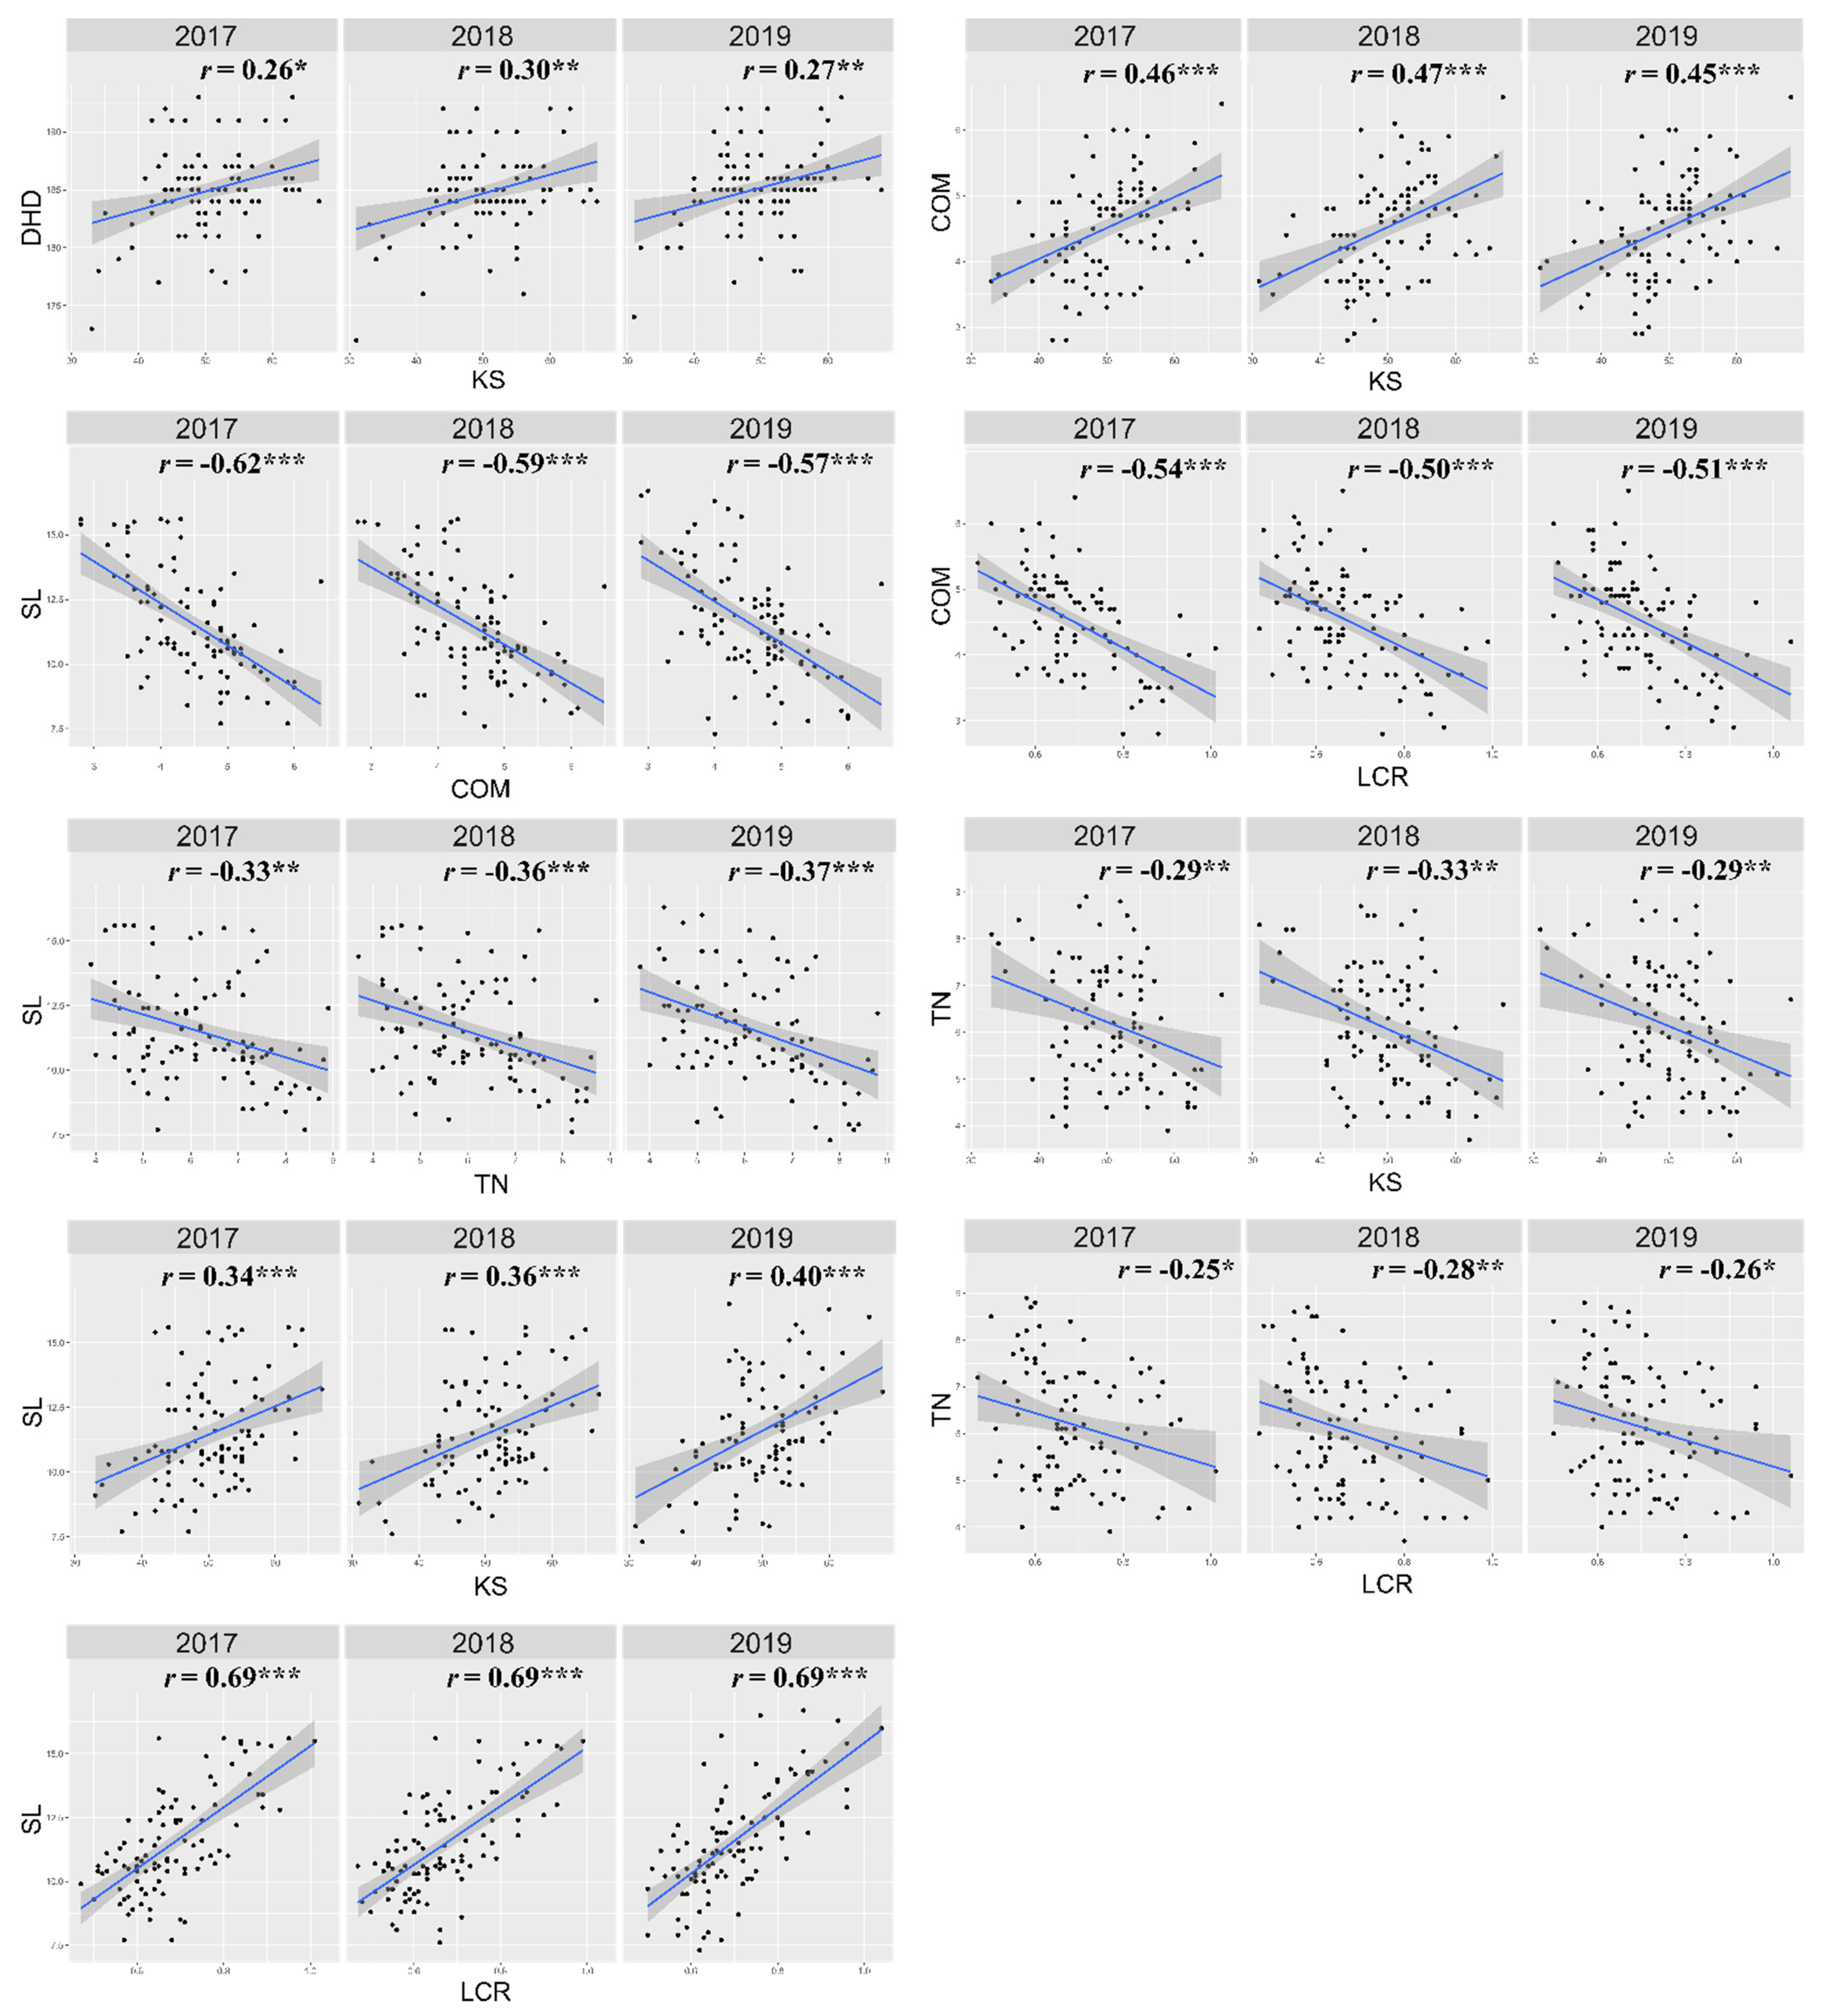
3.1. Phenotype Evaluation of the RIL Population

Descriptive statistics of the yield potential traits of the Taejoong × Keumkang RILs are summarized in Figure 2 and Table S1. The average DHD (184.9 days) of the RILs was shorter than Taejoong (192.7 days) and longer than Keumkang (180.3 days), and its distribution was skewed toward late DHD. The distribution of CL was normal and the average (85.3 cm) was taller than Keumkang (66.1 cm) and similar to Taejoong (84.6 cm). The average SL (11.5 cm) was shorter than Taejoong (14.5 cm) and longer than Keumkang (8.4 cm), and its distribution was skewed toward short SL. The distribution of COM was normal and the average (4.5) was higher than both Keumkang (4.4) and Taejoong (4.2). The distribution of KS was normal and the average (50.1) was between Keumkang (36.7) and Taejoong (61.6). The average TN (6.1) was greater than Taejoong (5.1) and fewer than Keumkang (8.1), and its distribution was skewed toward a low value. The average LCR (0.68 cm) was shorter than Taejoong (0.75 cm) and similar to Keumkang (0.69 cm), and its distribution was skewed toward a low value.
Of 21 correlation pairs among the seven yield potential traits, nine were significant in all three years, 2017, 2018, and 2019 (Figure 3 and Figures S1–S3). Strong positive correlations were observed between SL and LCR (r = 0.69 in all three years). KS showed moderate to low levels of positive correlations with COM (r = 0.45–0.47), SL (0.34–0.40), and DHD (r = 0.26–0.30). Relatively strong negative correlations were observed between COM and SL (r = −0.62 to −0.57), and COM and LCR (r = −0.54 to −0.50). TN was negatively, but weakly correlated with SL (r = −0.37 to −0.33), KS (r = −0.33 to −0.29), and LCR (r = −0.28 to −0.25). CL was not correlated with any of the six other yield potential traits, except for a weak positive correlation with SL (r = 0.21) significant in only one of the three years (Figure S3).

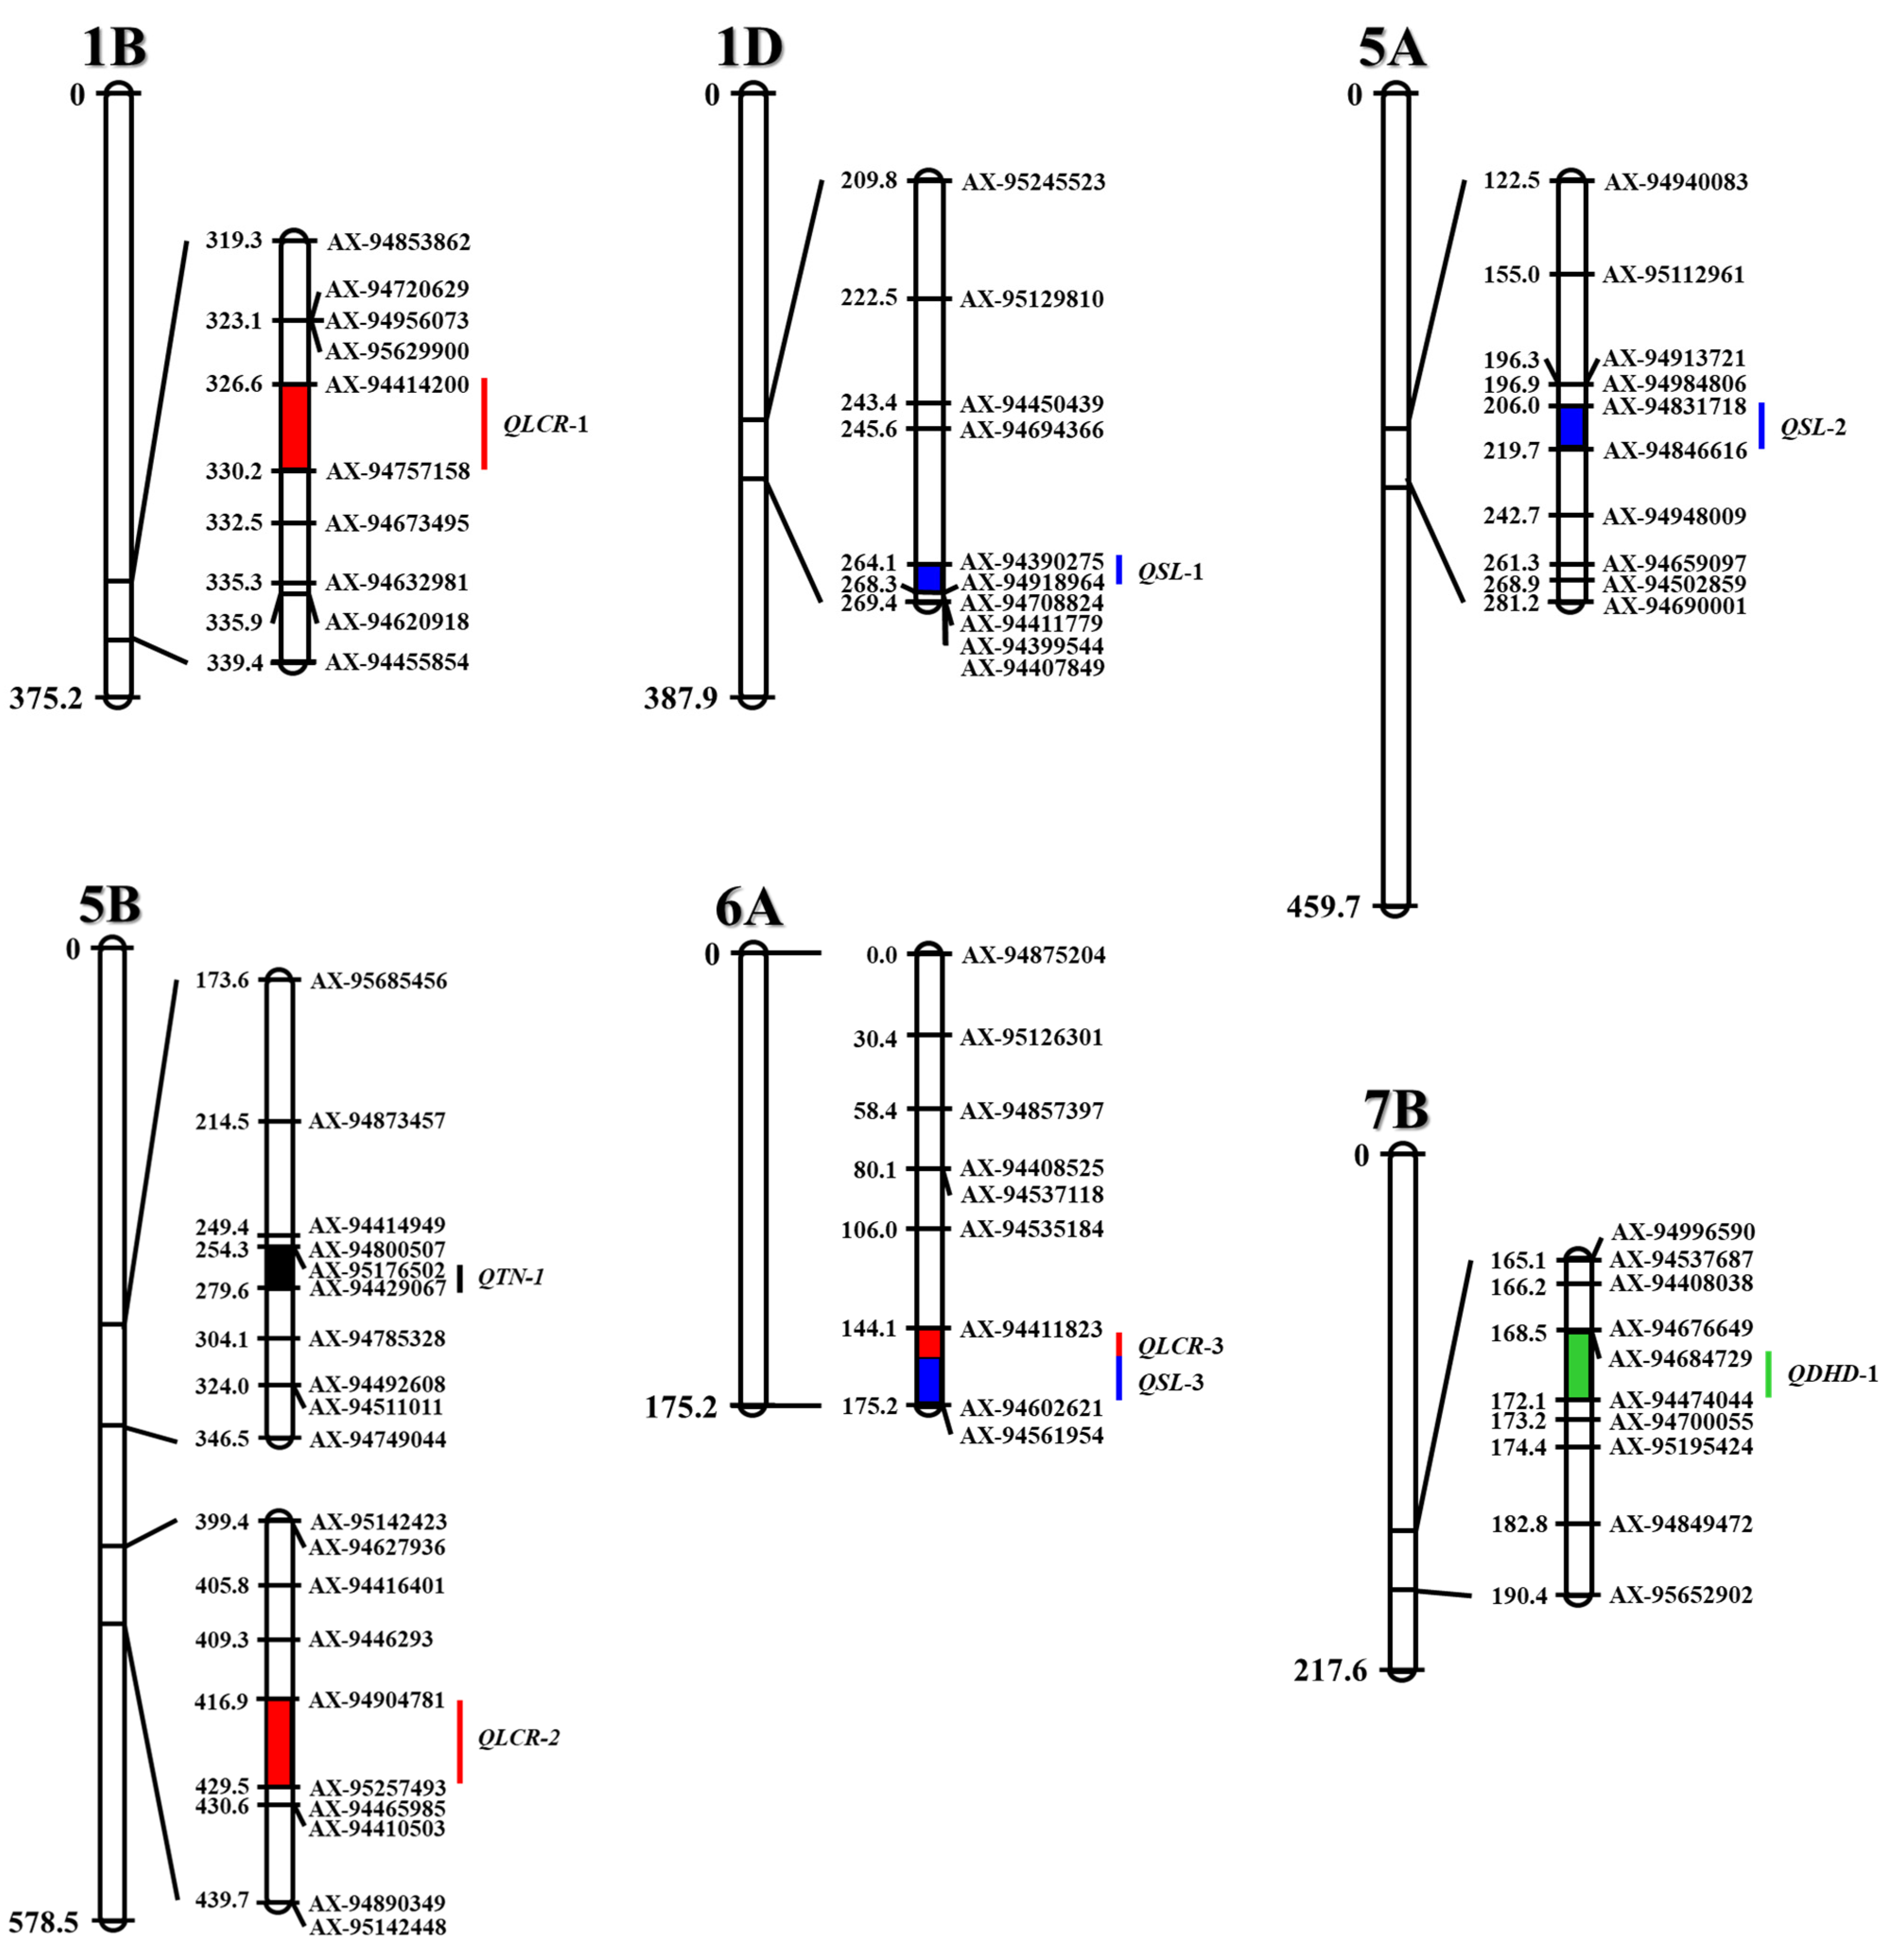
3.2. QTLs for Yield Potential Traits

A linkage map spanning a total genetic length of 6544.8 cM was constructed using 838 SNPs selected from the 2061 polymorphic SNPs after excluding those with >10% missing data and/or significant segregation distortion (Chi squared test P-value < 0.001, Table S2). The number of SNPs polymorphic between Taejoong and Keumkang was relatively small (5.9% of the 35K SNPs) mainly due to the fact that Taejoong had been derived from the cross between Xian83 and Keumkang and shared similar genetic background with Keumkang.
Of the 838 SNPs used for mapping, 233 (27.8%) were distributed on the A genome, 344 (41.1%) were on the B genome, and 261 (31.3%) were on the D genome. Among the 838 SNP markers, chromosome 1B had the greatest number of markers (86), whereas chromosome 6A had the smallest number of markers (9). Chromosome 5B showed the longest length (578.4 cM), whereas chromosome 4D showed the shortest length (113.1 cM). The average length between two adjacent markers were the longest on chromosome 6A (19.5 cM) and the shortest on chromosome 2B (4.1 cM).
We detected eight QTLs for four yield potential traits that are consistently identified in at least two of the three years (Table 1 and Figure 4). One QTL for DHD, QDHD-1 on chromosome 7B was defined by AX-94684729 and AX-94474044 (within a 5.0 cM confidence interval) with the LOD scores of 3.90–4.24 explaining 11.8–13.7% of the DHD variation. Taejoong contributed the allele for late heading with the additive effects of 1.30–1.37 days. Three QTLs were identified for SL. QSL-1 on chromosome 1D was defined by AX-94390275 and AX-94918964 (within a 5.0 cM confidence interval) with the LOD scores of 3.63–5.37 explaining 11.2–15.6% of the SL variation. QSL-2 on chromosome 5A was defined by AX-94831718 and AX-94846616 (within a 16.0 cM confidence interval) with the LOD scores of 3.55–3.82 explaining 12.2–15.1% of the SL variation. QSL-3 on chromosome 6A was defined by AX-94411823 and AX-94602621 (within a 13.5 cM confidence interval) with the LOD scores of 5.88–7.59 explaining 26.0–28.8% of the SL variation. Taejoong provided the alleles for long spike at all three QTLs with the additive effects of 0.59–0.72 at QSL-1, 0.61–0.62 at QSL-2, and 0.84–0.95 at QSL-3. One QTL for TN, QTN-1 on chromosome 5B was defined by AX-95176502 and AX-94429067 (within an 18.0 cM confidence interval) with the LOD scores of 4.10–4.17 explaining 16.3–16.4% of the TN variation. Unlike SL, Keumkang provided the allele for high tillering with the additive effects between −0.75 and −0.74. Three QTLs were identified for LCR. QLCR-1 on chromosome 1B was defined by AX-94414200 and AX-94757158 (within a 3.0 cM confidence interval) with the LOD scores of 3.62–8.67 explaining 8.7–19.1% of the phenotypic variation. QLCR-2 on chromosome 5B was defined by AX-94904781 and AX-95257493 (within a 7.0 cM confidence interval) with the LOD scores of 9.14–10.82 explaining 22.2–34.5% of the phenotypic variation. QLCR-3 on chromosome 6A was defined by AX-94411823 and AX-94602621 (within a 17.5 cM confidence interval) with the LOD scores of 5.54–6.77 explaining 17.4–22.7% of the phenotypic variation. Taejoong provided the alleles for long LCR at QLCR-2 and QLCR-3 with the additive effects of 0.06–0.07 and 0.05, respectively, and Keumkang provided the allele for long LCR at QLCR-1 with the additive effect between −0.05 and −0.03. Only one QTL affected two or more traits, i.e., QSL-3/QLCR-3 flanked by AX-94411823 and AX-94602621 on chromosome 6A. No stable QTL was detected for CL, COM, and KS.

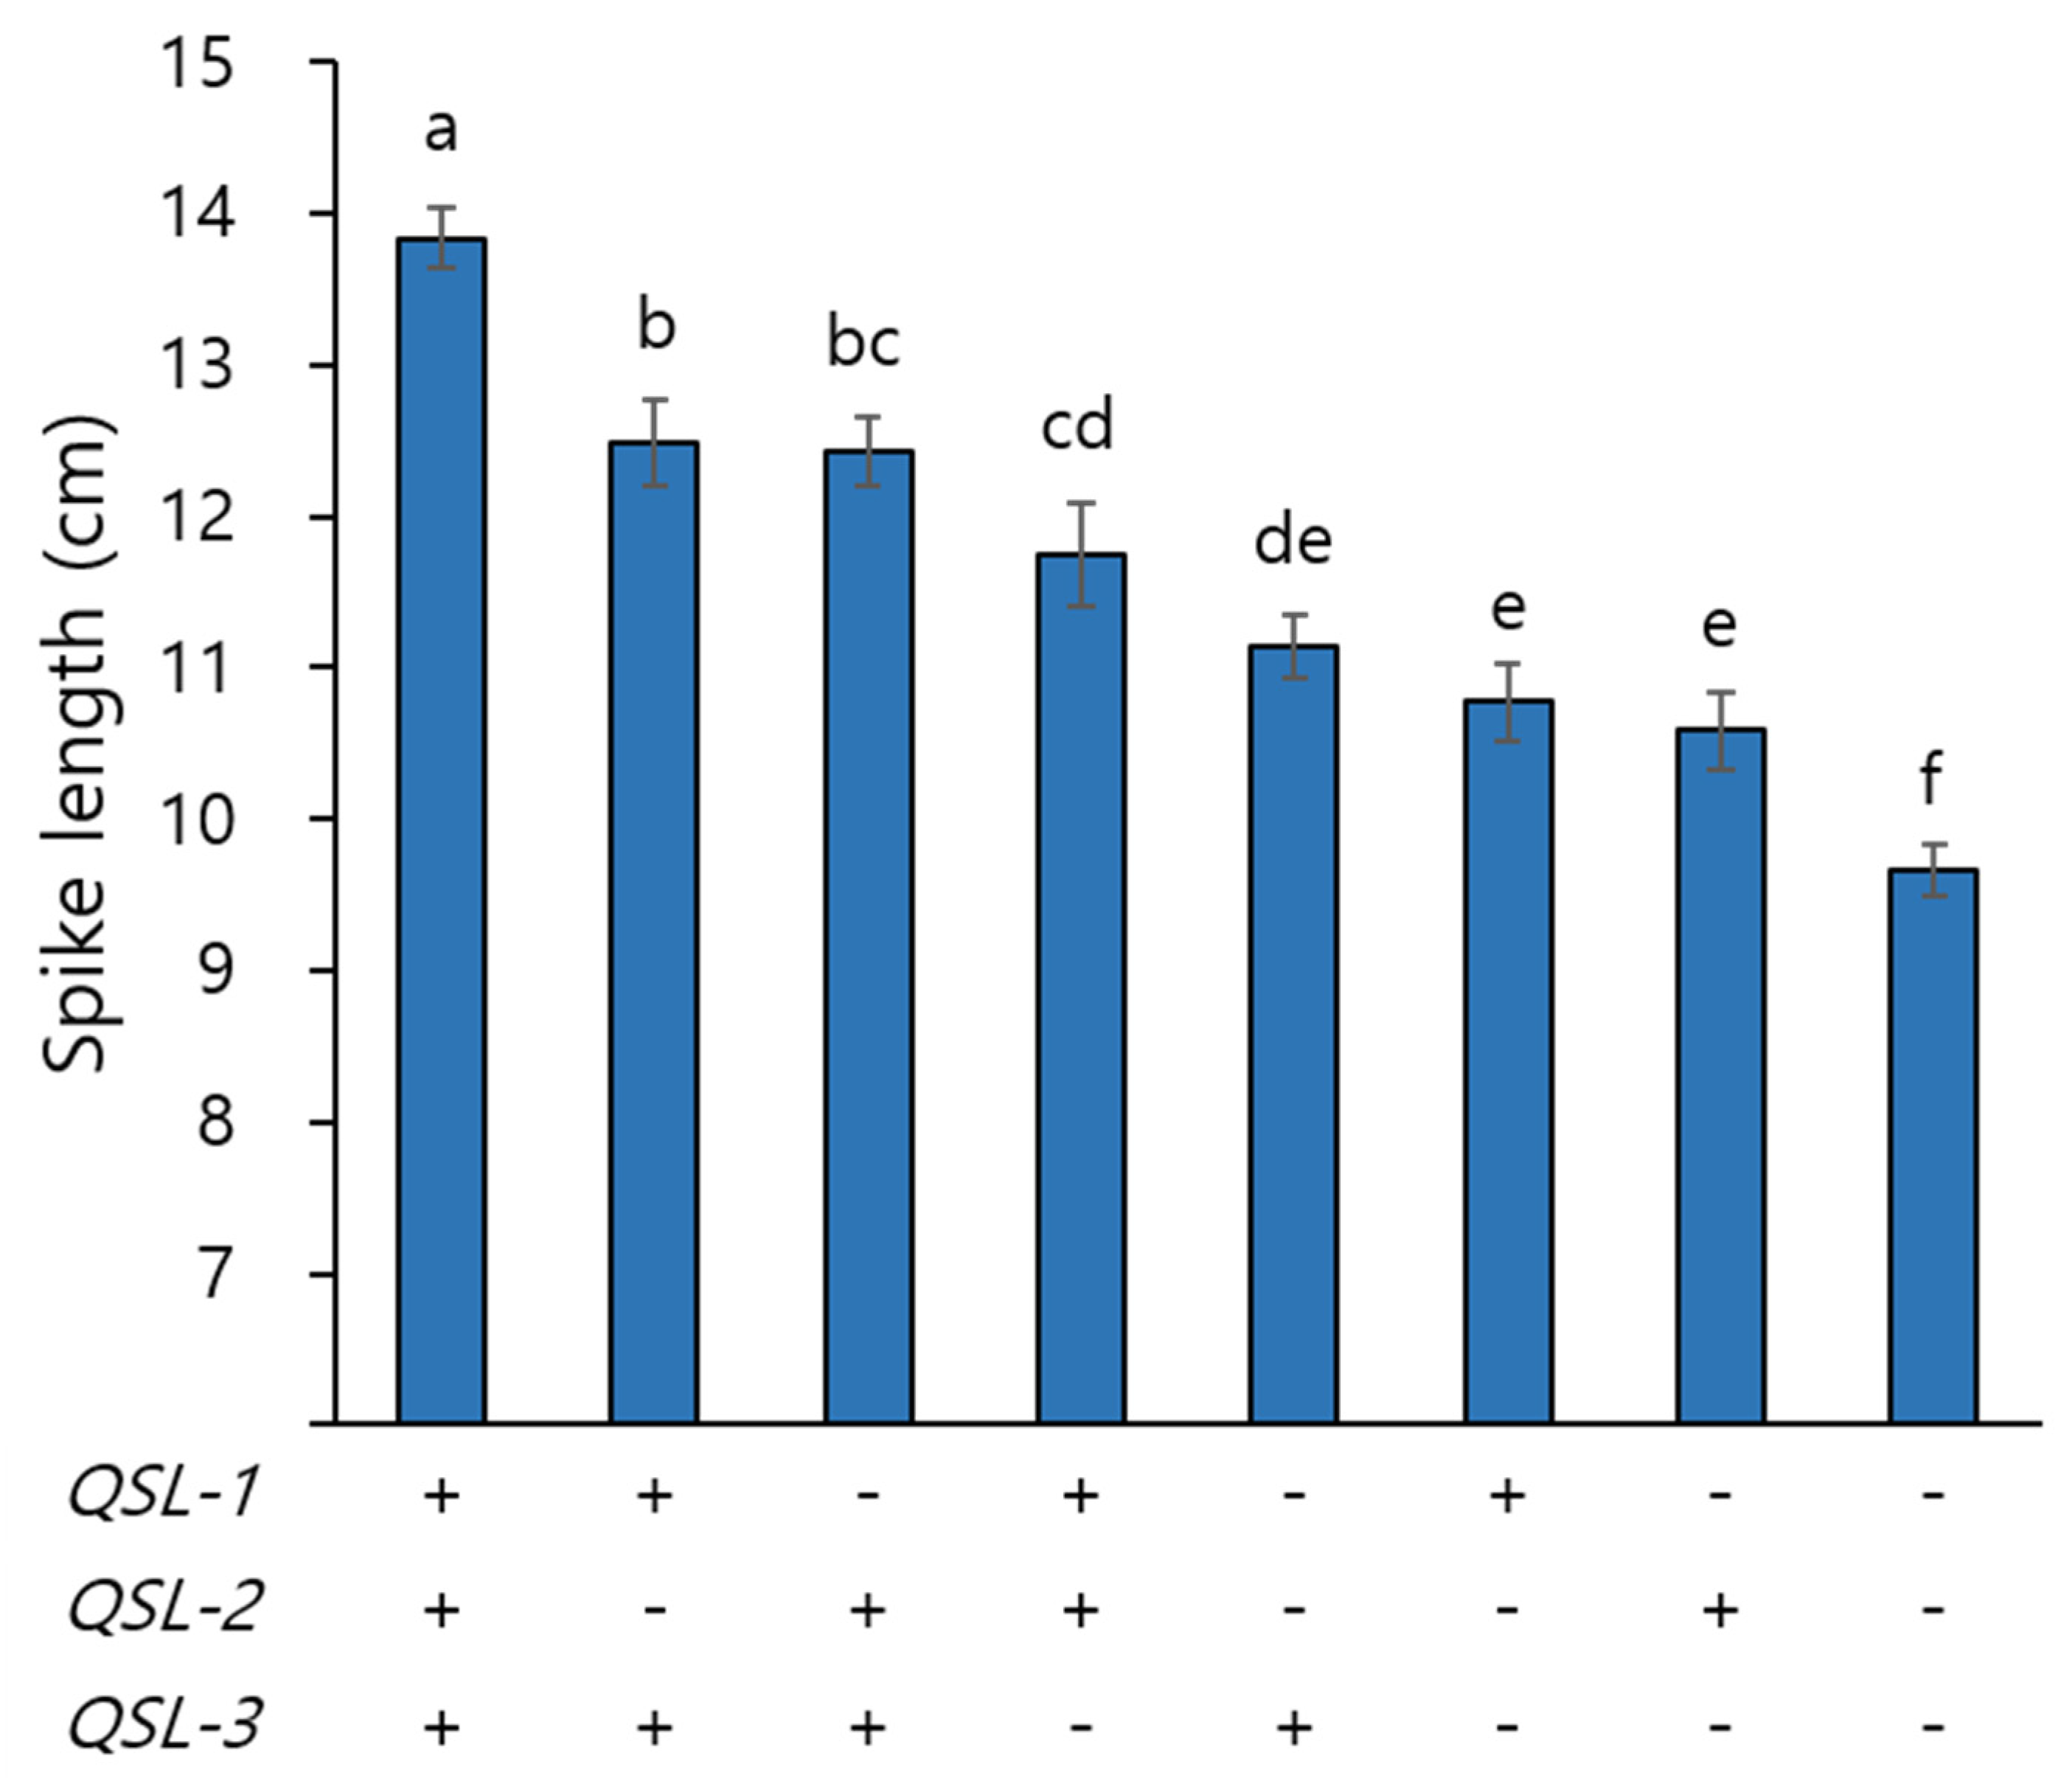
3.3. Effects of QSL-1, QSL-2, and QSL-3 on Spike Length and Other Yield Potential Traits

To evaluate the main effects of the three QTLs for SL and their interactions on yield potential traits, three-way factorial ANOVAs of QSL-1, QSL-2, and QSL-3 were carried out for each trait with the year (2017, 2018, and 2019) as a random factor (Table 2). Spike length (SL): The main effects of QSL-1, QSL-2, and QSL-3 were highly significant for SL. Compared to the RILs carrying the Keumkang allele at each QTL, those carrying the Taejoong allele exhibited significantly longer spike, i.e., 1.2, 1.2, and 1.8 cm longer for QSL-1, QSL-2, and QSL-3, respectively. Notably, there was no significant two-way or three-way interaction among the three QTLs, indicating that pyramiding of the Taejoong alleles at QSL-1, QSL-2, and QSL-3 would increase SL additively. While the average SL of the RILs carrying the Keumkang alleles at all three QTLs was 9.7 cm, those carrying the Taejoong allele at one of the three QTLs exhibited the average SL of 10.6–11.1 cm (Figure 5). The RILs carrying the Taejoong alleles at two of the three QTLs exhibited the average SL of 11.8–12.5 cm. The RILs carrying the Taejoong alleles at all three QTLs exhibited the longest average SL of 13.8 cm. Days to heading date (DHD): QSL-1 and QSL-2 had significant main effects on DHD, with the Taejoong alleles for long spike being associated with late heading. The RILs carrying the Taejoong allele at QSL-1 headed 1.0 day later than those carrying the Keumkang allele. Similarly, the RILs carrying the Taejoong allele at QSL-2 headed 0.8 days later than those carrying the Keumkang allele. The main effect of QSL-3 was not significant for DHD. While there was no significant two-way interaction, the three-way interaction was significant and explained 4.7% of the DHD variance. Culm length (CL): While the main effects of QSL-1 and QSL-2 were not significant for CL, that of QSL-3 was highly significant. The RILs carrying the Taejoong allele at QSL-3 were 3.9 cm taller than those carrying the Keumkang allele. The QSL-2 × QSL-3 interaction and the three-way interaction were significant for CL, but explained limited levels (3.0% and 2.3%, respectively) of the CL variance. Compactness (COM): The main effects of QSL-1, QSL-2, and QSL-3 were highly significant for COM, with the RILs carrying the Keumkang allele exhibiting more compact spike than those carrying the Taejoong allele. No significant two-way or three-way interaction was observed. Kernels per spike (KS): QSL-1 and QSL-3 had significant main effects on KS. Compared to the RILs carrying the Keumkang allele at QSL-1, those carrying the Taejoong allele had 2.8 more kernels per spike. Similarly, those carrying the Taejoong allele at QSL-3 had 2.8 more kernels per spike than those carrying the Keumkang allele. Two-way or three-way interactions were not significant, indicating that the Taejoong alleles at QSL-1 and QSL-3 would increase KS additively. Tiller number (TN): The main effects of QSL-1, QSL-2, and QSL-3 were significant for TN, with the RILs carrying the Keumkang allele exhibiting more tillers than those carrying the Taejoong allele. The QSL-1 × QSL-2 interaction and the QSL-2 × QSL-3 interaction were significant for TN, explaining the limited level (3.6% and 1.6%, respectively) of the TN variance. Length of center rachis (LCR): The main effects of QSL-1, QSL-2, and QSL-3 were highly significant for LCR, with the RILs carrying the Taejoong allele exhibiting longer LCR than those carrying the Keumkang allele. The QSL-1 × QSL-2 interaction and the QSL-1 × QSL-3 interaction were significant, explaining the limited level (2.0% and 1.4%, respectively) of the LCR variance.

4. Discussion

4.1. Potential Use of the Spike Length QTLs in Breeding

Improving yield potential has been one of the most important goals in wheat breeding [22,23,24,25]. As kernels per spike is strongly correlated with the final grain yield, selecting breeding lines with large spike has been a popular strategy for increasing sink capacity and improving yield potential [12,26]. To genetically dissect the large spike characteristics of the Korean wheat cultivar Taejoong, we identified three major QTLs for spike length, QSL-1, QSL-2, and QSL-3, using F10 RILs which were derived from the Taejoong × Keumkang cross and genotyped with high density SNPs. At all three QTLs, the Taejoong alleles for long spike were associated with greater number of kernels per spike. Therefore, the SNPs linked to QSL-1, QSL-2, and QSL-3 would provide useful molecular tools to develop breeding lines with increased sink capacity through marker assisted selections. QSL-1, QSL-2, and QSL-3 are especially promising as they exhibited no significant two-way or three-way interactions on spike length and kernels per spike, indicating that pyramiding the Taejoong alleles at these QTLs would additively increase sink capacity (Table 2, Figure 5).
Nevertheless, caution is required as the effect of increased kernels per spike is frequently compensated for by decreased tiller number per unit area [27,28,29,30]. Our results showed that the Taejoong alleles for long spike at QSL-1, QSL-2, and QSL-3 are also associated with reduced tiller number, and that the three QTLs exhibit different levels of tradeoffs between kernels per spike and tiller number. For example, while the effect of the Taejoong allele increasing kernels per spike was similar between QSL-1 and QSL-3, the effect of the Taejoong allele decreasing tiller number was nearly seven times greater at QSL-1 compared with that at QSL-3 (Table 2). While further investigation is required to characterize the effects of the spike length QTLs on other yield potential traits under different environments and genetic backgrounds, the current results suggest that QSL-3 is likely more beneficial than QSL-1 in terms of optimizing the balance between kernels per spike and tiller number. Our results also illustrate the importance of dissecting individual genetic factors underlying yield potential traits and characterizing their effects on other yield components in order to provide breeding programs with useful molecular tools for optimizing the balance among different yield components.

4.2. Comparison of QSL-1, QSL-2, and QSL-3 with Previously Reported Spike Length QTLs

Using the IWGSC RefSeq v1.0 wheat reference genome information [31], we compared the locations of QSL-1, QSL-2, and QSL-3 with other spike length QTLs identified from previous studies. Interestingly, the QSL-2 region flanked by the markers AX-94831718 (503.8 Mb) and AX-94846616 (640.2 Mb) on chromosome 5A overlapped with many previously reported spike length QTLs, that is, QSL.caas-5AL near the marker JD_c15758_288 (595.4 Mb) identified from the Zhou 8425B × Chinese Spring RIL population [32], Qsl.cau-5A.4 near BS00096756_51 (538.8 Mb) identified from the Yumai 8679 × Jing411 RIL population [33], qSl-5A.3 flanked by AX-110071854 (478.6 Mb), AX-111139819 (541.3 Mb) identified from the Kenong 9204 × Jing411 RIL population [34], and QSL-5A.4 peaking near BS00066143_51 (533.1 Mb) identified from the Yanzhan 1 × Hussar RIL population [35]. While QSL.caas-5AL was detected in only one out of three tested environments [32], Qsl.cau-5A.4, qSl-5A.3, and QSL-5A.4 were stably detected in seven (out of nine), eight (out of eight), and two (out of eight) different environments, respectively [33,34,35]. These QTLs explained 1.9% (QSL-5A.4) to 20.6% (qSl-5A.3) of the spike length variation in the relevant RIL populations, and their additive effects ranged from 0.27 cm (qSl-5A.3) to 0.62 cm (QSL-5A.4) [32,33,34,35], which were smaller than or similar to that (0.61–0.62 cm) of QSL-2 (Table 2). While further work is required to narrow down each QTL and determine whether QSL-2 from the present study and the other four previously reported QTLs represent the same gene or not, our study and the previous reports suggest the QSL-2 region as an important locus affecting spike length in different genetic backgrounds and environments. Although a few spike length QTLs have been previously reported on chromosomes 1D and 6A, that is, QSl-1D and QSl-6A from the NongDa3331 × Zang 1817 RIL population [36] and QSl.czm-6A from the MD233 × SS8641 doubled haploid population [37], we were unable to precisely compare the chromosomal locations of them with QSL-1 and QSL-3 from the present study.

Supplementary Materials

The following are available online at https://www.mdpi.com/2073-4395/11/1/22/s1, Figure S1: Distribution and correlation of yield potential traits in 94 F10 recombinant inbred lines produced from the cross between Taejoong and Keumkang in 2017. T and K indicate Taejoong and Keumkang, respectively. M (black dia-mond) indicates the average value of each trait. DHD, days to heading date; CL, culm length; SL, spike length; COM, compactness; KS, kernels per spike; TN, number of tillers; LCR, length of center rachis. An asterisk indicates significance (, *, and *** at P ≤ 0.05, P ≤ 0.01, and P ≤ 0.001 levels, respectively). Figure S2: Distribution and correlation of yield potential traits in 94 F10 recombinant inbred lines produced from the cross between Taejoong and Keumkang in 2018. T and K indicate Taejoong and Keumkang, respectively. M (black dia-mond) indicates the average value of each trait. DHD, days to heading date; CL, culm length; SL, spike length; COM, compactness; KS, kernels per spike; TN, number of tillers; LCR, length of center rachis. An asterisk indicates significance (, *, and *** at P ≤ 0.05, P ≤ 0.01, and P ≤ 0.001 levels, respectively). Figure S3: Distribution and correlation of yield potential traits in 94 F10 recombinant inbred lines produced from the cross between Taejoong and Keumkang in 2019. T and K indicate Taejoong and Keumkang, respectively. M (black dia-mond) indicates the average value of each trait. DHD, days to heading date; CL, culm length; SL, spike length; COM, compactness; KS, kernels per spike; TN, number of tillers; LCR, length of center rachis. An asterisk indicates significance (, *, and *** at P ≤ 0.05, P ≤ 0.01, and P ≤ 0.001 levels, respectively). Table S1: Descriptive statistics of the yield potential traits in the Taejoong × Keumkang recombinant inbred linesa. Table S2: SNP-based genetic map for QTLs related to yield potential traits in 94 F10 recombinant inbred lines produced from the cross between Taejoong and Keumkang.

Author Contributions

Data curation, C.-S.K. and Y.-J.M.; Formal analysis, K.-M.K., K.-H.K., and J.-B.C.; Validation, C.-S.P.; Writing—original draft, C.-S.K. and Y.-J.M.; Writing—review & editing, C.-S.P. and S.-W.C. All authors have read and agreed to the published version of the manuscript.

Funding

This work was carried out with the support of Cooperative Research Program for Agriculture Science and Technology Development (Project No. PJ 012792012020), Rural Development Administration, Republic of Korea.

Conflicts of Interest

The authors declare no conflict of interest.

References

  1. Morgournov, A.; Sonder, K.; Abugalieva, A.; Bhadauria, V.; Cuthbert, R.D.; Shamanin, V.; Zeleskiy, Y.; DePauw, R.M. Effect of climate change on spring wheat yields in North America and Eurasia in 1981-2015 and implications for breeding. PLoS ONE 2018, 13, e0204932. [Google Scholar]
  2. Ray, D.K.; Mueller, N.D.; West, P.C.; Foley, J.A. Yield trends are insufficient to double global crop production by 2050. PLoS ONE 2013, 8, e66428. [Google Scholar] [CrossRef] [PubMed] [Green Version]
  3. Nadolska-Orczyk, A.; Rajchel, I.K.; Orczyk, W.; Gasparis, S. Major genes determining yield-related traits in wheat and barley. Theor. Appl. Genet. 2017, 130, 1081–1098. [Google Scholar] [CrossRef] [PubMed] [Green Version]
  4. Valluru, R.; Reynolds, M.P.; Salse, J. Genetic and molecular bases of yield-associated traits: A translational biology approach between rice and wheat. Theor. Appl. Genet. 2014, 127, 1463–1489. [Google Scholar] [CrossRef] [PubMed]
  5. Bennett, D.; Izanloo, A.; Reynolds, M.; Kuchel, H.; Langridge, P.; Schnurbusch, T. Genetic dissection of grain yield and physical grain quality in bread wheat (Triticum aestivum L.) under water-limited environments. Theor. Appl. Genet. 2012, 125, 255–271. [Google Scholar] [CrossRef] [PubMed]
  6. Edae, E.A.; Byrne, P.F.; Haley, S.D.; Lopes, M.S.; Reynolds, M.P. Genome-wide association mapping of yield and yield components of spring wheat under contrasting moisture regimes. Theor. Appl. Genet. 2014, 127, 791–807. [Google Scholar] [CrossRef]
  7. Reynolds, M.P.; Pellegrineschi, A.; Skovmand, B. Sink limitation to yield and biomass: A summary of investigations in spring wheat. Ann. Appl. Biol. 2005, 146, 39–49. [Google Scholar] [CrossRef]
  8. Reynolds, M.P.; Foulkes, M.J.; Furbank, R.; Griffiths, S.; King, J.; Murchie, M.; Parry, M.; Slafer, G. Achieving yield gains in wheat. Plant Cell Enviorn. 2012, 35, 1799–1823. [Google Scholar] [CrossRef]
  9. Fischer, R.A. Understanding the physiological basis of yield potential in wheat. J. Agric. Sci. 2007, 145, 99–113. [Google Scholar] [CrossRef]
  10. Bernardo, R. Molecular markers and selection for complex traits in plants: Learning from the last 20 years. Crop Sci. 2008, 48, 1649–1664. [Google Scholar] [CrossRef] [Green Version]
  11. Foulkes, M.J.; Slafer, G.A.; Davies, W.J.; Berry, P.M.; Sylvester-Bradley, R.; Martre, P.; Calderini, D.F.; Griffiths, S.; Reynolds, M.P. Raising yield potential of wheat. III. Optimizing partitioning to grain while maintaining lodging resistance. J. Exp. Bot. 2011, 62, 469–486. [Google Scholar] [CrossRef] [PubMed] [Green Version]
  12. Sakuma, S.; Schnurbusch, T. Of floral fortune: Tinkering with the grain yield potential of cereal crops. New Phytol. 2020, 225, 1873–1882. [Google Scholar] [CrossRef] [PubMed] [Green Version]
  13. Calderini, D.F.; Drecer, M.F.; Slafer, G.A. Genetic improvement in wheat yield and associated traits. A re-examination of previous results and the latest trends. Plant Breed. 1995, 114, 108–112. [Google Scholar]
  14. Wurschum, T.; Leiser, W.L.; Langer, S.M.; Tucker, M.R.; Longin, C.F. Phenotypic and genetic analysis of spike and kernel characteristics in wheat reveals long-term genetic trends of grain yield components. Theor. Appl. Genet. 2018, 131, 2071–2084. [Google Scholar] [CrossRef] [PubMed]
  15. Rajaram, S.; Reynolds, M.P. International Wheat breeding: Abstracts of XVIth Eucarpia Congress-Plant Breeding: Sustaining the Future, Proceedings of the 6th Eucarpia Congress, Edinburgh, UK, 10–14 September 2001; Edinburgh University Press: Edinburgh, UK, 2001. [Google Scholar]
  16. Gaju, O.; Reynolds, M.P.; Sparkes, D.L.; Foulkes, M.J. Relationships between large spike phenotype, grain number and yield potential in spring wheat. Crop Sci. 2009, 49, 961–973. [Google Scholar] [CrossRef]
  17. Gaju, O.; Reynolds, M.P.; Sparkes, D.L.; Mayes, S.; RibasVargas, G.; Crossa, J.; Foulkes, M.J. Relationships between physiological traits, grain number and yield potential in a wheat DH population of large spike phenotype. Field Crops Res. 2014, 164, 126–135. [Google Scholar] [CrossRef]
  18. Kang, C.S.; Seo, S.J.; Kim, K.H.; Jung, Y.G.; Kim, H.S.; Park, J.C.; Choi, I.D.; Kim, K.H.; Hyun, J.N.; Kim, K.J.; et al. A New Plant Type Wheat “Iksan 370” with Long Spikes, High Yield and Hard Wheat and Breeding Method. No. 10-2013-0120136, 8 October 2013. [Google Scholar]
  19. Kim, K.M.; Kim, K.H.; Cheong, Y.K.; Choi, C.H.; Kim, Y.K.; Park, J.H.; Kim, K.H.; Jang, J.; Choi, J.K.; Bae, J.S.; et al. Taejoong’ a Wheat Variety with Good Noodle Quality, Red Grain Wheat, Long Spike, and Moderate Resistance to Fusarium Head Blight. Korean J. Breed. Sci. 2019, 51, 445–452. [Google Scholar] [CrossRef] [Green Version]
  20. Song, T.H.; Kim, K.H.; Cheong, Y.K.; Son, J.H.; Park, J.C.; OH, Y.J.; Park, J.H.; Kim, Y.K.; Kim, K.H.; Park, T.I.; et al. Evaluation of feed value and fermentation quality of new wheat cultivar, “Taejoong’. Korean J. Breed. Sci. 2017, 37, 61–67. [Google Scholar] [CrossRef]
  21. Wang, J.; Li, H.; Zhang, L.; Meng, L. Users’ Manual of QTL IciMapping; The Quantitative Genetics Group, Institute of Crop Science, Chinese Academy of Agricultural Sciences (CAAS): Beijing, China; Genetic Resources Program, International Maize and Wheat Improvement Center (CIMMYT): Mexico City, Mexico, 2014. [Google Scholar]
  22. Fischer, R.A. Yield Potential in a Dwarf Spring Wheat and the Effect of Shading. Crop Sci. 1975, 5, 607–613. [Google Scholar] [CrossRef]
  23. Fischer, R.A.; Rees, D.; Sayre, K.D.; Lu, Z.M.; Condon, A.G.; Saavedra, A.L. Wheat Yield Progress Associated with Higher Stomatal Conductance and Photosynthetic Rate, and Cooler Canopies. Crop Sci. 1998, 38, 1467–1475. [Google Scholar] [CrossRef]
  24. Foulkes, M.J.; Snape, J.W.V.; Shearman, V.J.; Reynolds, M.P.; Gaju, O.; Sylvester-Bradley, R. Genetic progress in yield potential in wheat: Recent advances and future prospects. J. Agric. Sci. 2007, 145, 17–29. [Google Scholar] [CrossRef]
  25. Singh, R.P.; Singh, P.K.; Rutkoski, J.; Hodson, D.P.; He, X.; Jørgensen, L.N.; Hovmøller, M.S.; Huerta-Espino, J. Disease Impact on Wheat Yield Potential and Prospects of Genetic Control. Annu. Rev. Phytopathol. 2016, 54, 303–325. [Google Scholar] [CrossRef] [PubMed] [Green Version]
  26. Denćić, S. Designing a d wheat ideotype with increased sink capacity. Plant Breed. 1994, 112, 311–317. [Google Scholar] [CrossRef]
  27. Wang, Z.; Liu, Y.; Shi, H.; Wu, F. Identification and validation of novel low-tiller number QTL in common wheat. Theor. Appl. Genet. 2016, 129, 603–612. [Google Scholar] [CrossRef] [PubMed]
  28. Bastos, L.M.; Carciochi, W.; Lollato, R.P.; Jaenisch, B.R.; Renzende, C.R.; Schwalbert, R.; Prasad, P.V.V.; Zhang, G.; Frotz, A.K.; Foster, C.; et al. Winter wheat yield response to plant density as a function of yield environment and tillering potential: A review and field studies. Front. Plant Sci. 2020, 11, 1–17. [Google Scholar] [CrossRef] [PubMed] [Green Version]
  29. Ojha, R.; Sarkar, A.; Aryal, A.; Rahul, K.C.; Tiwari, S.; Poudel, M.; Pant, K.R.; Shrestha, J. Correlation and path coefficient analysis of wheat (Triticum aestivum L.) genotypes. Fmg. Mngmt. 2018, 3, 136–141. [Google Scholar]
  30. Guo, Z.; Zhao, Y.; Röder, M.; Reif, J.C.; Ganal, M.W.; Chen, D.; Schnurbusch, T. Manipulation and prediction of spike morphology traits for the improvement of grain yield in wheat. Sci. Rep. 2018, 8, 1–10. [Google Scholar] [CrossRef] [PubMed]
  31. International Wheat Genome Sequencing Consortium (IWGSC). Shifting the limits in wheat research and breeding using a fully annotated reference genome. Science 2018, 361, eaar7191. [Google Scholar] [CrossRef] [PubMed] [Green Version]
  32. Gao, F.; Wen, W.; Liu, J.; Rasheed, A.; Yin, G.; Xia, X.; Wu, X.; He, Z. Genome-wide linkage mapping of QTL for yield components, plant height and yield-related physiological traits in the Chinese wheat cross Zhou 8425B/Chinese Spring. Front. Plant Sci. 2015, 6, 1099. [Google Scholar] [CrossRef] [PubMed] [Green Version]
  33. Zhai, H.; Feng, Z.; Li, J.; Liu, X.; Xiao, S.; Ni, Z.; Sun, Q. QTL Analysis of spike morphological traits and plant height in winter wheat (Triticum aestivum L.) using a high-density SNP and SSR-based linkage map. Front. Plant Sci. 2016, 7, 1617. [Google Scholar] [CrossRef] [PubMed]
  34. Fan, X.; Cui, F.; Ji, J.; Zhang, W.; Zhao, X.; Liu, J.; Meng, D.; Tong, Y.; Wang, T.; Li, J. Dissection of pleiotropic QTL regions controlling wheat spike characteristics under different nitrogen treatments using traditional and conditional QTL mapping. Front. Plant Sci. 2019, 10, 187. [Google Scholar] [CrossRef] [PubMed]
  35. Hu, J.; Wang, X.; Zhang, G.; Jiang, P.; Chen, W.; Hao, Y.; Ma, X.; Xu, S.; Jia, J.; Kong, L.; et al. QTL mapping for yield-related traits in wheat based on four RIL populations. Theor. Appl. Genet. 2020, 133, 917–933. [Google Scholar] [CrossRef] [PubMed]
  36. Liu, G.; Jia, L.; Lu, L.; Qin, D.; Zhang, J.; Guan, P.; Ni, Z.; Yao, Y.; Sun, Q.; Peng, H. Mapping QTLs of yield-related traits using RIL population derived from common wheat and Tibetan semi-wild wheat. Theor. Appl. Genet. 2014, 127, 2415–2432. [Google Scholar] [CrossRef] [PubMed]
  37. Zhou, Y.; Conway, B.; Miller, D.; Marshall, D.; Cooper, A.; Murphy, P.; Chao, S.; Brown-Guedira, G.; Costa, J. Quantitative trait loci mapping for spike characteristics in hexaploid wheat. Plant Genome 2017, 10, 1–15. [Google Scholar] [CrossRef] [Green Version]
Figure 1. Phenotype comparison of Taejoong and Keumkang: (A) plants at heading, and (B) spike, rachis, and kernels per spike after maturity.
Agronomy 11 00022 g001
Figure 2. Comparison of density and probability distribution of yield potential traits across three years. DHD, days to heading date; CL, culm length; SL, spike length; COM, compactness; KS, kernels per spike; TN, number of tillers; LCR, length of center rachis. Red, green, and blue colors indicate data from 2017, 2018, and 2019, respectively. A black vertical line indicates the mean value of the three years. SW indicates the P-value from the Shapiro–Wilk test, and an asterisk indicates significance (*, **, and *** at P ≤ 0.05, P ≤ 0.01, and P ≤ 0.001 levels, respectively).
Agronomy 11 00022 g002
Figure 3. Correlation between yield potential traits in 94 F10 recombinant inbred lines produced from the cross between Taejoong and Keumkang. DHD, days to heading date; CL, culm length; SL, spike length; COM, compactness; KS, kernels per spike; NS, number of spikes; LCR, length of center rachis. An asterisk indicates significance (*, **, and *** at p ≤ 0.05, p ≤ 0.01, and p ≤ 0.001 levels, respectively).
Agronomy 11 00022 g003
Figure 4. SNP-based QTL mapping for yield potential traits in 94 F10 recombinant inbred lines produced from the cross between Taejoong and Keumkang. SL, spike length; DHD, days to heading date; TN, number of tillers; LCR, length of center rachis.
Agronomy 11 00022 g004
Figure 5. Spike length of the RILs carrying different allele combinations of QSL-1, QSL-2, and QSL-3. The symbol “+” indicates the Taejoong allele for a long spike while “-” indicates the Keumkang allele for a short spike. QSL-1, QSL-2, and QSL-3 were represented by the markers AX-94918964, AX-94831718, and AX-94602621, respectively. Different letters above the bars indicate that there was significant difference from Duncan’s multiple range test at P < 0.05. Error bars indicate standard errors.
Agronomy 11 00022 g005
Table 1. Quantitative trait loci (QTLs) for yield potential traits identified from the Taejoong × Keumkang recombinant. inbred lines.
QTL aYearChromosomePosition (cM)Left MarkerRight MarkerInterval (cM) bLOD cPVE (%) dAdd e
QDHD-120177B172.0AX-94684729AX-944740445.03.9011.81.37
2019 4.2413.71.30
QSL-120171D268.0AX-94390275AX-949189645.03.6311.20.59
2018 5.3715.60.72
2019 4.0415.10.62
QSL-220185A208.0AX-94831718AX-9484661616.03.8212.20.62
2019 3.5515.10.61
QSL-320176A175.0AX-94411823AX-9460262113.57.5926.00.88
2018 7.2528.80.95
2019 5.8828.80.84
QTN-120175B269.0AX-95176502AX-9442906718.04.1716.3−0.75
2018 4.1016.4−0.74
2019 4.1516.4−0.75
QLCR-120171B330.0AX-94414200AX-947571583.08.6719.1−0.05
2018 3.628.7−0.03
2019 3.758.7−0.04
QLCR-220175B419.0AX-94904781AX-952574937.09.1422.20.06
2018 10.8234.50.07
2019 9.7330.30.07
QLCR-320186A171.0AX-94411823AX-9460262117.55.5417.40.05
2019 6.7722.70.05
a DHD, days to heading date; SL, spike length; TN, number of tillers; LCR, length of center rachis. b Interval means 2-LOD confidence interval. c Logarithm of the odds. d Phenotypic variance explained. e Additive effect of allele substitution. The units are those of the corresponding traits. A positive sign indicates that the Taejoong allele increased the trait value.
Table 2. Three-way ANOVAs of QSL-1, QSL-2, and QSL-3 for different yield potential traits.
Trait aAllele bMain Effect cInteraction d
QSL-1QSL-2QSL-3Q1 × Q2Q1 × Q3Q2 × Q3Q1 × Q2 × Q3
SL
(cm)
T12.212.212.5
K11.011.010.7
P-value************nsnsnsns
PVE (%)20.215.218.6
DHD
(no.)
T185.5185.4185.1
K184.5184.6184.9
P-value******nsnsnsns***
PVE (%)5.72.6 4.7
CL
(cm)
T84.484.587.4
K86.586.483.5
P-valuensns****nsns****
PVE (%) 6.5 3.02.3
COM
(no./cm)
T4.44.34.3
K4.64.74.7
P-value************nsnsnsns
PVE (%)5.47.55.9
KS
(no.)
T51.750.651.7
K48.950.048.9
P-value****ns**nsnsnsns
PVE (%)6.0 3.6
TN
(no.)
T5.75.86.0
K6.46.36.1
P-value**********ns*ns
PVE (%)8.32.61.63.6 1.6
LCR
(cm)
T0.710.730.73
K0.660.640.64
P-value****************nsns
PVE (%)9.921.611.92.01.4
a SL, spike length; DHD, days to heading date; CL, culm length; COM, compactness; KS, kernels per spike; TN, number of tillers; LCR, length of center rachis. b Mean values of the recombinant inbred lines (RILs) carrying the Taejoong (T) allele and the Keumkang (K) allele are indicated for each QTL. An asterisk indicates significance (* P ≤ 0.05, ** P ≤ 0.01, *** P ≤ 0.001, and **** P ≤ 0.0001; ns: not significant) from the three-way factorial ANOVA with the year (2017, 2018, and 2019) as a random factor and the three QTLs as fixed factors. Phenotype variance explained (PVE) is indicated only for significant effects. c QSL-1, QSL-2, and QSL-3 were represented by the markers AX-94918964, AX-94831718, and AX-94602621, respectively. d Q1, Q2, and Q3 indicate QSL-1, QSL-2, and QSL-3, respectively.
Publisher’s Note: MDPI stays neutral with regard to jurisdictional claims in published maps and institutional affiliations.

