Article

The Development of a European and Mediterranean Chickpea Association Panel (EMCAP)

1
Department of Agricultural, Food and Environmental Sciences, Università Politecnica delle Marche, 60131 Ancona, Italy
2
Centro di Ricerca per le Colture Industriali, Consiglio per la Ricerca in Agricoltura e l’Analisi dell’Economia agraria, 60027 Osimo, Ancona, Italy
*
Authors to whom correspondence should be addressed.
Agronomy 2020, 10(9), 1417; https://doi.org/10.3390/agronomy10091417
Submission received: 21 August 2020 / Revised: 11 September 2020 / Accepted: 14 September 2020 / Published: 17 September 2020
(This article belongs to the Section Crop Breeding and Genetics)

Abstract

:
Association panels represent a useful tool for quantitative trait loci (QTL) mapping and pre-breeding. In this study, we report on the development of a European and Mediterranean chickpea association panel as a useful tool for gene discovery and breeding. Chickpea (Cicer arietinum L.) is one of the most important food legumes worldwide and a key crop in the Mediterranean environments. The selection of genotypes followed criteria aimed to build a set of materials representative of the genetic diversity of chickpea germplasm focusing on the European and Mediterranean environments, which have largely been ignored to date. This tool can help breeders to develop novel varieties adapted to European and Mediterranean agro-ecosystems. Initially, 1931 chickpea accessions were phenotypically evaluated in a field trial in central Italy. From these, an association panel composed by 480 genotypes derived from single-seed descent was identified and phenotypically evaluated. Current and future phenotypic data combined with the genotypic characterization of the association panel will allow to dissect the genetic architecture of important adaptive and quality traits and accelerate breeding. This information can be used to predict phenotypes of unexploited chickpea genetic resources available in genebanks for breeding.

1. Introduction

Chickpea is the second most grown food legume worldwide after the common bean [1]. It was domesticated in the Fertile Crescent, particularly in south-eastern Turkey [2,3]. Since the Bronze Age, chickpea cultivation has spread throughout the Mediterranean Basin, central Asia, and Africa [4]. There are two main cultivated types of chickpea: the ‘desi’ type, which is characterized by purple flowers and small dark seeds, and is mostly grown in the Indian sub-continent and Ethiopia; and the ‘kabuli’ type, which has white flowers and large light seeds, and is mainly consumed in the Mediterranean Basin.
Chickpea is an example of a food legume crop that is suited to the European environment. This applies in particular to Mediterranean regions, where a large number of landraces are still maintained by smallholder farmers [5]. In the Mediterranean area, chickpea is usually grown in the spring–summer season, relying on the residual moisture of the soil. However, many studies conducted in Mediterranean countries have shown that the mild winter conditions of this area offer the possibility to sow chickpea in autumn, with increased yield and yield stability [6,7]. However, breeding efforts to develop novel chickpea varieties that are better adapted to European agro-ecosystems are still lacking [8]. Indeed, breeding activities for legumes almost stopped in the 1940s, although national activities and recent projects are now growing due to the stimulus of consumer demand and market trends [9].
In this regard, plant genetic resources and their characterization represent a crucial prerequisite toward the development of elite varieties with enhanced quality traits that might be suitable for sustainable European agro-ecosystems. Pre-breeding resources are now available for chickpea, which include large plant collections, as mainly the gene banks of the International Crops Research Institute for the Semi-Arid Tropics (ICRISAT) and the International Centre for Agricultural Research in Dry Areas (ICARDA), that hold 20.456 and 15.749 accessions, respectively (https://www.genesys-pgr.org/), reference genomes [10,11,12], and resequenced genotypes [4].
Large germplasm collections can make breeding evaluations difficult due to the large numbers of individuals. Core collections represent a useful pre-breeding tool that reduces large germplasm collections to manageable samples that maintain rich genetic diversity [13]; often, such collections or part of them are used as association panels [14,15,16], holding historical recombination events for greater genetic resolution needed for genome-wide association (GWA) studies. Chickpea core collections have been developed and characterized both phenotypically and genotypically [4,17,18,19,20,21,22] and used for association mapping [23,24]. However, these collections are mainly characterized by accessions of Asian origin, and thus they are not the ideal samples to targeting European agro-ecosystems.
In this study, we aimed to develop the first chickpea association panel, composed of genetic resources collected mainly in Europe and the Mediterranean Basin, which will represent an important pre-breeding tool for European food legume research.

2. Materials and Methods

2.1. Plant Material and Field Evaluation

A total of 1931 chickpea accessions from 47 different countries were used, as the UNIVPM_Ca_ALL collection. The seeds of 1812 and 119 accessions were provided by the Western Regional Plant Introduction Station (USDA-ARS, Washington State University, USA) and the Leibniz Institute of Plant Genetics and Crop Plant Research-IPK (Gatersleben, Germany), respectively. The selection criteria to order the accessions were: (i) to include mostly landraces; (ii) to cover the geographic distribution of the species, with a focus on European and Mediterranean regions. A complete list of the accessions studied along with passport information are available in Supplementary File S1.
The whole collection was sown the 18 February 2018, at the Research Centre for Cereal and Industrial Crops (CREA-CI) experimental station of Osimo (Ancona, Italy; latitude, 43°45′04″; longitude, 13°49′98″; 41 m above sea level), in single-row plots of 10 plants (distance between plants, 10 cm) without replicates. For each accession, a representative single plant was identified at maturity stage, and the seeds were harvested separately (i.e., single seed descent [SSD]).
Phenotypic characterization was carried out for the whole collection, considering the following traits: flower color (purple, white), days to first flower (number of days after sowing [DAS] when one open flower was present within a plot), days to full flowering (number of DAS when 50% of all plants had at least one open flower), days to first pod (number of DAS when one pod was present within a plot), yield (production in grams [g] of the entire row plot), and 1000-seed weight.

2.2. Association Panel Development

Starting from the UNIVPM_Ca_ALL collection, a nested set of materials (UNIVPM_Ca_core1) was developed based on three specific selection criteria: (i) adaptation to the specific environment, taking into account yield and 1000-seed weight evaluated in the UNIVPM_Ca_ALL collection field trial in 2018; (ii) equal representation of the desi and kabuli types; and (iii) maximized geographic representation (i.e., country of origin) using the passport information (Figure 1).
The UNIVPM_Ca_core1 included: 234 accessions with yield and/or 1000-seed weight greater than 150 g and 450 g, respectively; 92 accessions as Italian landraces, erect habitus accessions and/or early flowering accessions; 74 accessions with purple flower color, to balance the desi and kabuli types; and 26 accessions from countries not represented in the first selection in order to cover as much as possible the geographic distribution of the species. In this way, a total of 426 accessions were selected from the UNIVPM_Ca_ALL collection. For each of these accessions, the seeds produced by the selected single plants were collected (first SSD cycle). Finally, further 54 chickpea accessions (30 breeding lines from ICARDA, Rabat, Morocco; 24 Italian cultivars and landraces) were added to the UNIVPM_Ca_core1 set for a total of 480 entries (UNIVPM_Ca_core2). The 24 Italian further accessions include the main commercial varieties grown in Italy as controls and landraces, collected on farm, thus adapted to local environments. Based on passport information (i.e., accession codes/synonyms), no duplicates were included in UNIVPM_Ca_Core2 (Supplementary File S1).

2.3. UNIVPM_Ca_core2 Phenotypic Evaluation

The 480 UNIVPM_Ca_core2 lines were phenotypically evaluated in a field trial carried out in 2019 at the CREA-CI experimental station (Osimo, Ancona, Italy). The environmental data for the whole of 2019 were recorded by the weather station at CREA-CI in Osimo (Ancona, Italy). The weather data for the growing season (April–July 2019) and the soil data are reported in Supplementary File S2. The thermo-pluviometric data for the 2019 growing season (April–July) are illustrated in Supplementary Figure S2. The total precipitation was 316 mm and the mean temperature was 22.6 °C. High temperatures (>25 °C) were recorded from the last week of June to the end of the growing season. The experimental station was characterized by a loamy alkaline soil of pH 8 and 1.4% organic matter. The sowing was carried out on 10 April 2019, in single rows of 10 plants (distance between plants, 10 cm), using a randomized complete block design with two replicates. The first selfing cycle seeds of each UNIVPM_Ca_core1 genotype were used to continue the cycles of selfing for the development of the SSD lines, whereby seeds of a single plant for each plot of the first replicate were harvested separately to obtain the second selfing cycle seeds.
Several flowering, architectural, and production traits were evaluated. In addition to the flowering traits used for UNIVPM_Ca_ALL, the duration of flowering (i.e., difference between days to first pod and days to first flower) was also calculated. Days to first flower, days to full flowering, and days to first pod were also measured as the growing degree days (GDDs), according to Equation (1) [25]:
GDD = ∑(Tm − Tb)
where Tm is the daily average temperature (°C), and Tb is the chickpea base temperature (here taken as 0 °C).
At complete mature stage, the following architectural traits were evaluated: the growth habit (1, erect; 2, semi-erect; 3, semi-spreading; 4, spreading; 5, prostrate) [26]; and plant height and first pod height (distance [cm] from ground to highest part of plant, and to first pod, respectively; average values from 3 plants, taken from the middle of the plot). Finally, yield and 1000-seed weight were also recorded.

2.4. Data Analysis

The passport information and phenotypic data collected in 2018 for the UNIVPM_Ca_ALL collection were used to select accessions to be included in UNIVPM_Ca_core1. The same data were used to compare the overall collection (UNIVPM_Ca_ALL) and the developed UNIVPM_Ca_core1. Geographic origin, market type (desi, kabuli), production traits (yield, 1000-seed weight) and flowering traits were compared across the two collections.
Phenotypic data collected during the 2019 field trial were used to analyze the phenotypic variation of the UNIVPM_Ca_core2 genotypes. Frequency distributions of all of the phenotypic traits were obtained. The narrow sense heritability (h2) was estimated according to Equation (2):
Y = μ + Gi + bk + εik
where Y is the observed phenotype, μ is the overall mean, G is the effect for the ith genotype, bk is the effect for the kth block, and ε is the plot error effect. Here, Gi was taken as random, so that the heritability was estimated from genotypic variance σ2g estimation.
Two types of multivariate analyses were carried out: (i) hierarchical cluster analysis (cluster distances calculated using Ward’s linkage method [27]), using means of flowering traits (days to first flower, days to full flowering, days to first pod expressed as GDD, duration of flowering); (ii) principal component analysis, with all of the phenotypic traits included.
Differences among clusters, growth habit classes, and desi/kabuli types were tested for production and architectural traits using one-way analysis of variance (ANOVA). Mean discrimination was performed, applying Student’s t-tests for independent samples, and statistical significance was set at p < 0.05. Correlations between phenotypic traits were investigated according to the Pearson r coefficient.
A scatter plot for average yield and 1000-seed weight was constructed and Sultano, Pascià, Maragià, Reale, and Ituchi cultivars were highlighted as controls.
Correlated responses were calculated for the 426 genotypes belonging to UNIVPM_Ca_core1 using the data for the production traits (yield, 1000-seed weight) recorded for the 2018 and 2019 growing seasons. Best-fit linear relationships were computed for both of these traits. The regression coefficient r was used as an estimate of the narrow sense heritability for each trait [28].
The statistical package JMP, version 8 (SAS Institute Inc., Cary, NC, USA) was used for the data analysis.

3. Results

3.1. UNIVPM_Ca_ALL versus UNIVPM_Ca_core1

On the basis of the passport data and the phenotypic evaluation carried out during the 2018 field trial for the 1931 chickpea accessions (UNIVPM_Ca_ALL collection), 426 accessions were selected to be included in the UNIVPM_Ca_core1, which was aimed to capture most of the variability in the entire collection, and at the same time to be suitable as a panel to be used for breeding to develop varieties adapted to the Mediterranean environment (Figure 1). The passport data and phenotypic data recorded in the 2018 field trial of the 426 accessions of the UNIVPM_Ca_core1 were compared to those of the whole collection (UNIVPM_Ca_ALL).
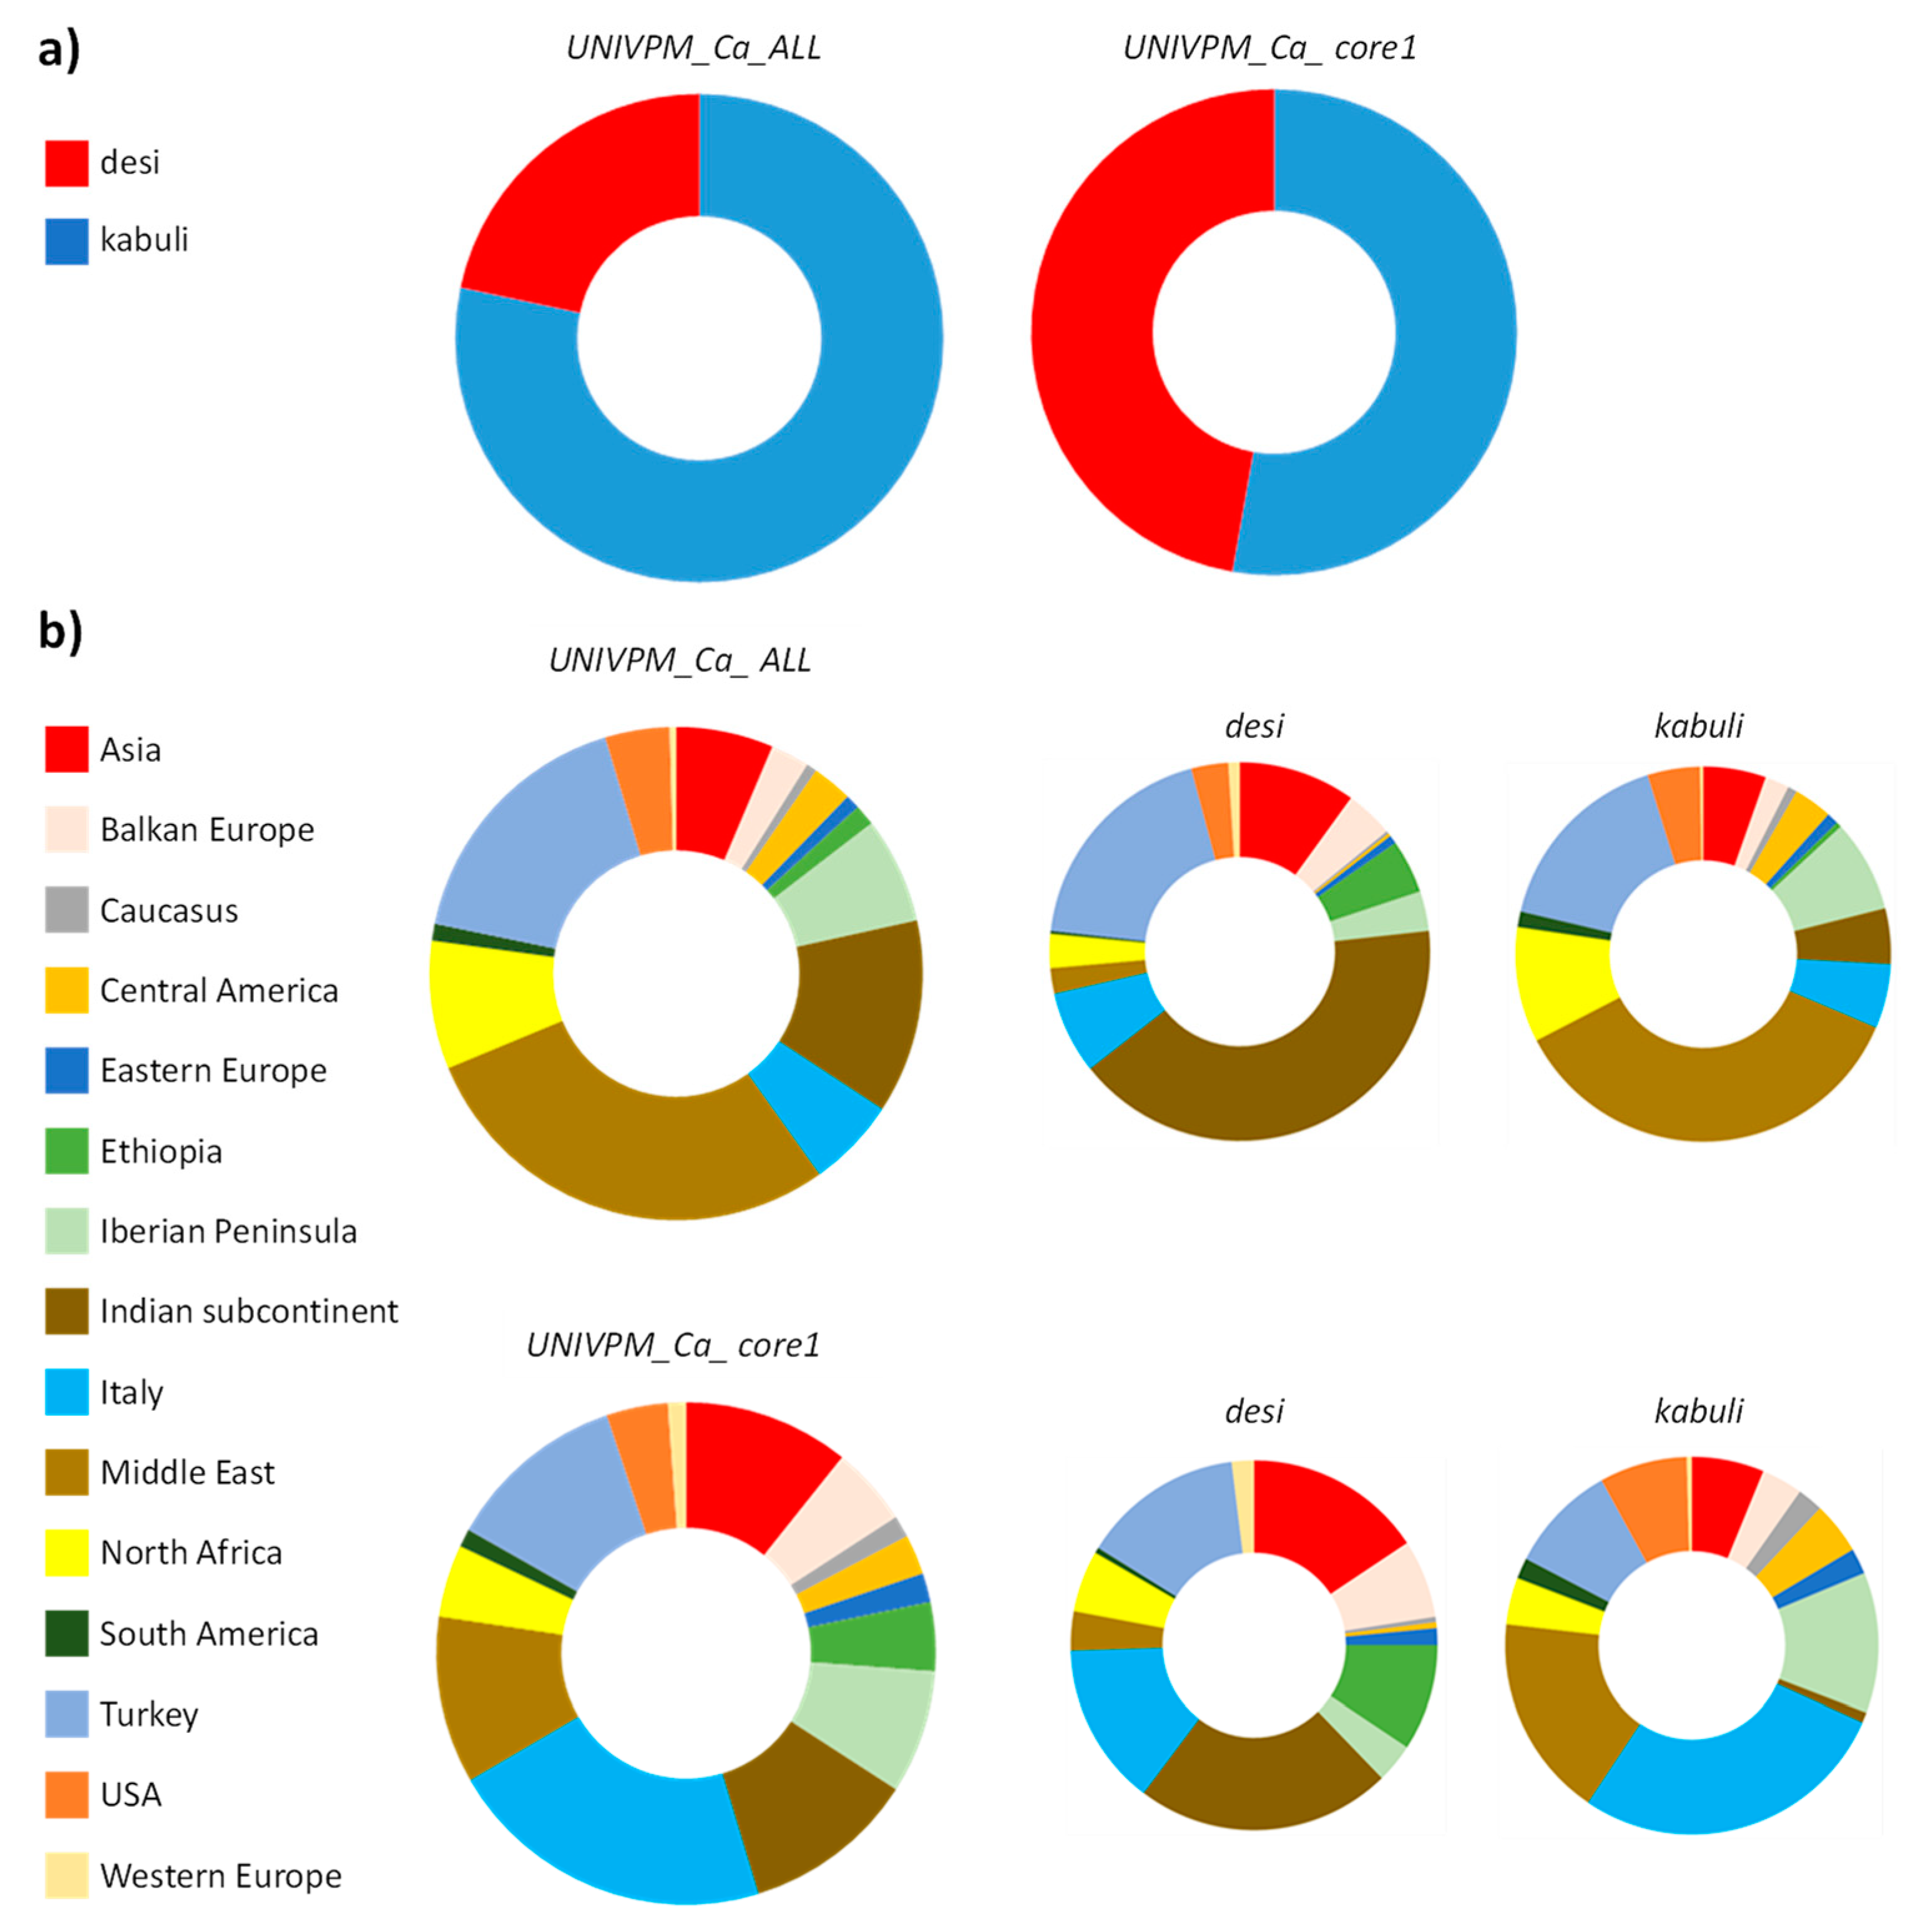
The UNIVPM_Ca_core1 accessions were selected to balance the desi and kabuli types (47.2% and 52.8%, respectively; Figure 2a). Information on the country of origin was available for 1901 and 422 of the 1931 and 426 accessions of UNIVPM_Ca_ALL and UNIVPM_Ca_core1, respectively. The UNIVPM_Ca_core1 accessions were selected to be representative of the geographic distribution of the entire UNIVPM_Ca_ALL collection. UNIVPM_Ca_ALL included accessions from 47 countries that can be grouped in 15 geographic areas; all of these countries and geographic areas were represented in the UNIVPM_Ca_core1 (Figure 2b). The numbers of accessions for each country of origin and for each geographic area for both of these collections are reported in Table 1. The proportions of the accessions for the desi and kabuli types for each geographic area for the UNIVPM_Ca_ALL and UNIVPM_Ca_core1 collections are reported in Table 2. Compared to UNIVPM_Ca_ALL, UNIVPM_Ca_core1 included a greater proportion of accessions from Italy (5.8% vs. 21.6%) and a lower proportion of accessions from the Middle East (28.5% vs. 10.9%). The greater proportion of Italian accessions in the UNIVPM_Ca_core1 was because the selection took into account the inclusion of local germplasm as potentially more adapted to the Italian environment. The lower proportion of accessions from the Middle East was because 98.3% of the accessions in UNIVPM_Ca_ALL were the kabuli type, and thus this was necessary to balance the desi and kabuli types in the UNIVPM_Ca_core1.
Further criteria for the selection of accessions to be included in UNIVPM_Ca_core1 were production traits: 234 accessions of UNIVPM_Ca_ALL were included in UNIVPM_Ca_core1 according to their high yield (>150 g) and 1000-seed weight (>450 g). This selection was based on the choice to include genotypes that would be adapted as much as possible to the Mediterranean environment. The accessions from the 2018 field trials were grouped into classes of yield. For each yield class, the number of accessions and the related frequencies for the UNIVPM_Ca_ALL and UNIVPM_Ca_core1 collections are reported in Table 3. The same procedure was carried out for 1000-seed weight (Table 4). As expected, considering the main criteria used for the selection of the UNIVPM_Ca_core1 panel, it included greater proportions of the yield class of >150 g, especially 151–200 g yield class, and the 1000-seed class of >400 g.
Table 5 shows the data for the comparison between UNIVPM_Ca_ALL and UNIVPM_Ca_core1 for the flowering traits. The effect of the selection was for a slightly greater proportion of early flowering accessions in UNIVPM_Ca_core1. The frequency distributions of the phenotypic traits from the 2018 field trial for UNIVPM_Ca_ALL and UNIVPM_Ca_core1 are shown in Supplementary Figure S1.

3.2. UNIVPM_Ca_core2 Phenotypic Evaluation

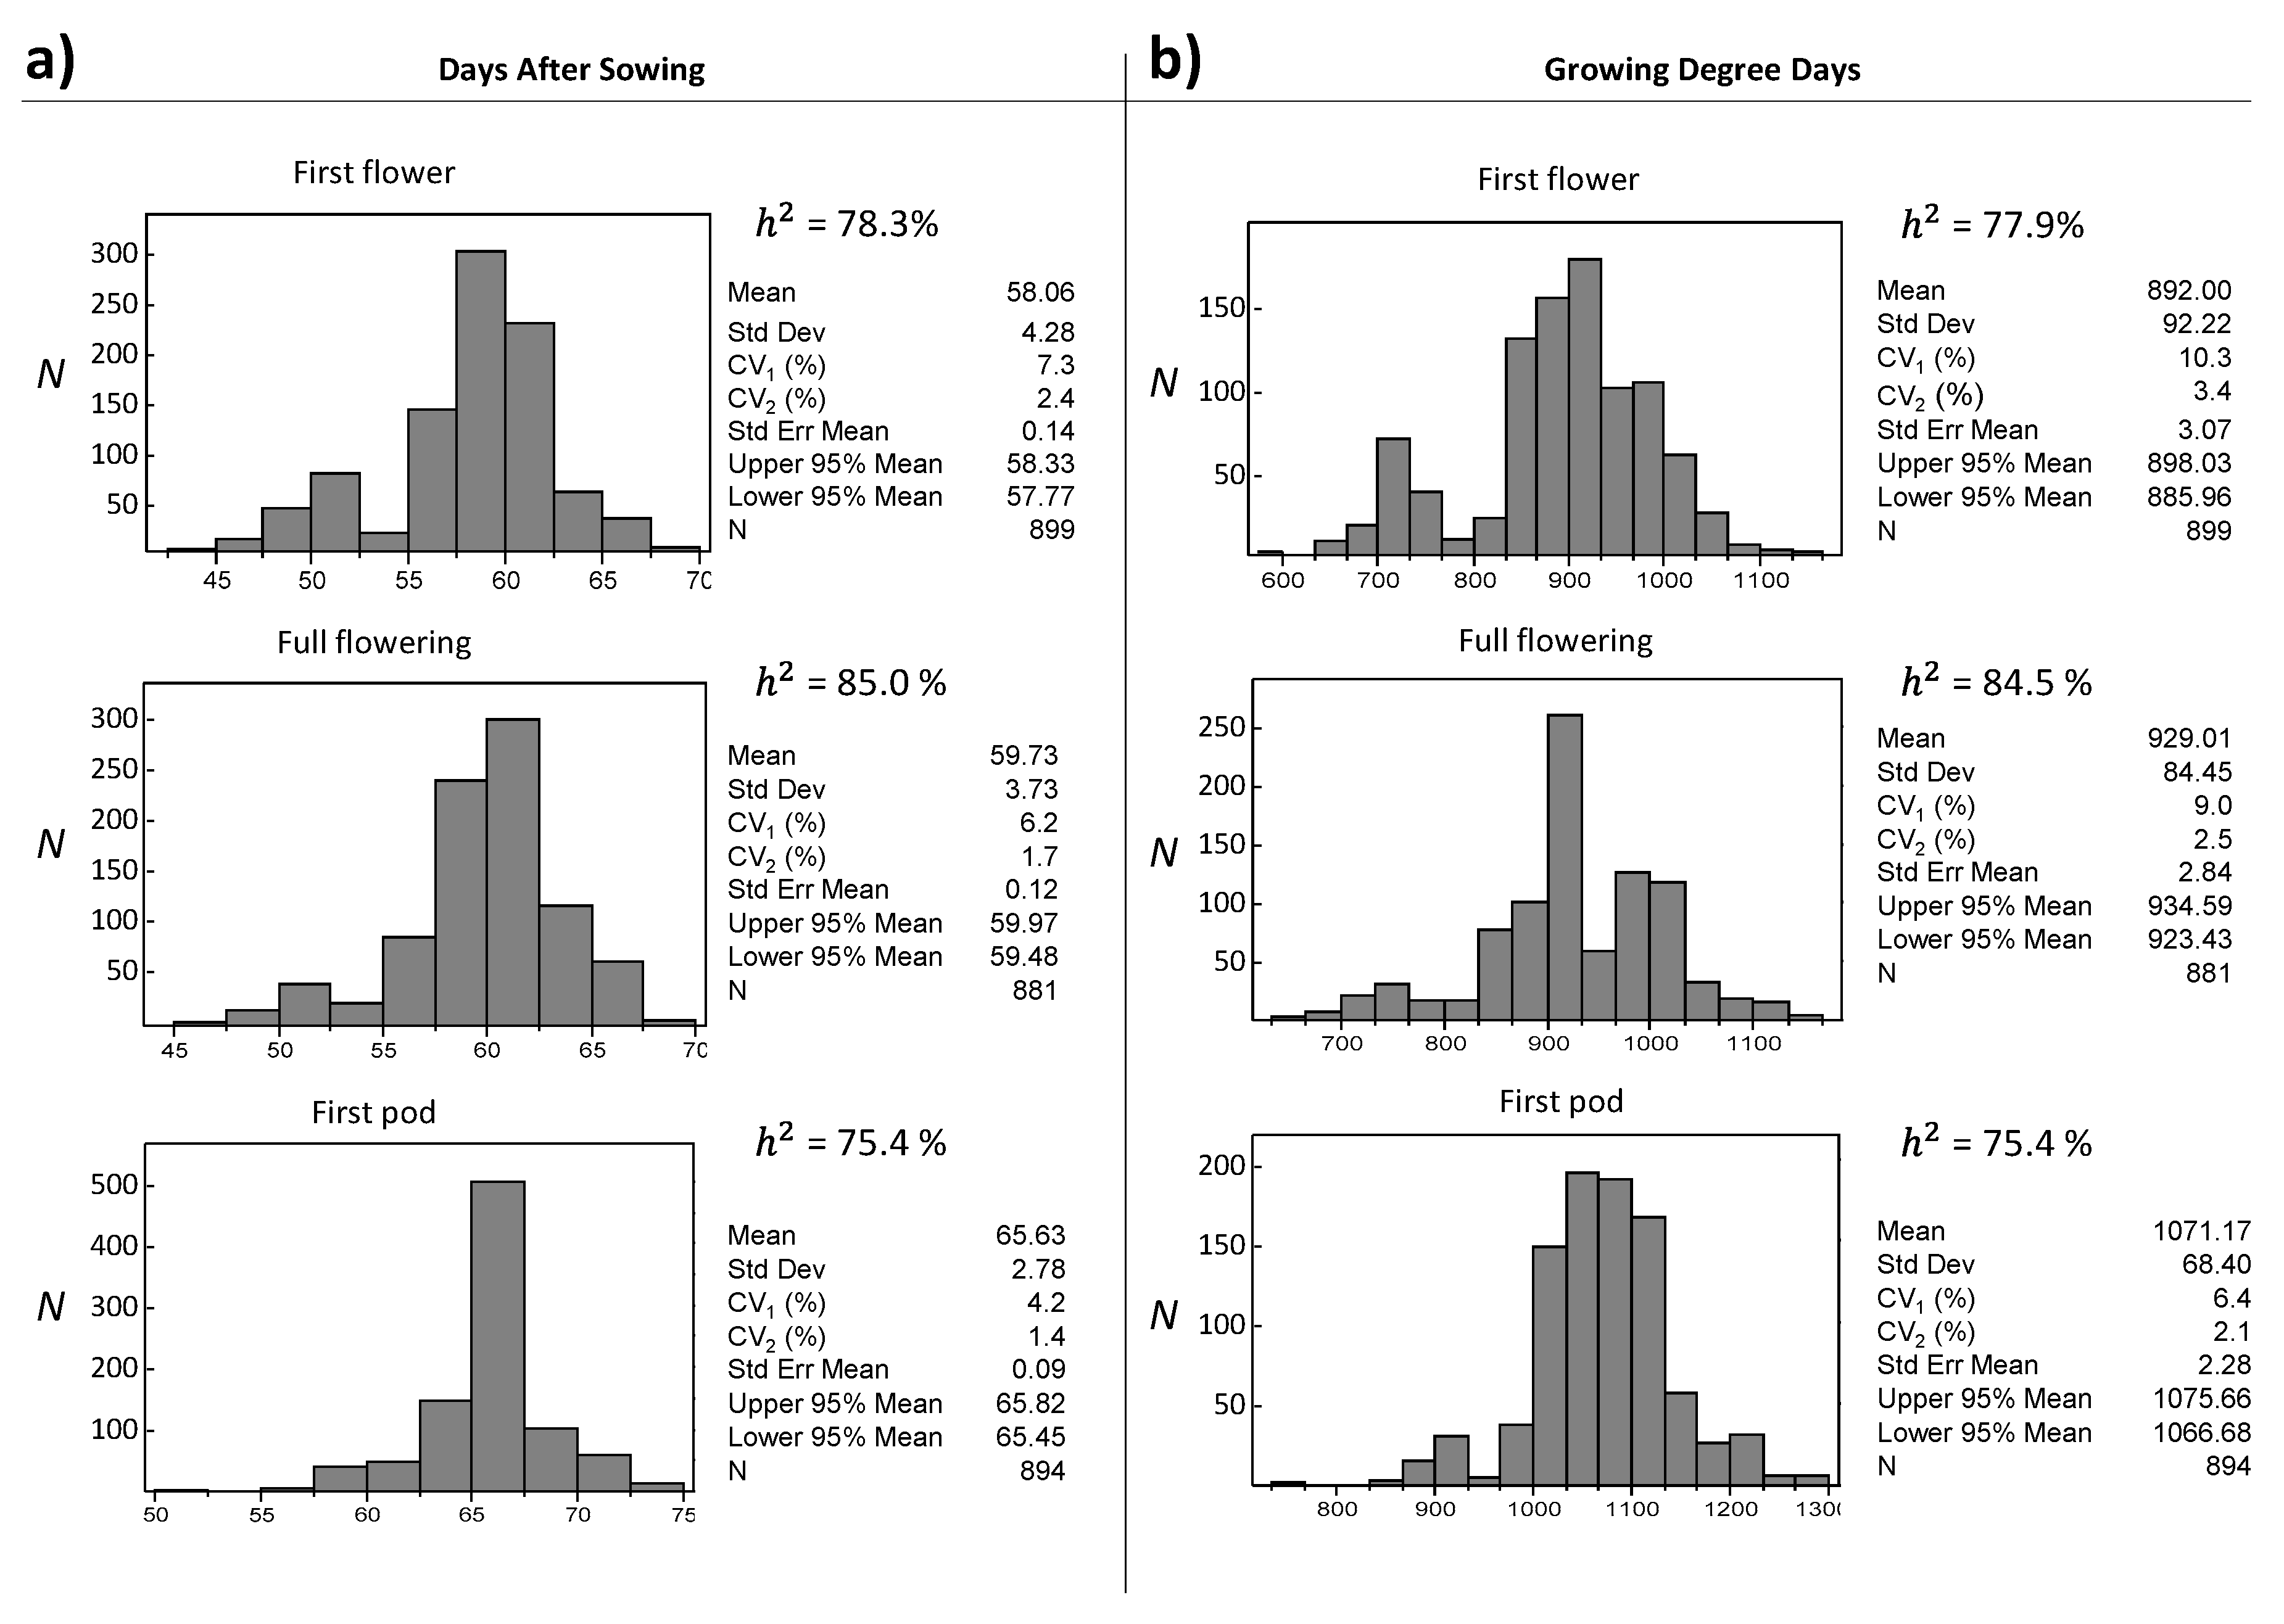
In 2019, a second field trial was carried out for the UNIVPM_Ca_core2 panel, which included the UNIVPM_Ca_core1 lines and a further 54 lines, as ICARDA breeding lines and Italian cultivars and landraces, for a total of 480 lines (42.7% and 57.3% of desi and kabuli types, respectively). Figure 3 shows the frequency distributions within UNIVPM_Ca_core2 for the different flowering traits of days to first flower, days to full flowering, and days to first pod, along with their estimated heritability (h2). Wide variation was observed for all of the flowering traits for UNIVPM_Ca_core2. Days to first flower and to full flowering ranged from 43 to 69 DAS and from 45 to 69 DAS, respectively, while days to setting ranged from 51 to 74 DAS. The same trends (high range of variation, high heritability estimates) were seen for the flowering traits expressed as GDD; in particular, GDD for first flower and full flowering ranged from 599 to 1153.0 and from 635 to 1153, respectively. GDD for first pod varied from 740 to 1277. All of the flowering traits showed high heritabilities as both DAS and GDD (h2 ≥ 75.4%).
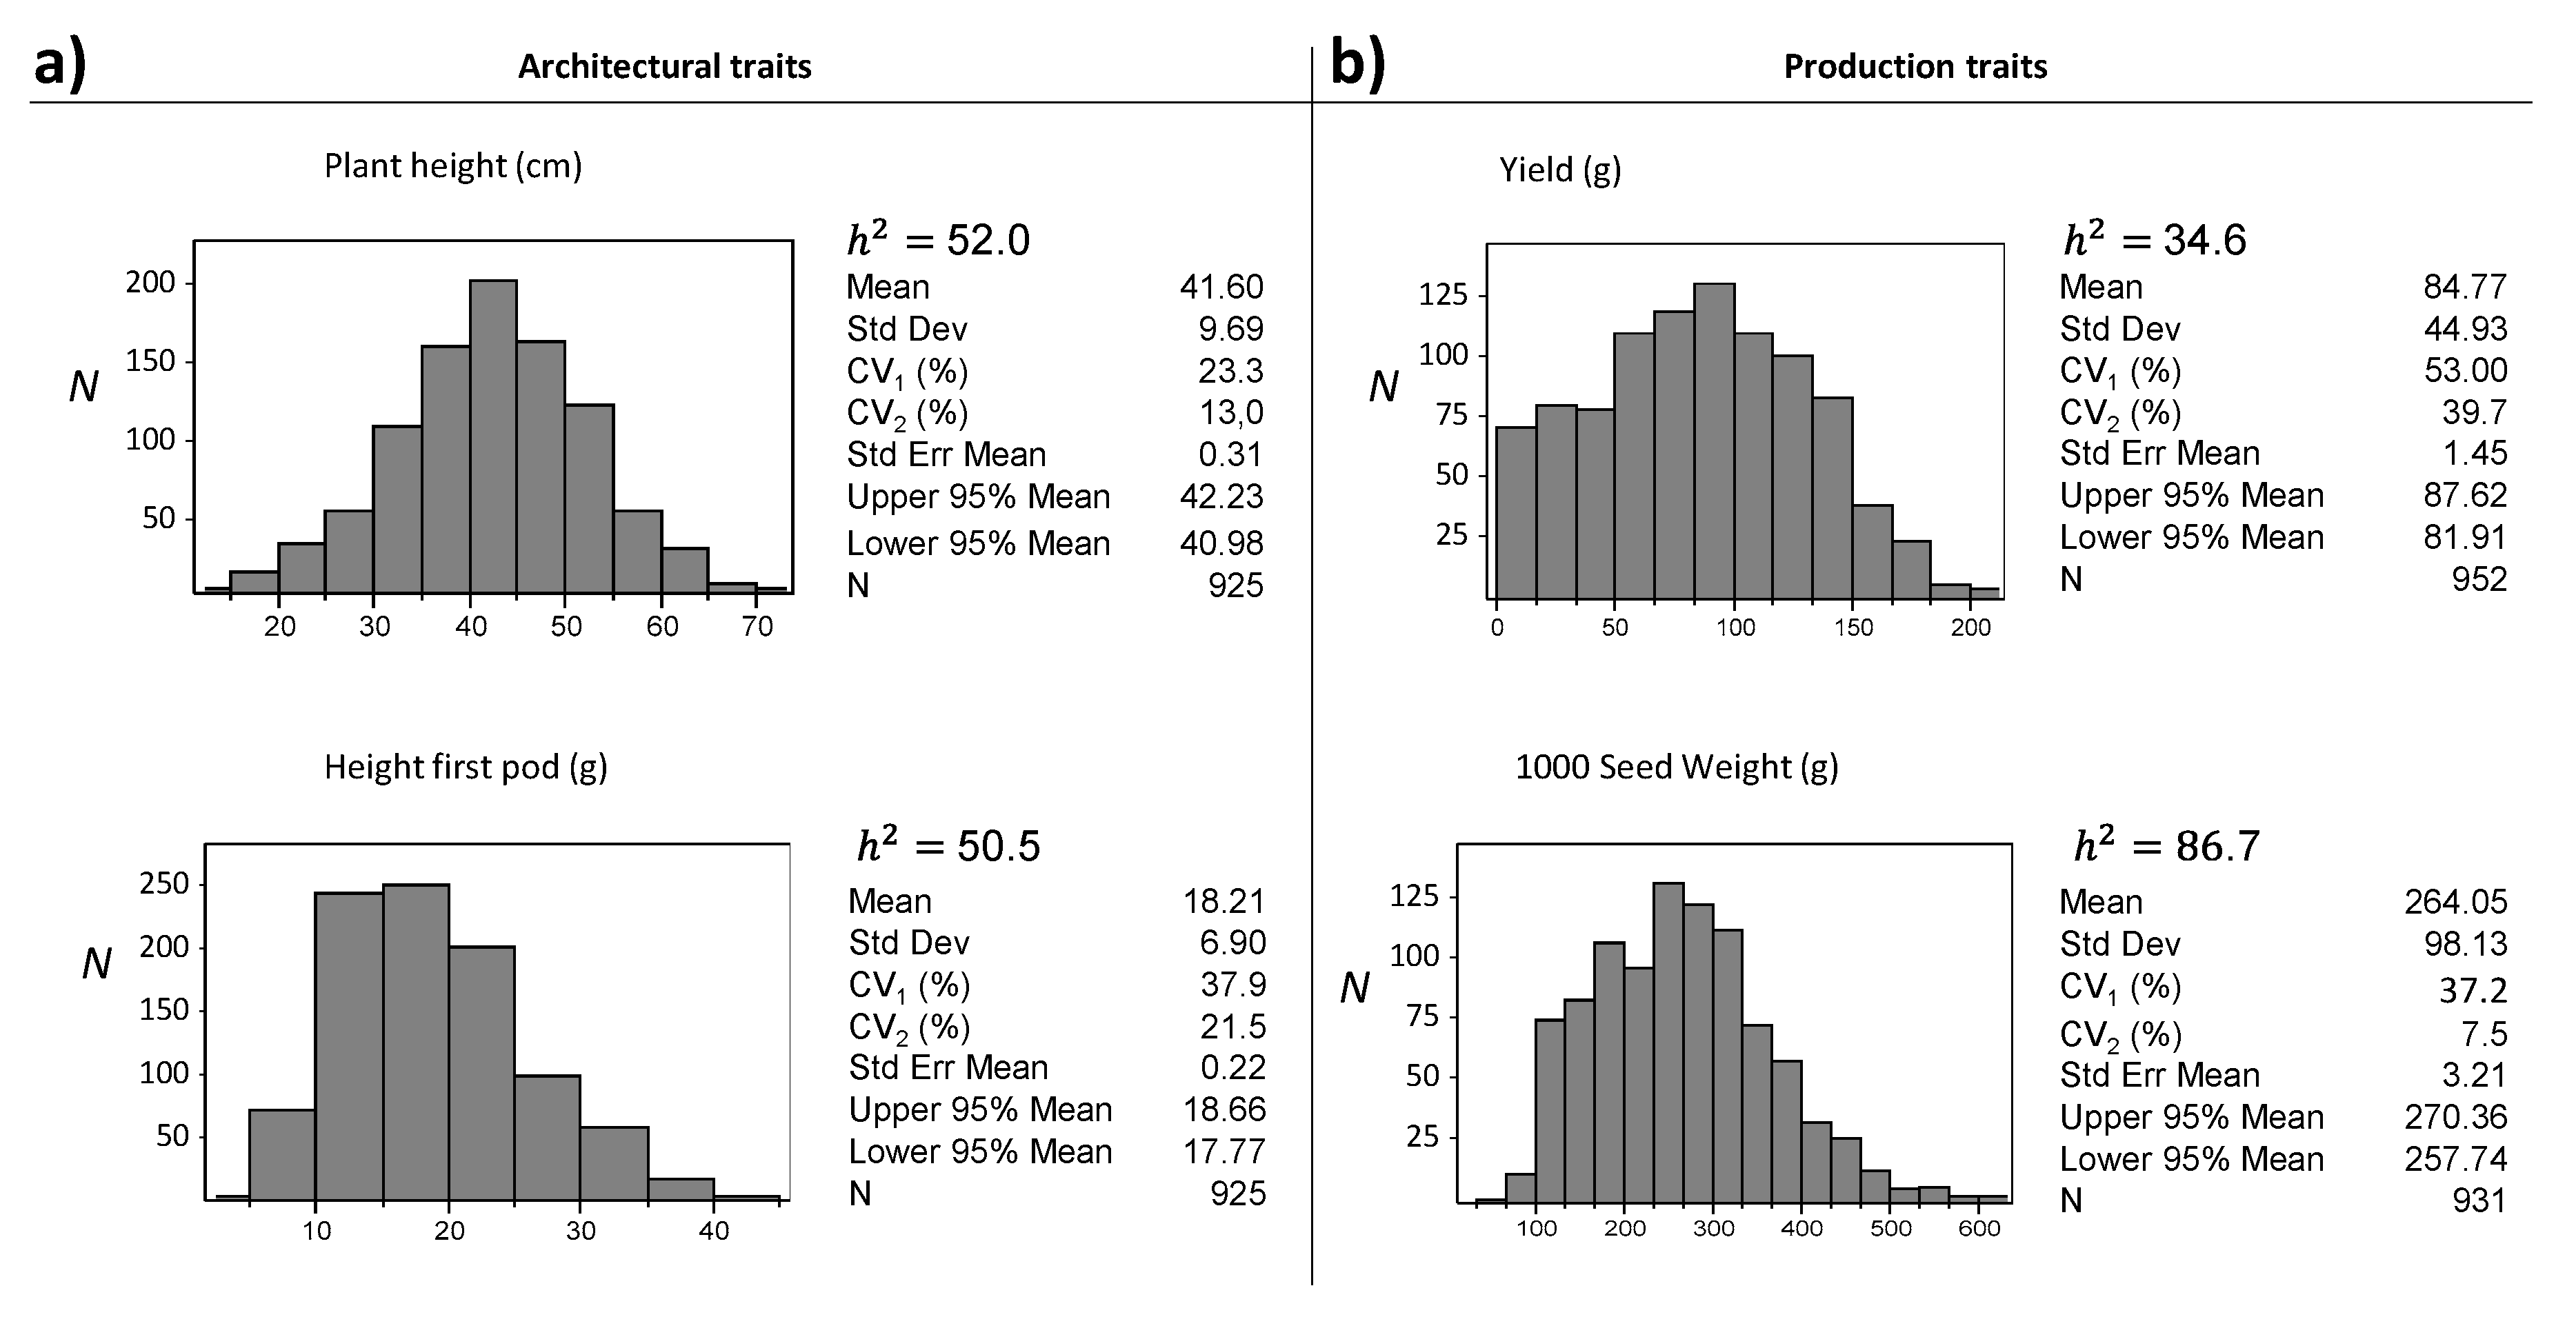
The frequency distributions and the related heritabilities of UNIVPM_Ca_core2 for the architectural (plant height, height of first pod) and production (yield, 1000-seed weight) traits are shown in Figure 4. Both architectural traits showed wide variation: plant height ranged from 10 cm to 70 cm, and height of first pod from 5 cm to 45 cm. Their heritability estimates were 52.0% and 50.5%, respectively. The yield varied across the different UNIVPM_Ca_core2 lines, with a range from 10 to 210 g, and a low heritability estimate (h2 = 34.6%). The 1000-seed weight also showed a wide range, from 42 to 610 g, although in contrast to yield, the 1000-seed weight showed a high heritability estimate (h2 = 86.7%).
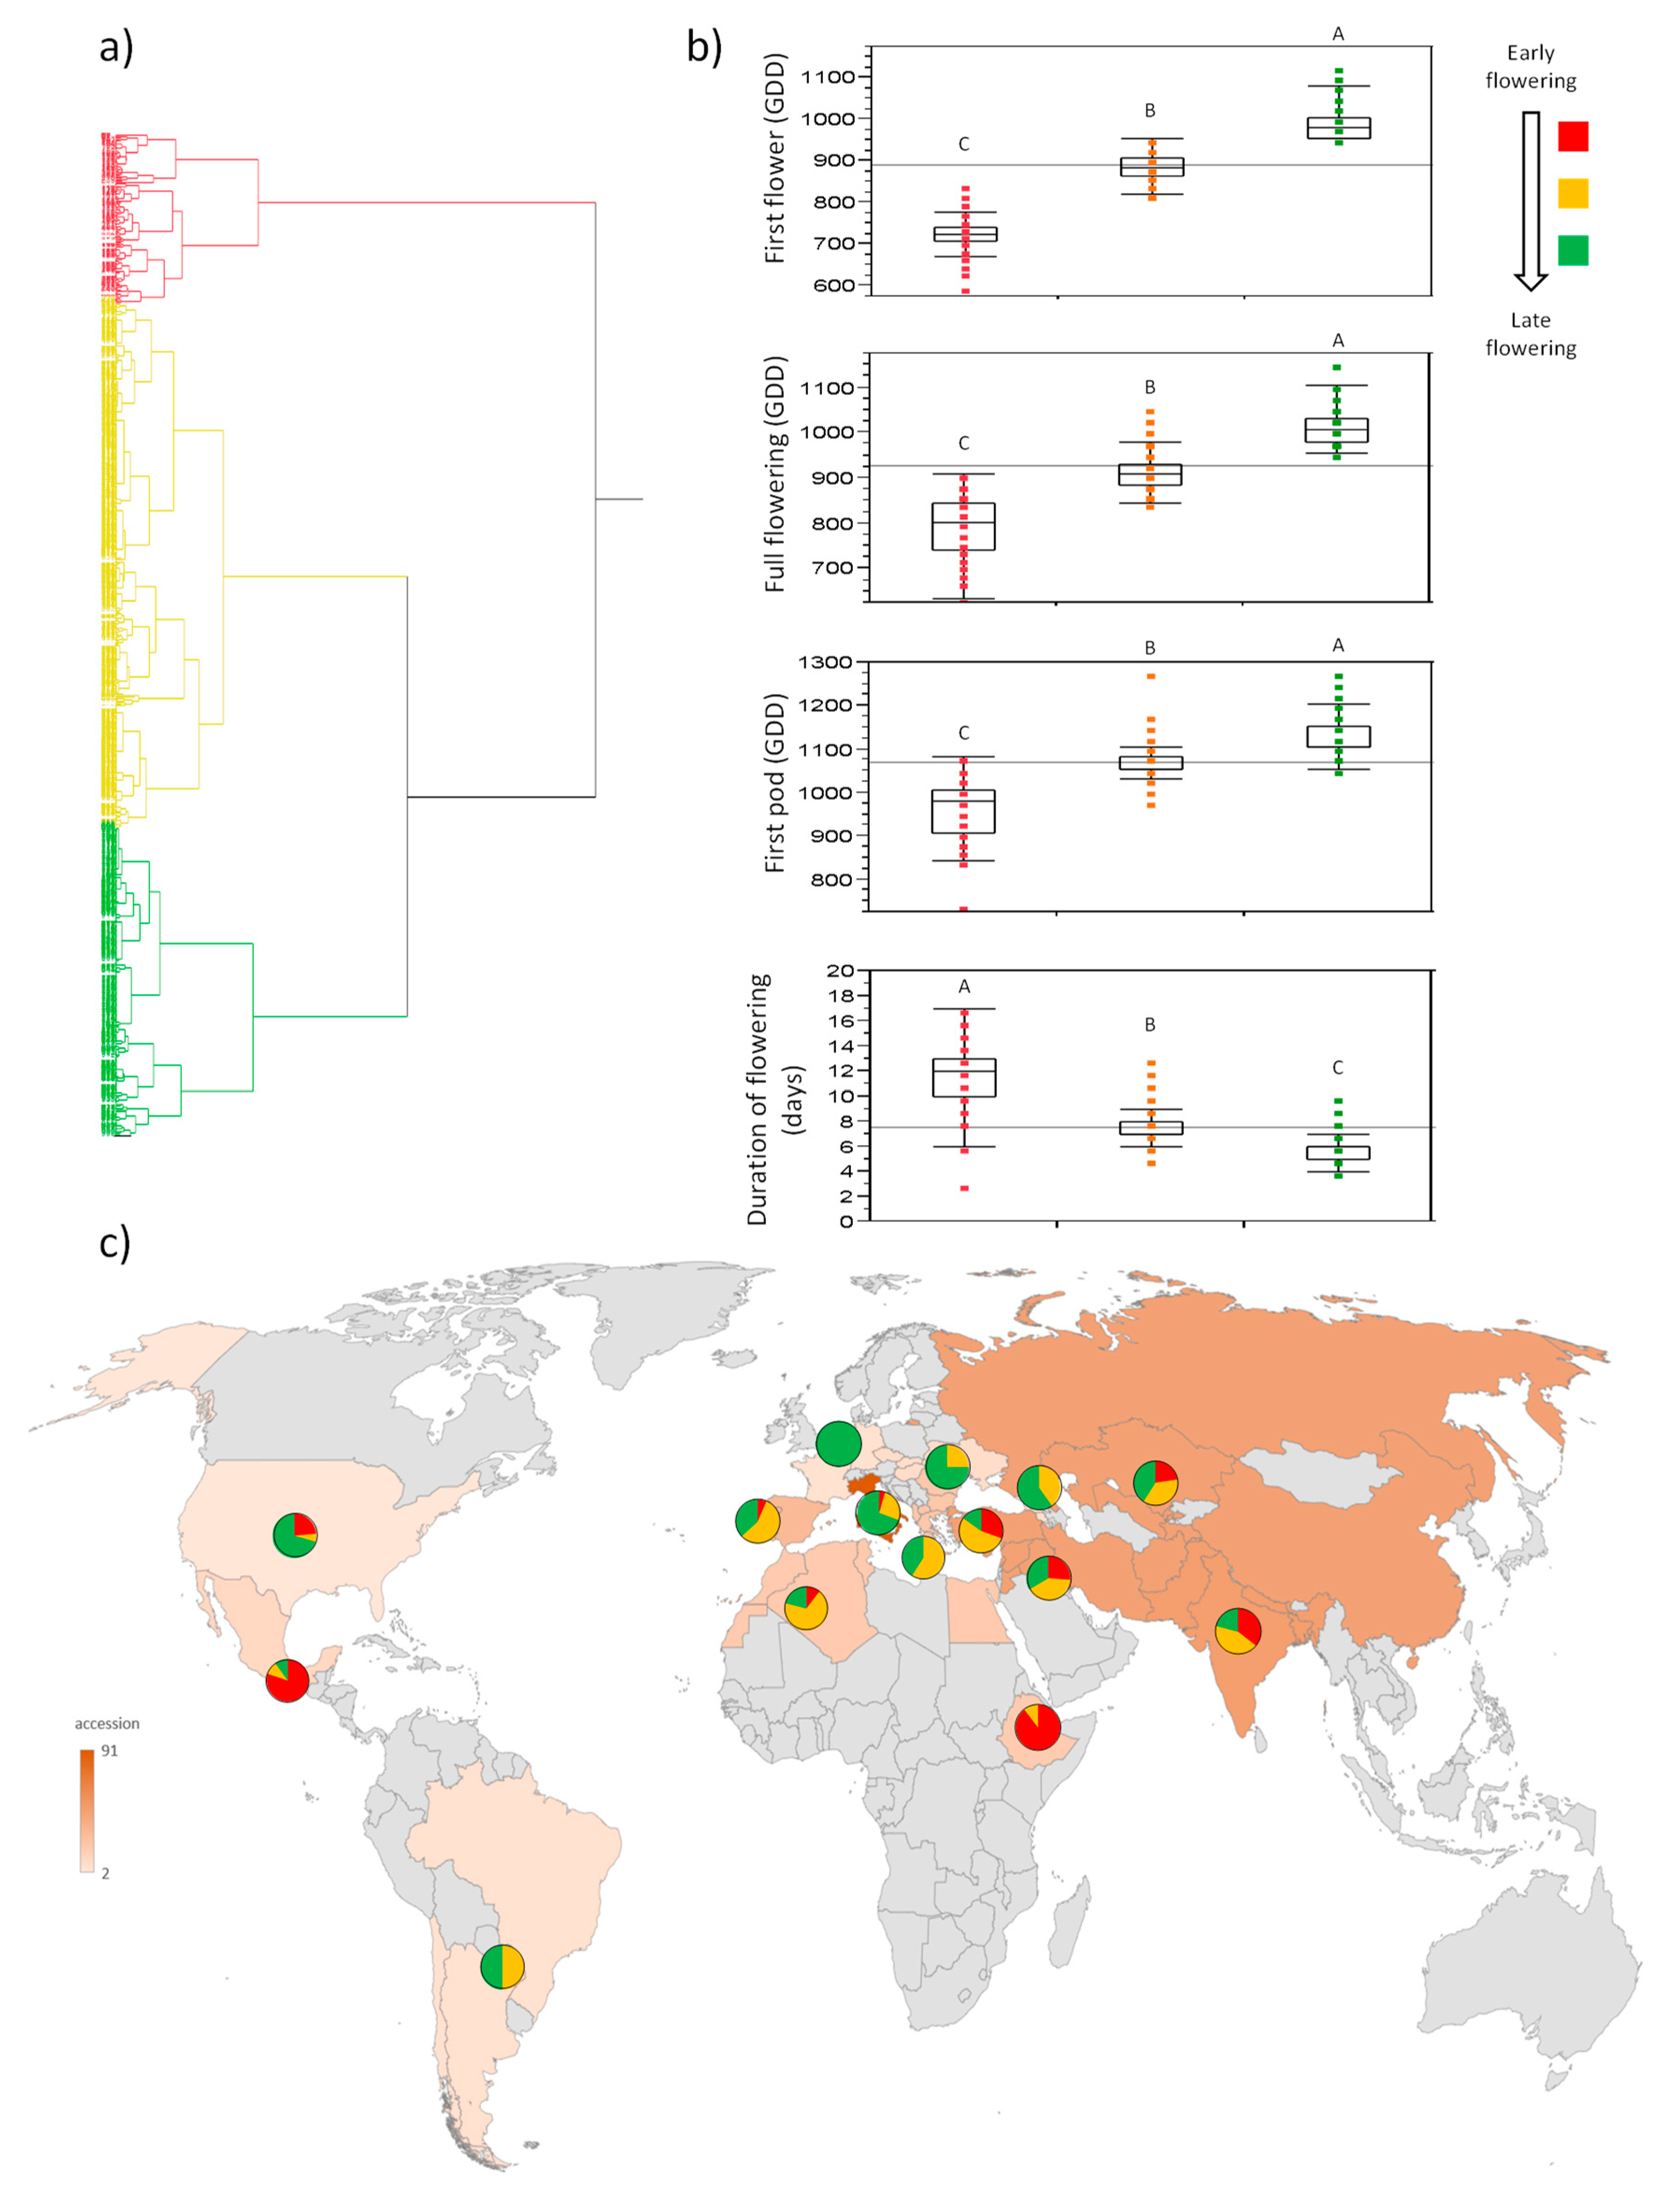
The hierarchical cluster analysis (Ward method) based on the flowering traits (days to first flower, days to full flowering, days to first pod, duration of flowering) grouped the lines of UNIVPM_Ca_core2 into three clusters (Figure 5a). These clusters are highlighted in red, yellow, and green in Figure 5a,b, as the early, intermediate, and late-flowering lines, respectively. An interesting observation was that the duration of flowering trait showed an opposite trend to the other flowering traits, with early lines showing longer duration of flowering than the late-flowering genotypes (Figure 5b).
Figure 5c shows the geographic distribution of the three different clusters identified on the basis of the flowering traits (Figure 5a). The Middle East and Turkey had accessions from all of the three groups, with similar proportions. A similar trend was observed in the Asia and Indian subcontinent geographic areas. Moving toward lower latitudes, such as in Ethiopia and in Central America, a predominance of early flowering lines was observed (Figure 5c, red). In moving toward the Mediterranean environment (i.e., Italy, Balkans Europe, Iberian Peninsula, North Africa), the proportion of early flowering genotypes strongly decreased, with a correspondingly greater proportion of intermediate and late-flowering genotypes (especially in Italy). This trend was observed in western and eastern Europe, with mainly late-flowering genotypes prevalent at higher latitudes, and no early flowering genotypes. Similarly, in South America, where there were only intermediate and late-flowering genotypes.
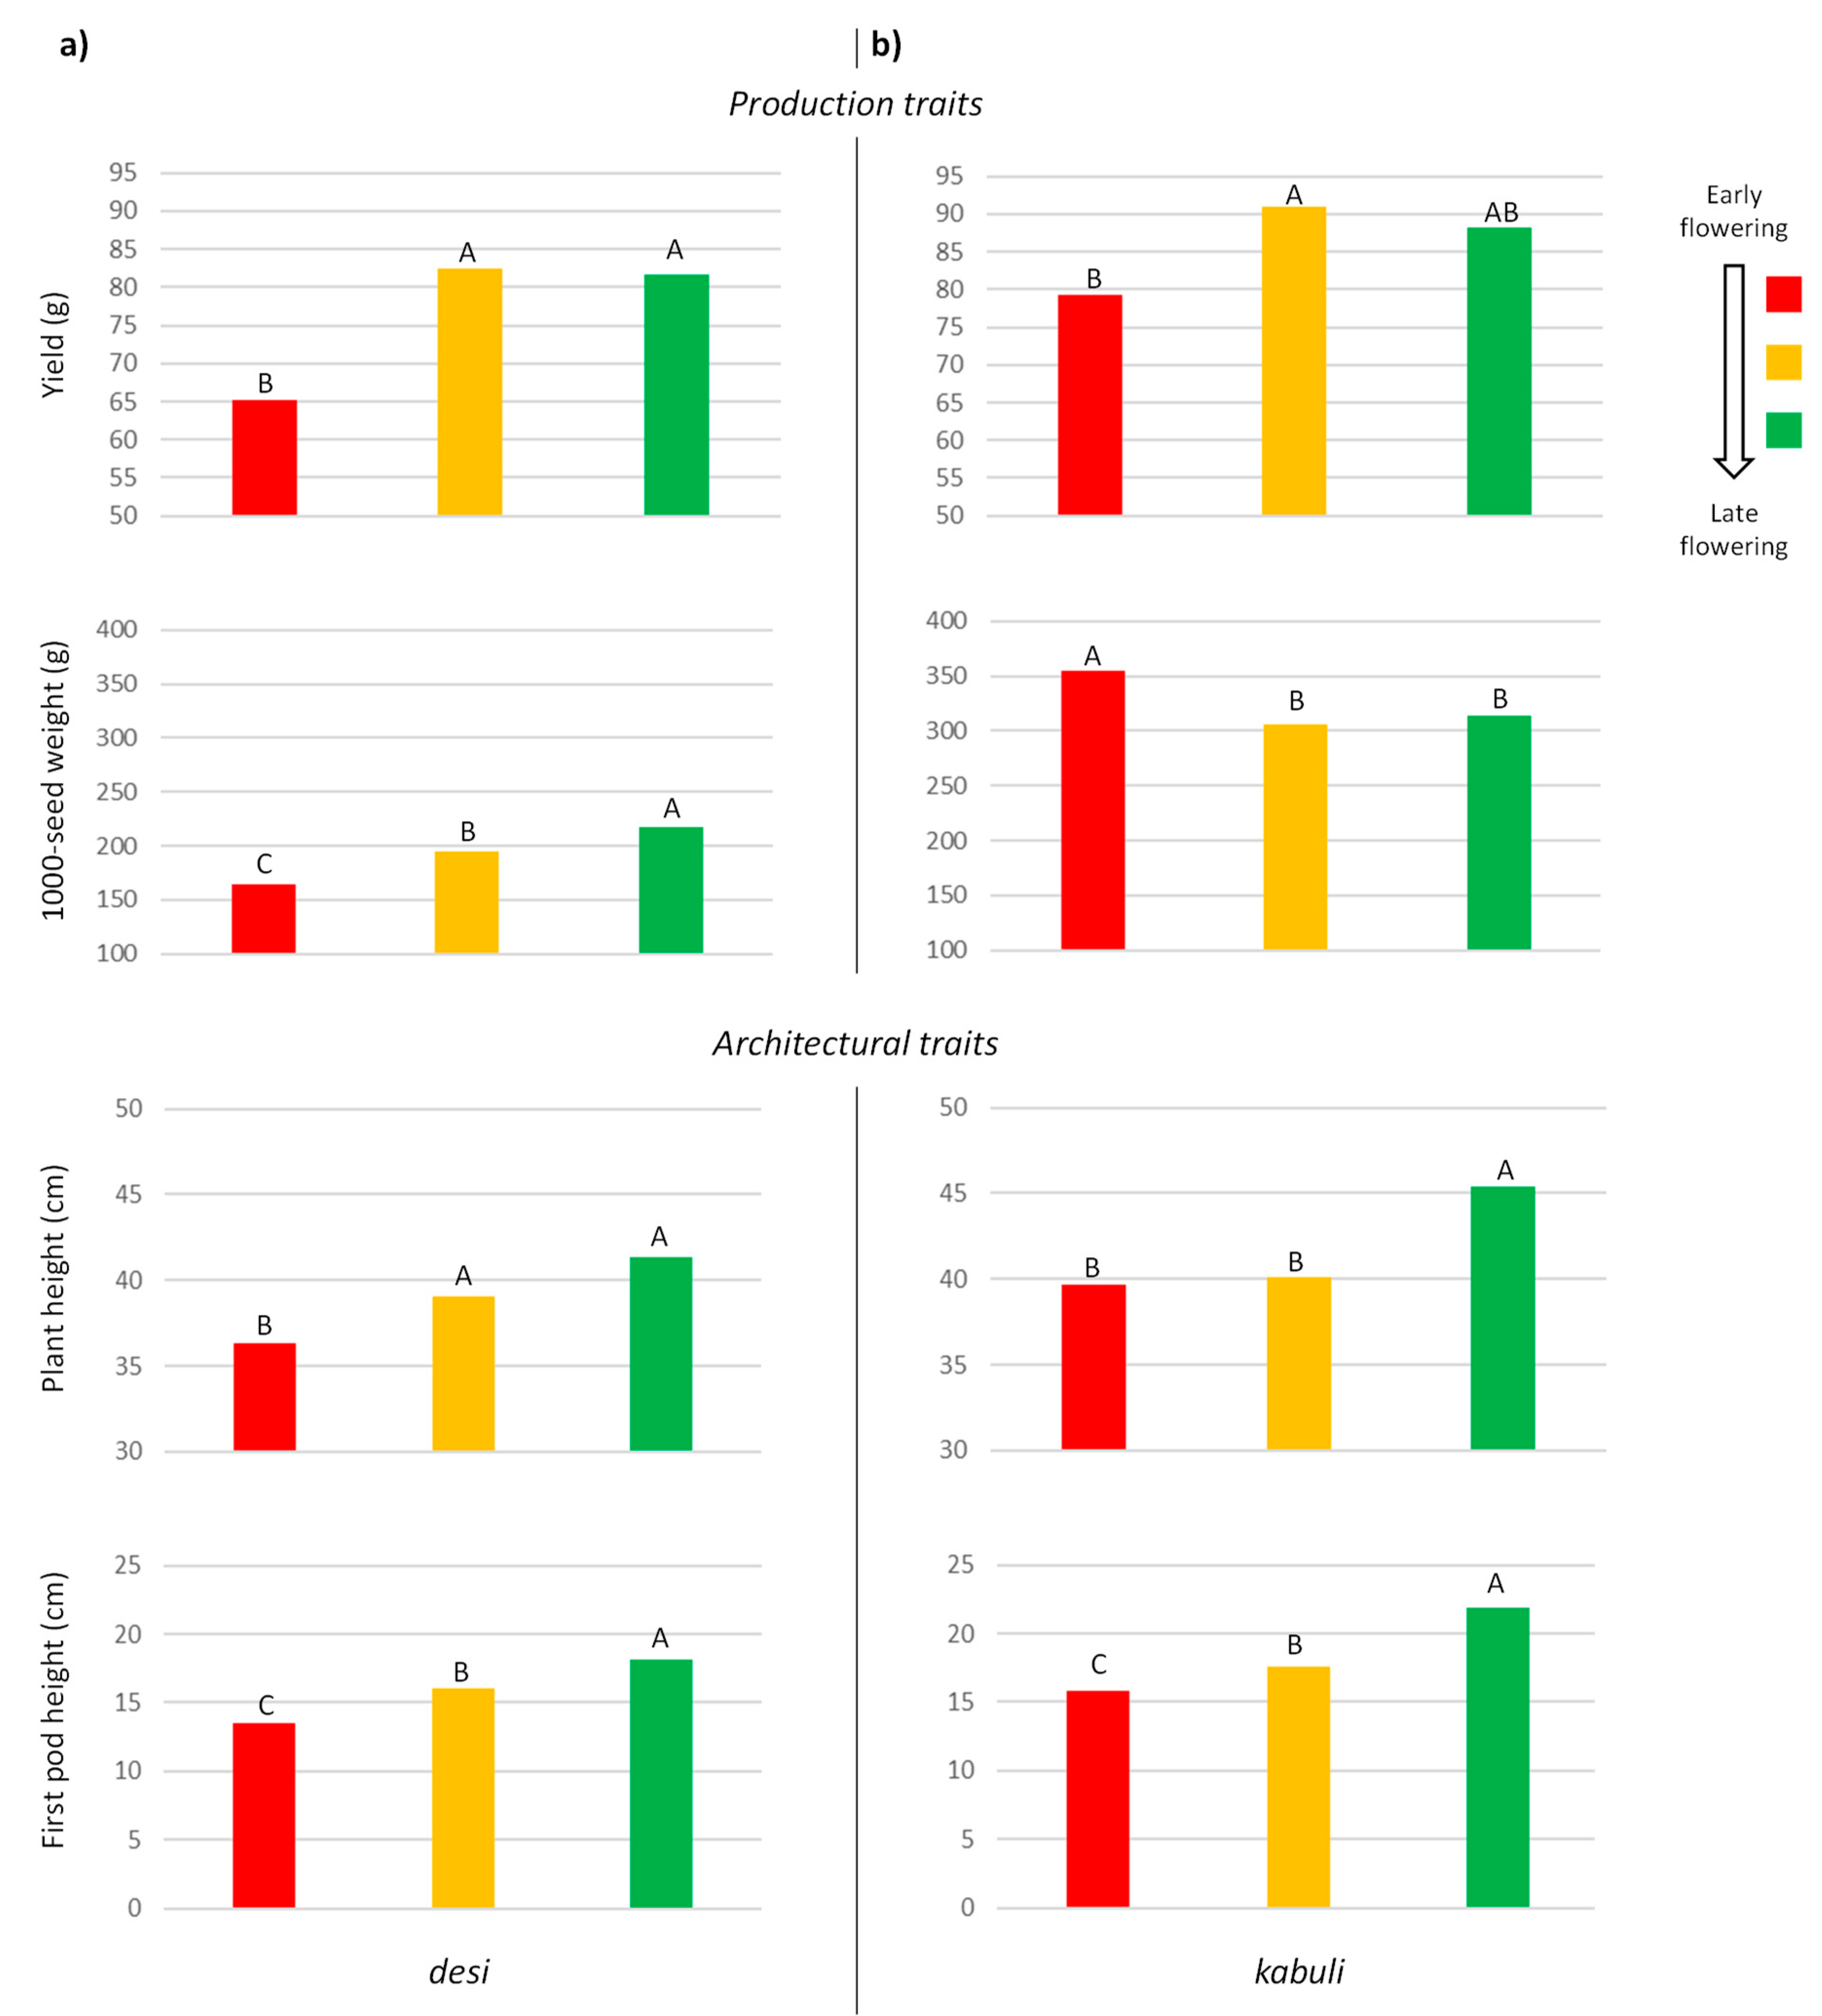
One-way ANOVA was carried out separately for the desi and kabuli types to determine whether there were significant differences in production and architectural traits among the flowering groups (Figure 6). Significant higher yields were obtained for the intermediate and late-flowering genotypes for both the desi and kabuli types, while a different pattern was seen for 1000-seed weight. Indeed, the 1000-seed weight was significantly lower in the early genotypes compared to the intermediate and late-flowering genotypes for desi, while for kabuli an opposite trend was seen (1000-seed weight was higher in the early compared to intermediate and late genotypes). The late-flowering genotypes had significantly higher plant heights and first pod heights compared to the early genotypes for both desi and kabuli.
Considering the growth habit of these plants, for the desi genotype, all five different growth habits were identified, while no prostrate plants were seen among the kabuli genotypes. Significant differences were detected among the different growth habit types for both desi and kabuli. Generally they both showed decreasing trends from erect to spreading growth habits for days to first flower, days to full flowering, and days to first pod; thus, the early flowering genotypes were mainly characterized by a spreading habit (Figure 7). These trends were more consistent for the kabuli genotypes. The duration of flowering showed a small reverse tendency across these data, whereby the spreading growth showed significantly longer duration of flowering than the erect growth for both desi and kabuli (Figure 7).
Considering the yields, while for the desi types the differences across the growth habits were not particularly marked (although significantly lower for the prostrate genotype), the erect kabuli genotypes provided significantly lower yields compared to all of the other growth habit classes (Figure 7). For the 1000-seed weights, the trends in the data were similar, with the desi genotypes semi-erect class here significantly greater, while the kabuli erect genotypes were characterized by significantly lower 1000-seed weight compared to the other growth genotypes (Figure 7).
Table 6 gives the one-way ANOVA results of the comparison between the desi and kabuli genotypes for the flowering, architectural and production traits, where these two types were significantly different for all of the traits considered. Compared to desi, the kabuli types showed higher values for all of the traits, with the exception of duration of flowering; overall, desi genotypes were significantly earlier in flowering, smaller for plant height and height of first pod, and less productive compared to kabuli genotypes.
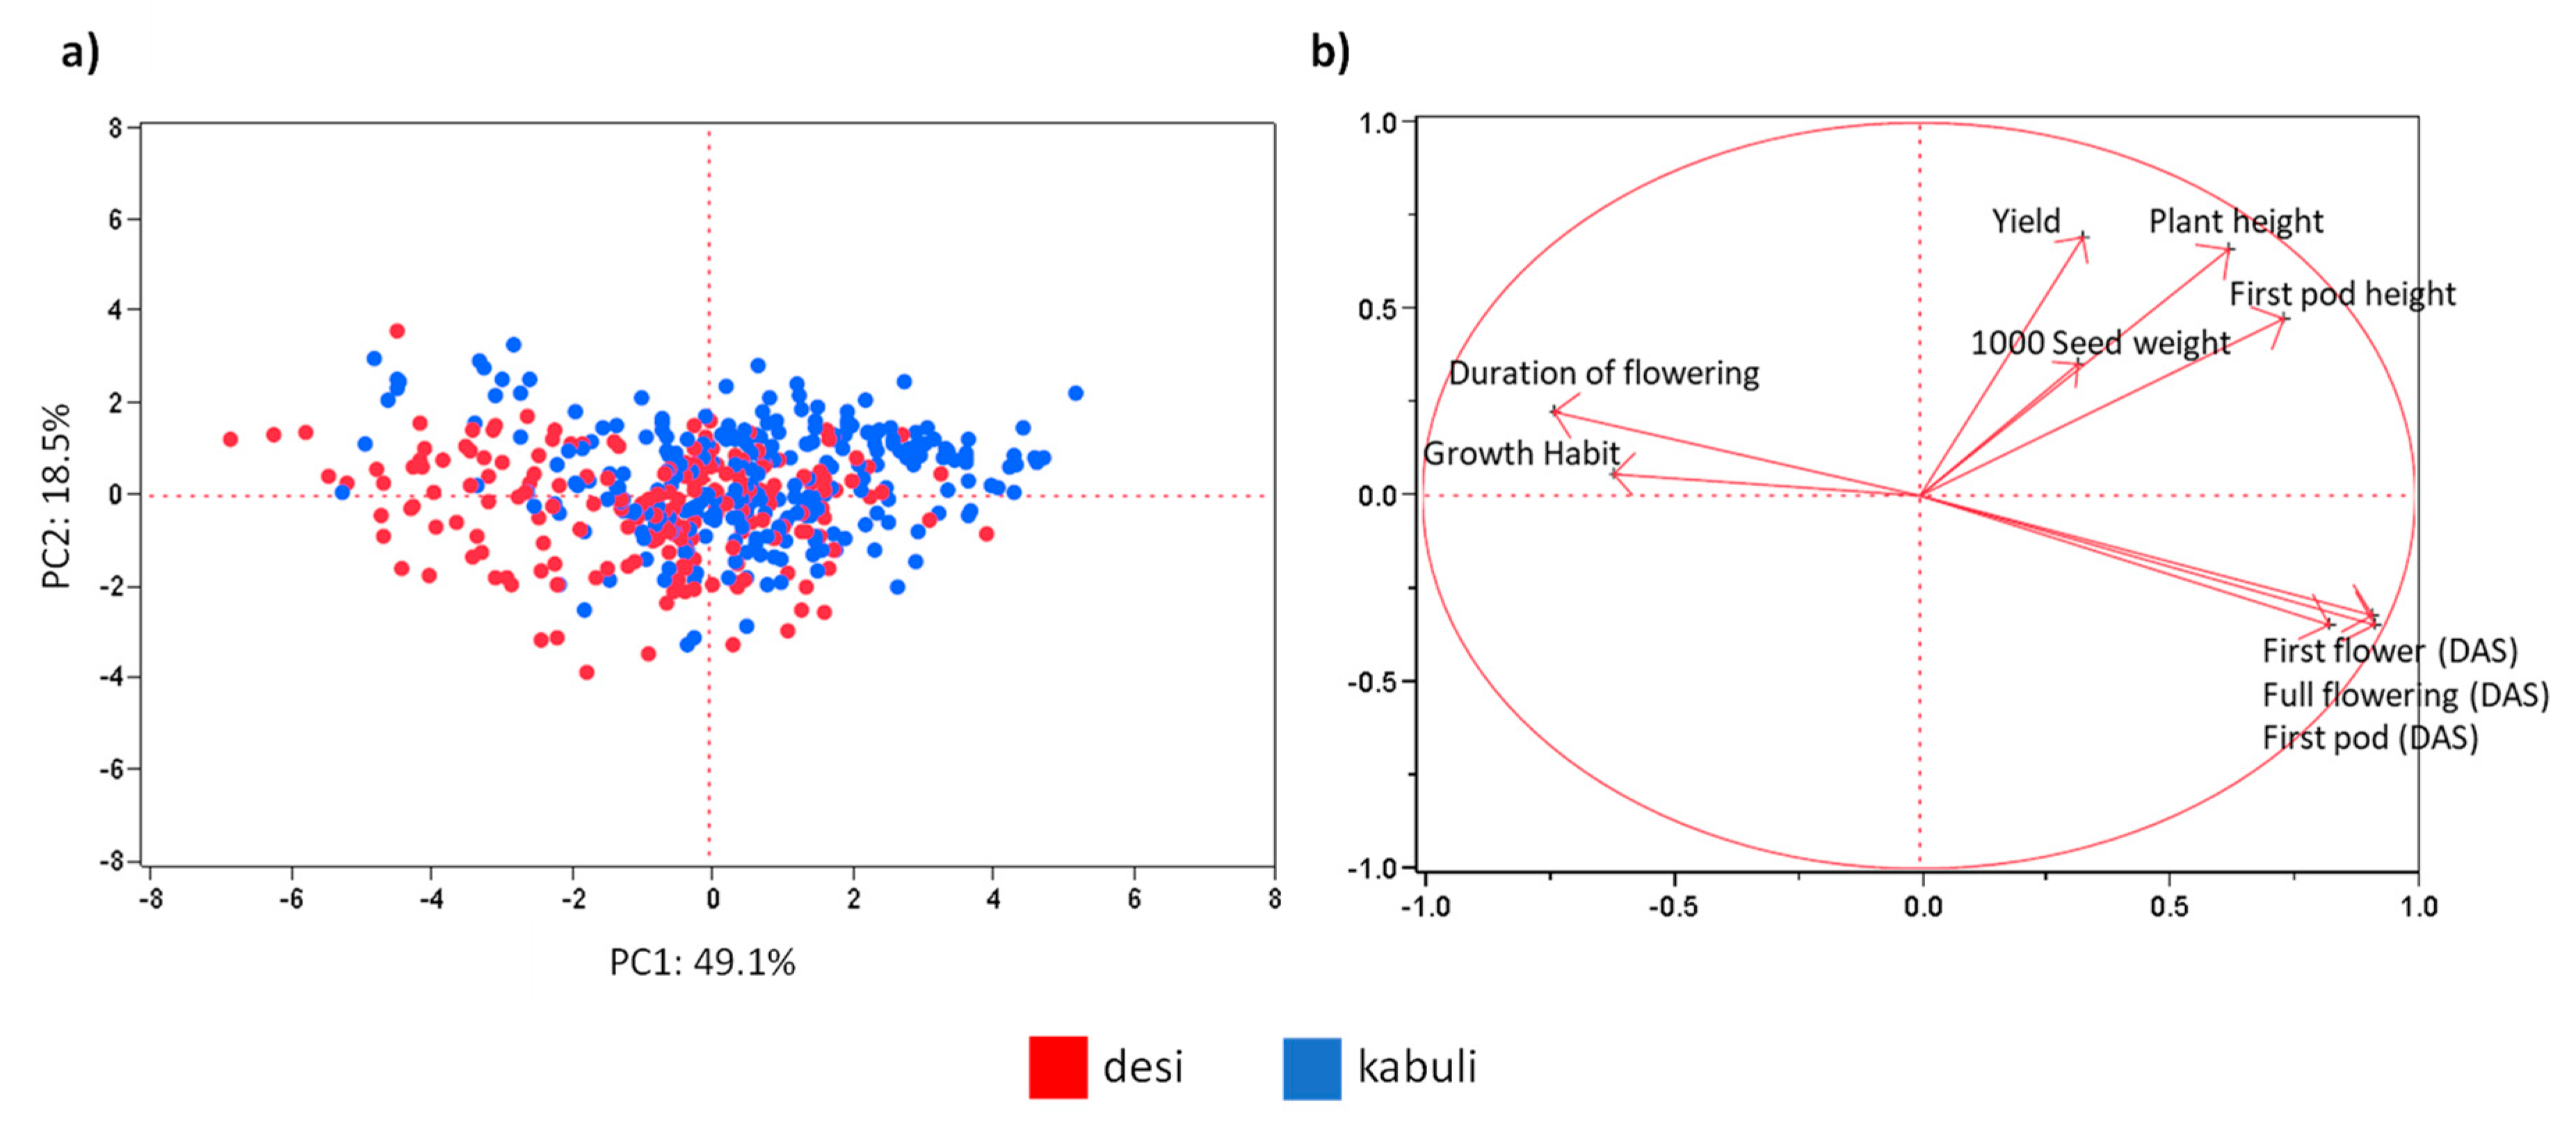
Principal component analysis was performed to determine which phenotypic traits define the basis of the differentiation among the genotypes of the UNIVPM_Ca_core2 panel (Figure 8). Principal component 1 (PC1) and principal component 2 (PC2) explained 49.1% and 18.5% of the total variance, respectively.
PC1 significantly and positively correlated (r > 0.5) with the flowering traits of days to first flower, days to full flowering, and days to first pod, and the architectural traits of plant height and first pod height. PC1 negatively correlated (r < −0.5) with growth habit and duration of flowering. Significant negative correlation was seen between the growth habits and flowering traits, with correlation coefficients of −0.47, −0.48 and −0.5 for first flower, full flowering, and first pod, respectively (Supplementary Figure S3); thus the erect plants were late-flowering, and vice versa (Figure 8). PC2 significantly and positively correlated (r > 0.5) with yield and plant height. No clear separation was seen between the desi and kabuli types in the principal component analysis (Figure 8a). However, it was possible to note a small difference in the distributions of these genotypes in the principal component analysis that was consistent with the comparisons with ANOVA (Table 6). These indicated that the kabuli genotype was more late-flowering and had higher values for architectural and production traits.
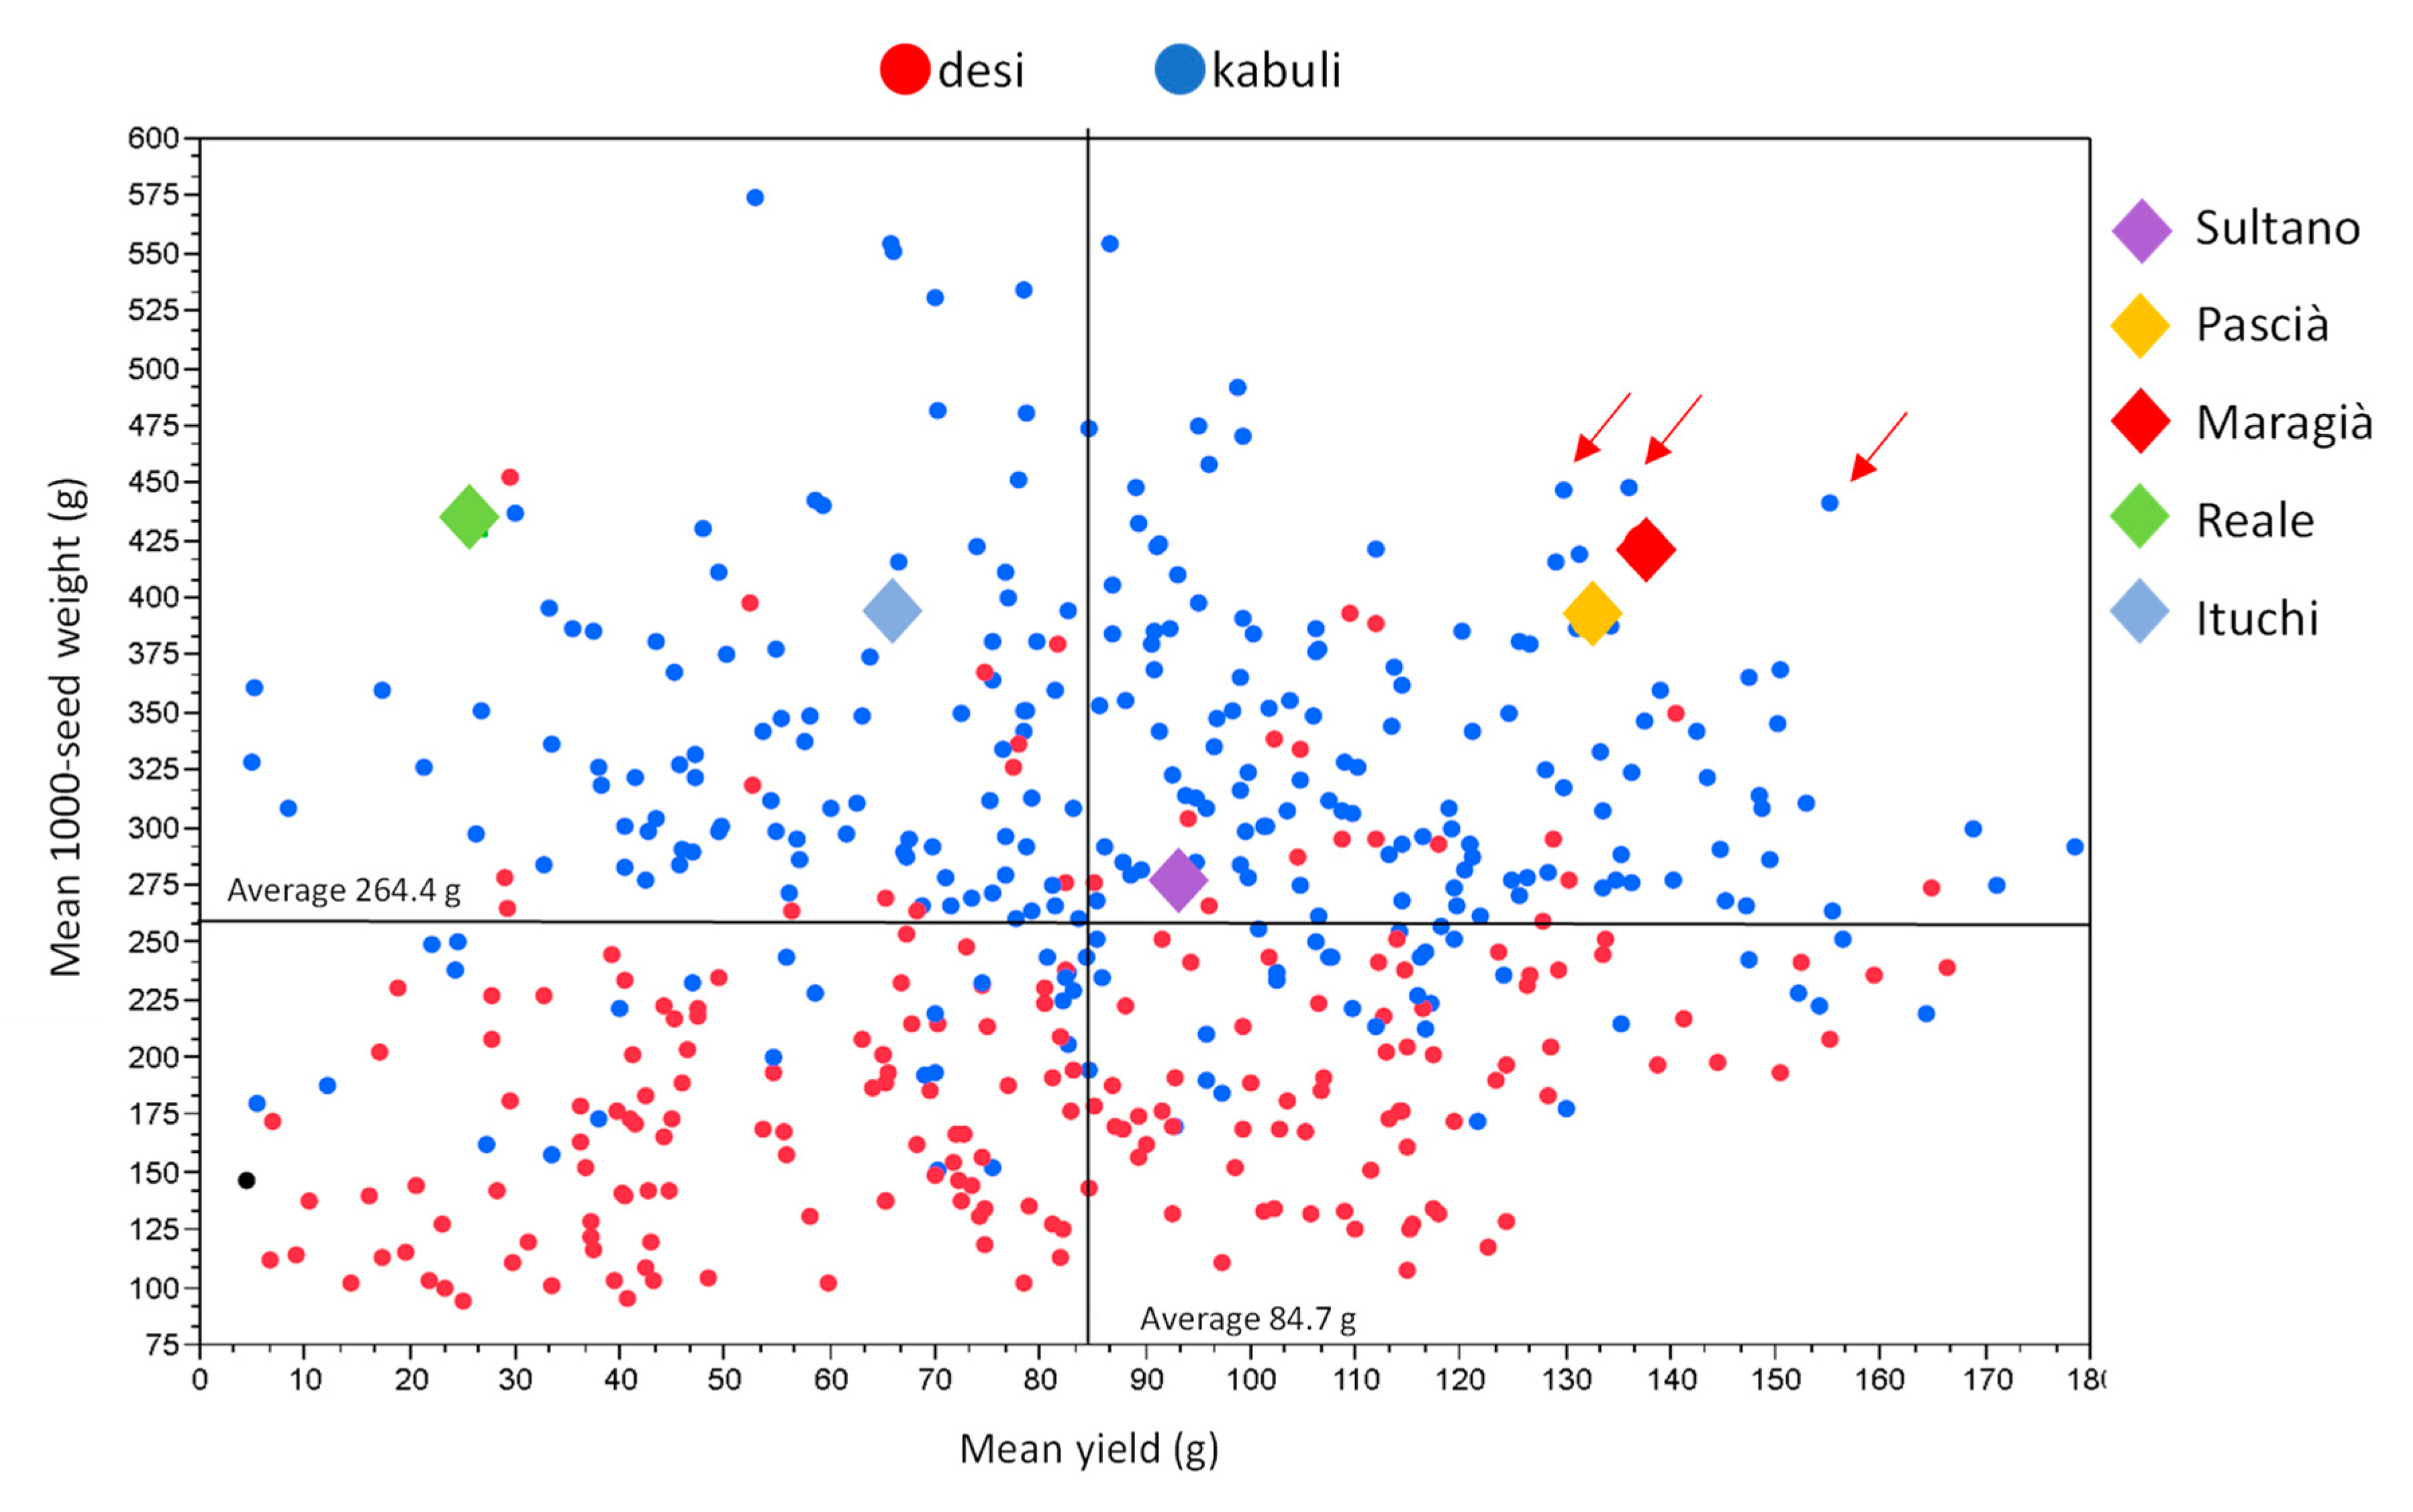
To focus on the production traits, a scatter plot was constructed for yield and 1000-seed weight using the mean values for each genotype for each trait (Figure 9). Here, it was possible to identify several genotypes with yields and/or 1000-seed weights that were greater than those of six elite varieties used as controls, which is certainly of interest for plant breeding.

3.3. UNIVPM_Ca_core1: Comparison of the 2018 and 2019 Phenotypic Data

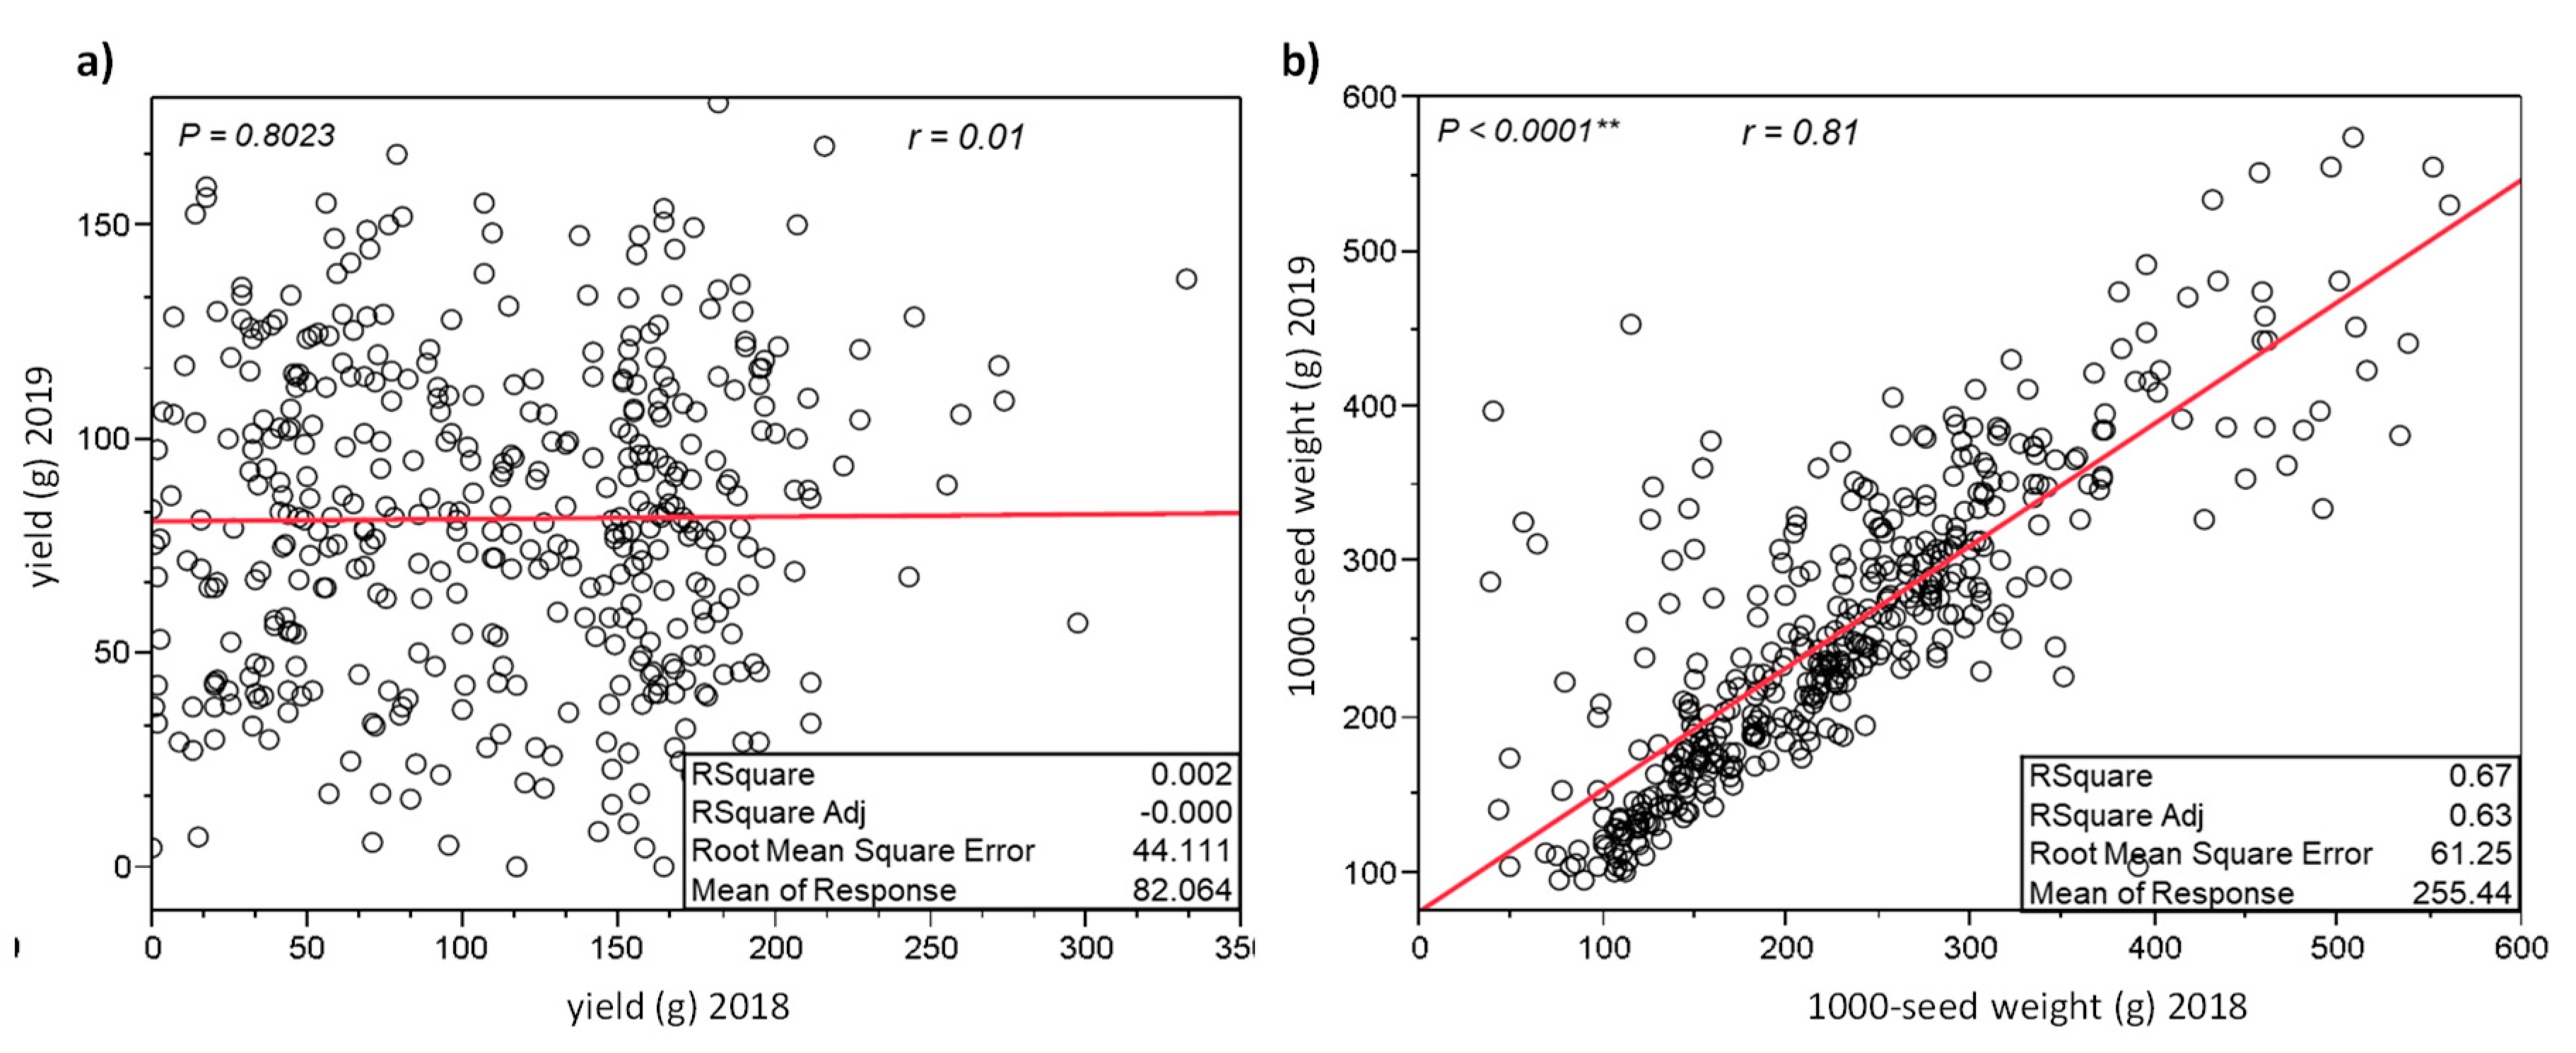
The UNIVPM_Ca_core1 genotype data from the 2018 and 2019 field trials were used to define the correlated responses for the production traits of the yield and 1000-seed weight (Figure 10). Although no significant linear correlations between the two growing seasons were detected for yield, a significant linear correlation for the 1000-seed weight between growing seasons 2018 and 2019 was detected (p < 0.0001, R2 = 0.67). The estimate of the narrow-sense heritability (i.e., slope of the linear regression) was r = 0.79.

4. Discussion

The conservation and valorization of plant genetic resources (PGR) is crucial for the future of agriculture [29]. Indeed, the genetic diversity of PGR and particularly of food legumes represents a strategic tool for agriculture today, to guarantee food security and food quality, to cope with climate change and to protect the environment [9,30]. To conserve such precious resources is not enough; it is crucial to also characterize them and to be able to fully exploit the genetic diversity they hold for plant breeding. In the last decade, GWA mapping has become a very popular tool for gene discovery and PGR enhancement. The prerequisite to conduct a successful GWA program is the availability of well-characterized association panels built as a collection of a high number of pure lines (for autogamous species). These association panels are efficient pre-breeding tools in the hands of breeders. Often, association panels are derived from large core collections by sampling a set of genotypes balancing the population structure and the size of the panels (at least 200 genotypes) [31]. Moreover, association panels need to present a wide variation and the proper resolution for the trait of interest. Here, from a collection of about 2000 chickpea accessions, characterized in a field trial, we developed a panel of 480 pure line-based genotypes for GWA studies, primarily targeting agronomic traits for European and Mediterranean environments.
Several studies are currently available based on phenotypic and genotypic characterization of chickpea core collections [4,17,18,19,20,21,22]. However, the majority of the accessions that constitute the existing and deeply analyzed chickpea core collections were lacking in materials from the Mediterranean Basin, and especially from Europe. Moreover, phenotypic evaluations of wide collections of chickpea genetic resources in such environments are also lacking.
The association panel developed in this study, UNIVPM_Ca_core2, included 180 European genotypes together with 105 genotypes from north Africa, Turkey, Lebanon, Cyprus and Syria and these represent 59.4% of this entire set of materials. The remaining genotypes are from diverse geographic areas and mean that UNIVPM_Ca_core2 includes worldwide materials. The main strength of this panel is that it was developed by selection of the materials (i.e., landraces, cultivars) that did not show any difficulties to grow, flower, and mature in a Mediterranean environment (i.e., central Italy) over both the 2018 and 2019 growing seasons. This is also the reason why the Italian local germplasm is a little more represented. This means that the set of materials was developed to constitute an association panel that has the potential to be used for breeding programs aimed to develop varieties adapted to European and Mediterranean environments.
The analysis of the phenotypic data recorded over 2 years of field trials highlighted that the collection encompasses large phenotypic variability in terms of the flowering, architectural, and production traits, which confirms the high potential of such a set of materials to be used as a tool for association mapping studies and as a training population for genomic selection.
Considering the different traits, wide variation was observed in this UNIVPM_Ca_core2 panel for the architectural traits, in terms of plant height (10–70 cm) and first pod insertion (5–45 cm). A similar range of variability for plant height was reported by Upadhyaya and Ortiz [17] for both their core subset of 1956 accessions and their mini-core set of 211 accessions that were grown in the 1999/2000 post rainy season at the ICRISAT Centre at Patancheru (India). Considering first pod height, a smaller range (6–36 cm) was shown by Canci and Toker [32] in their evaluation of 377 chickpea accessions over 2 years (2005, 2006) in the Antalya region (Turkey), although this was carried out under drought and heat stress conditions. Moderate heritability for plant height (h2 = 52.0%) and first pod height (h2 = 50.5%) were estimated in the present study. Similar estimates for plant height were also obtained by Mallu et al. [33] in their evaluation of 60 genotypes over four different field trials carried out in 2013 at two locations (Kabete and Juja, Kenya) and through two rainy seasons.
Variability was also observed in the present study for flowering time. The geographic distribution of the three different clusters identified on the basis of the flowering traits showed that the genotypes from geographic areas that are characterized by lower latitudes, such as Ethiopia and Central America, included more early flowering, while for the Mediterranean Basin there were higher proportions of intermediate and late-flowering genotypes. In western and eastern Europe at higher latitudes, the late-flowering genotypes were more prevalent. This observation reflects what has already been shown for the chickpea, where temperature and day length were identified as the key factors that affect the timing of floral initiation [34,35]. Thus, in warmer environments, such as southern and central India, early flowering genotypes have been selected to avoid strong terminal drought stress, while in cooler habitats that are characterized by longer growing seasons (e.g., northern India, Mediterranean), the selection has been for later-flowering genotypes [36,37]. Of course, the availability of the different genotypes characterized by variability in flowering time was crucial for the development of varieties adapted to different latitudes and target locations, as well as to different sowing seasons (i.e., autumn, spring).
In the developed panel, the growth habit also showed high variability. The multivariate analysis showed opposite correlations between flowering time and growth habit, with early flowering genotypes from Mexico and Ethiopia having a spreading growth habit, and late-flowering genotypes characterized by erect and semi-erect growth habits. The same correlation was reported for the phenotypic diversity analysis of the core collection developed by ICRISAT [19].
For the production traits, the present study highlighted large variability for 1000-seed weight, from 100 to >500 g; moreover, this trait showed strong heritability, as also seen in the literature [32,33]. This suggests that the control of the 1000-seed weight is characterized by a narrow genetic basis [38], which was also confirmed by the strong correlation between the seed sizes across the 2 years of cultivation.
Variability was also seen for yield, even if low heritability and little correlation was seen between the 2018 and 2019 years of cultivation. This was expected considering that yield is a quantitatively inherited multigenic trait that is strongly affected by the environment [39].
The UNIVPM_Ca_core2 panel was also balanced between the desi and kabuli types. The literature based on genotypic characterization of different sets of chickpea germplasm suggests that desi and kabuli are not distinct genetic groups [21,40,41]. Varma Penmetsa et al. [40] analyzed a sample of 322 chickpea accessions that included 224 cultivated and 98 wild genotypes, and defined 538 single nucleotide polymorphisms. Their population structure data indicated that none of the genetic groups identified corresponded to the desi and kabuli types. They also suggested a diverse hypothesis for the origin of the kabuli type. While the general belief is that the desi form represents the early domesticate, with kabuli being a subsequently derived type [3], Varma Penmetsa et al. [40] showed that the kabuli form is polyphyletic as a result of mutations that have occurred in genes which mainly control pigmentation of flowers and seeds. These mutations have arisen multiple times during the phase of phenotypic diversification after the initial domestication of chickpea. Interestingly, extensive admixture was detected within the cultivated germplasm among groups with distinct geographic origins, which appears to be a consequence of breeding [40]. Di Giovanni et al. [41] used 22 single sequence repeats to characterize a sample of 103 chickpea accessions. Here, they identified three different genetic groups, which mainly represented not only the two market types, but also the geographic origin. In particular, a third group included both the desi and kabuli types mostly from Ethiopia and European countries. At the same time, they observed that the European desi accessions appeared to be closer to the Ethiopian gene pool than to the Asian gene pool.
The comparison of the desi and kabuli types of the UNIVPM_Ca_core2 panel based on the phenotypic data from the 2019 field experiment indicated that there were significant differences between these two market types for all of the traits considered. These differences between the desi and kabuli genotypes were mainly related to the geographic origins of the accessions. The desi forms showed significantly earlier flowering than the kabuli forms, with the opposite for the yield; the desi form mainly originated from countries at low latitudes, such as India and Ethiopia, while the kabuli form was from the Mediterranean basin. These findings suggest that although the desi and kabuli forms are not clearly differentiated from a genetic point of view [40], their adaptation to different environments has led to the selection of different genetic backgrounds (i.e., allele combinations) that form the basis of the phenotypic differentiation seen here. In this scenario, the balanced accessions of the desi and kabuli types and their origins from different geographic areas (which include the main areas of chickpea cultivation), makes this UNIVPM_Ca_core2 collection a very useful set of materials to also investigate post-domestication diversification traits.
Finally, the UNIVPM_Ca_core2 panel was developed with the aim to obtain SSD purified lines. This is a crucial step when the objective is to associate phenotypes to reliable genotypic information. In this regard, the UNIVPM_Ca_core2 set of materials has strong potential to be used as an association panel in pre-breeding programs aimed at the identification of the genetic control of important agronomic, adaptive, and quality traits. Moreover, the linking of the diverse genetic backgrounds to specific phenotypes can be used to predict the phenotype of genetic resources conserved in genebanks not included in core collections, by only looking at the genetic data [42].

5. Conclusions

In the present study, we have shown the development and characterization of a chickpea association panel built not only to be representative of the genetic diversity and geographic distribution of this crop, but also to include samples that are adapted to grow in European and Mediterranean environments. The strengths of such a panel are: (i) it includes ~59% of genotypes that are from Europe and the Mediterranean Basin, which have thus evolved to be adapted to these environments; (ii) it is representative of the worldwide geographic distribution of cultivated chickpea germplasm; (iii) it includes genotypes that were selected to grow and produce well in a Mediterranean environment; (iv) it is highly variable for the flowering, architectural, and production traits; (v) it is balanced between the desi and kabuli types; and (vi) it is made up of SSD lines. All these features make this set of materials an optimal association panel to be used in pre-breeding for the development of novel chickpea varieties for European environments. This tool will overcome the lack of breeding efforts for adaptation of legumes to European agro-ecosystems, which have been negligible since the 1940s. This situation was also recently noted by the European Union to be due to the stimulus of consumer demand and market trends related to protein plants, which has resulted in recent funded of projects that are focused on food legume pre-breeding and breeding.

Supplementary Materials

The following are available online at https://www.mdpi.com/2073-4395/10/9/1417/s1, Figure S1: Distribution of the collected phenotypic traits from the UNIVPM_Ca_ALL and selected UNIVPM_Ca_core1, Figure S2: Thermo-pluviometric data for the 2019 growing season, Figure S3: Pearson correlations among the phenotypes of the UNIVPM_Ca_core2 collection. File S1: List of accessions used in the present study, File S2: Weather and soil data of the CREA-CI experimental station (Osimo, Ancona, Italy).

Author Contributions

R.P. and E.B. (Elena Bitocchi) conceived and designed the research. L.R., E.B. (Elisa Bellucci) and L.N. managed the seeds of chickpea genetic resources; R.P., E.B. (Elena Bitocchi) and L.R. planned the agronomic experiments; L.R., G.C., V.D.V., G.L., G.F., A.D.G., S.P., L.M. and L.N. carried out the agronomic experiment; L.R. and E.B. (Elisa Bellucci) conducted phenotypic screening of field trials; L.R., R.P. and E.B. (Elena Bitocchi) carried out data analysis; L.R., R.P. and E.B. (Elena Bitocchi) wrote the manuscript; E.B. (Elisa Bellucci), G.C., V.D.V., G.L., G.F. and L.N. contributed to the drafting and writing of the manuscript. All authors have read and agreed to the published version of the manuscript.

Funding

This research was funded by Rural Development Programme (Regional)—Marche Region, Italy, 2014/2020—M16.2.A, Biodiversity2Food project and by Università Politecnica delle Marche (years 2017–2019).

Acknowledgments

The authors would like to thank the Western Regional Plant Introduction Station (USDA-ARS, Washington State University, USA), the Leibniz Institute of Plant Genetics and Crop Plant Research-IPK (Gatersleben, Germany), the International Center for Agricultural Research in the Dry Areas (ICARDA) and the Italian smallholder farmers for providing seeds of accessions used in the present study. In particular, thanks to Università degli Studi di Sassari and Università degli Studi della Basilicata to collaborate with us to collect Italian chickpea landraces from smallholder farmers.

Conflicts of Interest

The authors declare no conflict of interest. The funders had no role in the design of the study; in the collection, analyses, or interpretation of data; in the writing of the manuscript, or in the decision to publish the results.

References

  1. Rawal, V.; Navarro, D.K. The Global Economy of Pulses; FAO: Rome, Italy, 2019. [Google Scholar]
  2. Abbo, S.; Berger, J.; Turner, N.C. Viewpoint: Evolution of cultivated chickpea: Four bottlenecks limit diversity andconstrain adaptation. Funct. Plant Boil. 2003, 30, 1081–1087. [Google Scholar] [CrossRef] [Green Version]
  3. Ladizinsky, G.; Adler, A. The origin of chickpea Cicer arietinum L. Euphytica 1976, 25, 211–217. [Google Scholar] [CrossRef]
  4. Varshney, R.; Thudi, M.; Roorkiwal, M.; He, W.; Upadhyaya, H.D.; Yang, W.; Bajaj, P.; Cubry, P.; Rathore, A.; Jian, J.; et al. Resequencing of 429 chickpea accessions from 45 countries provides insights into genome diversity, domestication and agronomic traits. Nat. Genet. 2019, 51, 857–864. [Google Scholar] [CrossRef] [Green Version]
  5. Fierro, M.; Palmieri, D.; Curtis, F.; De Vitullo, D.; Rubio, J.; Gil, J.; Lima, G.; Millan, T. Genetic and agronomic characterization of chickpea landraces for resistance to Fusarium oxysporum f. sp. ciceris. Phytopathol. Mediterr. 2019, 58, 239–248. [Google Scholar]
  6. Iliadis, C. Evaluation of six chickpea varieties for seed yield under autumn and spring sowing. J. Agric. Sci. 2001, 137, 439–444. [Google Scholar] [CrossRef]
  7. Singh, K.B.; Malhotra, R.S.; Saxena, M.C.; Bejiga, G. Superiority of Winter Sowing over Traditional Spring Sowing of Chickpea in the Mediterranean Region. Agron. J. 1907, 89, 112–118. [Google Scholar] [CrossRef] [Green Version]
  8. Foyer, C.H.; Lam, H.; Nguyen, H.T.; Siddique, K.H.M.; Varshney, R.; Colmer, T.D.; Cowling, W.A.; Bramley, H.; Mori, T.A.; Hodgson, J.M.; et al. Neglecting legumes has compromised human health and sustainable food production. Nat. Plants 2016, 2, 16112. [Google Scholar] [CrossRef]
  9. Papa, R. Increase Consortium: Increase-Intelligent Collections of Food Legumes Genetic Resources for European Agrofood Systems. Plant J. 2020, in press. [Google Scholar]
  10. Gupta, S.; Nawaz, K.; Parween, S.; Roy, R.; Sahu, K.; Pole, A.K.; Khandal, H.; Srivastava, R.; Parida, S.K.; Chattopadhyay, D. Draft genome sequence of Cicer reticulatum L., the wild progenitor of chickpea provides a resource for agronomic trait improvement. DNA Res. 2016, 24, 1–10. [Google Scholar] [CrossRef] [Green Version]
  11. Parween, S.; Nawaz, K.; Roy, R.; Pole, A.K.; Suresh, B.V.; Misra, G.; Jain, M.; Yadav, G.; Parida, S.K.; Tyagi, A.K.; et al. An advanced draft genome assembly of a desi type chickpea (Cicer arietinum L.). Sci. Rep. 2015, 5, 12806. [Google Scholar] [CrossRef] [Green Version]
  12. Varshney, R.; Song, C.; Saxena, R.; Azam, S.; Yu, S.; Sharpe, A.G.; Cannon, S.; Baek, J.; Rosen, B.D.; Tar’An, B.; et al. Draft genome sequence of chickpea (Cicer arietinum) provides a resource for trait improvement. Nat. Biotechnol. 2013, 31, 240–246. [Google Scholar] [CrossRef] [Green Version]
  13. Brown, A.H.D. Core collections: A practical approach to genetic resources management. Genome 1989, 31, 818–824. [Google Scholar] [CrossRef]
  14. El Bakkali, A.; Haouane, H.; Moukhli, A.; Costes, E.; Van Damme, P.; Khadari, B. Construction of Core Collections Suitable for Association Mapping to Optimize Use of Mediterranean Olive (Olea europaea L.) Genetic Resources. PLoS ONE 2013, 8, e61265. [Google Scholar] [CrossRef] [Green Version]
  15. Perseguini, J.M.K.C.; Silva, G.M.B.; Rosa, J.R.B.F.; Gazaffi, R.; Marçal, J.F.; Carbonell, S.A.M.; Chiorato, A.F.; Zucchi, M.I.; Garcia, A.A.F.; Benchimol, L.L. Developing a common bean core collection suitable for association mapping studies. Genet. Mol. Biol. 2015, 38, 67–78. [Google Scholar] [CrossRef] [Green Version]
  16. Ambreen, H.; Kumar, S.; Kumar, A.; Agarwal, M.; Jagannath, A.; Goel, S. Association Mapping for Important Agronomic Traits in Safflower (Carthamus tinctorius L.) Core Collection Using Microsatellite Markers. Front. Plant Sci. 2018, 9, 402. [Google Scholar] [CrossRef] [Green Version]
  17. Upadhyaya, H.D.; Ortiz, R. A mini core subset for capturing diversity and promoting utilization of chickpea genetic resources in crop improvement. Theor. Appl. Genet. 2001, 102, 1292–1298. [Google Scholar] [CrossRef] [Green Version]
  18. Upadhyaya, H.D.; Bramel, P.J.; Singh, S. Development of a Chickpea Core Subset Using Geographic Distribution and Quantitative Traits. Crop. Sci. 2001, 41, 206–210. [Google Scholar] [CrossRef]
  19. Upadhyaya, H.D.; Ortiz, R.; Bramel, P.J.; Singh, S. Phenotypic diversity for morphological and agronomic characteristics in chickpea core collection. Euphytica 2002, 123, 333–342. [Google Scholar] [CrossRef]
  20. Upadhyaya, H.D.; Furman, B.J.; Dwivedi, S.L.; Udupa, S.M.; Gowda, C.L.L.; Baum, M.; Crouch, J.H.; Buhariwalla, H.K.; Singh, S. Development of a composite collection for mining germplasm possessing allelic variation for beneficial traits in chickpea. Plant Genet. Resour. 2006, 4, 13–19. [Google Scholar] [CrossRef] [Green Version]
  21. Upadhyaya, H.D.; Dwivedi, S.L.; Baum, M.; Varshney, R.; Udupa, S.; Gowda, C.L.L.; Hoisington, D.; Singh, S. Genetic structure, diversity, and allelic richness in composite collection and reference set in chickpea (Cicer arietinum L.). BMC Plant Biol. 2008, 8, 106. [Google Scholar] [CrossRef] [Green Version]
  22. Dwivedi, S.L.; Upadhyaya, H.D.; Balaji, J.; Buhariwalla, H.K.; Blair, M.W.; Ortiz, R.; Crouch, J.H.; Serraj, R. Using Genomics to Exploit Grain Legume Biodiversity in Crop Improvement. Plant Breed. Rev. 2010, 26, 171–357. [Google Scholar] [CrossRef] [Green Version]
  23. Upadhyaya, H.D.; Bajaj, D.; Narnoliya, L.; Das, S.; Kumar, V.; Gowda, C.L.L.; Sharma, S.; Tyagi, A.K.; Parida, S.K. Genome-Wide Scans for Delineation of Candidate Genes Regulating Seed-Protein Content in Chickpea. Front. Plant Sci. 2016, 7, 302. [Google Scholar] [CrossRef] [Green Version]
  24. Basu, U.; Srivastava, R.; Bajaj, D.; Thakro, V.; Daware, A.; Malik, N.; Upadhyaya, H.D.; Parida, S.K. Genome-wide generation and genotyping of informative SNPs to scan molecular signatures for seed yield in chickpea. Sci. Rep. 2018, 8, 13240. [Google Scholar] [CrossRef]
  25. Miller, P.; Lanier, W.; Brandt, S. Using growing degree days to predict plant stages. In Ag/Extension Communications Coordinator, Communications Services; Montana State University-Bozeman: Bozeman, MT, USA, 2001. [Google Scholar]
  26. IBPGR, ICRISAT and ICARDA. Descriptors for Chickpea (Cicer arietinum L.); International Board for Plant Genetic Resources (IBPGR): Rome, Italy; International Crops Research Institute for the Semi-Arid Tropics (ICRISAT): Patancheru, India; International Center for Agriculture Research in the Dry Areas (ICARDA): Aleppo, Syria, 1993. [Google Scholar]
  27. Ward, J.H. Hierarchical grouping to optimize an objective function. J. Am. Stat. Assoc. 1963, 58, 236–244. [Google Scholar]
  28. Visscher, P.M.; Hill, W.G.; Wray, N.R. Heritability in the genomics era—Concepts and misconceptions. Nat. Rev. Genet. 2008, 9, 255–266. [Google Scholar] [CrossRef]
  29. McCouch, S.; Navabi, K.; Abberton, M.; Anglin, N.L.; Barbieri, R.L.; Baum, M.; Bett, K.; Booker, H.; Brown, G.L.; Bryan, G.J.; et al. Mobilizing Crop Biodiversity. Mol. Plant 2020. [Google Scholar] [CrossRef]
  30. Cortinovis, G.; Di Vittori, V.; Bellucci, E.; Bitocchi, E.; Papa, R. Adaptation to novel environments during crop diversification. Curr. Opin. Plant Biol. 2020, 56, 203–217. [Google Scholar] [CrossRef]
  31. Korte, A.; Farlow, A. The advantages and limitations of trait analysis with GWAS: A review. Plant Methods 2013, 9, 29. [Google Scholar] [CrossRef] [Green Version]
  32. Canci, H.; Toker, C. Evaluation of Yield Criteria for Drought and Heat Resistance in Chickpea (Cicer arietinum L.). J. Agron. Crop. Sci. 2009, 195, 47–54. [Google Scholar] [CrossRef]
  33. Mallu, T.S.; Mwangi, S.G.; Nyende, A.B.; Ganga Rao, N.V.P.R.; Odeny, D.A.; Rathore, A.; Kumar, A. Assessment of genetic variation and heritability of agronomic traits in chickpea (Cicer arietinum L). Int. J. Agron. Agric. Res. 2015, 5, 76–88. [Google Scholar]
  34. Roberts, E.H.; Hadley, P.; Summerfield, R.J. Effects of Temperature and Photoperiod on Flowering in Chickpeas (Cicer arietinum L.). Ann. Bot. 1985, 55, 881–892. [Google Scholar] [CrossRef]
  35. Ellis, R.H.; Lawn, R.J.; Summerfield, R.J.; Qi, A.; Roberts, E.H.; Chay, P.M.; Brouwer, J.B.; Rose, J.L.; Yeates, S.J.; Sandover, S. Towards the Reliable Prediction of Time to Flowering in Six Annual Crops. V. Chickpea (Cicer arietinum). Exp. Agric. 1994, 30, 271–282. [Google Scholar] [CrossRef]
  36. Berger, J.D.; Ali, M.; Basu, P.; Chaudhary, B.; Chaturvedi, S.; Deshmukh, P.; Dharmaraj, P.; Dwivedi, S.; Gangadhar, G.; Gaur, P.; et al. Genotype by environment studies demonstrate the critical role of phenology in adaptation of chickpea (Cicer arietinum L.) to high and low yielding environments of India. Field Crop. Res. 2006, 98, 230–244. [Google Scholar] [CrossRef] [Green Version]
  37. Berger, J.D.; Milroy, S.; Turner, N.C.; Siddique, K.H.M.; Imtiaz, M.; Malhotra, R. Chickpea evolution has selected for contrasting phenological mechanisms among different habitats. Euphytica 2011, 180, 1–15. [Google Scholar] [CrossRef]
  38. Bajaj, D.; Upadhyaya, H.D.; Khan, Y.; Das, S.; Badoni, S.; Shree, T.; Kumar, V.; Tripathi, S.; Gowda, C.L.L.; Singh, S.; et al. A combinatorial approach of comprehensive QTL-based comparative genome mapping and transcript profiling identified a seed weight-regulating candidate gene in chickpea. Sci. Rep. 2015, 5, 9264. [Google Scholar] [CrossRef] [Green Version]
  39. Sharma, K.D.; Chen, W.; Muehlbauer, F.J. Genetics of Chickpea Resistance to Five Races of Fusarium Wilt and a Concise Set of Race Differentials for Fusarium oxysporum f. sp. ciceris. Plant Dis. 2005, 89, 385–390. [Google Scholar] [CrossRef] [Green Version]
  40. Penmetsa, R.V.; Carrasquilla-Garcia, N.; Bergmann, E.M.; Vance, L.; Castro, B.; Kassa, M.T.; Sarma, B.K.; Datta, S.; Farmer, A.D.; Baek, J.-M.; et al. Multiple post-domestication origins of kabuli chickpea through allelic variation in a diversification-associated transcription factor. New Phytol. 2016, 211, 1440–1451. [Google Scholar] [CrossRef] [Green Version]
  41. De Giovanni, C.; Pavan, S.; Taranto, F.; Di Rienzo, V.; Miazzi, M.M.; Marcotrigiano, A.R.; Mangini, G.; Montemurro, C.; Ricciardi, L.; Lotti, C. Genetic variation of a global germplasm collection of chickpea (Cicer arietinum L.) including Italian accessions at risk of genetic erosion. Physiol. Mol. Biol. Plants 2016, 23, 197–205. [Google Scholar] [CrossRef]
  42. Mascher, M.; Schreiber, M.; Scholz, U.; Graner, A.; Reif, J.C.; Stein, N. Genebank genomics bridges the gap between the conservation of crop diversity and plant breeding. Nat. Genet. 2019, 51, 1076–1081. [Google Scholar] [CrossRef]
Figure 1. Selection steps carried out in the development of UNIVPM_Ca_core1 and UNIVPM_Ca_core2; SW, seed weight.
Agronomy 10 01417 g001
Figure 2. Comparisons of the UNIVPM_Ca_ALL and UNIVPM_Ca_core1 sets of materials; (a) Proportions of the desi and kabuli accessions; (b) Proportions of the accessions for each geographic area and for the desi and kabuli types.
Agronomy 10 01417 g002
Figure 3. Frequency distributions and heritabilities of the flowering traits across the UNIVPM_Ca_core2 panel, measured as days after sowing (a) and as growing degree days (b); N, number of accessions; CV1, coefficient of variation based on the population mean; CV2, coefficient of variation between biological replicates.
Agronomy 10 01417 g003
Figure 4. Frequency distribution and heritability estimates of the architectural (a) and production (b) traits across the UNIVPM_Ca_core2 panel; N, number of accessions; CV1, coefficient of variation based on the population mean; CV2, coefficient of variation between biological replicates.
Agronomy 10 01417 g004
Figure 5. Hierarchical cluster analysis for the flowering traits (days to first flower, days to full flowering, days to first pod and duration of flowering) of the UNIVPM_Ca_core2 panel. (a) Dendrogram of the 480 lines based on their flowering traits, as the early, intermediate and late-flowering clusters (in red, yellow and green, respectively). (b) Box-plots illustrating the differences in the flowering traits among the lines belonging to the three clusters illustrated in (a). The boxes show the first, second (median) and third quartiles. Different capital letters above the boxes in each plot indicate significant difference between clusters for that trait (p < 0.05; Student’s t-tests). (c) Pie charts for the geographic areas for the proportions of lines belonging to the three clusters illustrated in (a). The lines from Malawi and Australia are not shown because these countries had only one line in the UNIVPM_Ca_core2 panel. Geographic areas are colored on the basis of the number of genotypes in them; the higher the number of genotypes, the darker the shade of the color.
Agronomy 10 01417 g005
Figure 6. One-way ANOVA across the flowering groups of the UNIVPM_Ca_core2 panel for production (yield, 1000-seed weight) and architectural (plant height, first pod height) traits for the desi (a) and kabuli (b) types. Data are means for each cluster. Different capital letters above the columns in each plot indicate significant differences between clusters for that trait (p < 0.05; Student’s t-tests).
Agronomy 10 01417 g006
Figure 7. One-way ANOVA for the growth habit classes for flowering and production traits of the UNIVPM_Ca_core2 panel for the desi (a) and kabuli (b) types. Data are means for each growth class. Different capital letters above the columns in each plot indicate significant differences between clusters for that growth class (p < 0.05; Student’s t-tests).
Agronomy 10 01417 g007
Figure 8. Principal component analysis of the UNIVPM_Ca_core2 panel based on the phenotypic traits recorded for the 2019 field trial. (a) Genotype distribution for PC1 and PC2, indicating the desi (red) and kabuli (blue) types. (b) Loading plot from the principal component analysis.
Agronomy 10 01417 g008
Figure 9. Scatter plot for yield and 1000-seed weight of the UNIVPM_Ca_core2 genotypes. Colored diamonds, cultivars used as controls. Red arrows, accessions (UNIVPM_Ca_1743, UNIVPM_CA_2119 and UNIVPM_Ca_2123) showing the highest yield and 1000-seed weight.
Agronomy 10 01417 g009
Figure 10. Correlated responses for the production traits of yield (a) and 1000-seed weight (b). Scatterplots of the production traits from year 2018 and 2019. Linear regressions are highlighted in red. The regression coefficient estimates the narrow sense heritability for the related trait.
Agronomy 10 01417 g010
Table 1. Number of accessions for each country of origin and geographic area for UNIVPM_Ca_ALL and UNIVPM_Ca_core1.
Geographic AreaCountryN. of Accessions
UNIVPM_Ca_ALLUNIVPM_Ca_core1
AsiaTotal12146
Tajikistan5430
Uzbekistan315
Afghanistan226
China42
Kazakhstan11
Russia92
Balkan EuropeTotal 4822
North Macedonia194
Greece1810
Bulgaria43
Albania32
Moldova22
Romania21
CaucasusTotal 136
Armenia62
Azerbaijan41
Georgia33
Central AmericaMexico (total)5011
Eastern Europe Total 188
Ukraine83
Hungary72
Slovakia22
Czech Republic11
EthiopiaEthiopia (total)2619
Iberian Peninsula Total 13330
Spain10220
Portugal3110
Indian subcontinentTotal 24148
India19831
Pakistan3712
Bangladesh43
Nepal22
ItalyItaly (total)11191
Middle East Total 54246
Iran1174
Syria36132
Jordan431
Iraq142
Cyprus44
Lebanon33
North AfricaTotal 15920
Morocco896
Tunisia5011
Algeria152
Egypt51
OthersTotal 62
Australia51
Malawi11
South AmericaTotal 215
Chile193
Argentina11
Brazil11
TurkeyTurkey (total)32446
USA USA (total)8017
Western Europe Total 85
France52
Germany33
Overall total 1901 1422 1
1 The accessions for which the information on country of origin is not available are not included in the Table.
Table 2. Proportions of accessions belonging to the desi and kabuli types for each geographic area for UNIVPM_Ca_ALL and UNIVPM_Ca_core1.
Geographic AreaCollectionDeviation 1 (%)
UNIVPM_Ca_ALLUNIVPM_Ca_core1
(n)(%)Desi (%)Kabuli (%)(n)(%)Desi (%)Kabuli (%)
Asia1216.433.966.14610.969.630.44.5
Balkan Europe482.535.464.6225.263.636.42.7
Caucasus130.77.792.361.416.783.30.7
Central America502.62.098.0112.69.190.90.0
Eastern Europe180.916.783.381.937.562.51.0
Ethiopia261.473.126.9194.5100.00.03.1
Iberian Peninsula1337.010.588.7307.116.783.30.1
Indian subcontinent24112.770.529.54811.495.84.2−1.2
Italy1115.826.173.99121.431.968.115.6
Middle East54228.51.798.34610.815.284.8−17.3
North Africa1598.47.692.5204.755.045.0−3.5
other60.333.366.720.50.50.50.2
South America211.14.895.251.220.080.00.1
Turkey32417.024.475.64610.956.543.5−6.0
USA804.216.383.8174.00.0100.0−0.1
Western Europe80.450.050.051.280.020.00.8
Over total1901 422
1 Deviation of UNIVPM_Ca_core1 from UNIVPM_Ca_ALL.
Table 3. Number of accessions and relative frequencies of UNIVPM_Ca_ALL and UNIVPM_Ca_core1 according to the yield classes.
Yield Class (g)CollectionDeviation 1 (%)
UNIVPM_Ca_ALLUNIVPM_Ca_core1
(n)(%)(n)(%)
<5069435.910324.2−11.7
50–10067034.78820.7−14.0
101–15040420.97216.9−4.0
151–2001357.013531.724.7
201–250221.1225.24.1
>25060.361.41.1
1 Deviation of UNIVPM_Ca_core1 from UNIVPM_Ca_ALL.
Table 4. Number of accessions and relative frequency of UNIVPM_Ca_ALL and UNIVPM_Ca_core1 for the 1000-seed weight classes.
1000-Seed Weight Class (g)CollectionDeviation 1 (%)
UNIVPM_Ca_ALLUNIVPM_Ca_core1
(n)(%)(n)(%)
<1001588.1214.9−3.2
100–20057129.615436.26.6
201–30076939.815837.1−2.7
301–40037819.66515.3−4.3
401–500472.4204.72.3
>50080.481.91.5
1 Deviation of UNIVPM_Ca_core1 from UNIVPM_Ca_ALL.
Table 5. Number of accessions and relative frequencies of UNIVPM_Ca_ALL and UNIVPM_Ca_core1 for flowering traits.
Flowering TraitClassCollectionDeviation 1 (%)
UNIVPM_Ca_ALLUNIVPM_Ca_core1
(n)(%)(n)(%)
Days to first flower<72141.1145.14.0
72–8568053.915757.53.6
86–9255443.910036.6−7.3
93–99141.120.7−0.4
Days to full flowering<92102665.923267.21.3
92–9952433.711232.5−1.2
10660.410.3−0.1
Days to first pod<92170.961.40.5
92–99129567.228967.80.6
100–10660431.312930.3−1.1
107–111110.620.5−0.1
1 Deviation of UNIVPM_Ca_core1 from UNIVPM_Ca_ALL.
Table 6. One-way ANOVA between desi and kabuli types for flowering, architectural and production traits of the UNIVPM_Ca_core2 panel.
TraitUnitsGenotypeProb > F
DesiKabuli
Days to first flowerDAS56.858.9<0.0001
Days to full floweringDAS58.760.5<0.0001
Days to first podDAS64.866.2<0.0001
Duration of floweringdays87.2<0.0001
Plant heightcm38.943.4<0.0001
First pod heightcm15.919.9<0.0001
Yieldg78.390.1<0.0001
1000-seed weightg192.9316.2<0.0001