Article

Assessment of Environmental Burdens of Winter Wheat Production in Different Agrotechnical Systems

by
Małgorzata Holka
* and
Jerzy Bieńkowski
Institute for Agricultural and Forest Environment, Polish Academy of Sciences, Bukowska 19, 60-809 Poznań, Poland
*
Author to whom correspondence should be addressed.
Agronomy 2020, 10(9), 1303; https://doi.org/10.3390/agronomy10091303
Submission received: 20 July 2020 / Revised: 25 August 2020 / Accepted: 28 August 2020 / Published: 2 September 2020

Abstract

:
In recent years, an increasing interest has been observed in the reduction in environmental threats posed by the food production chain beginning with agricultural production. The impact of agriculture on the environment varies depending on farming practices. The aim of the study was to assess and compare the environmental effects of the life cycle of winter wheat cultivation in three soil tillage systems: conventional tillage, reduced tillage, and no-tillage. The study was conducted in 2015–2017 on 15 agricultural farms located in the Wielkopolska region, Poland. The “cradle-to-farm gate” life cycle of wheat production was analysed using life cycle assessment methodology. The values of impact category indicators, especially in the case of global warming potential, acidification potential, and eutrophication potential, depended mainly on mineral fertilization. Wheat production generated more adverse emissions with increased nitrogen fertilization both in reduced tillage and no-tillage systems on the studied farms, and consequently resulted in a more negative impact on the environment compared to wheat cultivated in the conventional tillage system. After nitrogen fertilization, use of fossil fuel, and phosphorus and potassium fertilization were the top contributors to environmental impacts of winter wheat production in different tillage systems. The pre-production phase associated with the agricultural means of production was dominant in determining the analysed environmental impacts, except for global warming potential and photochemical ozone creation potential, which depended mainly on the production phase on the farm. The other key environmental impacts that should be considered when it comes to improvements in the life cycle of wheat production were depletion of mineral resources and acidification.

1. Introduction

Crop production is an important link in the food production chain. It plays a crucial role because it provides raw materials for human food and animal feed. One of the basic staple food crops is wheat (Triticum spp.) [1]. This crop is cultivated worldwide. Globally, it occupies the third place in cereal production, right after maize and rice, and the first place in terms of cereal crop area [2]. Wheat also dominates Polish cereal production. It makes up about 32 percent of the total cereal area in Poland, of which 81 percent is winter wheat and 19 percent spring wheat. In 2019, the acreage of winter wheat in the country was over 2 million hectares with an average grain yield of 4.6 Mg per hectare [3]. The volume of wheat production gives Poland the fourth place in the European Union (EU) [4].
In Poland and many European countries, conventional tillage is the most widely applied soil tillage system for crop production [5]. Even though ploughing requires high labour and energy use, many farmers consider it the best way to prepare the soil in order to create good conditions for seed germination and plants’ development [6]. In recent years, due to increasing costs of agricultural production and the need to protect the environment, much attention of researchers and farmers has been focused on non-inversion tillage systems, including reduced tillage and no-tillage (also referred to as direct sowing). The issue of effects of intensity and depth of tillage on the physical, chemical, and biological properties of soil has already been the subject of many studies [7,8,9,10]. In the conventional tillage system, the soil inversion by a mouldboard plough incorporates the previous crop residues and fertilizers into the soil, covers them thoroughly, leads to nutrient distribution in the surface soil layers, allows the control of root weeds and fungal diseases, and loosens and aerates the soil. On the other hand, increasing soil aeration contributes to intensifying the mineralization process and a consequent loss of soil organic matter (SOM), which is important for soil structure, fertility, and water capacity [11]. Meanwhile, improving soil water capacity is of particular importance due to the fact that in recent years, extreme climate events such as drought have led to adverse changes in soil–water relationships. Therefore, one of the directions of adaptation activities in agriculture is increasing the stock of organic matter to increase soil resistance against drying [12]. It can be achieved with reduced tillage and no-tillage [13,14]. Long-term use of these tillage systems is favourable for increasing soil moisture and bulk density as well as decreasing capillary water capacity. Moreover, they can stimulate the activity of enzymes in the soil [15]. Particular benefits are attributed to non-inversion tillage systems that leave at least 30 percent of the field surface covered by crop residue, defined as conservation tillage [16]. This is an effective practice for preventing soil degradation and erosion caused by wind and water [17]. Many authors report on differences in the cereal yields, depending on the soil tillage intensity [18,19,20]. However, the effect of the adopted tillage system on crop yield depends very much on local conditions and technology [21]. The use of fertilizers, plant protection products, modern specialized agricultural machinery, and more precise application technology may contribute to enhancing the efficiency and productivity of crop production in each tillage system [22].
The need for a comprehensive assessment of the impact of agricultural activities on the environment has been highlighted in the world literature [21]. In such an approach, it is important to include not only direct processes on the farm but also those that are associated with the acquisition of raw materials, manufacturing means of production, and product disposal. These processes, being the parts of the so-called “life cycle of product”, may also be the sources of environmental threats, such as resource depletion, acidification, eutrophication, and global warming [23,24]. Environmental burdens are generated at various stages of the life cycle of agricultural products. The most appropriate method for assessing the environmental impacts of all processes throughout the crop life cycle is life cycle assessment (LCA) [25,26].
Most previous studies on the life cycle assessment of wheat production concerned the conventional tillage system and mainly focused on the emissions of greenhouse gases [27,28,29]. There is limited data available on comprehensive environmental life cycle assessment of winter wheat production related to different tillage systems in Polish agriculture. Research on environmental burdens of wheat production depending on tillage practices is important for developing more sustainable food production systems. The aim of the study was to assess and compare the environmental impacts of the life cycle of winter wheat (Triticum aestivum L.) production in different soil tillage systems.

2. Materials and Methods
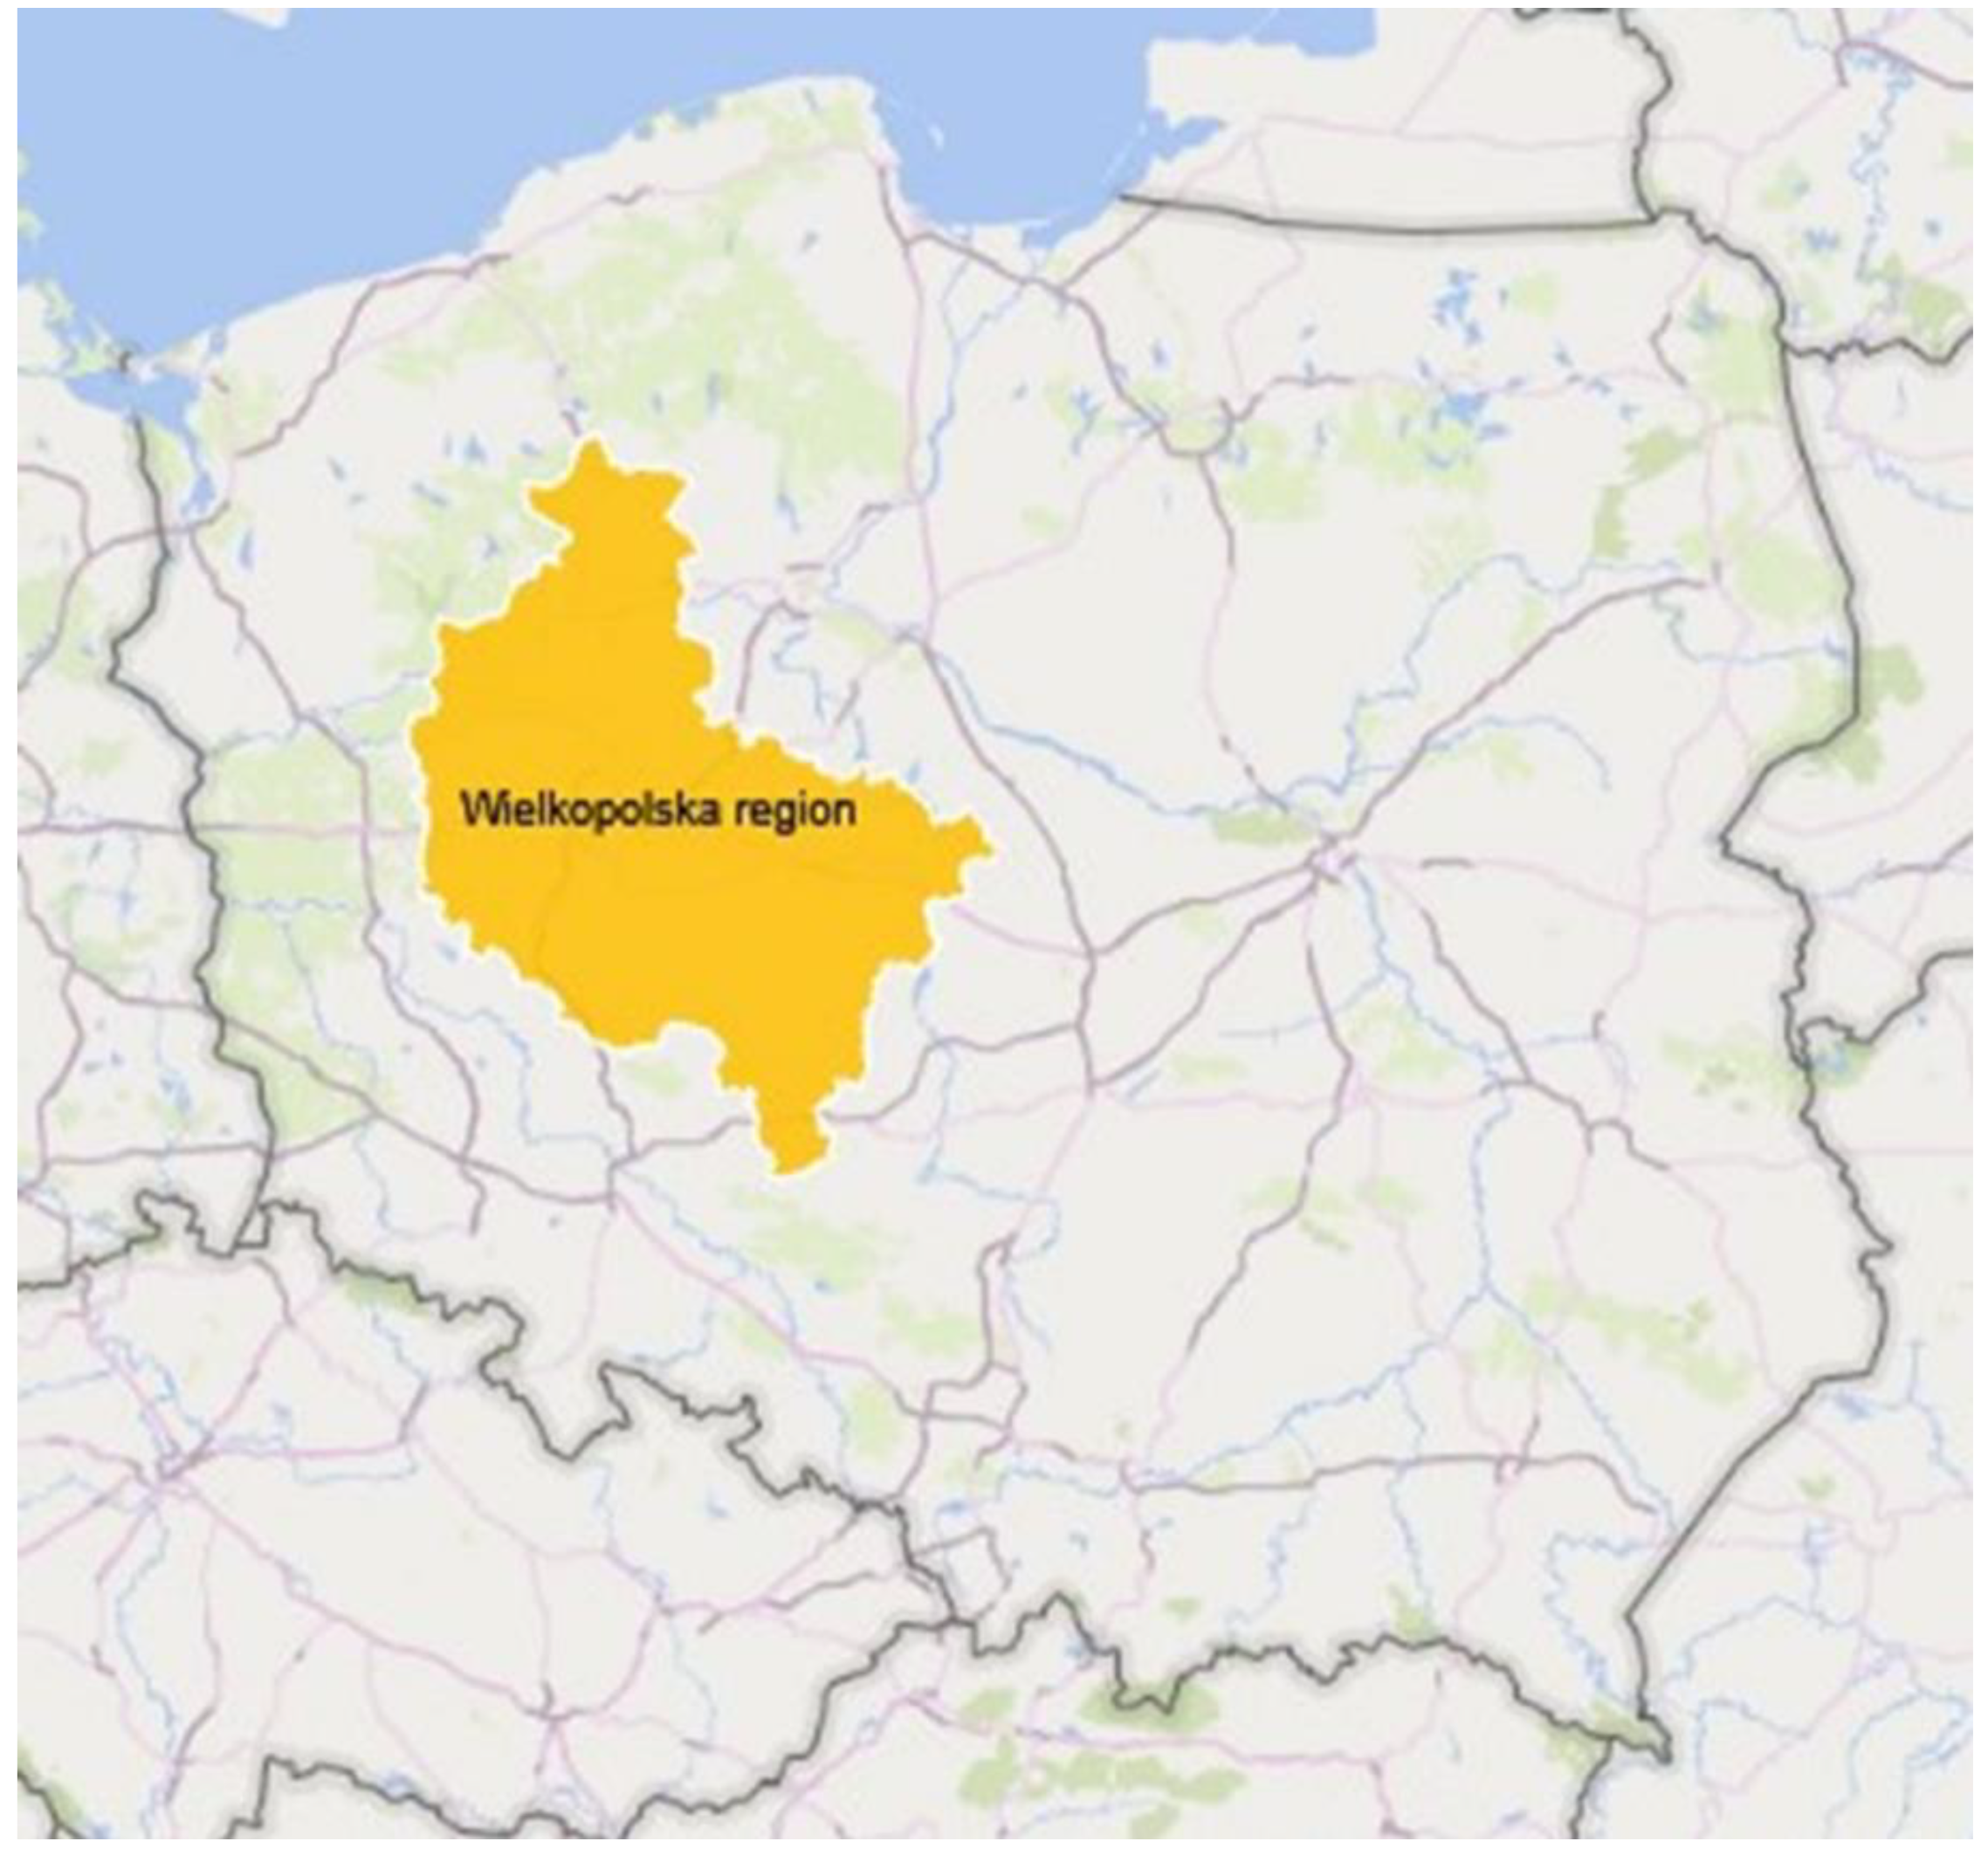
2.1. Study Site

The study was conducted in 2015–2017 on 15 agricultural farms. The studied farms are located in the north-western part of Poland, at 51°–52° north latitude and 15°–19° west longitude in the Wielkopolska region (Figure 1, Table 1), which is known as one of the most productive areas in the country in terms of agricultural production [30]. The farms were selected from a farm group that collaborates with Wielkopolski Agricultural Advisory Centre in Poznań. Their selection was determined by the cultivation of winter wheat under one of the following tillage systems: conventional tillage (CT), reduced tillage (RT), and no-tillage (NT). The characteristics of tillage systems are presented in Table 2. Five farms for each tillage system were studied. Face-to-face interviews with the farmers provided detailed data for the analysis. The interview covered questions about farm characteristics and wheat production including tillage practices, consumption of energy and material inputs, agricultural machinery (type of a machine, lifetime of a machine, total machine weight), and duration of technological operations. Data sets collected from the farms were entered into a computer database using Microsoft Excel®. Table 3 shows the production characteristics of winter wheat cultivation in three tillage systems of the studied farms.

2.2. Life Cycle Assessment (LCA) Methodology

LCA methodology was used to assess the potential impact of the production of winter wheat on the environment. According to the ISO 14,040 and 14,044 standards [31,32], LCA consists of the following four phases: (1) goal and scope, which involve the definition of the goal of the study, functional unit, system boundaries, assumptions and limitations; (2) inventory analysis in order to collect the required input and output data for the system; (3) impact assessment, including mandatory steps: selection of the impact categories, category indicators and characterisation models, assignment of inventory results to the impact category (classification), evaluation of impact category indicators (characterisation), and optional steps such as normalisation, grouping, weighting; (4) interpretation of the results for drawing conclusions.

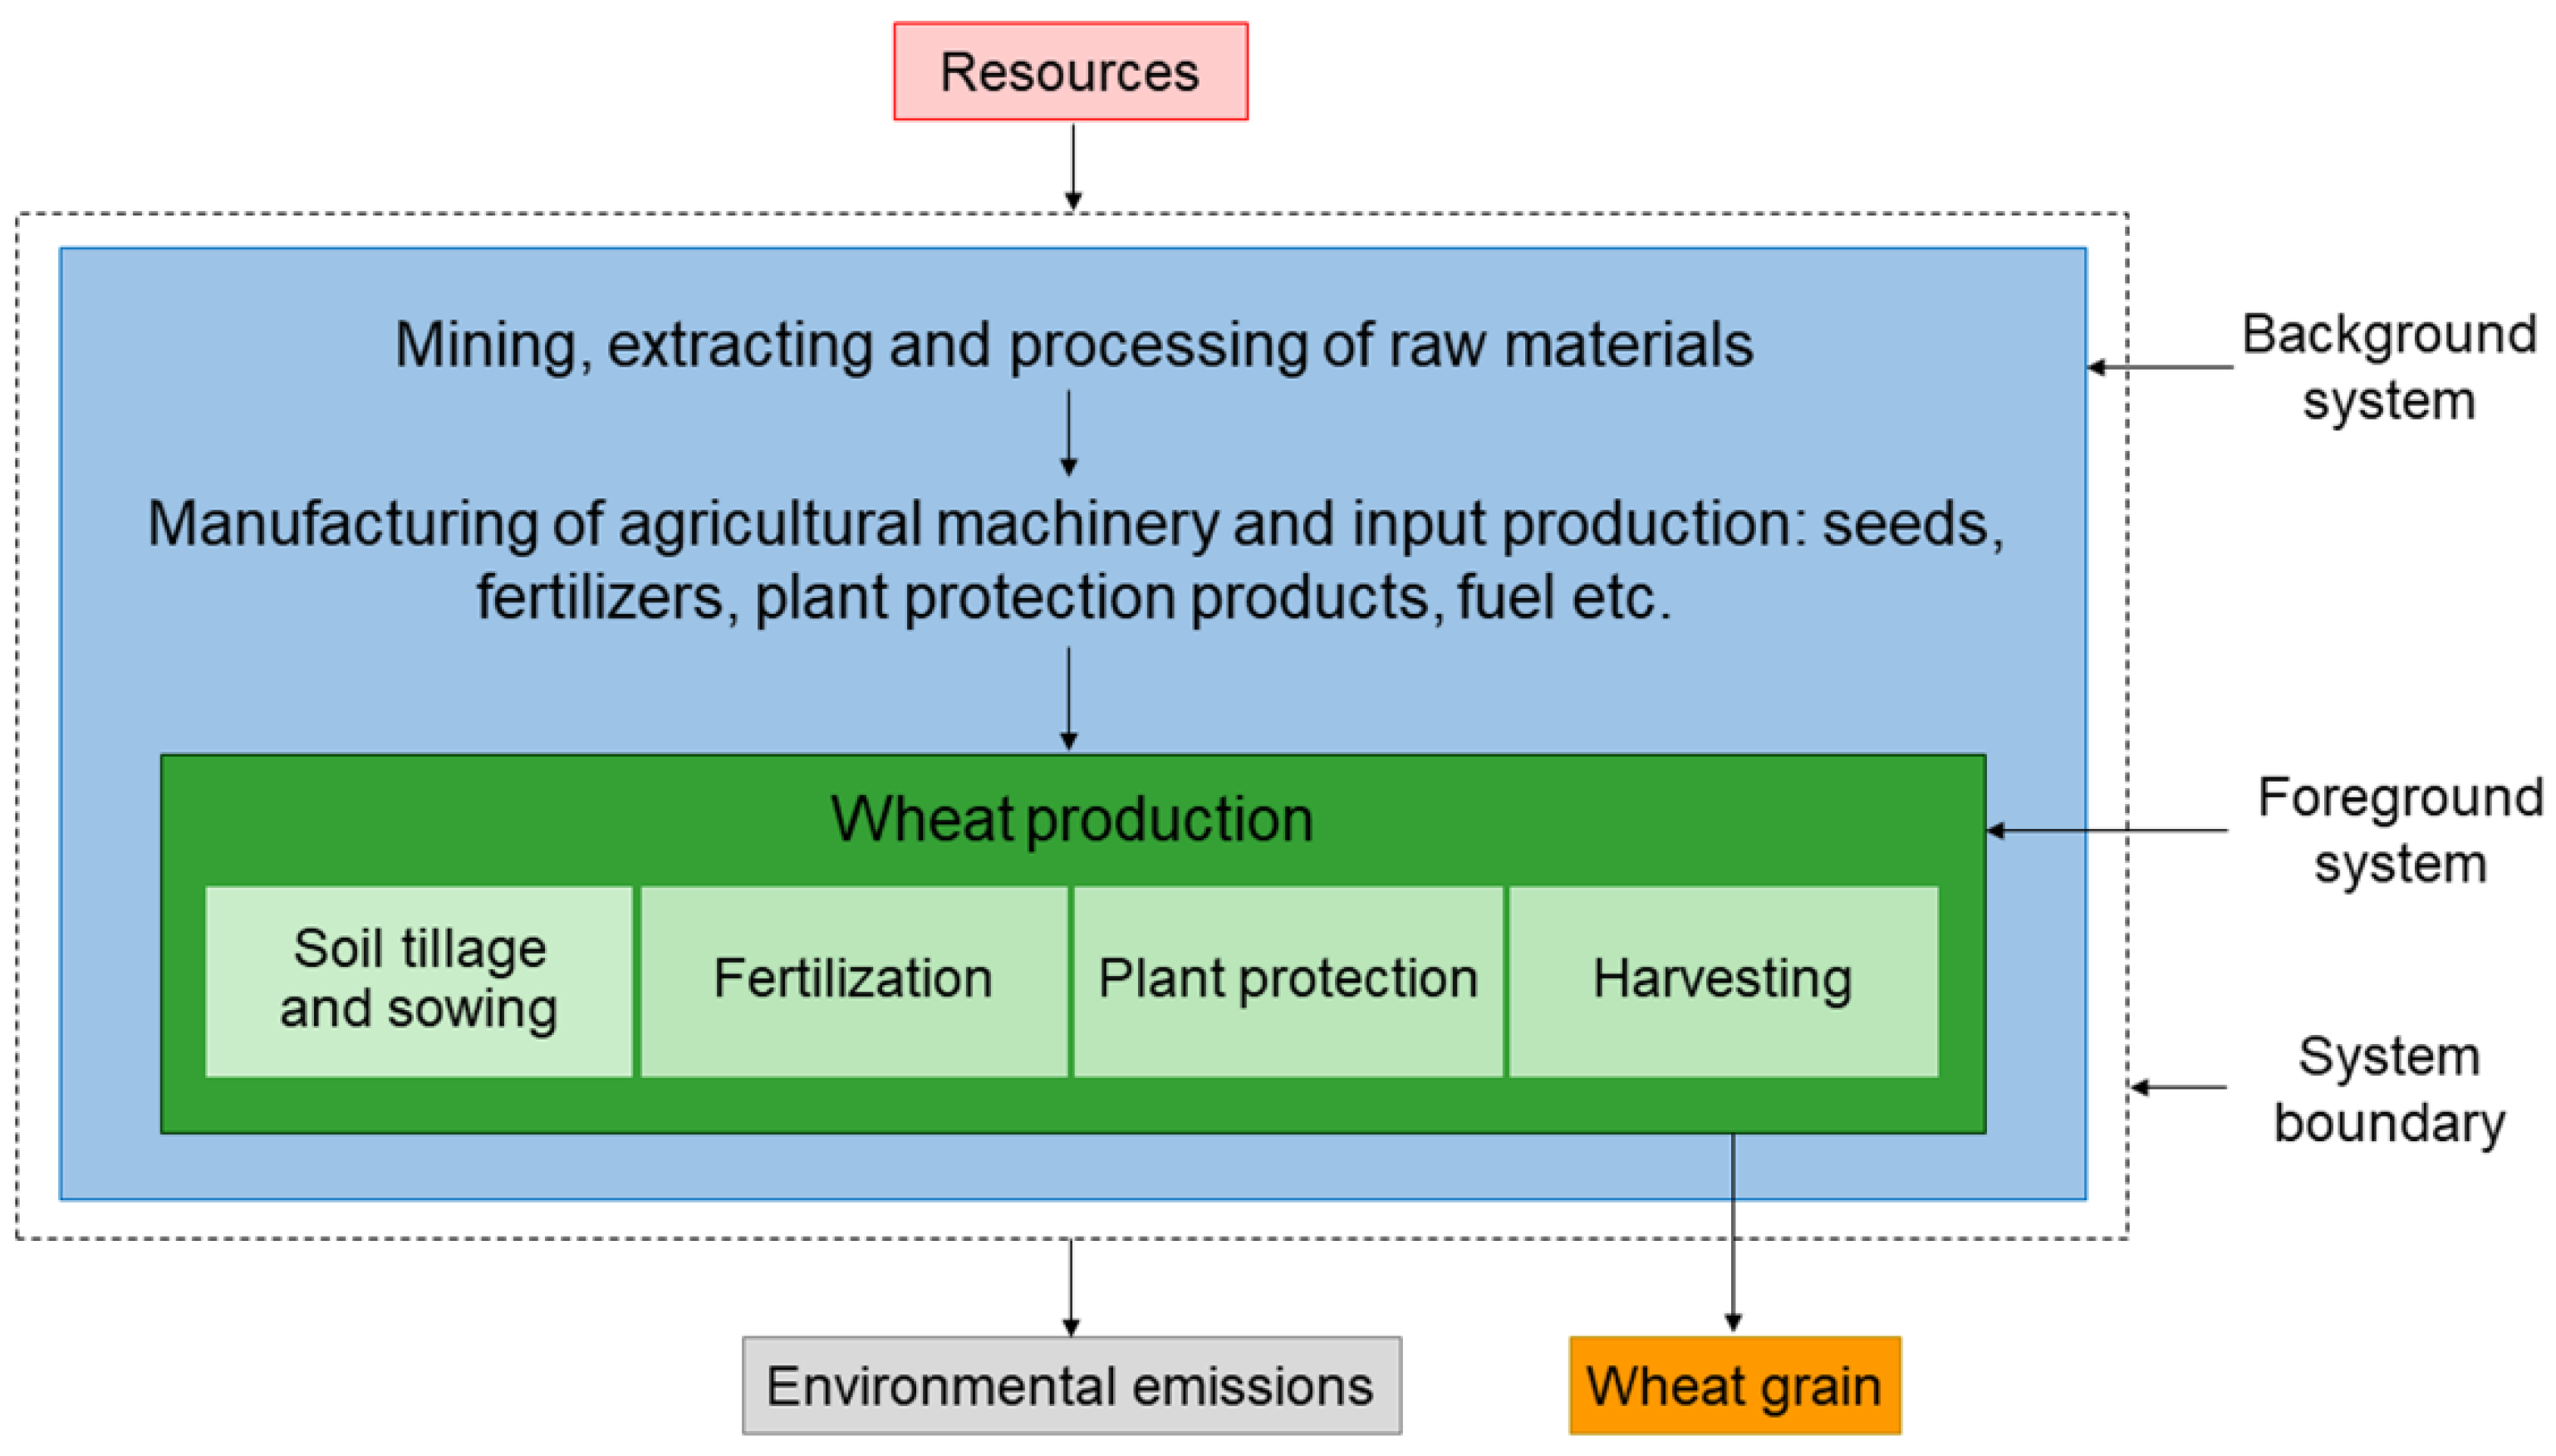
2.2.1. Goal and Scope Definition

The goal of this study was to assess and compare the environmental impact of the life cycle of wheat production in different soil tillage systems. The system boundary was from “cradle-to-farm gate” (Figure 2). Thus, the analysis covered the background processes including extraction of resources, production of agricultural machinery and inputs (seeds, fertilizers, plant protection products, fuel), described in the study as the pre-production phase of the life cycle, and the foreground processes of wheat cultivation. The on-farm phase concerned the following processes: soil cultivation, sowing, fertilization, plant protection, and harvesting. The functional unit chosen was 1 kg of wheat grain.

2.2.2. Inventory Analysis

The life cycle inventory (LCI) phase involved the collection of input and output data for the analysed production system. An overview of the data sources for quantification of LCI data is presented in Table 4. Inventory data from the foreground processes were related to the functional unit of 1 kg of grain based on the consumption of means of agricultural production on the farms and emission factors derived from literature sources. Major data sources for inputs and outputs associated with the background processes were provided by the Ecoinvent database [33].

2.2.3. Life Cycle Impact Assessment (LCIA)

According to the predetermined goal of the study, the following environmental impact categories were selected for evaluation: abiotic resource depletion, acidification, climate change, eutrophication, and photochemical oxidation. The indicators for the relevant impact categories are listed in Table 5.
To calculate the indicators for environmental impacts, the CML method based on the midpoint approach was applied in LCIA. Inventory data were analyzed using the software Team 5.3® (PricewaterhouseCoopers—Ecobilan), which allows the conducting of the LCIA using its own inventory data and data provided by the Ecoinvent database [33]. Outputs were multiplied with appropriate characterisation factors and subsequently summed to obtain the indicator value, according to the following equation [44]:
I c a t = i m i × C F c a t i ,
where:
  • Icat—an impact category indicator;
  • mi—the amount of the i-th substance used or emitted;
  • CFcati—an impact category characterisation factor for the substance.
Additionally, the normalisation procedure was carried out [45]. In order to obtain a single score index, the normalisation procedure was preceded by a weighting step in which all impact assessment results were multiplied by the equal weighting factor of 0.167.

2.2.4. Interpretation
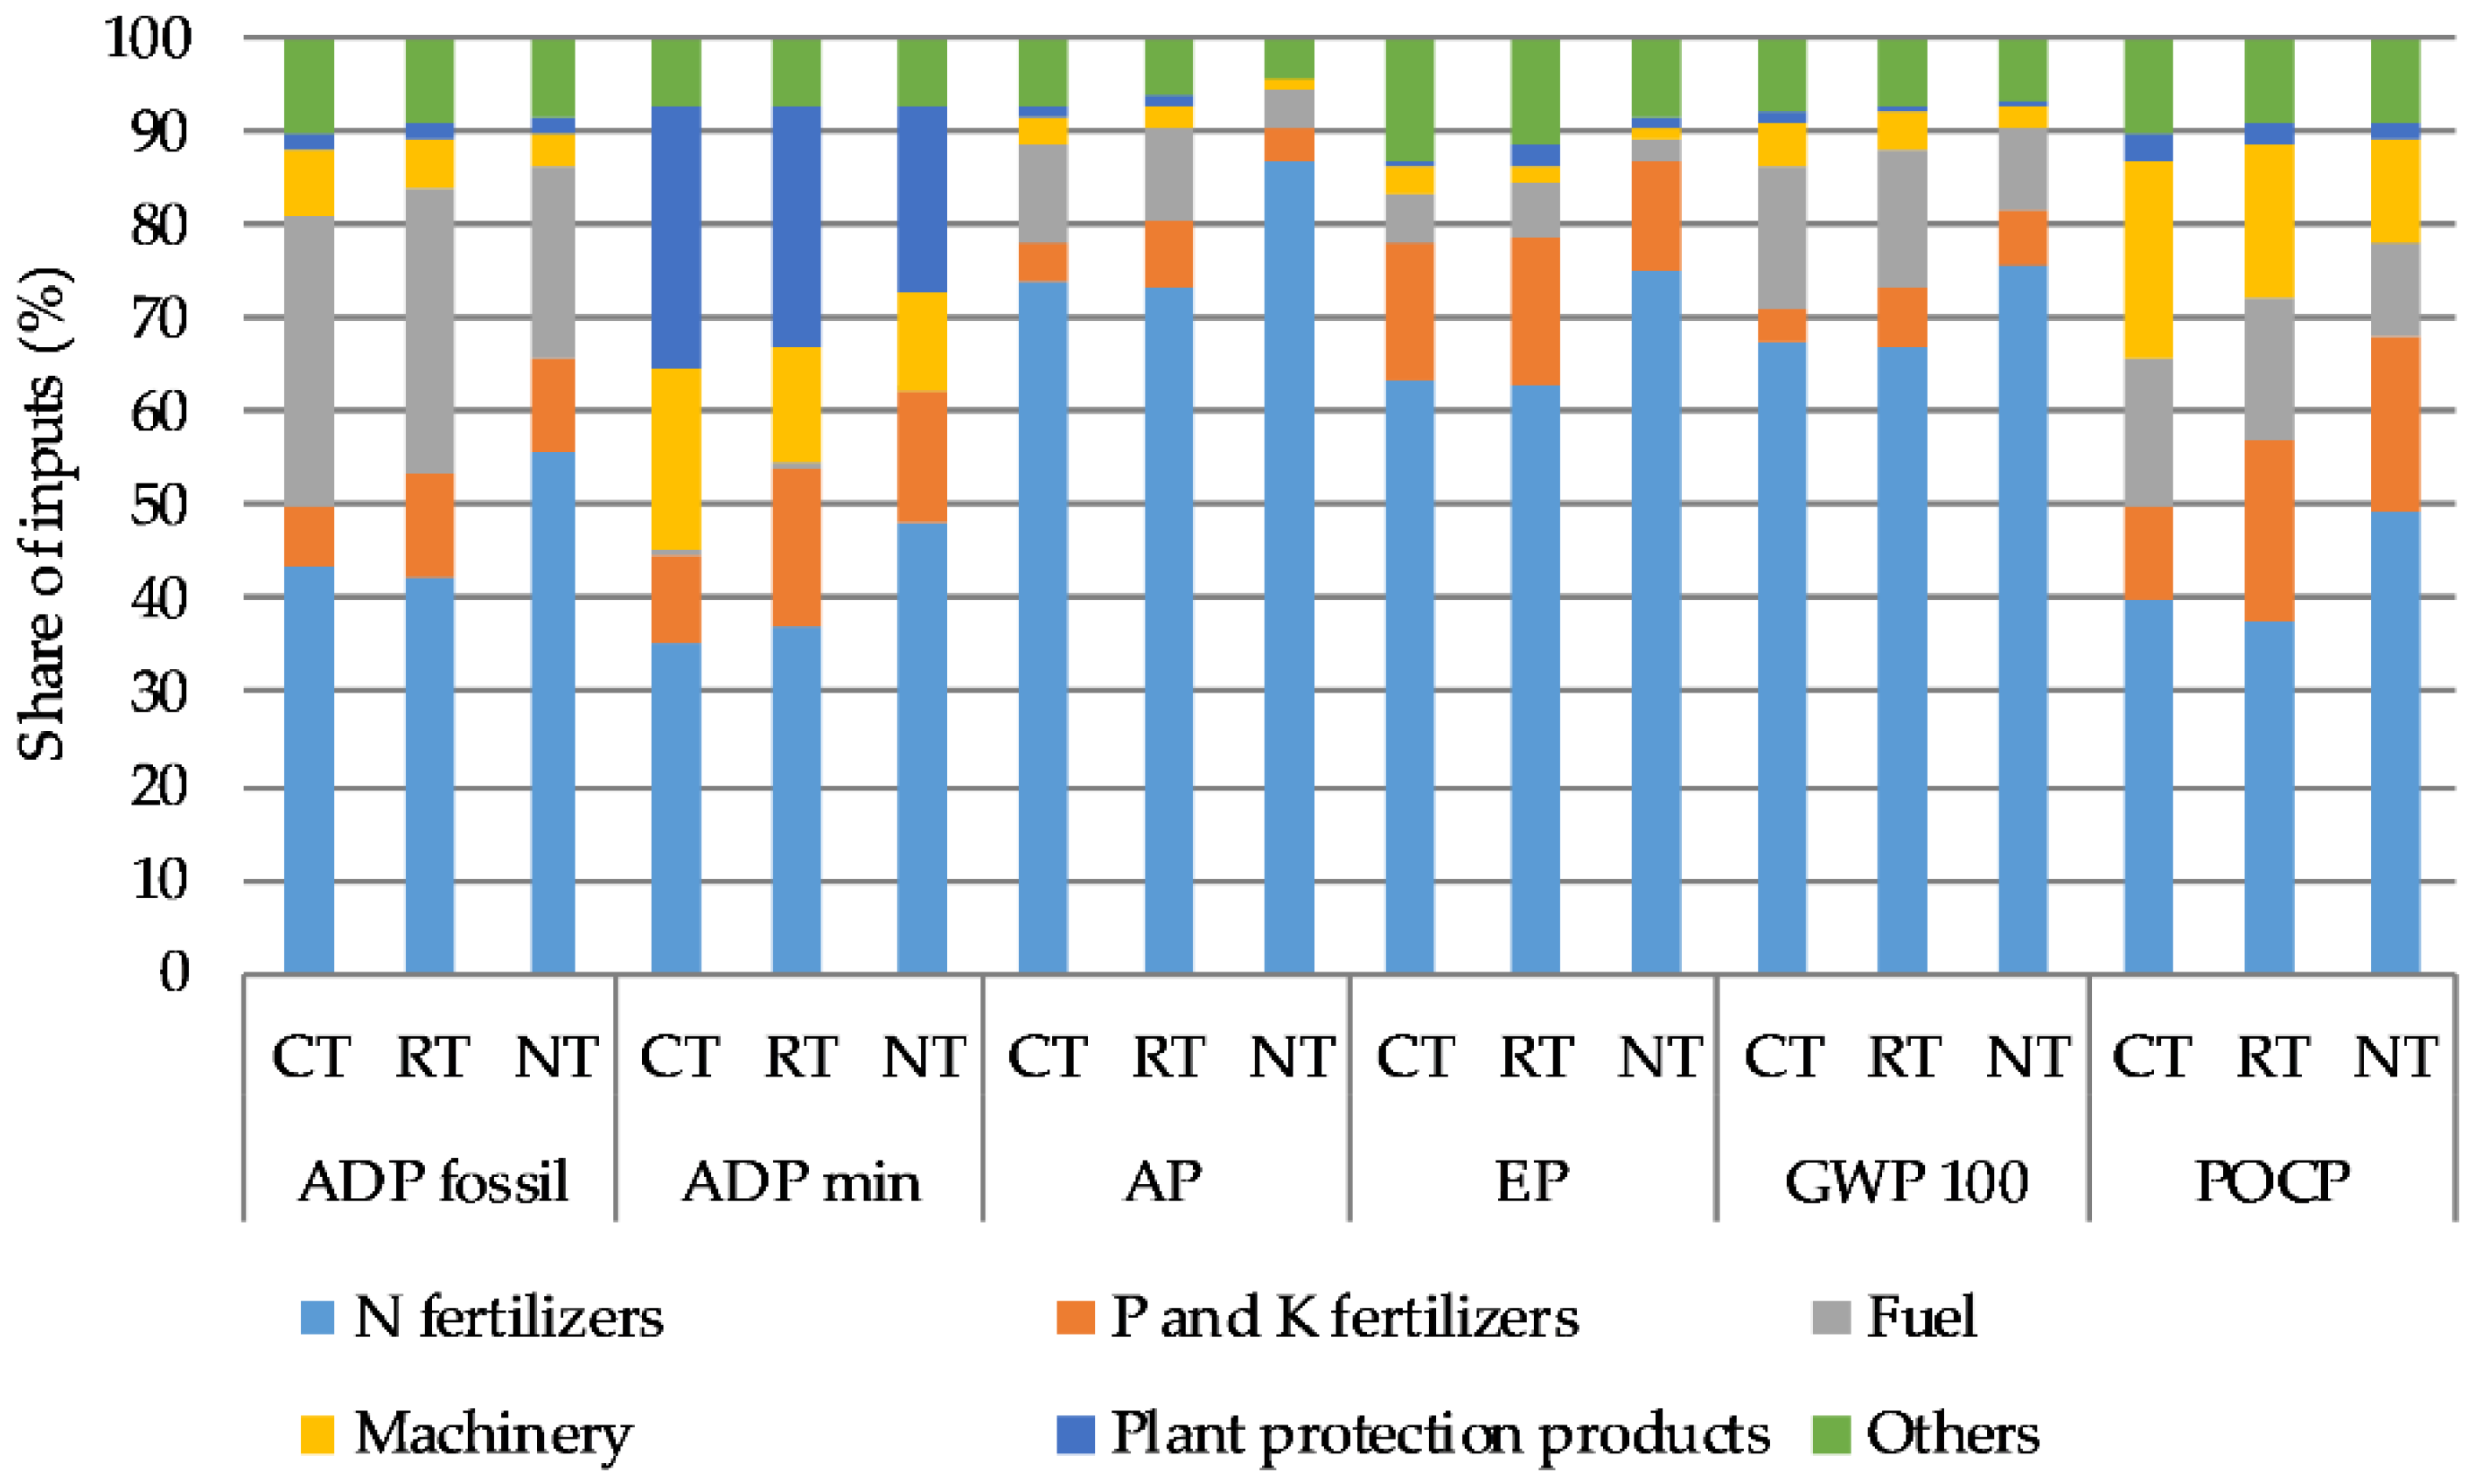
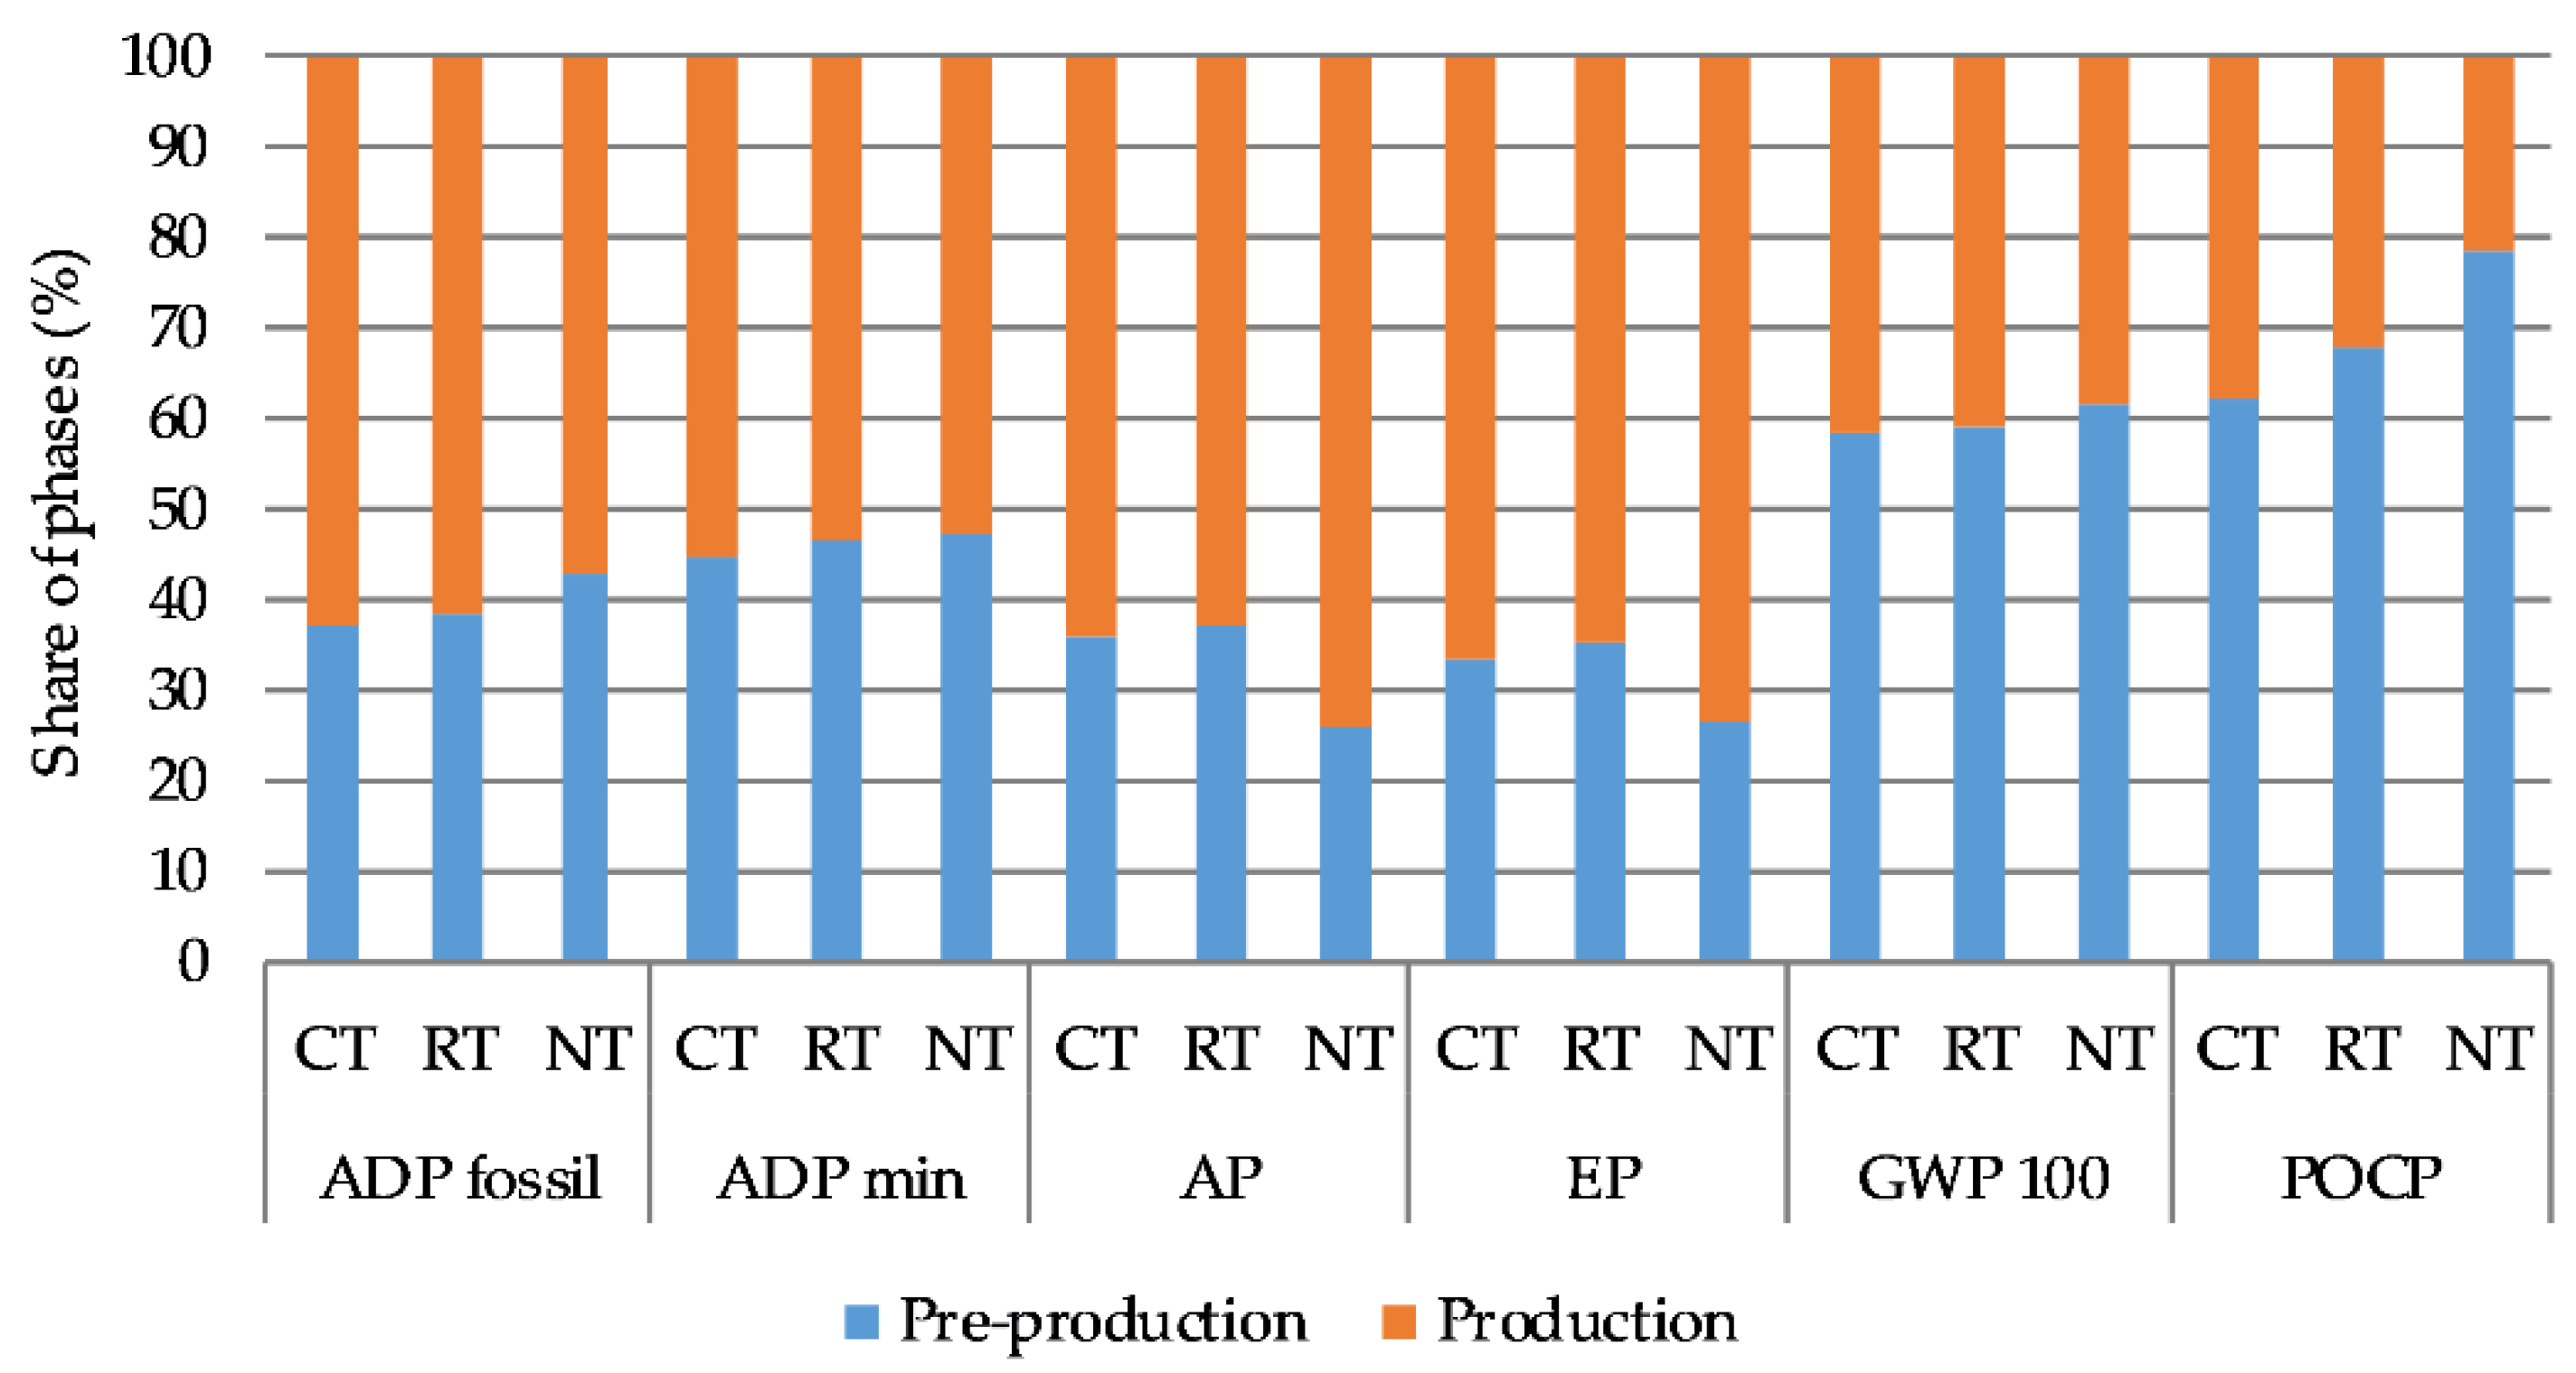
During the interpretation phase, a sensitivity analysis was performed by varying each key input parameter one-at-a-time by 5 percent of its original value and conclusions were drawn.

3. Results

The results of the assessment of the environmental impacts of wheat production in three tillage systems in relation to 1 kg of grain are presented in Table 6. Higher impacts were noted in wheat cultivated under tillage systems without ploughing. The highest values of abiotic depletion potential for fossil fuel (ADP fossil), abiotic depletion potential for minerals (ADP min), and photochemical ozone creation potential (POCP) were found in RT. The greatest acidification potential (AP), eutrophication potential (EP), and global warming potential (GWP 100) occurred in NT. However, differences in impacts between the tillage systems were minor.
Synthetic N fertilizers had the greatest impact on the formation of potential environmental impacts of wheat production among all inputs, independent of analysed soil tillage system (Figure 3). The AP, EP, and GWP 100 indicators were especially shaped by N fertilizers. For ADP fossil, GWP 100, and AP, the important contributor was also fuel. In the case of the EP indicator, the second biggest contributors after N fertilizers were P and K fertilizers. In turn, for POCP, besides mineral fertilizers, machinery and fuel also had a great impact.
As shown in Figure 4, the pre-production phase associated with the agricultural means of production contributed most to the total value of ADP fossil, ADP min, AP, and EP. The production phase on the farm was more dominant in shaping the GWP 100 and POCP indicators.
The aggregated environmental index for wheat production was higher in NT (1.47 × 10⁻¹³ and RT (1.31 × 10⁻¹³) in comparison with CT (1.06 × 10⁻¹³) (Figure 5). The environmental index was primarily influenced by ADP min and AP.
The sensitivity analysis of key input parameters showed that the ADP min of wheat in three tillage systems was the most sensitive to the change in the total amount of nitrogen (N) fertilizers applied (Figure 6). Varying the N fertilizer application rate by 5% resulted in a change of ADP min value by 2.4%, 1.9%, and 1.8% for NT, RT, and CT, respectively. Following the application of N fertilizers, consumption of plant protection products, application of phosphorus (P) and potassium (K) fertilizers, and the use of agricultural machinery were the most influential factors for ADP min. This indicator for wheat production in CT and RT was more sensitive to the use of plant protection products, as well as the use of machinery compared to NT. A change in P and K fertilizers’ application rate was more notable for the ADP min of wheat in RT and NT than in CT.
The application of N fertilizers ranked as the most influential factor for the AP of wheat production (Figure 7). An increase in N application rate by 5% led to a change of this indicator by 4.3% for NT and by 3.7% for both CT and RT. The second important factor for AP was the fuel, followed by phosphorus (P) and potassium (K) fertilizers. When fuel consumption varied by 5%, the value of the AP of wheat for both CT and RT changed by 0.5%, while it changed by 0.2% for NT. The AP indicator for wheat in RT was more sensitive to P and K fertilizer application rates compared to wheat in CT and NT.

4. Discussion

The results revealed that the environmental impacts of wheat production slightly differed depending on the tillage systems. The level of consumption of input materials and the crop output can help to explain differences in the environmental impacts between the tillage systems. According to Achten and Van Acker [46], one kg of wheat grain produced in Europe on average demands 3.25 MJ of nonrenewable, fossil energy, emits 0.61 to 0.65 kg CO2 eq., and triggers terrestrial acidification of 4.94 × 10⁻³ to 6.51 × 10⁻³ kg SO2 eq. In comparison with the presented results, the eutrophication potential for wheat cultivated in Swiss conditions was lower (equaled 5.42 × 10⁻⁴ kg PO4 eq. kg−1), whereas the photo-oxidant formation was higher (1.25 × 10⁻³ kg C2H4 eq. kg−1) [47]. In the recent study by Pishgar-Komleh et al. [29] in Poland, the sum of greenhouse gas (GHG) emissions per kg of wheat grain was higher (0.45 kg CO2 eq.) compared to our own results. In our study, the GWP 100 indicators of winter wheat production in RT and NT were found to be higher compared to wheat in CT. This difference could be explained mainly by higher nitrogen fertilization of wheat under RT and NT. In Denmark, the total GHG emissions for wheat production with uniform mineral fertilizer application rates in conventional tillage, reduced tillage, and no-tillage system scenarios amounted to 0.655 kg CO2 eq. kg−1, 0.589 kg CO2 eq. kg−1, and 0.628 kg CO2 eq. kg−1, respectively [48]. The change of the GHG emission between tillage systems was mainly caused by the reduced CO2 emission from carbon mineralization.
Besides the tillage system, another important aspect of the assessment of GHG emissions from crop production is crop residue management. The availability of crop residues on the field can lead to an increased level of soil organic carbon (SOC) sequestration. It should be noted that the SOC sequestration potential was not considered in this study. The inclusion of SOC sequestration in the assessment of GWP makes it possible to obtain a considerable reduction in the net impact of GWP associated with crop production [49]. The benefits of increased SOC sequestration in reduced tillage and no-tillage with crop residue returning, so-called conservation tillage, have been highlighted by many authors [50,51,52].
It was shown that N fertilization was the major contributor to the environmental impacts of the life cycle of wheat production independent of the tillage system. This is consistent with the findings of other authors [53,54,55]. As many studies show, the dominant part of the environmental impact of N fertilization could be associated with the application of N fertilizers resulting in the possible high values of N2O direct emissions on the field [56,57,58].
This study demonstrated that the pre-production phase contributed most to the analysed impacts, excluding GWP 100 and POCP, which depended mainly on the farm production. According to Charles et al. [47], production and delivery of mineral fertilizers are responsible for over 40% of the impact on energy consumption. Brock et al. [59] concluded that about 37% of the GWP came from the pre-farm production and transport of fertilizers.
The analysed wheat production systems showed a large impact on ADP min and AP. Similar results were also obtained by Baum and Bieńkowski [49]. Exclusive reliance of P and K fertilizers on mined raw material is regarded as a decisive factor in creating high ADP impacts of crop production. The role of these minerals in global natural resource utilization is especially emphasized in the CML method by ascribing to them relatively high values of characterisation factors [60]. Data on the type of N fertilizers collected during the study (data not presented) showed high frequency in the use of ammonium nitrate, urea ammonium nitrate solutions, and urea, which, via the emission–deposition–nitrification NH3 route, may indirectly contribute to a higher potential for subsequent terrestrial acidification [61,62].

5. Conclusions

The main opportunities for improving the life cycle of wheat production include more efficient resource use in fertilizer production, choice of N type, and optimization of fertilizer application in the farm production phase. Shifting from conventional tillage to a tillage system without ploughing in wheat production can result in widely recognized benefits for soil properties, as well as reduced environmental burdens, but not to the level at which fertilizer application rates and consumption of other inputs are not higher than in the conventional tillage system. In the future, trying to accommodate the environmental assessment of wheat production into a wider concept of “integrated sustainability assessment” requires further studies that would take into account the impact of the economic performance of the life cycle of wheat production with different tillage systems.

Author Contributions

Conceptualization, M.H. and J.B.; methodology, M.H. and J.B.; formal analysis, M.H.; investigation, M.H. and J.B.; writing—original draft preparation, M.H.; writing—review and editing, M.H. and J.B.; visualization, M.H.; supervision, J.B.; project administration, M.H.; funding acquisition, M.H. All authors have read and agreed to the published version of the manuscript.

Funding

This research was funded by the National Science Centre, Poland, project no 2015/19/N/HS4/03031.

Acknowledgments

This study was made possible by a grant from the National Science Centre, Poland, Project: Environmental life cycle assessment and life cycle costing of grain crop production in different soil tillage systems. Project No. 2015/19/N/HS4/03031.

Conflicts of Interest

The authors declare no conflict of interest.

References

  1. Shiferaw, B.; Smale, M.; Braun, H.-J.; Duveiller, E.; Reynolds, M.; Muricho, G. Crops that feed the world 10. Past successes and future challenges to the role played by wheat in global food security. Food Sec. 2013, 5, 291–317. [Google Scholar] [CrossRef] [Green Version]
  2. Food and Agriculture Organization of the United Nations (FAO). World Food and Agriculture. Statistical Pocketbook 2019; FAO: Rome, Italy, 2019; ISBN 978-92-5-131849-2. [Google Scholar]
  3. Statistics Poland. Production of Agricultural and Horticultural Crops in 2019; Statistics Poland: Warsaw, Poland, 2019. [Google Scholar]
  4. Eurostat. Available online: https://ec.europa.eu/eurostat/databrowser/view/tag00047/default/bar?lang=en (accessed on 10 May 2020).
  5. Eurostat. Agri-Environmental Indicator-Greenhouse Gas Emissions. Statistics Explained. 2019. Available online: https://ec.europa.eu/eurostat/statistics-explained/index.php?title=Agri-environmental_indicators (accessed on 10 December 2019).
  6. Morris, N.; Miller, P.; Orson, J.H.; Froud-Williams, R. The adoption of non-inversion tillage systems in the United Kingdom and the agronomic impact on soil, crops and the environment—A review. Soil Till. Res. 2010, 108, 1–15. [Google Scholar] [CrossRef]
  7. Romaneckas, K.; Avižienytė, D.; Bogužas, V.; Šarauskis, E.; Jasinskas, A.; Marks, M. Impact of tillage systems on chemical, biochemical and biological composition of soil. J. Elem. 2016, 21, 513–526. [Google Scholar] [CrossRef] [Green Version]
  8. Gajda, A.M.; Czyż, E.A.; Stanek-Tarkowska, J.; Furtak, K.M.; Grządziel, J. Effects of long-term tillage practices on the quality of soil under winter wheat. Plant Soil Environ. 2017, 63, 236–242. [Google Scholar] [CrossRef] [Green Version]
  9. Woźniak, A. Chemical properties and enzyme activity of soil as affected by tillage system and previous crop. Agriculture 2019, 9, 262. [Google Scholar] [CrossRef] [Green Version]
  10. Nunes, M.R.; Karlen, D.L.; Moorman, T.B. Tillage intensity effects on soil structure indicators—A US meta-analysis. Sustainability 2020, 12, 2071. [Google Scholar] [CrossRef] [Green Version]
  11. Pikuła, D. Environmental aspects of managing the organic matter in agriculture. Econ. Reg. Stud. 2015, 8, 98–112. [Google Scholar]
  12. European Environment Agency (EEA). Climate Change Adaptation in the Agriculture Sector in Europe. Available online: https://www.eea.europa.eu/publications/cc-adaptation-agriculture (accessed on 10 September 2019).
  13. Šimon, T.; Javurek, M.; Mikanová, O.; Vach, M. The influence of tillage systems on soil organic matter and soil hydrophobicity. Soil Till. Res. 2009, 105, 44–48. [Google Scholar] [CrossRef]
  14. Sapkota, T.B.; Mazzoncini, M.; Bàrberi, P.; Antichi, D.; Silvestri, N. Fifteen years of no till increase soil organic matter, microbial biomass and arthropod diversity in cover crop-based arable cropping systems. Agron. Sustain. Dev. 2012, 32, 853–863. [Google Scholar] [CrossRef]
  15. Małecka-Jankowiak, I.; Blecharczyk, A.; Swędrzyńska, D.; Sawińska, Z.; Piechota, T. The effect of long-term tillage systems on some soil properties and yield of pea (Pisum sativum L.). Acta Sci. Pol. Agricultura 2016, 15, 37–50. [Google Scholar]
  16. Holland, J.M. The environmental consequences of adopting conservation tillage in Europe: Reviewing the evidence. Agric. Ecosyst. Environ. 2004, 103, 1–25. [Google Scholar] [CrossRef]
  17. Busari, M.; Kukal, S.; Kaur, A.; Bhatt, R.; Dulazi, A. Conservation tillage impacts on soil, crop and the environment. Int. Soil Water Conserv. Res. 2015, 3, 119–129. [Google Scholar] [CrossRef] [Green Version]
  18. Haliniarz, M.; Gawęda, D.; Bujak, K.; Frant, M.; Kwiatkowski, C. Yield of winter wheat depending on the tillage system and level of mineral fertilization. Acta Sci. Pol. Agricultura 2013, 12, 59–72. [Google Scholar]
  19. Małecka, I.; Blecharczyk, A.; Sawińska, Z.; Swędrzyńska, D.; Piechota, T. Winter wheat yield and soil properties response to long-term non-inversion tillage. J. Agric. Sci. Tech. 2015, 17, 1571–1584. [Google Scholar]
  20. Panasiewicz, K.; Faligowska, A.; Szymańska, G.; Szukała, J.; Ratajczak, K.; Sulewska, H. The effect of various tillage systems on productivity of narrow-leaved lupin-winter wheat-winter triticale-winter barley rotation. Agronomy 2020, 10, 304. [Google Scholar] [CrossRef] [Green Version]
  21. Soane, B.; Ball, B.; Arvidsson, J.; Basch, G.; Moreno, F.; Roger-Estrade, J. No-till in northern, western and south western Europe: A review of problems and opportunities for crop production and the environment. Soil Till. Res. 2012, 118, 66–87. [Google Scholar] [CrossRef] [Green Version]
  22. Pittelkow, M.C.; Linquist, A.B.; Lundy, E.M.; Liang, X.; Groenigen, J.; Lee, J.; van Gestel, N.; Six, J.; Venterea, R.T.; van Kessel, C. When does no-till yield more? A global meta-analysis. Field Crops Res. 2015, 183, 156–168. [Google Scholar] [CrossRef] [Green Version]
  23. Caffrey, K.R.; Veal, M.V. Conducting an agricultural life cycle assessment: Challenges and perspectives. Sci. World J. 2013, 472431:1–472431:13. [Google Scholar] [CrossRef] [Green Version]
  24. Dijkman, T.J.; Basset-Mens, C.; Antón, A.; Nunez, M. LCA of food and agriculture. In Life Cycle Assessment: Theory and Pratice; Hauschild, M.Z., Rosenbaum, R.K., Olsen, S.I., Eds.; Springer International Publishing AG: Cham, Switzerland, 2018; pp. 723–754. [Google Scholar]
  25. Brentrup, F.; Küsters, J.; Kuhlmann, H.; Lammel, J. Environmental impact assessment of agricultural production systems using the life cycle assessment methodology: I. Theoretical concept of a LCA method tailored to crop production. Eur. J. Agron. 2004, 20, 247–264. [Google Scholar] [CrossRef]
  26. Hayashi, K.; Gaillard, G.; Nemecek, T. Life cycle assessment of agricultural production systems: Current issues and future perspectives. In Proceedings of the International Seminar on Technology Development for Good Agriculture Practice (GAP) in Asia and Oceania, Epochal Tsukuba, Japan, 25–26 October 2005; Hu, S.H., Bejosano-Gloria, C., Eds.; Food and Fertilizer Technology Center: Taipei, Taiwan, 2006; pp. 98–110. [Google Scholar]
  27. Holka, M.; Jankowiak, J.; Bieńkowski, J.F.; Dąbrowicz, R. Life cycle assessment (LCA) of winter wheat in an intensive crop production system in Wielkopolska region (Poland). Appl. Ecol. Environ. Res. 2016, 14, 535–545. [Google Scholar] [CrossRef]
  28. Syp, A.; Faber, A.; Borzęcka, M.; Osuch, D. Assessment of greenhouse gas emissions in winter wheat farms using data envelopment analysis approach. Pol. J. Environ. Stud. 2015, 24, 2197–2203. [Google Scholar] [CrossRef]
  29. Pishgar-Komleh, S.H.; Żyłowski, T.; Rozakis, S.; Kozyra, J. Efficiency under different methods for incorporating undesirable outputs in an LCA+DEA framework: A case study of winter wheat production in Poland. J. Environ. Manag. 2020, 260, 110138:1–110138:10. [Google Scholar] [CrossRef]
  30. Markuszewska, I. Intensification or extensification of Polish agriculture?—In searching of directions of changes. A case study: The North-Western Region of Poland. J. Agribus. Rural Dev. 2015, 1, 67–73. [Google Scholar] [CrossRef]
  31. International Organization for Standardization (ISO). ISO 14040:2006. Environmental Management–Life Cycle Assessment–Principles and Framework; International Organization for Standardization: Geneva, Switzerland, 2006. [Google Scholar]
  32. International Organization for Standardization (ISO). ISO 14044:2006. Environmental Management—Life Cycle Assessment—Requirements and Guidelines; International Organization for Standardization: Geneva, Switzerland, 2006. [Google Scholar]
  33. Ecoinvent Center Ecoinvent Database Website. Available online: http://www.ecoinvent.ch/ (accessed on 20 September 2019).
  34. European Environment Agency (EEA). EMEP/EEA Air Pollutant Emission Inventory Guidebook 2013; Publications Office of the European Union: Luxembourg, 2013; ISBN 978-92-9213-403-7. [Google Scholar]
  35. Intergovernmental Panel on Climate Change (IPCC). 2006 IPCC Guidelines for National Greenhouse Gas Inventories. Volume 2 Energy. Task Force on National Greenhouse Gas Inventories. Available online: http://www.ipcc-nggip.iges.or.jp/public/2006gl/vol2.html (accessed on 20 September 2019).
  36. Van Beek, C.L.; Brouwer, L.; Oenema, O. The use of farmgate balances and soil surface balances as estimator for nitrogen leaching to surface water. Nutr. Cycl. Agroecosyst 2003, 67, 233–244. [Google Scholar] [CrossRef]
  37. Dijkman, T.J.; Birkved, M.; Hauschild, M.Z. PestLCI 2.0: A second generation model for estimating emissions of pesticides from arable land in LCA. Int. J. Life Cycle Assess. 2012, 17, 973–986. [Google Scholar] [CrossRef]
  38. European Environment Agency (EEA). EMEP/EEA Air Pollutant Emission Inventory Guidebook 2016; Publications Office of the European Union: Luxembourg, 2016; ISBN 978-92-9213-806-6. [Google Scholar]
  39. Intergovernmental Panel on Climate Change (IPCC). Climate Change 2007: The Physical Science Basis. In Contribution of Working Group I to the Fourth Assessment Report of the Intergovernmental Panel on Climate Change; Solomon, S., Qin, D., Manning, M., Chen, Z., Marquis, M., Averyt, K.B., Tignor, M., Miller, H.L., Jr., Eds.; Cambridge University Press: Cambridge, UK; New York, NY, USA, 2007; p. 996. [Google Scholar]
  40. Van Oers, L.; De Koning, A.; Guinée, J.B.; Huppes, G. Abiotic Resource Depletion in LCA. Improving Characterisation Factors for Abiotic Resource Depletion as Recommended in the New Dutch LCA Handbook; RWS-DWW: Delft, the Netherlands, 2002; Available online: http://www.leidenuniv.nl/cml/ssp/projects/lca2/report_abiotic_depletion_web.pdf (accessed on 10 May 2020).
  41. Huijbregts, M.A.J.; Verkuijlen, S.W.E.; Heijungs, R.; Reijnders, L. Spatially explicit characterization of acidifying and eutrophying air pollution in life-cycle assessment. J. Ind. Ecol. 2001, 4, 75–92. [Google Scholar] [CrossRef]
  42. Andersson-Sköld, Y.; Grennfelt, P.; Pleijel, K. Photochemical ozone creation potentials: A study of different concepts. J. Air Waste Manag. Assoc. 1992, 42, 1152–1158. [Google Scholar] [CrossRef]
  43. Derwent, R.G.; Jenkin, M.E.; Saunders, S.M.; Pilling, M.J. Photochemical ozone creation potentials for organic compounds in Northwest Europe calculated with a master chemical mechanism. Atmos. Environ. 1998, 32, 2429–2441. [Google Scholar] [CrossRef]
  44. Guinée, J.B.; Gorrée, M.; Heijungs, R.; Huppes, G.; Kleijn, R.; de Koning, A.; van Oers, L.; Wegener Sleeswijk, A.; Suh, S.; Udo de Haes, H.A.; et al. Handbook on Life Cycle Assessment. Operational Guide to the ISO Standards. I: LCA in Perspective. IIa: Guide. IIb: Operational Annex. III: Scientific Background; Kluwer Academic Publishers: Dordrecht, the Netherlands, 2002. [Google Scholar]
  45. Sleeswijk, A.W.; van Oers, L.F.C.M.; Guinée, J.B.; Struijs, J.; Huijbregts, M.A.J. Normalisation in product life cycle assessment: An LCA of the global and European economic systems in the year 2000. Sci. Total Environ. 2008, 390, 227–240. [Google Scholar] [CrossRef]
  46. Achten, W.M.J.; Van Acker, K. EU-average impacts of wheat production. A meta-analysis of life cycle assessments. J. Ind. Ecol. 2015, 20, 132–144. [Google Scholar] [CrossRef]
  47. Charles, R.; Jolliet, O.; Gaillard, G.; Pellet, D. Environmental analysis of intensity level in wheat crop production using life cycle assessment. Agric. Ecosyst. Environ. 2006, 113, 216–225. [Google Scholar] [CrossRef]
  48. Sørensen, C.G.; Halberg, N.; Oudshoorn, F.W.; Petersen, B.M.; Dalgaard, R. Energy inputs and GHG emissions of tillage systems. Biosyst. Eng. 2014, 120, 2–14. [Google Scholar] [CrossRef]
  49. Baum, R.; Bieńkowski, J. Eco-efficiency in measuring the sustainable production of agricultural crops. Sustainability 2020, 12, 1418. [Google Scholar] [CrossRef] [Green Version]
  50. Aryal, J.P.; Sapkota, T.B.; Jat, M.L.; Bishnoi, D.K. On-farm economic and environmental impact of zero-tillage wheat: A case of North-West India. Exp. Agric. 2014, 51, 1–16. [Google Scholar] [CrossRef] [Green Version]
  51. Lu, X.; Lu, X.; Liao, Y. Conservation tillage increases carbon sequestration of winter wheat-summer maize farmland on Loess Plateau in China. PLoS ONE 2018, 13, e0199846:1–e0199846:16. [Google Scholar] [CrossRef]
  52. Memon, M.S.; Guo, J.; Tagar, A.A.; Perveen, N.; Ji, C.; Memon, S.A.; Memon, N. The effects of tillage and straw incorporation on soil organic carbon status, rice crop productivity, and sustainability in the rice-wheat cropping system of eastern China. Sustainability 2018, 10, 961. [Google Scholar] [CrossRef] [Green Version]
  53. Simmons, A.; Muir, S.; Brock, P.; Herridge, D. Life cycle assessment of grain cropping. In Proceedings of the 17th ASA Conference, Hobart, Australia, 21–24 September 2015; Acuña, T., Moeller, C., Parsons, D., Harrison, M., Eds.; ASA Inc.: Warragul, Australia, 2015; pp. 131–134. [Google Scholar]
  54. Yan, M.; Cheng, K.; Luo, T.; Yan, Y.; Pan, G.; Rees, R.M. Carbon footprint of grain crop production in China-based on farm survey data. J. Clean. Prod. 2015, 104, 130–138. [Google Scholar] [CrossRef]
  55. Romeiko, X.X. A comparative life cycle assessment of crop systems irrigated with the groundwater and reclaimed water in Northern China. Sustainability 2019, 11, 2743. [Google Scholar] [CrossRef] [Green Version]
  56. Brentrup, F. Life cycle assessment of crop production. In Green Technologies in Food Production and Processing; Boye, J.I., Arcand, Y., Eds.; Springer: Boston, MA, USA, 2012; pp. 61–82. ISBN 978-1-4614-1587-9. [Google Scholar]
  57. Fallahpour, F.; Aminghafouri, A.; Ghalegolab Behbahani, A.; Bannayan, M. The environmental impact assessment of wheat and barley production by using life cycle assessment (LCA) methodology. Environ. Dev. Sustain. 2012, 14, 979–992. [Google Scholar] [CrossRef]
  58. Tuomisto, H.; Hodge, I.; Riordan, P.; Macdonald, D. Comparing global warming potential, energy use and land use of organic, conventional and integrated winter wheat production. Ann. Appl. Biol. 2012, 161, 116–126. [Google Scholar] [CrossRef]
  59. Brock, P.; Madden, P.; Schwenke, G.; Herridge, D. Greenhouse gas emissions profile for 1 tonne of wheat produced in Central Zone (East) New South Wales: A life cycle assessment approach. Crop Pasture Sci. 2012, 63, 319–329. [Google Scholar] [CrossRef]
  60. Brentrup, F.; Küsters, J.; Lammel, J.; Kuhlmann, H. Impact assessment of abiotic resource consumption conceptual considerations. Int. J. Life Cycle Assess. 2002, 7, 301–307. [Google Scholar] [CrossRef]
  61. Brentrup, F.; Küsters, J.; Lammel, J.; Barraclough, P.; Kuhlmann, H. Environmental impact assessment of agricultural production systems using the life cycle assessment (LCA) methodology II. The application to N fertilizer use in winter wheat production systems. Eur. J. Agron. 2004, 20, 265–279. [Google Scholar] [CrossRef]
  62. Skowrońska, M.; Filipek, T. Life cycle assessment of fertilizers: A review. Int. Agrophysics 2014, 28, 101–110. [Google Scholar] [CrossRef]
Figure 1. Location of the study region in Poland.
Agronomy 10 01303 g001
Figure 2. Boundary system for the life cycle assessment (LCA) of the winter wheat production.
Agronomy 10 01303 g002
Figure 3. Contribution of the category inputs to the environmental impacts of winter wheat production in conventional tillage (CT), reduced tillage (RT), and no-tillage (NT). ADP fossil, abiotic resources depletion potential for fossil fuels; ADP min, abiotic resources depletion potential for minerals; AP, acidification potential; EP, eutrophication potential; GWP 100, global warming potential; POCP, photochemical ozone creation potential.
Agronomy 10 01303 g003
Figure 4. Contribution of the life cycle phases to the environmental impacts of winter wheat production in conventional tillage (CT), reduced tillage (RT), and no-tillage (NT). Abbreviations as in Figure 3.
Agronomy 10 01303 g004
Figure 5. Aggregated environmental indicator values: abiotic resources depletion potential for fossil fuels (ADP fossil), abiotic resources depletion potential for minerals (ADP min), acidification potential (AP), eutrophication potential (EP), global warming potential (GWP 100), photochemical ozone creation potential (POCP) per 1 kg of grain in winter wheat production for different tillage systems.
Agronomy 10 01303 g005
Figure 6. The sensitivity analysis of input parameters for the abiotic resources depletion potential for minerals of the winter wheat production in conventional tillage (CT), reduced tillage (RT), and no-tillage (NT).
Agronomy 10 01303 g006
Figure 7. The sensitivity analysis of input parameters for the acidification potential of the winter wheat production in conventional tillage (CT), reduced tillage (RT), and no-tillage (NT).
Agronomy 10 01303 g007
Table 1. Utilized agricultural area (UAA) and location of the studied farms with wheat production in conventional tillage (CT), reduced tillage (RT), and no-tillage (NT) systems.
Farm NumberTillage SystemUAA (ha)VoivodeshipDistrictCommune
1CT7.84WielkopolskaKaliszCeków
2CT73.06WielkopolskaKościanKrzywiń
3CT30.21WielkopolskaKrotoszynKoźmin Wielkopolski
4CT38.44WielkopolskaLesznoRydzyna
5CT26.84WielkopolskaWolsztynSiedlec
6RT105.55WielkopolskaKoninKleczew
7RT98.69WielkopolskaMiędzychódMiędzychód
8RT101.52WielkopolskaMiędzychódSieraków
9RT18.53WielkopolskaOstrówNowe Skalmierzyce
10RT156.33WielkopolskaWrześniaKołaczkowo
11NT372.00WielkopolskaGostyńBorek Wielkopolski
12NT165.63WielkopolskaKołoChodów
13NT44.50WielkopolskaOstrówRaszków
14NT975.00WielkopolskaSzamotułySzamotuły
15NT51.00WielkopolskaWągrowiecWągrowiec
Table 2. Characteristics of tillage practices for winter wheat production under conventional tillage (CT), reduced tillage (RT), and no-tillage (NT) systems of the studied farms.
Tillage SystemTillage Practices
CTSkimming, harrowing, ploughing to a depth of 25–30 cm, seedbed preparation with a cultivating aggregate, followed by the use of a sowing machine.
RTPost-harvest tillage using implements such as a stubble cultivator or disc harrow to a depth of 10–20 cm, and the use of cultivating and sowing aggregate.
NTSowing directly into the untilled soil, which has retained the previous crop residues, using a direct seed drill.
Table 3. Production characteristics of winter wheat cultivation under conventional tillage (CT), reduced tillage (RT), and no-tillage (NT) systems of the studied farms (averages from the study years with min–max range in parentheses).
SpecificationTillage System
CTRTNT
Winter wheat sowing area, ha8.3 (2.3–21.0)21.6 (1.3–44.9)75.0 (2.0–260.0)
Grain wheat yield, Mg ha−17.6 (5.8–9.4)6.9 (5.4–9.4)6.6 (5.3–9.0)
N fertilization, kg N ha−1117.6 (78.8–160.8)130.1 (66.0–214.4)147.2 (82.0–269.4)
P fertilization kg P2O5 ha−126.6 (0–46.0)48.0 (0–80.0)33.4 (0–60.0)
K fertilization, kg K2O ha−135.6 (0–60.0)99.3 (56.0–129.0)104.5 (0–287.0)
Herbicides, kg a.s. ha−11.32 (0.05–2.91)0.88 (0.03–2.52)0.52 (0.06–1.50)
Fungicides, kg a.s. ha−10.60 (0.01–1.23)0.63 (0.40–0.93)0.57 (0.22–0.95)
Insecticides, kg a.s. ha−10.06 (0–0.20)0.10 (0–0.20)0.04 (0–0.20)
Growth regulators, kg a.s. ha−10.05 (0–0.29)0.55 (0–1.45)0.30 (0–1.13)
N, nitrogen; P, phosphorus, K, potassium; a.s., active substance.
Table 4. Data sources for the life cycle inventory of the background processes and quantification of emissions from the foreground processes.
ProcessReferences
Production of seeds[33]
Production of agrochemicals[33]
Production and use of agricultural machinery[33]
Use of mineral fertilizers[34,35,36]
Use of plant protection products[37]
Fuel combustion[38]
Crop residue management[39]
Table 5. Selected impact category indicators for the Life Cycle Impact Assessment (LCIA).
Impact Category IndicatorAbbreviationUnitMethodologyReferences
Abiotic depletion potential for fossil fuelADP fossilMJCML 2001[40]
Abiotic depletion potential for mineralsADP minkg Sb eq.CML 2001[40]
Acidification potentialAPkg SO2 eq.CML 2001[41]
Eutrophication potentialEPkg PO4 eq.CML 2001[41]
Global warming potential for time horizon of 100 yearsGWP 100kg CO2 eq.CML 2001[39]
Photochemical ozone creation potentialPOCPkg C2H4 eq.CML 2001[42,43]
Table 6. Values of impact category indicators of the winter wheat production under conventional tillage (CT), reduced tillage (RT), and no-tillage (NT) systems per functional unit of 1 kg of grain.
Impact Category IndicatorTillage System
CTRTNT
ADP fossil, MJ kg−12.172.732.48
ADP min, kg Sb eq. kg−11.58 × 10−61.87 × 10−61.77 × 10⁻⁶
AP, kg SO2 eq. kg−12.72 × 10−33.47 × 10−35.14 × 10⁻³
EP, kg PO4 eq. kg−11.16 × 10−31.47 × 10−31.89 × 10⁻³
GWP 100, kg CO2 eq. kg−10.310.390.40
POCP, kg C2H4 eq. kg−15.19 × 10−56.73 × 10−56.19 × 10⁻⁵
ADP fossil, abiotic resources depletion potential for fossil fuels; ADP min, abiotic resources depletion potential for minerals; AP, acidification potential; EP, eutrophication potential; GWP 100, global warming potential; POCP, photochemical ozone creation potential.

