Article

Plant Functional Diversity, Climate and Grazer Type Regulate Soil Activity in Natural Grasslands

1
GAMES Group, Dept. HBJ, ETSEA, University of Lleida, 25003 Lleida, Spain
2
Laboratory of Functional Ecology and Global Change (ECOFUN), Forest Sciences Centre of Catalonia (CTFC), 25280 Solsona, Spain
3
Grupo Ecología y Medio Ambiente, Universidad Pública de Navarra (UPNA), 31006 Pamplona, Spain
4
Research Institute on Innovation and Sustainable Development in Food Chain (ISFood), Universidad Pública de Navarra, 31006 Pamplona, Spain
*
Author to whom correspondence should be addressed.
Agronomy 2020, 10(9), 1291; https://doi.org/10.3390/agronomy10091291
Submission received: 3 August 2020 / Revised: 24 August 2020 / Accepted: 25 August 2020 / Published: 31 August 2020

Abstract

:
Global change modifies vegetation composition in grasslands with shifts in plant functional types (PFT). Although changes in plant community composition imply changes in soil function, this relationship is not well understood. We investigated the relative importance of environmental (climatic, management and soil) variables and plant functional diversity (PFT composition and interactions) on soil activity and fertility along a climatic gradient. We collected samples of soil and PFT biomass (grasses, legumes, and non-legume forbs) in six extensively managed grasslands along a climatic gradient in the Northern Iberian Peninsula. Variation Partitioning Analysis showed that abiotic and management variables explained most of the global variability (96.5%) in soil activity and fertility; soil moisture and grazer type being the best predictors. PFT diversity accounted for 27% of the total variability, mostly in interaction with environmental factors. Diversity-Interaction models applied on each response variable revealed that PFT-evenness and pairwise interactions affected particularly the nitrogen cycle, enhancing microbial biomass nitrogen, dissolved organic nitrogen, total nitrogen, urease, phosphatase, and nitrification potential. Thus, soil activity and fertility were not only regulated by environmental variables, but also enhanced by PFT diversity. We underline that climate change-induced shifts in vegetation composition can alter greenhouse gas—related soil processes and eventually the feedback of the soil to the atmosphere.

1. Introduction

Rangelands, including natural and semi-natural grasslands, are among the largest ecosystems in the world [1] representing 26% of the global land surface area [2]. They provide a wide range of ecosystem services: livestock feed, soil carbon sequestration, preservation and enhancement of water quality, soil protection, and species conservation [3,4]. Grasslands are also among the most endangered ecosystems in the world [5], being highly vulnerable to global change factors, both land use (intensification or abandonment) and climate (warming and/or drought) changes. Changes in climate, land use, and management intensity alter plant community composition of grasslands [6,7,8]. Particularly, as a response to climate warming, shifts in the balance between forbs and sedges have been reported in mountain grassland ecosystems [9], and an increasing shrub encroachment was observed as a result of both climate change [10] and grazing abandonment [11].
Soil functions in grasslands, particularly in mountain areas, are expected to be highly affected by climate change [12], manifested by significant inter- and intra-annual variability in precipitation and temperature [13]. Such fluctuations could have drastic effects on soil activity and fertility—including microbial biomass, nitrification, and enzyme activity—and microbial communities, through changes in organic matter quality and supply from biomass, soil temperature, and soil hydrology [14]. Microbial biomass structures the soil and converts soil organic matter into nutrients available for plant uptake [15,16]. Since microbial biomass carbon and nitrogen (MBC and MBN, respectively) are regulated by soil moisture and temperature [17,18], any changes in these abiotic factors (warming and/or drought) can alter nutrient release as well as soil activity and fertility. Nitrification, in turn, is one of the key microbiological processes in the soil nitrogen (N) cycle which, in part, controls the form and availability of inorganic N, and hence determines ecosystem productivity [19]. Together with denitrification, it is also involved in processes of N-turnover and consequently nitrous oxide (N2O) production and emissions from soils [20]. Nitrification and denitrification processes are regulated mainly by temperature, soil moisture, input rates, and quality of plant residues, as well as C availability [21,22]. Subsequently, it is essential to assess the potential and rates of de/nitrification because any alteration of the underlying processes can have serious consequences on N2O emissions and thus on the feedback of the soil to the atmosphere. Enzyme activity (e.g., phosphatase, glucosidase, urease) is another important soil activity because it controls the availability of nutrients such as carbon, nitrogen and phosphorus, and the rate at which they are produced in the soil for microbial assimilation, which eventually also controls plant growth [23,24,25]. Because enzyme activity is highly sensitive to temperature and soil moisture, and because it is controlled by the quantity and activity of microbial biomass [26,27], any changes in abiotic factors and microbial biomass can have major consequences on nutrient availability and plant growth.
Besides climatic factors, soil functions are also affected by plant diversity [17,22], because plants determine the quantity and the quality of residues, soil organic matter, as well as soil structure [28]. Plant functional redundancy ensures community stability and maintains ecosystem functioning, including soil function and structure, in grasslands [29,30,31]. Thus, changes in plant community structure and composition may imply changes in soil function and structure [10,11,28]. Plant functional types (PFTs) have proved to be a useful tool for predicting soil processes related to the carbon (C), nitrogen (N), and phosphorus (P) cycles [32,33,34]. Additionally, a number of diversity models have been used to investigate the plant diversity effects on ecosystem processes [35,36,37] including the Diversity-Interaction Model [36,38,39]. The Diversity-Interaction Model improves the ability to address the effects of species richness, evenness and composition, separately, on ecosystem function and thus provides a better insight on the important aspects of the biodiversity—ecosystem function relationship. For instance, transgressive overyielding occurs when a mixed community has greater functioning than the best monoculture [39].
These models aim at providing a deeper understanding of the mechanisms behind the effects of plant diversity on ecosystem function, including soil processes and the feedbacks of plant-soil interactions. Several studies found that plant diversity effects on soil processes are driven by climate [40,41,42]. The relative contribution of climatic factors and PFT composition in the regulation of soil activity and fertility is however less well understood. Grasslands distributed along altitudinal gradients are characterized by strong shifts in climate across relatively close-by geographical areas. They thus provide ideal conditions to study the PFT diversity—climate effects on ecosystem processes.
The important role of temperature and soil moisture on soil processes is widely recognized, however, less is known about the role of local factors, particularly plant functional type diversity on soil activity. In order to disentangle the relative effects of large-scale climatic and management factors from the effects of PFT diversity factors on soil activity and fertility, in this study we ask the following questions: (i) are climatic factors the main drivers of soil activity and fertility across a wide environmental gradient?; (ii) are soil activity and fertility driven by PFT diversity factors in addition of other abiotic environmental factors?; (iii) are PFT diversity effects on soil fertility and activity modified by climatic and/or management effects, that is, is there an interaction between climatic/management and PFT diversity factors? Our hypotheses are: Due to the important role of temperature and soil moisture on soil processes, we hypothesize that (Hyp1) soil activity and fertility are driven by climatic factors, in particular those are enhanced in cool and wet compared to warm and dry grasslands. Because plants exert a strong influence on the belowground system, we hypothesize that (Hyp2) PFT diversity modifies soil activity and fertility in addition to climate and management factors. Finally, while several studies suggest that plant diversity effects on soil processes are driven by climate [40,41,42], we expect the climatic, management, and soil variables to modify the relationship between PFTs and soil activity and fertility (Hyp3).

2. Materials and Methods

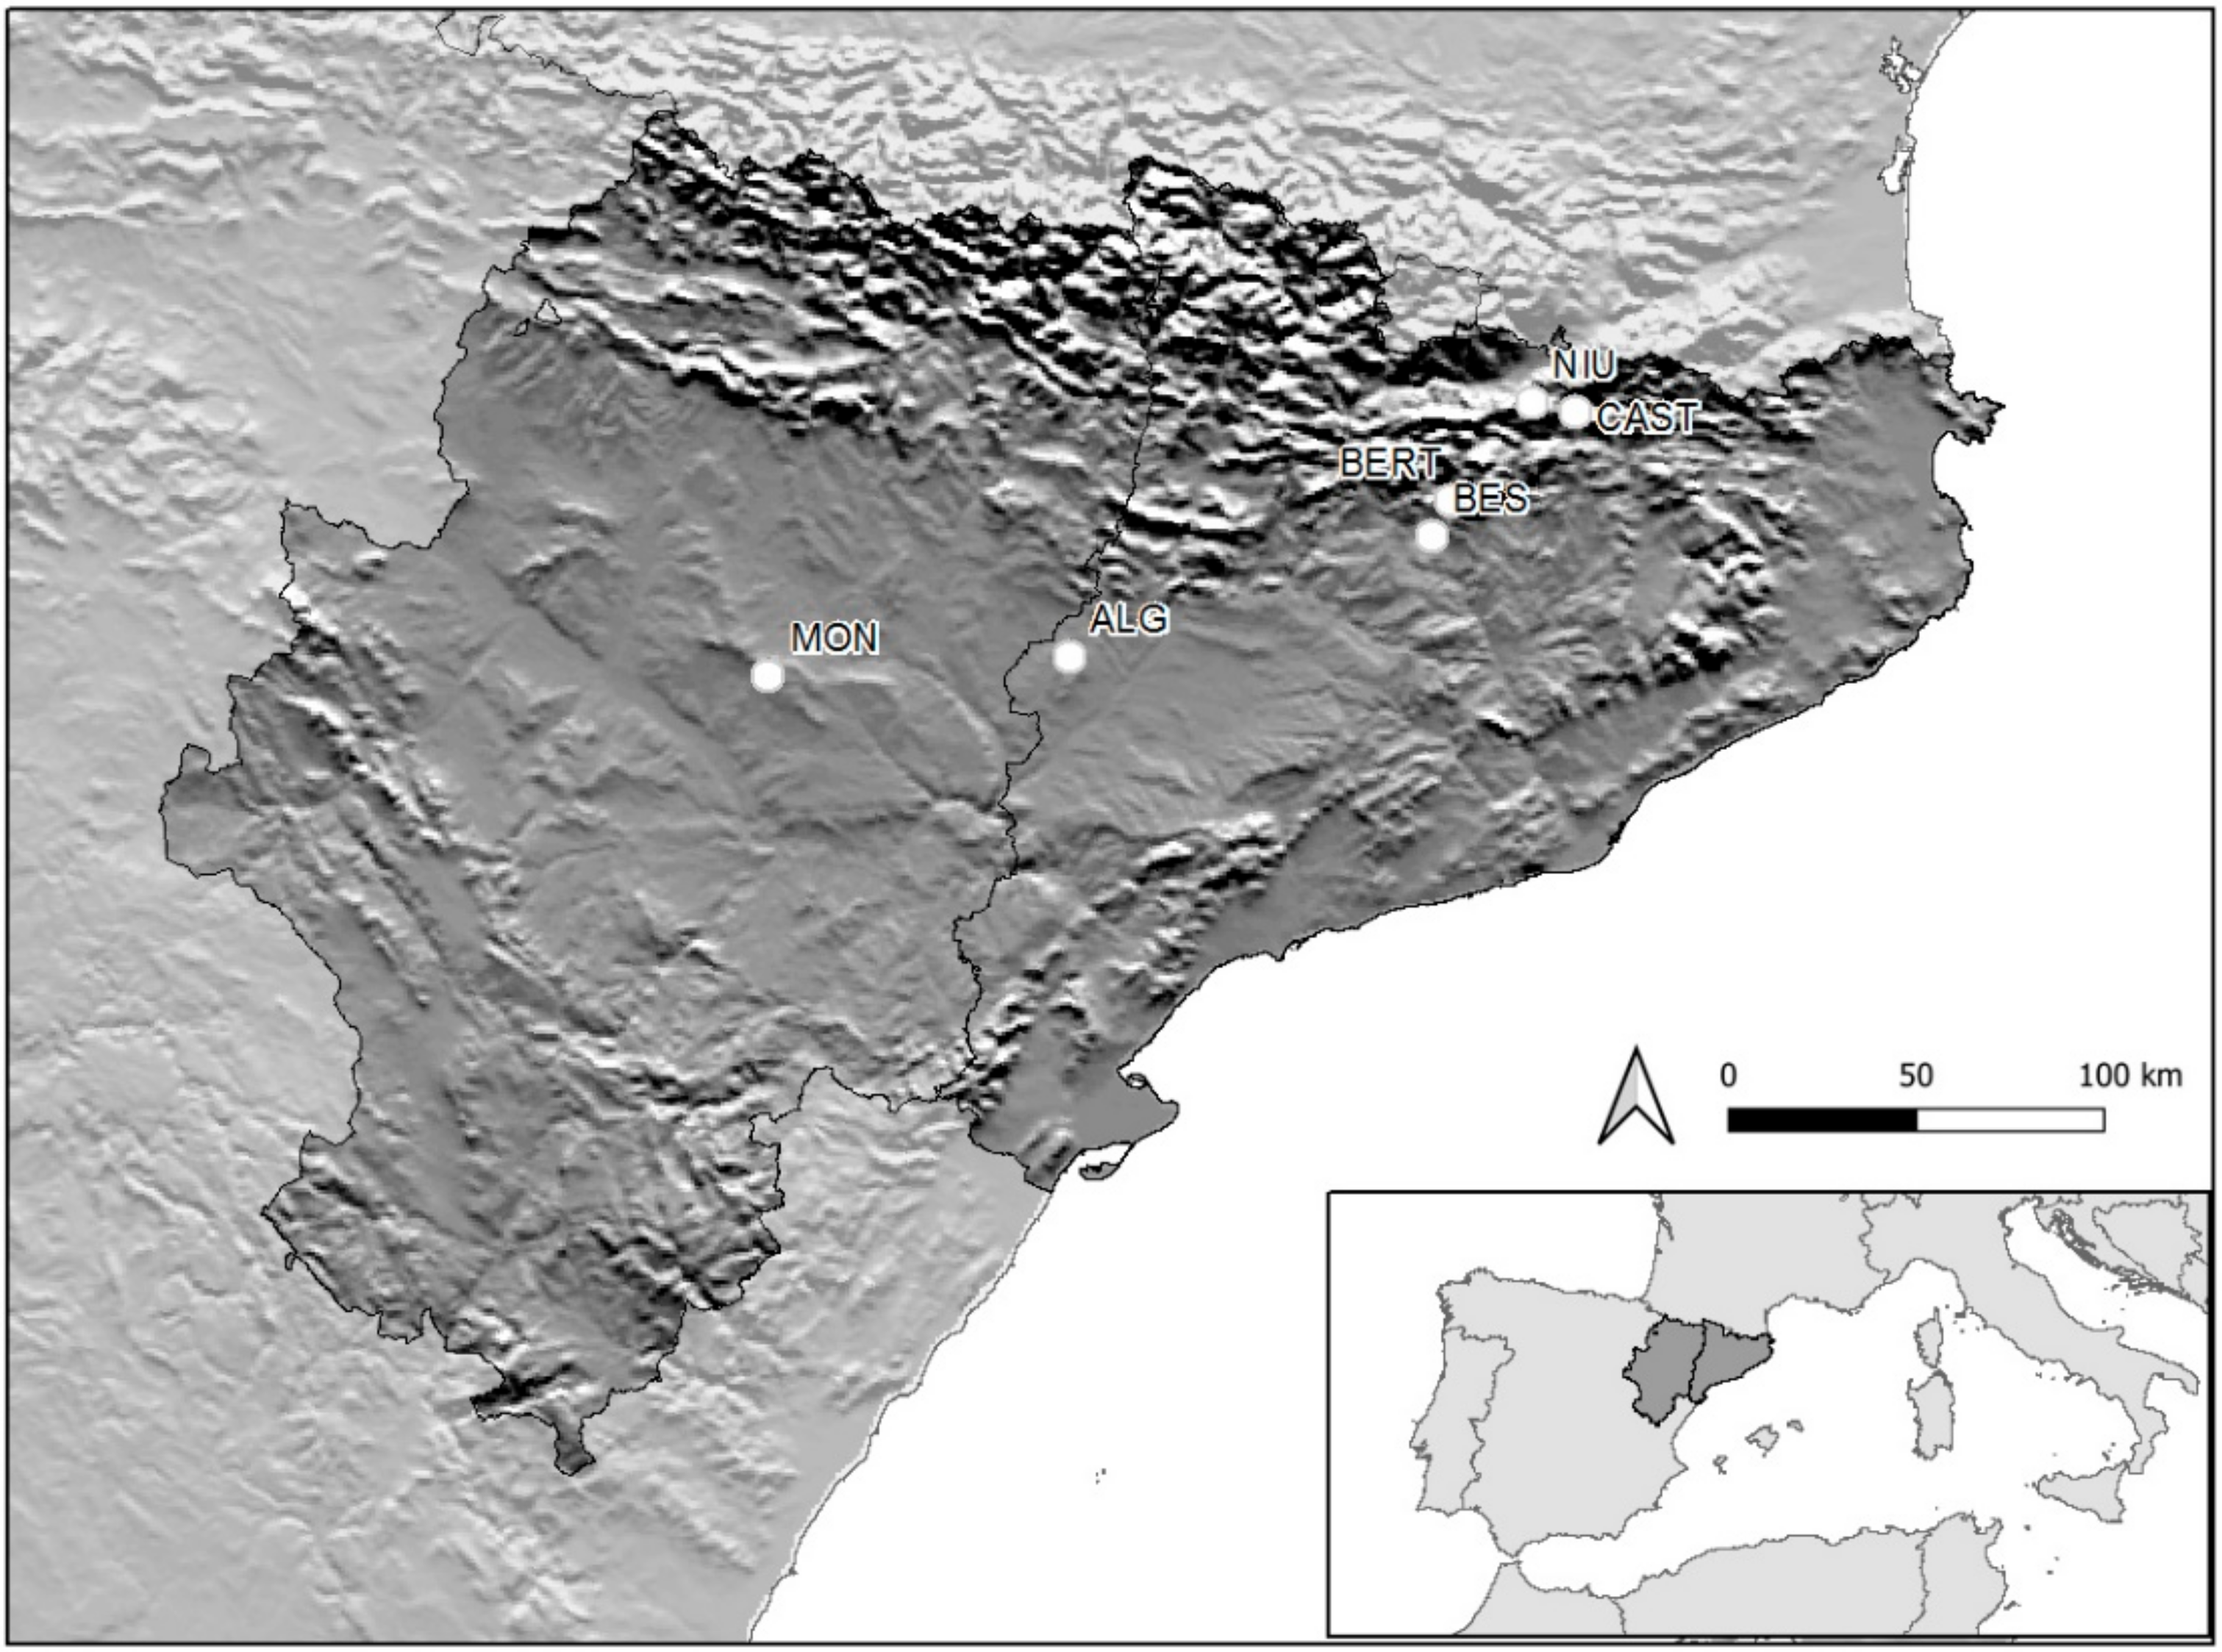
2.1. Site Description

The six study sites are located in the Northern Iberian Peninsula along a climatic gradient (Figure 1), ranging from semi-arid up to alpine grasslands with a low-intensity seasonal grazing. The six locations (Mongerillo, Alguaire, Besora, La Bertolina, Castellar de n’Hug, Niu de l’Àliga) have different climatic conditions, varying from warm continental in the low-altitude sites, to cold temperate conditions in the high-altitude sites, and different management conditions (climatic and management characteristics are summarized in Table 1). The climatic data were obtained from local climatic atlases [24,25,26,27], at a spatial resolution of 200 m per site. The choice of the climatic data presented in Table 1 was based on their relationship with temperature and soil moisture, which are known to be the main drivers of soil processes [17,43,44,45]. Most studied grasslands could be included within the phytosociological alliance Festuco-Brometea, including Brachypodietalia phoenicoidis in the lowland dry locations, and Brometalia erecti in the montane locations. Most of the studied grasslands are part of the phytosociological alliance Festuco-Brometea, including Brachypodietalia phoenicoidis in the lowland arid locations, and Brometalia erecti in the montane locations. At higher altitudes, we could find representatives of all the alliances. In the lowland, representatives of other alliances of arid grasslands were sometimes mixed with Brachypodietalia phoenicoidis [46,47].
All the grassland sites are dominated by grasses and forbs, including legumes and non-legumes. In Monegrillo (MON) and Alguaire (ALG), however, legumes were not dominant. ALG and MON are dominated by Plantago lanceolata L. and Papaver rhoeas L. Besora (BES) is dominated by Plantago lanceolata L. and Bromus hordeaceus L. La Bertolina (BERT) is dominated by Festuca arundinacea Schreb. and Trifolium repens L. Castellar de n’Hug (CAST) is dominated by Festuca nigrescens Lam. and Carex caryophyllea Latourr. Niu de l’Àliga (NIU) is dominated by Festuca nigrescens L. and Carex caryophyllea Latour. The percentage cover and thus the dominance of a species were visually estimated in all the study sites.
For assessing management regimes at the study sites, we conducted detailed surveys among farmers, shepherds, and land managers to confirm grazing management in the sampled areas. Grazing intensity was determined as livestock stocking rates measured as livestock unit per hectare (LU ha−1). Our study sites were all characterized by moderate grazing intensity. The difference in management between the study sites lied in the grazer type, therefore the latter was the only management variable considered in the study. Grazer type was categorized into three main types: sheep, cattle, and mixed grazing. Mixed grazing included associations comprising big and small livestock, mainly sheep and cattle, and more rarely horses (in NIU).

2.2. Study Design

We sampled soil and vegetation from six grassland sites along a climatic and altitudinal gradient (334 to 2479 m a.s.l.) in the Northern Iberian Peninsula. The sampling was carried out in 2014 for the six study sites, at above-ground peak season live biomass of vegetation, when there is the maximum live biomass and vegetation activity (May in the semi-arid and montane sites, and June in the subalpine and alpines sites). The sampling points were spread over a grid on the grassland, covering an area of about 50–70 m radius, with a minimum distance of 2 m between one another (Figure S1 in Supplementary Materials). Within this grid, we selected patches where a given plant functional type was visually abundant. The fact that in all patches there was a representation of the main PFTs provided an array of proportions for each PFT, facilitating modelling. The sampling points represent the typically dominant plant functional types (PFT) in these grasslands—grasses, legumes, and non-legume forbs—with three replicates per PFT. In total, we sampled nine points in each study site by placing cylinders (height = 8 cm; diameter = 25 cm) 3 cm deep into the ground. In ALG and MON, we placed six cylinders (grasses and forbs) only because legumes were rare at the peak of vegetation growth. To analyze aboveground biomass, we cut the vegetation inside each cylinder at ground level. For soil analyses, we extracted soil cores of approximately 250 g from the upper soil layer (0–10 cm), without the litter, in each cylinder. Both soil and vegetation samples were extracted from the same cylinders, hence we collected a total of nine vegetation and nine soil samples from each study site, except for ALG and MON where we had six sampling points for each. We placed all collected samples in a dark cooling portable refrigerator to preserve them until arrival to the laboratory.

2.3. Vegetation and Soil Analyses

Once in the laboratory, we separated the vegetation samples into plant functional types, and into live and dead biomass components. We placed the samples in the oven at 60 °C for 48 h to obtain the dry weight of each PFT, and we calculated afterwards the relative contribution of each PFT component per sample. We then calculated PFT pairwise interaction effects (effects emerging from positive, negative or neutral interactions between every pair of PFTs), based on Kirwan et al. 2007 [36]: Pi Pj. For a community strongly dominated by one PFT, at least one of the p values in each Pi Pj pair will be small so its evenness will be close to zero. We also calculated PFT evenness (assuming that all PFT interactions have similar effects).through the mean interaction diversity term (ek) according to Kirwan et al. 2007 [36]: ek = (2s/s − 1) i s Pi   Pj , which lies between 0 for monocultures and 1 for a community in which all PFTs are equally represented. The multiplier (2s/(s − 1)) is introduced to ensure that the values of ek lie between 0 and 1. Pi is the sown relative abundance of the ith PFT and s refers to the number of PFTs in a community.
Soil fertility variables included the variables related to nutrients in the soil: dissolved organic carbon (DOC), dissolved organic nitrogen (DON), nitrification potential, ammonium, nitrate, and total N. Soil activity variables involved soil enzyme activities: β-glucosidase, phosphatase, and urease. Ammonium and nitrate pools were determined in 2M KCl extractions by a segmented flow analyzer AA3 (Braun+Luebbe, Norderstedt, Germany) and microbial biomass C and N (MBC and MBN, respectively), DOC and DON), and nitrification potential as described in San Emeterio et al. 2016 [48]. Soil moisture was measured by the gravimetric method according to Black 1965 [49]. Soil enzyme activities, which reflect soil activity, were determined in homogenized and sieved (2 mm) soils. We measured β- glucosidase and acid phosphatase activities using a 96-well microplate approach [50,51], based on p-nitrophenol release after breaking up a synthetic substrate (p-nitrophenyl glucoside and p-nitrophenyl phosphate, respectively) and following San Emeterio et al. 2016 [48]. We measured urease activity following the method by Kandeler and Gerber 1988 [52], modified by Rodríguez-Loinaz et al. 2008 [53].

2.4. Data Analysis

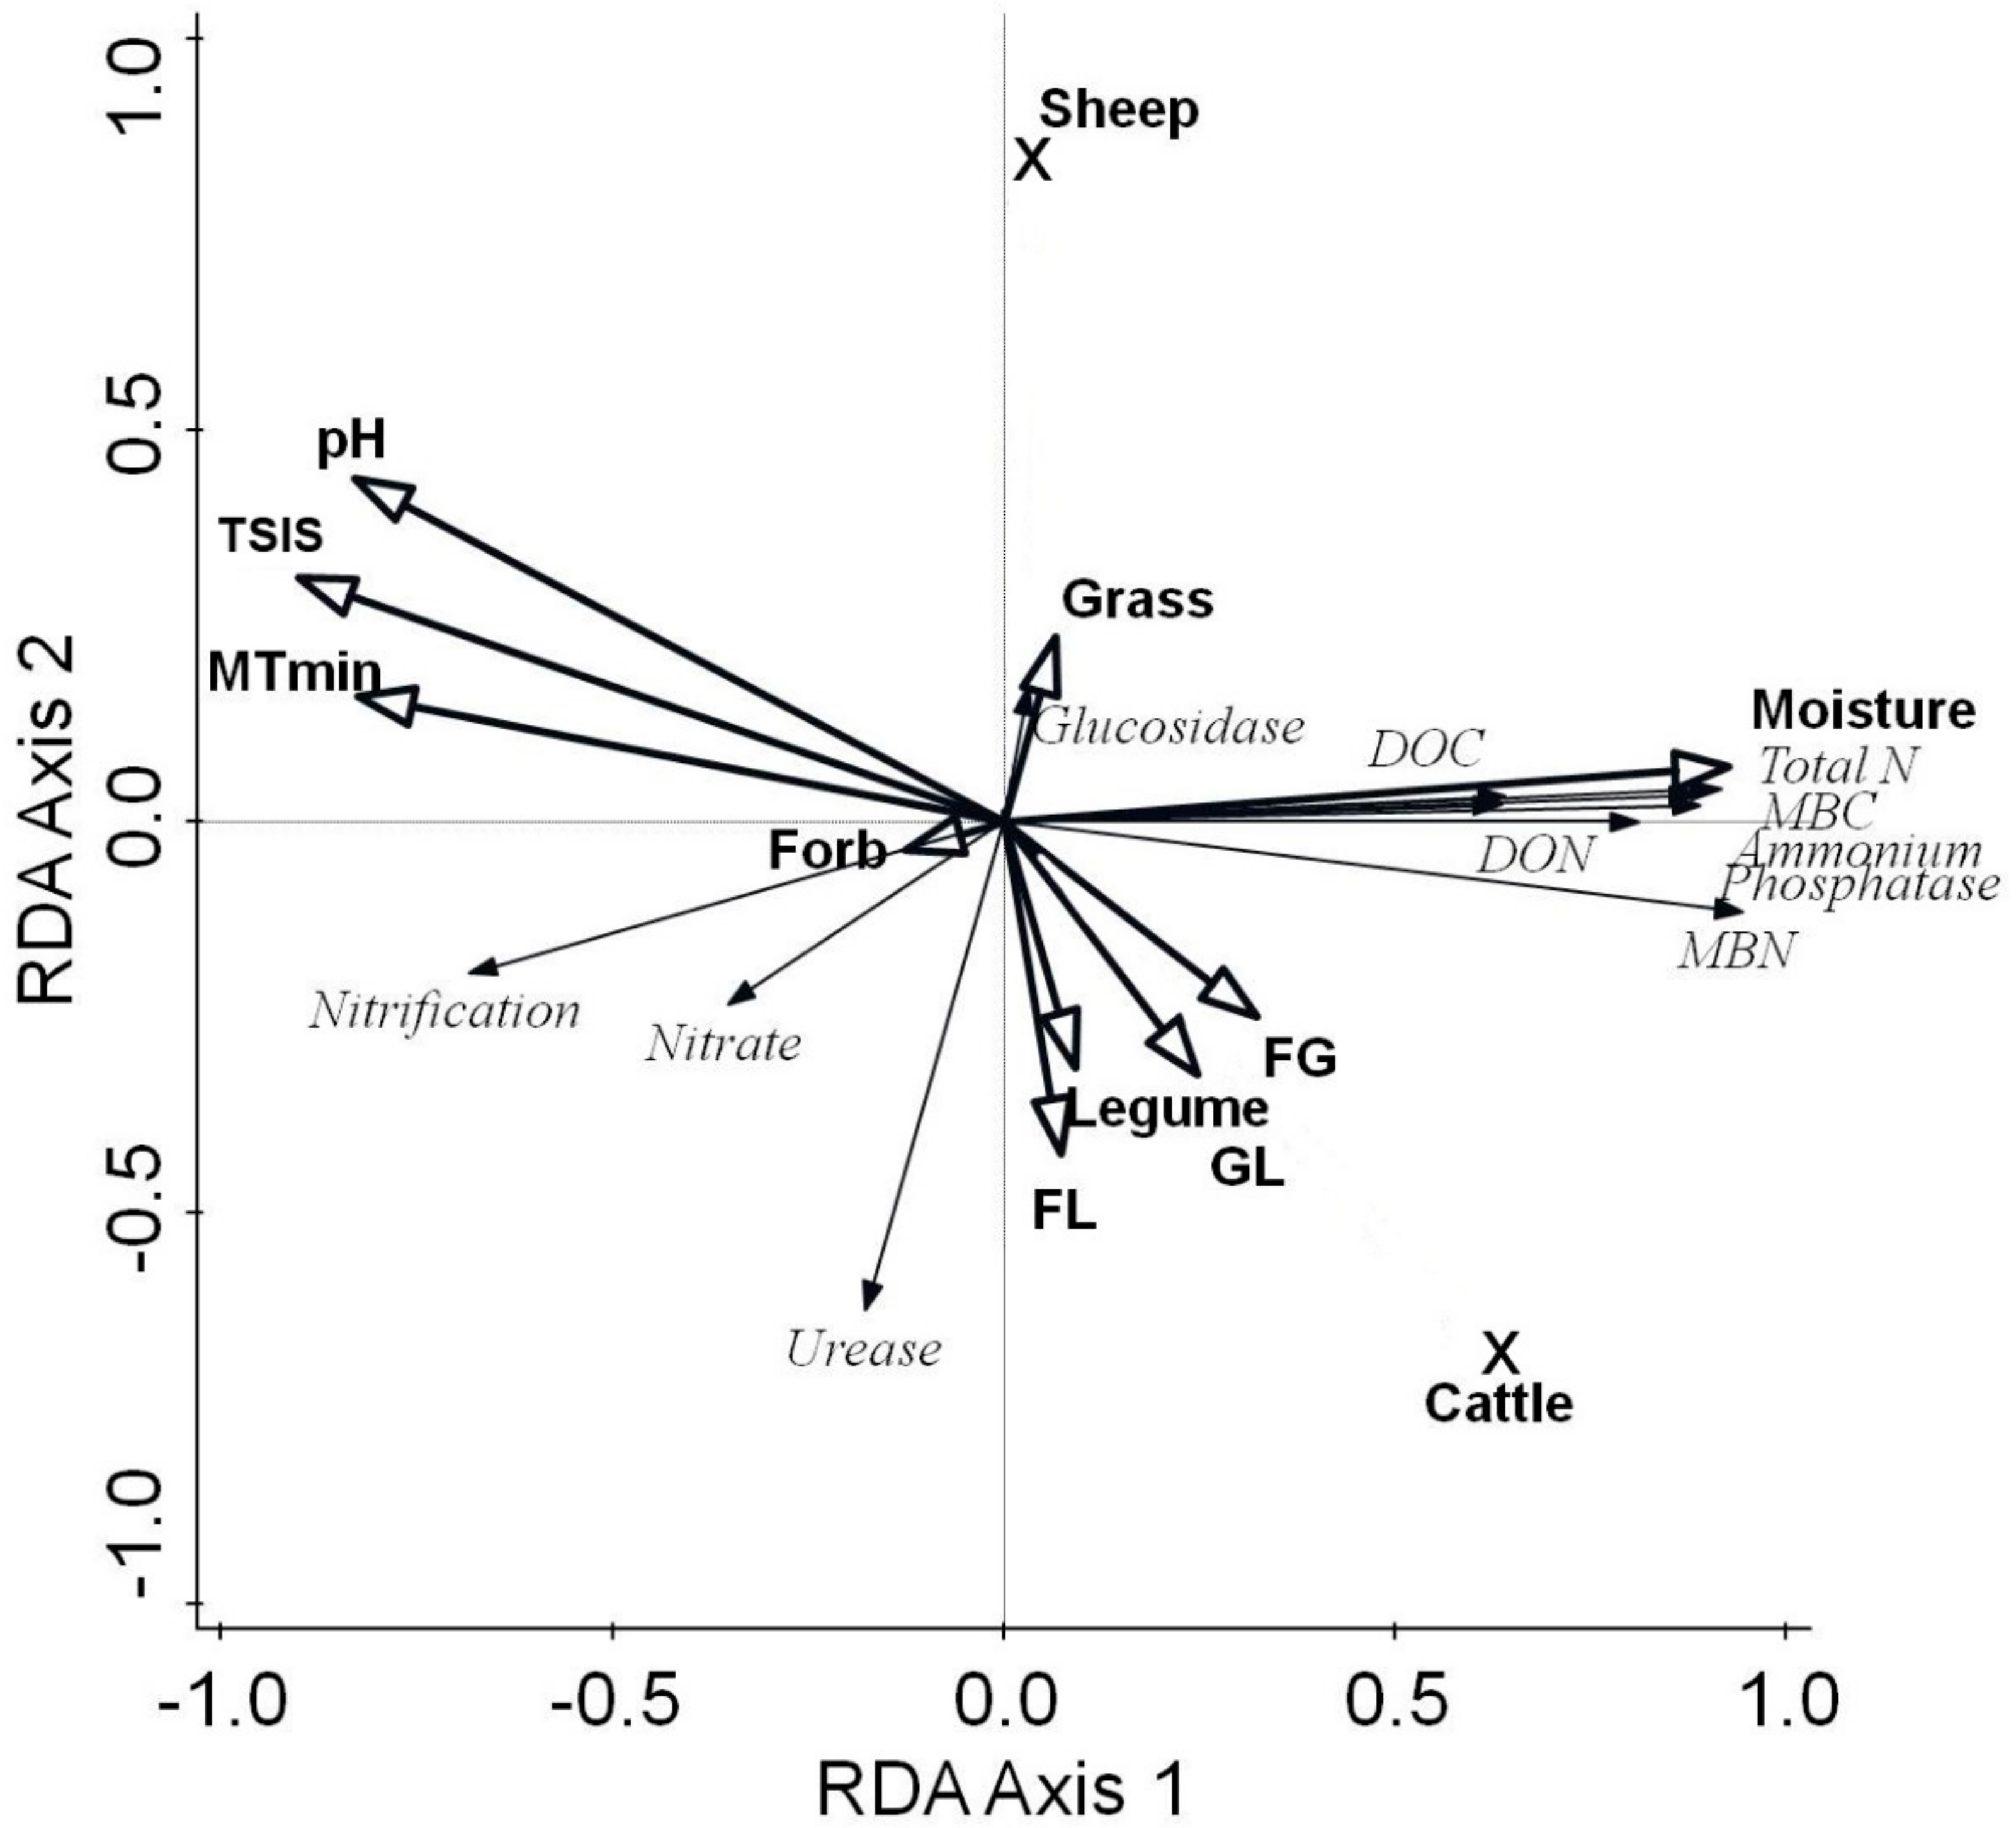
2.4.1. Gradient Analysis and Variation Partitioning

In order to investigate the effect of climatic, management, conditions, and plant functional diversity variables on global soil fertility and activity, we performed direct gradient analysis using Redundancy Analysis (RDA). The soil activity and fertility variables investigated were: total nitrogen, nitrate, ammonium, nitrification potential, urease, phosphatase, glucosidase, microbial biomass nitrogen (MBN), microbial biomass carbon (MBC), DON, and DOC. We also applied Variation Partitioning (VP) analysis and calculated the proportion of variability in soil activity and fertility explained by each set of variables separately (climatic and management factors, and soil descriptors versus PFT diversity factors) and their shared explained variation. We tested conditional and simple term effects of the two groups of variables: environmental (climatic, management and soil), and plant functional diversity variables, with forward selection of each set of variables and associated Monte Carlo tests of significance. We also generated adjusted p-values estimates calculated by using the false discovery rate (FDR) method for protection against Type I error inflation. We used CANOCO 5 for all the analyses [54]. The explanatory sets initially included all the variables recorded in the study: (a) environmental (climatic, management, and soil descriptors) variables: mean annual air temperature (MAT), mean annual precipitation (MAP), mean annual minimum air temperature (MTmin), mean annual maximum air temperature (MTmax), mean summer air temperature (MST), mean summer precipitation (MSP), the Temperature Seasonality Index of Sebastià (TSIS = MST − MAT; see Table 1), as in Rodríguez et al. 2020 [55], grazer type (represented through two dummy variables, sheep grazing and cattle grazing), and pH and moisture determined for each sampled soil; (b) plant functional diversity variables: PFT evenness, biomass proportion of grasses, legume, and non-legume forbs (thereupon, legumes and forbs), and the pairwise interactions between the three plant PFTs. We did not have enough degrees of freedom to reliably include interactions between PFT diversity components and other environmental variables in our redundancy analysis. Therefore, only the main effects of PFT diversity variables could be tested in the RDA. We also tested the effects of site and mixed grazing, but they were not significant and thus were not included in later analyses.
Forward selection of the explanatory variables and significance values calculated using Monte-Carlo permutation tests in a preliminary RDA also advised the reduction of climatic, management and soil variables to a smaller set of six variables: MTmin, TSIS, cattle grazing and sheep grazing, and soil pH and moisture. The same procedure suggested the removal of evenness from the PFT diversity variables, as species pairwise interactions was a stronger predictor, indicating that not all interactions between different PFT behave similarly.

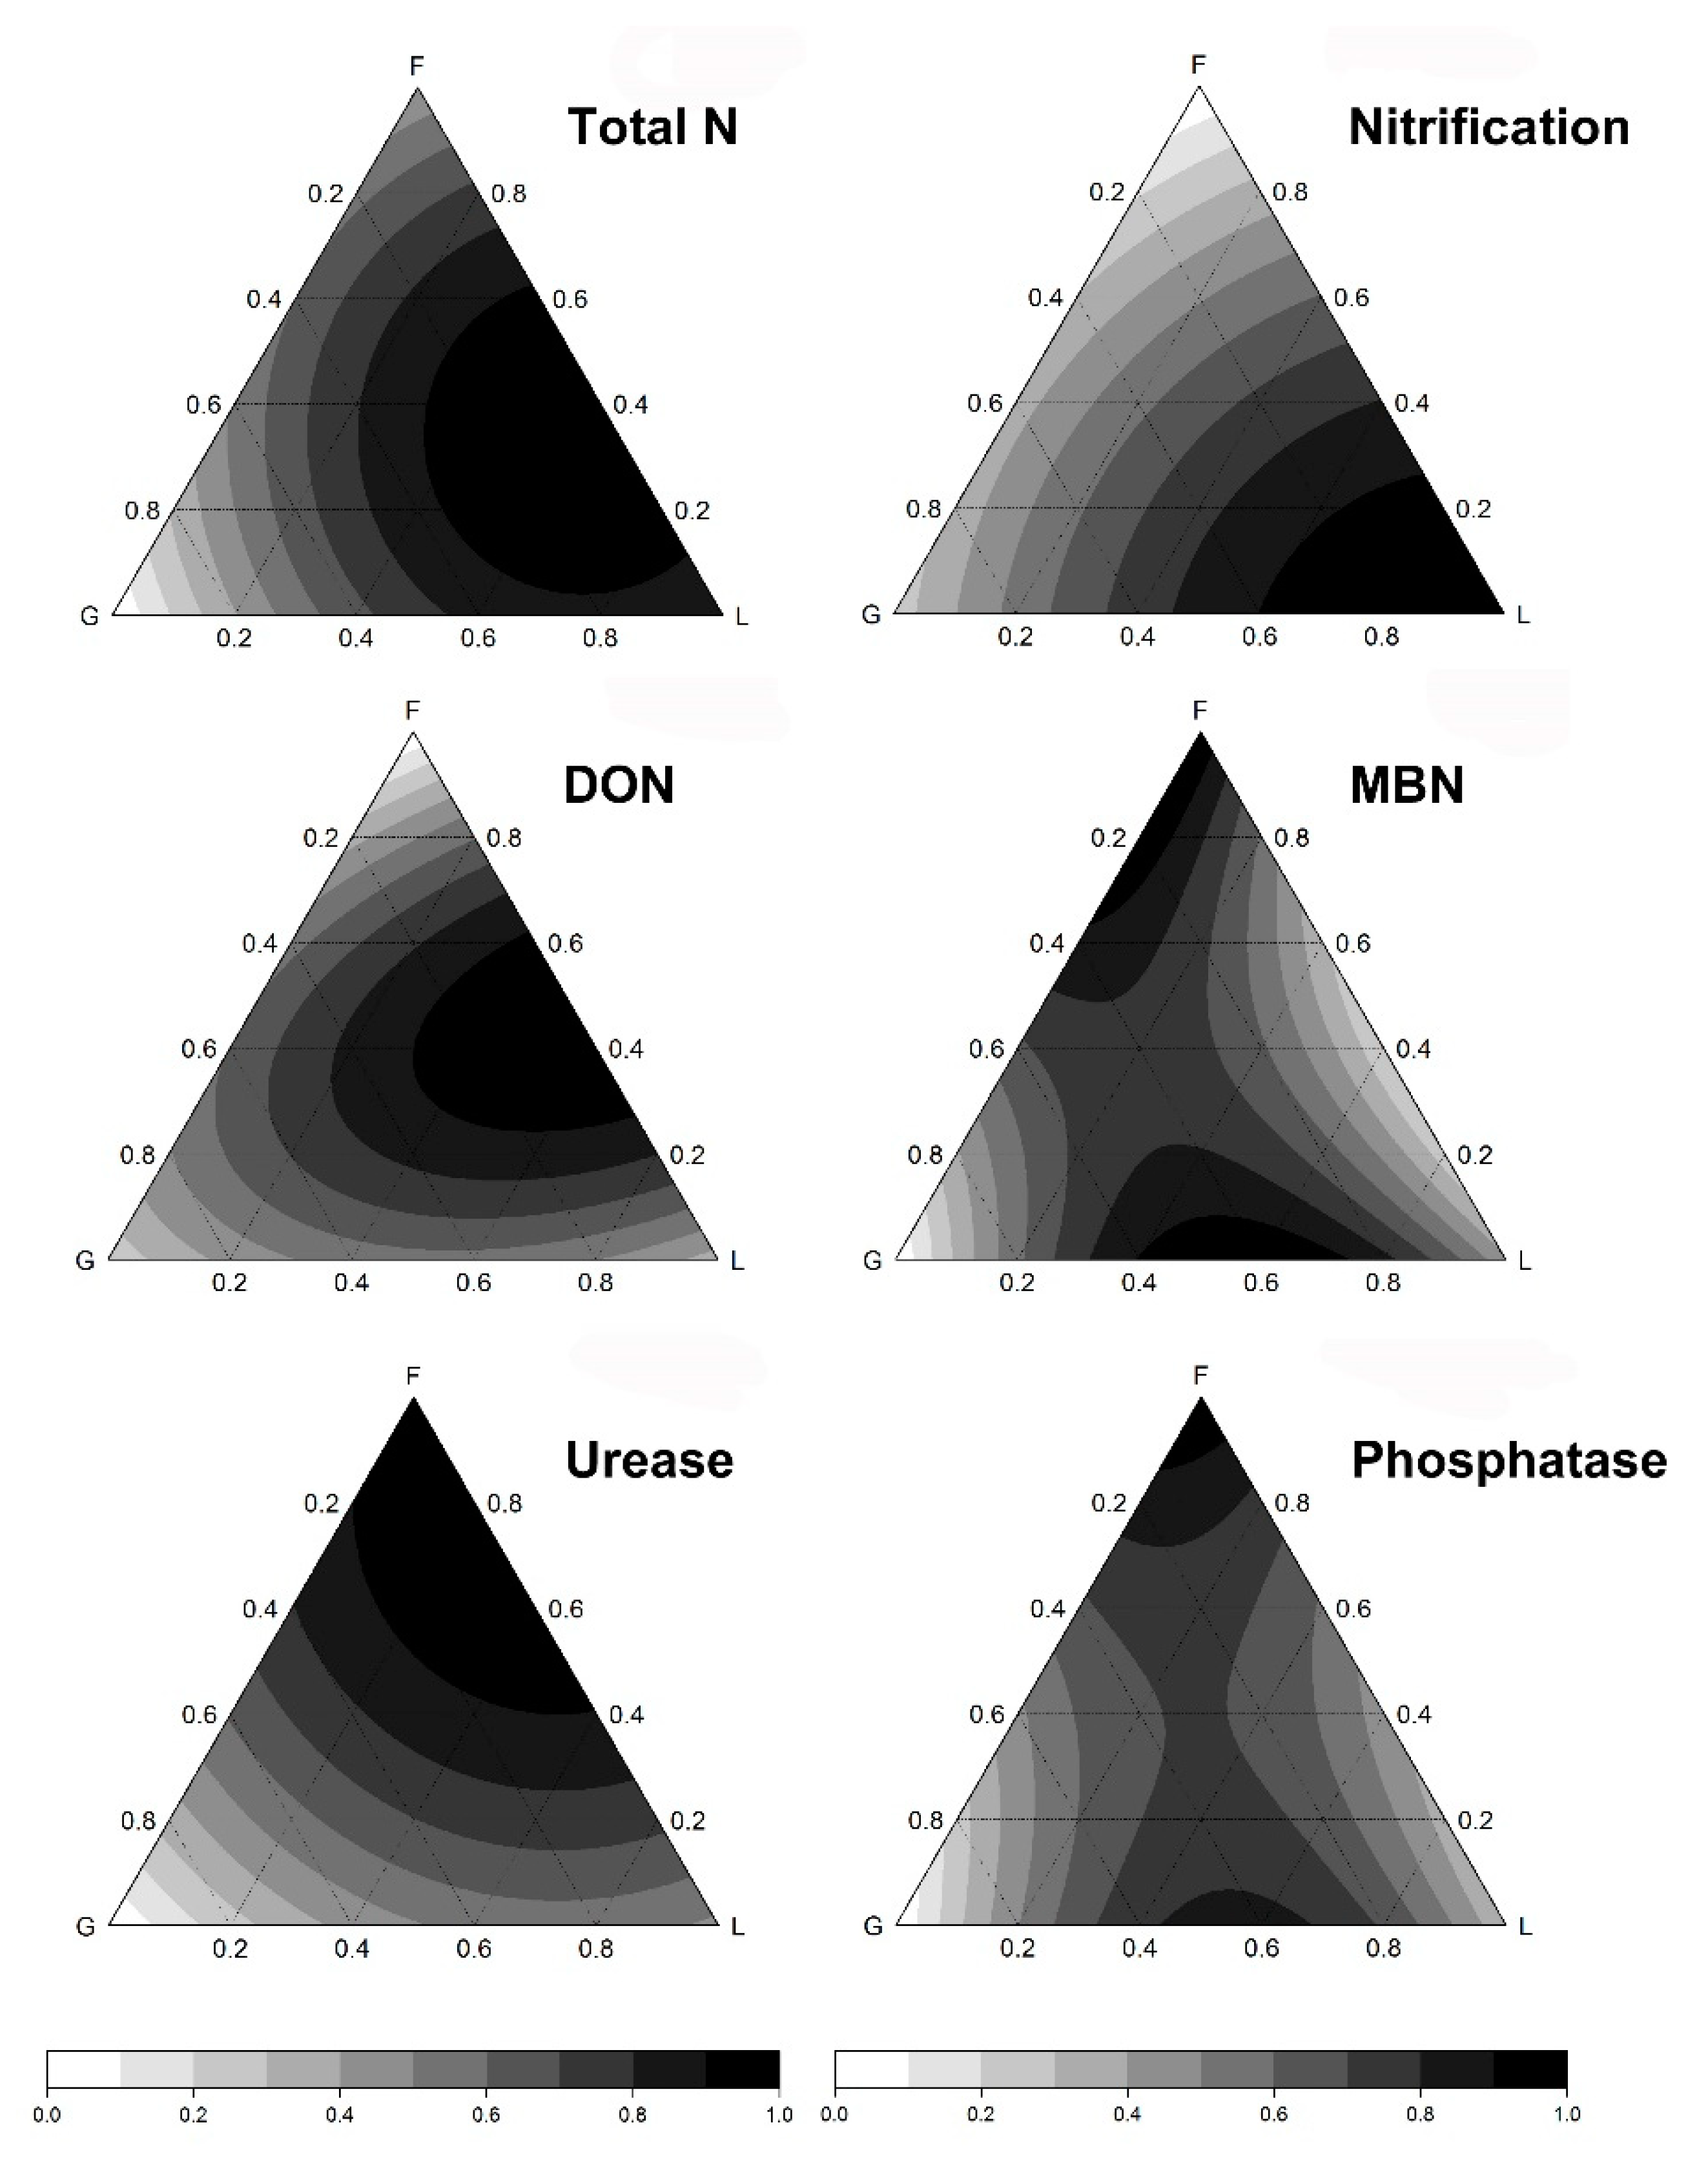
2.4.2. Generalized Diversity-Interaction (GDI) Models

In addition to multivariate mathematical ordination methods providing a global evaluation of controls of soil activity and fertility, described above, we conducted an investigation of each individual soil activity and fertility analyzed variable. In order to disentangle the effects of environmental (climatic, management, and soil), and plant functional diversity variables on individual soil activity and fertility variables, we used linear models based on the generalized diversity-interaction (GDI) modelling framework [39]. Following Kirwan et al. [36,38], we aimed at investigating the effects of PFT diversity factors on soil function variables, assessing: identity effects (effects imputable to each PFT individually, per se); PFT pairwise interaction effects (effects emerging from positive, negative, or neutral interactions between every pair of PFTs); and PFT evenness (assuming that all PFT interactions have similar effects). The GDI approach allows the discrimination of those different PFT diversity component effects [36,38]. We also included in our GDI models large-scale and site-specific soil factors to disentangle relative effects of those from PFT components. All explanatory variables were standardized by scaling the variables to zero mean and unit variance, prior to being included in the models. The standardization was conducted using the method “standardize” in the package “vegan” in R [56]. We also assessed the correlation between the explanatory variables (Figure S2). In our case, however, collinearity was less important than overlooking a key explanatory variable, because the benefit of having meaningful explanatory variables in the model is higher than the disadvantage of collinearity. We accepted the variables in the model even when they were correlated, and used two criteria to evaluate the validity of the model: 1) According to Heiberger and Holland 2004 [57], collinearity is tolerable when a model’s regression coefficients differ significantly from 0 (p-value < 0.05) This was true for most of our explanatory variables. Additionally, we used the Akaike information criterion (AIC)—a lower AIC indicates a better fit of the model. With the backward stepwise regression, variables were dismissed when they did not improve the model fit. The strength of the AIC criterion lies in the fact that it penalizes the inclusion of additional variables in the model if they do not provide an appreciable improvement of the model fit (for more details see Symonds and Moussalli 2011 [58]).
Our modeling framework included the comparison of four models, for each response variable of interest investigated. The first model, the null model, included only environmental variables, with no PFT diversity variables. The second model included environmental variables and the proportions of each plant functional type representing the PFT identity effects. The third model included the environmental variables, the PFT identity effects and all the pairwise interactions between plant functional types. PFT pairwise interactions were calculated as in Kirwan et al. 2007 [36]. The fourth and last model included the environmental variables, the PFT identity effects and the mean interaction diversity term (ek), corresponding to PFT evenness calculated as in Kirwan et al. 2007 [36]. We chose the best fitted model using F tests and the Akaike information criterion (AIC). The lower the level of AIC the better the model fit. All the selected models had a p-value < 0.05. Once the final diversity model for each analyzed variable was selected, we performed a backwards stepwise regression to select the climatic variables. The interactions between MTmin and PFT diversity variables were also included in the models. Generalized Diversity-Interaction models were carried out using the linear regression model “lm” function in R software [59]. In order to provide a better representation of the PFT diversity effects on each soil activity and fertility response variable, we built contour plots to represent on a triangle (ternary plots), where sides are the proportion of each main PFT, the soil activity and fertility functions in relation to the relative proportions of PFTs which sum to a total value of 1. The contour plots were built using the packages: “rsm” [60], “lattice” [61], “lme4” [62], “arm” [63], and RcolorBrewer” [64] of R software [59].

3. Results

3.1. Relative Importance of Environmental Variables and Plant Functional Diversity on Soil Activity and Fertility

Variation partitioning showed that, from all explained variability, the highest variability was explained by the abiotic environmental variables and management (96.6% of all variation). PFT diversity components explained 26.9% of the variation of the global soil fertility and activity functions. However, most of the PFT effects were mediated by abiotic variables and management (Figure 2), and unique effects of plant functional diversity on global soil activity and fertility (3.4%) were small compared to the shared variation (Figure 2).
Redundancy analysis on soil activity and fertility variables including all predictors (environmental and plant functional diversity variables) showed that large-scale variables and soil descriptors accounted for 81.3% of the total variability of soil activity, of which soil moisture was the best predictor (added 73% to explanatory power), followed by pH and grazer type (Table 2). PFT diversity variables accounted for 7.4% of the variability of soil activity and fertility, of which the pairwise interaction between forbs and grasses was the first variable selected by the forward procedure and added 4.9% to the overall explanatory power. PFT pairwise interactions were stronger predictors than the main effects (Table 2). From those, the effects of grasses were the most relevant (Table 2). Sheep grazing was a stronger driver of soil activity and fertility patterns than cattle grazing, and thus was used in the generalized diversity-interaction models.
Overall, the RDA axis 1 roughly corresponds to a climatic gradient, where pH increases in the same direction as air temperature and TSIS (negative side of RDA axis 1), and soil moisture increases in the opposite direction, towards the cold and moist areas (positive side of RDA axis 1; Figure 3). Total N, ammonium, MBC, MBN, DOC, DON, and phosphatase activity increased with soil moisture, but decreased with increased MTmin and TSIS, and soil pH (Figure 3). TSIS emerged as a strong driver of soil organic carbon distribution [45], and showed relevant explanatory power for other soil function variables. On the other hand, nitrate and potential nitrification decreased with soil moisture. The second RDA axis corresponds mostly to a grazing management gradient (sheep vs. cattle), combined with a grass-forb (legume and non-legume) gradient. Glucosidase activity increased with sheep grazing and grass proportion (positive side of RDA axis 2), whereas urease activity increased with cattle-grazing, legume proportion, and pairwise interactions, particularly those involving legumes (Figure 3).

3.2. Plant Functional Diversity Effects on Soil Activity and Fertility

The individual analysis in soil activity and fertility functions by GDI models was useful to fine-tune the understanding of the observed effects of environmental and PFT diversity factors on global soil function. Nitrate, Ammonium, DOC, MBC, and glucosidase were described by abiotic and management parameters, and unrelated to plant functional diversity parameters. Microbial biomass nitrogen (MBN), dissolved organic nitrogen (DON), and phosphatase were best described by including all the pairwise interactions between PFTs to account for the diversity effects (Table 3). For soil activity variables particularly related to the nitrogen cycle (total N, urease, and nitrification potential), the diversity effects were explained by the mean interaction diversity term, known as evenness (Ek). For instance, urease activity and soil total N significantly increased with plant function type evenness (p = 0.0095 for urease activity; p = 0.025 for soil total N). Nitrification potential showed a tendency to increase with increased evenness (p = 0.06). Total nitrogen in relatively even legume-forb mixtures was higher than in other PFT combinations and decreased when grass proportion increased (Figure 4). In fact, total N showed generally higher values near the centroids of the ternary plots compared to main PFT identity effects (Figure 4). Microbial biomass nitrogen (MBN) was the only soil parameter affected by diversity effects in interaction with climatic variables (Table 3). MBN increased at increased evenness levels and, particularly, at (more even) pairwise interactions involving grasses, but this effect was higher at lower mean minimum air temperature. The second model involving environmental variables and PFT identity effects only was not significant for any of the soil activity and fertility variables, and thus was not included.

4. Discussion

Climate change affects ecosystem processes directly through changes in temperature, precipitation, etc., or indirectly through shifts in plant functional diversity, community composition and functional traits [42]. Classen et al. 2015 [42] hypothesized that indirect effects of climate change on microbes mediated through plants may be stronger than direct effects of climate on shaping microbial community composition and function. However, our findings suggest the contrary since direct effects of climate on soil activity and fertility were stronger than indirect effects (Figure 2).
In line with our first hypothesis, climate had a huge direct impact on soil fertility and activity. Soil activity and fertility were best explained by environmental variables, including large-scale factors (climate and management), and site-specific soil descriptors (moisture and pH), followed by the shared effects of these two sets of variables with PFT diversity variables (Figure 2). Additionally, when modelled independently, all soil fertility and activity variables responded significantly to climatic variables (Table 2). The combined effects of environmental and plant functional diversity variables had overall a strong regulating power on soil functions, while the unique effects of plant functional diversity were small compared to the shared variation with environmental variables (Figure 2). This suggests that climate and other abiotic environmental variables have a strong capacity to modify how PFT interactions affect ecosystem functioning. However, when we considered soil activity and fertility factors independently, PFT evenness and pairwise interactions enhanced soil variables that are related to the N cycle (Table 3; Figure 4). The regulatory role of PFT diversity was consistent across the studied climatic gradient independently of abiotic environmental conditions and management variables (Table 3). Removing one of the climatic or PFT diversity variables led, however, to a dramatic loss in explanatory power underlining that although there are no interaction effects, both are essential for soil functioning.

4.1. Environmental Drivers of Soil Activity and Fertility

Soil moisture, air temperature, and pH are known to be main drivers of a wide range of soil processes [17,43,44,45]. Indeed, our results showed that soil moisture enhanced total N, ammonium, C and N microbial biomass, DOC and DON, and phosphatase activity, while air temperature and pH reduced the same soil variables (Figure 3). The positive effect of soil moisture on C and N microbial biomass and total N was also observed by Yang et al. 2016 [65] in shrublands and meadows, because increased soil water content enhances the plant organic matter quality by increasing its decomposition rates, and as a result more N is available in the soil [18,66]. As for ammonium, its positive correlation with soil moisture, as observed by Mueller et al. 2013 [67], can be attributed to the positive impact of soil moisture on organic matter mineralization [68], which is converted into inorganic forms of nitrogen, such as ammonium [69]. Our findings on phosphatase activity also agree with previous studies advocating that soil moisture is a key factor regulating P in the soil [70,71], and controlling microbial activity [26,72]. Higher temperatures generally increase microbial and enzyme activity, as well as mineralization. However, our results showed the reverse trend (Figure 3). This is most likely attributed to the fact that the warmest sites in our study are also the driest ones. Dry soil conditions may have inhibited the effect of temperature on mineralization, microbial biomass, and soil phosphatase activity [17,73].
The temperature gradient correlated well with the soil pH gradient: the warm semi-arid sites were alkaline compared to the acidic cold subalpine and alpine sites. It is well known that soil pH regulates soil bacterial composition, diversity and richness [44,74] and thus soil activity and fertility parameters, as shown in Figure 3. Changes in pH influence the relative abundance of Acidobacteria, Actinobacteria, and Bacteroidetes and the phylogenetic structure of bacterial communities [74]. This can eventually impact the soil enzyme activity, which is strongly correlated with bacterial community activity [71]. Similarly, DOC and DON production can also be enhanced by high temperatures when soil moisture is not limiting [75,76]. High temperatures favor plant growth and litter production while soil moisture enhances and supports DOC and DON transport in the soil horizons [77,78,79]. Therefore, the combination of high temperature with limiting soil moisture conditions in the semi-arid grassland sites reduces plant growth, thus reducing or even inhibiting DOC and DON production. Nitrate and nitrification potential were the only soil activity and fertility indices which decreased with soil moisture (Figure 3). Sites with high soil moisture (subalpine and alpine) are characterized by low temperatures, which limit these soil processes and thus explain this decreasing trend of nitrification potential and nitrate with higher soil moisture levels. Among the environmental drivers, soil moisture and temperature are regarded as the most important factors for nitrification processes, and nitrate uptake and concentrations [80,81]. Additionally, the lower nitrification potential and nitrate in subalpine and alpine grasslands may be attributed to the low pH in these grasslands (acidic soils), where soil nitrification is restricted to chemolitho-autotrophic bacteria as the main nitrifying agents [82], and is thus lower than in alkaline soils. Overall, our results highlight the importance of pH and the interplay between temperature and soil moisture, and stress that the effect of each factor cannot be separated from the other when investigating soil activity processes. This is most likely attributed to the strong correlation between these climatic variables, as observed in our correlation analyses (Figure S2 in Supplementary Materials).
Soil enzymatic activities, such as glucosidase and urease, are indicators of soil organic matter quality [83,84], which control the availability of nutrients such as carbon, nitrogen and phosphorus, and the rate at which they are produced in the soil for microbial assimilation [23,24,25]. Plants have a strong influence on enzyme activity because they regulate the quantity and quality of microbial biomass [26,27]. Grazers, on the other hand, exert strong effects on the plant-soil system through their impacts on vegetation composition, soil microbial communities and enzyme activities [85,86]. Indeed, our results showed the importance of grazers, and to a lesser extent plant functional types, as main drivers of glucosidase and urease activities. The effect of PFTs on soil activity and fertility is most likely the consequence of the feeding habits of the grazers. For example, Sebastià et al. 2008 [87] found that sheep grazing favored the dominance of grasses at local scales because of their high selecting feeding behavior, particularly their selection of legumes. In our case, glucosidase activity increased in grasslands grazed by sheep and dominated by grasses. Grass communities and sheep grazing enhance plant litter quantity and quality, a main component of glucosidase activity to produce glucose [88]. Compared to sheep, our results showed a smaller impact of cattle on vegetation, as similarly observed by Hao and He 2019 [89]. The observed effect of cattle grazing on DOC, Nitrate, and pH, in our case, was not associated with plant functional diversity (Table 3). This is most likely related to the trampling effect of cattle, on soil nitrogen availability, soil water content, and bulk density [90].

4.2. Plant Functional Diversity Effects on Soil Activity and Fertility

Beside the above mentioned factors, soil activity and fertility are also affected by plant diversity [17,18,22], because plants determine the quantity and the quality of residues, soil organic matter, as well as soil structure [28,91]. Indeed, and according to our second hypothesis, PFT diversity factors had significant effects on soil fertility and activity. This result is remarkable considering the wide climatic gradient encompassed in this study, which could have overridden all other sources of variability. When considering the multivariate space generated by the ensemble of those variables, PFT diversity explained up to one fourth of the total variability. In addition, when modelling the soil variables independently, PFT diversity factors contributed to more than 50% of the soil fertility and diversity variables analysed (6 out of 11 soil variables), particularly those related to the N cycle (Table 3).
Plant functional diversity effects, in addition to environmental effects, were observed on MBN, DON, total N, urease and phosphatase, and nitrification potential (Table 3 and Figure 4). Several studies investigated the role of vegetation composition in soil microbial N and C. Some detected no change in MBN and MBC with functional group diversity [22,92], while others suggest that PFT and particularly legumes with their important effect on total nitrogen play a great role in shaping soil microbial communities [93,94]. We found that the interaction between grasses and forbs enhanced MBN and phosphatase activity, but PFT diversity had no effect on MBC (Table 3). However, in an alternative model, the interaction between forbs and grasses increased MBC (p = 0.04), and legumes in sites with lower MTmin (alpine and subalpine sites) showed a tendency to increase MBC (p = 0.08) compared to warmer sites. The increased MBN and, marginally, MBC related to the interaction between forbs and grasses is most likely the result of the higher quantity and variety of plant-derived compounds available to microbial communities at higher PFT diversity [95]. Additionally, among all the soil functions that we assessed, MBN was the only one affected by the interaction between climate and PFT. Particularly, low mean minimum air temperatures favored MBN in patches dominated by grasses and those dominated by forbs (Table 3). This may be attributed to the high sensitivity of microbial biomass contents to changes in the climate and environmental conditions compared to soil enzyme activities [96]. Additionally, the increased plant productivity as a result of higher diversity (higher evenness levels involving grasses and forbs) can explain the observed increase in DON (Table 3), because it would lead to higher soil organic matter and consequently increased organic N pools [97] and thus greater DON production. Grasses are suggested to induce higher microbial biomass compared to other PFTs, because of their dense root system and high root exudation rates [98,99]. Legumes, in turn, favor organic N sources compared to other PFTs, due to their effectiveness in transferring amino acids between nodules and roots [100], and to their facilitation of N to grasses [101,102]. This may explain why the interaction between legumes and grasses enhanced DON.
Plant functional diversity also enhanced total nitrogen, nitrification potential, and urease (Table 3). Our findings are in line with previous studies suggesting that more even plant communities increase bacterial abundance, which consequently enhances the potential for bacterial nitrification [100]. Additionally, this positive effect of functional diversity on total N and urease activity can be explained by the positive effect of evenness and PFT pairwise interactions on productivity and nitrogen availability [22,23]. In fact, increased community aboveground biomass as a result of increased diversity leads to higher soil water retention, and higher litter and soil nutrient content, which are closely associated with urease activity [22,103]. The latter is a key enzyme strongly linked to the processes of nitrogen transformation and availability in the soil [104,105].
The strong influence of PFT composition and interactions on more than 50% of the analyzed soil activity and fertility variables suggests that any shifts in vegetation composition in grasslands, for instance under future climate change, can have serious effects on the feedback of the soil to the atmosphere. As greenhouse gas exchange processes mainly occur in the soil, they strongly depend on soil microbial biomass, carbon and nitrogen content and availability, and enzyme activities. Our results presented a rather complex answer to our third question which is why we can neither fully reject nor accept our third hypothesis. When considering the overall variability of the hyperspace generated by the entire set of soil fertility and activity variables, tested by multivariate analysis, our third hypothesis was corroborated (Figure 2). Certainly, almost all of this multivariate soil variability explained by PFT diversity factors was modified by climatic and management factors (high overlap between both set of variables in Figure 2). That is, PFT diversity factors accounted for over one fourth of the overall variability of soil fertility and activity, but mostly conditioned by other environmental variables. In contrast, when analyzing the soil fertility and diversity variables where PFT diversity was significant, only one out of six of variables showed interaction effects with a climatic variable (Table 3)—in which case we would reject our third hypothesis.

5. Conclusions

Overall, we found that total variability of global soil activity and fertility were better explained by climate, management and soil conditions, followed by the combined effects of those with plant functional diversity variables. The unique effects of plant functional diversity were, however, small compared to the interaction effects, thus suggesting that PFT diversity effects cannot be separated from climatic effects on soil activity and fertility. Among the soil conditions, soil moisture was the best predictor. Grazer type and its effect on the vegetation (composition, structure, canopy, litter accumulation, soil cover, etc.) also were important factors influencing soil activity. This highlights the relative importance of management as a driver of soil activity, suggesting that management can modify global change effects on soil activity.
Beside the strong variation imprinted on soil activity and fertility by large-scale and site-specific factors, there is a set of soil activity and fertility variables for which PFT evenness and pairwise interactions are strong regulators. In particular, PFT diversity enhanced MBN, DON, total N, urease and phosphatase activity, and nitrification potential and thus strongly affected the N cycle.
Our findings underline that shifts in vegetation composition (from climate or land-use change) can modify soil activity and fertility, and consequently the soil and belowground community feedback to the atmosphere. Assessing greenhouse gas emissions from grasslands under different climatic, management, and soil conditions may offer an important planning tool to determine mitigation strategies under a climate change perspective and to preserve the unique ecosystems of grasslands.

Supplementary Materials

The following are available online at https://www.mdpi.com/2073-4395/10/9/1291/s1, Figure S1: Schematic diagram depicting the sampling design in each study site; Figure S2: Correlation matrix of the variables used in the models; Table S1: Generalized diversity-interaction models for soil activity and fertility parameters (response variables).

Author Contributions

Conceptualization, M.-T.S.; methodology, M.-T.S. and R.M.C.; formal analysis, H.D. and L.S.E.; investigation, H.D., L.S.E. and T.M.; writing—original draft preparation, H.D. and L.S.E.; writing—review and editing, R.M.C. and M.-T.S.; supervision, M.-T.S.; project administration, M.-T.S.; funding acquisition, M.-T.S. All authors have read and agreed to the published version of the manuscript.

Funding

This work was funded by the Spanish Science Foundation (FECYT) through the projects CAPAS (CGL2010-22378-C03-01), BIOGEI (CGL2013-49142-C2-1-R) and IMAGINE (CGL2017-85490-R). H. Debouk was supported by a FPI fellowship from the Spanish Ministry of Economy and Competitiveness (BES-2011-047009). L. San Emeterio was funded by a Talent Recruitment grant from Obra Social La Caixa—Fundación CAN.

Acknowledgments

We would like to thank all the people who helped in the experimental setup and sampling, particularly Helena Sarri. We would also like to thank Dominik Sperlich for reviewing the writing of the manuscript, Antonio Rodríguez for helping to answer some statistical questions, and Esther Iñiguez for assisting to acquire the meteorological data. We are particularly grateful to the anonymous reviewers of the Journal for improving the paper, through their useful suggestions and comments.

Conflicts of Interest

The authors declare no conflict of interest. The sponsors had no role in the design, execution, interpretation, or writing of the study.

References

  1. Chapin, F.S.; Sala, O.E.; Huber-Sannwald, E. Global Biodiversity in a Changing Environment: Scenarios for the 21st Century; Springer: New York, NY, USA, 2001. [Google Scholar]
  2. FAO. FAOSTAT Statistical Databases; Food and Agricultural Organization of the United Nations: Rome, Italy, 2006. [Google Scholar]
  3. Bengtsson, J.; Bullock, J.M.; Egoh, B.; Everson, C.; Everson, T.; O’Connor, T.; O’Farrell, P.J.; Smith, H.G.; Lindborg, R. Grasslands—More important for ecosystem services than you might think. Ecosphere 2019, 10. [Google Scholar] [CrossRef]
  4. Lemaire, G.; Hodgson, J.; Chabbi, A. Grassland Productivity and Ecosystem Services; CAB International: Wallingford, UK; Cambridge, MA, USA, 2011; ISBN 978-1-84593-809-3. [Google Scholar]
  5. Noss, R.F. Biological hotspots and endangered ecosystems. In Forgotton Grasslands of the South-Natural History and Conservation; Island Press: Washington, DC, USA, 2013; pp. 73–115. ISBN 978-1-59726-362-7. [Google Scholar]
  6. Aguiar, M.R. Biodiversity in grasslands: Current changes and scenarios for the future. In Grasslands: Developments Opportunities Perspectives; Reynolds, S.G., Frame, J., Eds.; Science Publishers, Inc.: Einfield, NH, USA, 2005; pp. 261–280. [Google Scholar]
  7. Fry, E.L.; Manning, P.; Allen, D.G.P.; Hurst, A.; Everwand, G.; Rimmler, M.; Power, S.A. Plant functional group composition modifies the effects of precipitation change on grassland ecosystem function. PLoS ONE 2013, 8, e57027. [Google Scholar] [CrossRef] [PubMed] [Green Version]
  8. Sebastià, M.-T.; Kirwan, L.; Connolly, J. Strong shifts in plant diversity and vegetation composition in grassland shortly after climatic change. J. Veg. Sci. 2008, 19, 299–306. [Google Scholar] [CrossRef]
  9. Sebastià, M.T. Plant guilds drive biomass response to global warming and water availability in subalpine grassland. J. Appl. Ecol. 2007, 44, 158–167. [Google Scholar] [CrossRef]
  10. Sanz-Elorza, M.; Dana, E.D.; González, A.; Sobrino, E. Changes in the high-mountain vegetation of the central Iberian Peninsula as a probable sign of global warming. Ann. Bot. 2003, 92, 273–280. [Google Scholar] [CrossRef]
  11. Casasús, I.; Bernués, A.; Sanz, A.; Villalba, D.; Riedel, J.L.; Revilla, R. Vegetation dynamics in Mediterranean forest pastures as affected by beef cattle grazing. Agric. Ecosyst. Environ. 2007, 121, 365–370. [Google Scholar] [CrossRef]
  12. Mills, R.T.E.; Gavazov, K.S.; Spiegelberger, T.; Johnson, D.; Buttler, A. Diminished soil functions occur under simulated climate change in a sup-alpine pasture, but heterotrophic temperature sensitivity indicates microbial resilience. Sci. Total Environ. 2014, 473–474, 465–472. [Google Scholar] [CrossRef] [Green Version]
  13. Craine, J.M.; Nippert, J.B.; Elmore, A.J.; Skibbe, A.M.; Hutchinson, S.L.; Brunsell, N.A. Timing of climate variability and grassland productivity. Proc. Natl. Acad. Sci. USA 2012, 109, 3401–3405. [Google Scholar] [CrossRef] [Green Version]
  14. Brinkman, R.; Sombroek, W.G. The effects of global change on soil conditions in relation to plant growth and food produciton. In Global Climate Change and Agricultural Production. Direct and Indirect Effects of Changing Hydrological, Pedological and Plant Physiological Processes; Bazzaz, F., Ed.; Food and Agriculture Organization of the United Nations (FAO): Rome, Italy; John Wiley & Sons: Chichester, UK, 1996. [Google Scholar]
  15. Bot, A.; Benites, J. The Importance of Soil Organic Matter; Food and Agriculture Organization of the United Nations (FAO): Rome, Italy, 2005; ISBN 9251053669. [Google Scholar]
  16. Brookes, P. The soil microbial biomass: Concept, measurement and applications in soil ecosystem research. Microbes Environ. 2001, 16, 131–140. [Google Scholar] [CrossRef] [Green Version]
  17. Castro, H.F.; Classen, A.T.; Austin, E.E.; Norby, R.J.; Schadt, C.W. Soil microbial community responses to multiple experimental climate change drivers. Appl. Environ. Microbiol. 2010, 76, 999–1007. [Google Scholar] [CrossRef] [Green Version]
  18. Garten, C.T.; Classen, A.T.; Norby, R.J. Soil moisture surpasses elevated CO2 and temperature as a control on soil carbon dynamics in a multi-factor climate change experiment. Plant Soil 2009, 319, 85–94. [Google Scholar] [CrossRef]
  19. Le Roux, X.; Bardy, M.; Loiseau, P.; Louault, F. Stimulation of soil nitrification and denitrification by grazing in grasslands: Do changes in plant species composition matter? Oecologia 2003, 137, 417–425. [Google Scholar] [CrossRef] [PubMed]
  20. Lu, X.; Yan, Y.; Fan, J.; Wang, X. Gross nitrification and denitrification in alpine grassland ecosystems on the Tibetan Plateau. Arct. Antarct. Alp. Res. 2012, 44, 188–196. [Google Scholar] [CrossRef]
  21. Emmett, B.A.; Beier, C.; Estiarte, M.; Tietema, A.; Kristensen, H.L.; Williams, D.; Peñuelas, J.; Schmidt, I.; Sowerby, A. The response of soil processes to climate change: Results from manipulation studies of shrublands across an environmental gradient. Ecosystems 2004, 7, 625–637. [Google Scholar] [CrossRef] [Green Version]
  22. Niklaus, P.A.; Wardle, D.A.; Tate, K.R. Effects of plant species diversity and composition on nitrogen cycling and the trace gas balance of soils. Plant Soil 2006, 282, 83–98. [Google Scholar] [CrossRef]
  23. Burns, R.G.; Dick, R.P. Enzymes in the Environment: Activity, Ecology, and Applications; Marcel Dekker, INC.: New York, NY, USA, 2002. [Google Scholar]
  24. Chróst, R. Microbial Enzymes in Aquatic Environments; Springer: New York, NY, USA, 1991; ISBN 978-1-4612-3090-8. [Google Scholar]
  25. Gianfreda, L. Enzymes of importance to rhizosphere processes. J. Soil Sci. Plant Nutr. 2015, 15, 283–306. [Google Scholar] [CrossRef] [Green Version]
  26. Sardans, J.; Peñuelas, J.; Estiarte, M. Changes in soil enzymes related to C and N cycle and in soil C and N content under prolonged warming and drought in a Mediterranean shrubland. Appl. Soil Ecol. 2008, 39, 223–235. [Google Scholar] [CrossRef]
  27. Steinweg, M.J.; Dukes, J.S.; Paul, E.A.; Wallenstein, M.D. Microbial responses to multi-factor climate change: Effects on soil enzymes. Front. Microbiol. 2013, 4, 1–11. [Google Scholar] [CrossRef] [Green Version]
  28. Wardle, D.A.; Bardgett, R.D.; Klironomos, J.N.; Setälä, H.; van der Putten, W.H.; Wall, D.H. Ecological Linkages between aboveground and belowground biota. Science 2004, 304, 1629–1633. [Google Scholar] [CrossRef]
  29. Pillar, V.D.; Blanco, C.C.; Müller, S.C.; Sosinski, E.E.; Joner, F.; Duarte, L.D.S. Functional redundancy and stability in plant communities. J. Veg. Sci. 2013, 24, 963–974. [Google Scholar] [CrossRef]
  30. Kang, S.; Ma, W.; Li, F.Y.; Zhang, Q.; Niu, J.; Ding, Y.; Han, F.; Sun, X. Functional redundancy instead of species redundancy determines community stability in a typical steppe of inner Mongolia. PLoS ONE 2015, 10, e0145605. [Google Scholar] [CrossRef] [PubMed]
  31. Kohler, M.; Devaux, C.; Grigulis, K.; Leitinger, G.; Lavorel, S.; Tappeiner, U. Plant functional assemblages as indicators of the resilience of grassland ecosystem service provision. Ecol. Indic. 2017, 73, 118–127. [Google Scholar] [CrossRef] [PubMed] [Green Version]
  32. Ostle, N.J.; Smith, P.; Fisher, R.; Woodward, F.I.; Fisher, J.B.; Smith, J.U.; Galbraith, D.; Levy, P.; Meir, P.; Mcnamara, N.P.; et al. Plant–soil interactions and the carbon cycle Integrating plant–soil interactions into global carbon cycle models. J. Ecol. 2009, 97, 851–863. [Google Scholar] [CrossRef]
  33. Wang, M.; Moore, T.R. Carbon, nitrogen, phosphorus, and potassium stoichiometry in an ombrotrophic peatland reflects plant functional type. Ecosystems 2014, 17, 673–684. [Google Scholar] [CrossRef]
  34. Wullschleger, S.D.; Epstein, H.E.; Box, E.O.; Euskirchen, E.S.; Goswami, S.; Iversen, C.M.; Kattge, J.; Norby, R.J.; Van Bodegom, P.M.; Xu, X. Plant functional types in Earth system models: Past experiences and future directions for application of dynamic vegetation models in high-latitude ecosystems. Ann. Bot. 2014, 114, 1–16. [Google Scholar] [CrossRef] [Green Version]
  35. Loreau, M.; Naeem, S.; Inchausti, P.; Bengtsson, J.; Grime, J.P.; Hector, A.; Hooper, D.U.; Huston, M.A.; Raffaelli, D.; Schmid, B.; et al. Biodiversity and ecosystem functioning: Current knowledge and future challenges. Science 2001, 294, 804–808. [Google Scholar] [CrossRef] [Green Version]
  36. Kirwan, L.; Lüscher, A.; Sebastià, M.T.; Finn, J.A.; Collins, R.P.; Porqueddu, C.; Helgadottir, A.; Baadshaug, O.H.; Brophy, C.; Coran, C.; et al. Evenness drives consistent diversity effects in intensive grassland systems across 28 European sites. J. Ecol. 2007, 95, 530–539. [Google Scholar] [CrossRef]
  37. Tilman, D.; Lehman, C.L.; Thomson, K.T. Plant diversity and ecosystem productivity: Theoretical considerations. Proc. Natl. Acad. Sci. USA 1997, 94, 1857–1861. [Google Scholar] [CrossRef] [Green Version]
  38. Kirwan, L.; Connolly, J.; Finn, J.; Brophy, C. Diversity-interaction modeling: Estimating contributions of species identities and interactions to ecosystem function. Ecology 2009, 90, 2032–2038. [Google Scholar] [CrossRef]
  39. Connolly, J.; Bell, T.; Bolger, T.; Brophy, C.; Carnus, T.; Finn, J.A.; Kirwan, L.; Isbell, F.; Levine, J.; Lüscher, A.; et al. An improved model to predict the effects of changing biodiversity levels on ecosystem function. J. Ecol. 2013, 101, 344–355. [Google Scholar] [CrossRef] [Green Version]
  40. Neilson, R.P.; Pitelka, L.F.; Solomon, A.M.; Nathan, R.; Midgley, G.F.; Fragoso, J.M.V.; Lischke, H.; Thompson, K. Forecasting regional to global plant migration in response to climate change. Bioscience 2005, 55, 749. [Google Scholar] [CrossRef]
  41. Pold, G.; DeAngelis, K. Up against the wall: The effects of climate warming on soil microbial diversity and the potential for feedbacks to the carbon cycle. Diversity 2013, 5, 409–425. [Google Scholar] [CrossRef]
  42. Classen, A.E.; Sundqvist, M.K.; Henning, J.A.; Newman, G.S.; M Moore, J.A.; Cregger, M.A.; Moorhead, L.C.; Patterson, C.M. Direct and indirect effects of climate change on soil microbial and soil microbial-plant interactions: What lies ahead? Ecosphere 2015, 6, 1–21. [Google Scholar] [CrossRef]
  43. Bru, D.; Ramette, A.; Saby, N.P.; Dequiedt, S.; Ranjard, L.; Jolivet, C.; Arrouays, D.; Philippot, L. Determinants of the distribution of nitrogen-cycling microbial communities at the landscape scale. ISME J. 2011, 5, 532–542. [Google Scholar] [CrossRef] [Green Version]
  44. Fierer, N.; Jackson, R.B. The diversity and biogeography of soil bacterial communities. Proc. Natl. Acad. Sci. USA 2006, 103, 626–631. [Google Scholar] [CrossRef] [PubMed] [Green Version]
  45. Jiao, F.; Shi, X.; Han, F.; Yuan, Z. Increasing aridity, temperature and soil pH induce soil C-N-P imbalance in grasslands. Sci. Rep. 2016, 6, 19601. [Google Scholar] [CrossRef]
  46. De Bolòs, O.; Vigo, J. Flora dels Països Catalans, Licopodiàcies-Capparàcies; Editorial Barcino: Barcelona, Spain, 1984; ISBN 8472265919. [Google Scholar]
  47. Carreras, J.; Carrillo, E.; Font, X.; Ninot, J.M.; Masalles, R.M.; Vilar, L. Vegetaciò arbustiva i herbàcia (Prats i Pastures). In Manual dels hàbitats de Catalunya-Volum 5; Vigo, J., Carreras, J., Ferrè, A., Eds.; Generalitat de Catalunya: Barcelona, Spain, 2006. [Google Scholar]
  48. San Emeterio, L.; Múgica, L.; Ugarte, M.D.; Goicoa, T.; Canals, R.M. Sustainability of traditional pastoral fires in highlands under global change: Effects on soil function and nutrient cycling. Agric. Ecosyst. Environ. 2016, 235, 155–163. [Google Scholar] [CrossRef]
  49. Black, C.A. Methods of Soil Analysis: Part I, Physical and Mineralogical Properties; American Society of Agronomy, Inc. & Soil Science Society of America, Inc.: Madison, WI, USA, 1965. [Google Scholar]
  50. Tian, L.; Dell, E.; Shi, W. Chemical composition of dissolved organic matter in agroecosystems: Correlations with soil enzyme activity and carbon and nitrogen mineralization. Appl. Soil Ecol. 2010, 46, 426–435. [Google Scholar] [CrossRef]
  51. Popova, I.E.; Deng, S. A high-throughput microplate assay for simultaneous colorimetric quantification of multiple enzyme activities in soil. Appl. Soil Ecol. 2010, 45, 315–318. [Google Scholar] [CrossRef]
  52. Kandeler, E.; Gerber, H. Short-term assay of soil urease activity using colorimetric determination of ammonium. Biol. Fertil. Soils 1988, 6, 68–72. [Google Scholar] [CrossRef]
  53. Rodríguez-Loinaz, G.; Onaindia, M.; Amezaga, I.; Mijangos, I.; Garbisu, C. Relationship between vegetation diversity and soil functional diversity in native mixed-oak forests. Soil Biol. Biochem. 2008, 40, 49–60. [Google Scholar] [CrossRef]
  54. Ter Braak, C.J.F.; Šmilauer, P. Canoco Reference Manual and User’s Guide: Software for Ordination, Version 5.0; Microcomputer Power: Ithaca, NY, USA, 2012. [Google Scholar]
  55. Rodríguez, A.; Canals, R.M.; Plaixats, J.; Albanell, E.; Debouk, H.; Garcia-Pausas, J.; San Emeterio, L.; Jimenez, J.J.; Sebstià, M.-T. Interactions between biogeochemical and management factors explain soil organic carbon in Pyrenean grasslands. Biogeosci. Discuss. 2020, 1–56. [Google Scholar] [CrossRef] [Green Version]
  56. Oksanen, J.; Blanchet, F.G.; Kindt, R.; Legendre, P.; Minchin, P.R.; O’Hara, R.B.; Simpson, G.L.; Solymos, P.; Stevens, M.H.H.; Wagner, H. Vegan: Community Ecology Package. R Package Version 2.0-7. 2013. Available online: http://CRAN.Rproject.org/package=vegan (accessed on 30 August 2020).
  57. Heiberger, R.M.; Holland, B. Statistical Analysis and Data Display: An Intermediate Course with Examples in S-Plus, R, and SAS. Springer Texts in Statistics; Springer Science + Business Media: New York, NY, USA, 2004; ISBN 0-387-40270-5. [Google Scholar]
  58. Symonds, M.R.E.; Moussalli, A. A brief guide to model selection, multimodel inference and model averaging in behavioural ecology using Akaike’s information criterion. Behav. Ecol. Sociobiol. 2011, 65, 13–21. [Google Scholar] [CrossRef]
  59. R Core Team. R: A Language and Environment for statistical Computing; R Foundation for Statistical Computing: Vienna, Austria, 2013; Available online: http://www.R-project.org/ (accessed on 30 August 2020).
  60. Lenth, R.V. Response-surface methods in R, Using rsm. J. Stat. Softw. 2009, 32, 1–17. [Google Scholar] [CrossRef] [Green Version]
  61. Sarkar, D. Lattice: Multivariate Data Visualization with R; Springer: New York, NY, USA, 2008; ISBN 978-0-387-75968-5. [Google Scholar]
  62. Bates, D.; Maechler, M.; Bolker, B. lme4: Linear Mixed-Effects Models Using S4 Classes. J. Stat. Softw. 2012, 67. [Google Scholar]
  63. Gelman, A.; Su, Y. Package arm: Data Analysis Using Regression and Multilevel/Hierarchical Models; Cambridge University Press: New York, NY, USA, 2013; Available online: https://CRAN.R-project.org/package=arm (accessed on 30 August 2020).
  64. Neuwirth, E. RColorBrewer: ColorBrewer Palettes, Cynthia Brewer, Mark Harrower and The Pennsylvania State University. 2011. Available online: https://CRAN.R-project.org/package=RColorBrewer (accessed on 30 August 2020).
  65. Yang, N.; Zou, D.; Yang, M.; Lin, Z. Variations in soil microbial biomass carbon and soil dissolved organic carbon in the re-vegetation of hilly slopes with purple soil. PLoS ONE 2016, e0166536. [Google Scholar] [CrossRef]
  66. Paul, K.I.; Polglase, P.J.; O’Connell, A.M.; Carlyle, J.C.; Smethurst, P.J.; Khanna, P.K. Defining the relation between soil water content and net nitrogen mineralization. Eur. J. Soil Sci. 2003, 54, 39–47. [Google Scholar] [CrossRef]
  67. Mueller, K.E.; Hobbie, S.E.; Tilman, D.; Reich, P.B. Effects of plant diversity, N fertilization, and elevated carbon dioxide on grassland soil N cycling in a long-term experiment. Glob. Chang. Biol. 2013, 19, 1249–1261. [Google Scholar] [CrossRef]
  68. Zhalnina, K.; Dörr de Quadros, P.; Camargo, F.O.; Triplett, E.W. Drivers of archaeal ammonia-oxidizing communities in soil. Front. Microbiol. 2012, 3, 1–9. [Google Scholar] [CrossRef] [Green Version]
  69. Troy, C.; Tang, J. Effects of Temperature and Moisture Stress on Nitrous Oxide Production in Agricultural Soil; Villanova University: Vilanova, PA, USA, 2011. [Google Scholar]
  70. Sardans, J.; Peñuelas, J.; Estiarte, M. Seasonal patterns of root-surface phosphatase activities in a Mediterranean shrubland. Responses to experimental warming and drought. Biol. Fertil. Soils 2007, 43, 779–786. [Google Scholar] [CrossRef]
  71. Shen, J.; Yuan, L.; Zhang, J.; Li, H.; Bai, Z.; Chen, X.; Zhang, W.; Zhang, F. Phosphorus dynamics: From soil to plant. Plant Physiol. 2011, 156, 997–1005. [Google Scholar] [CrossRef] [PubMed] [Green Version]
  72. Leirós, M.C.; Trasar-Cepeda, C.; García-Fernández, F.; Gil-Sostres, F. Defining the validity of a biochemical index of soil quality. Biol. Fertil. Soils 1999, 30, 140–146. [Google Scholar] [CrossRef]
  73. Sardans, J.; Peñuelas, J. Drought decreases soil enzyme activity in a Mediterranean Quercus ilex L. forest. Soil Biol. Biochem. 2005, 37, 455–461. [Google Scholar] [CrossRef]
  74. Lauber, C.L.; Hamady, M.; Knight, R.; Fierer, N. Pyrosequencing-based assessment of soil pH as a predictor of soil bacterial community structure at the continental scale. Appl. Environ. Microbiol. 2009, 75, 5111–5120. [Google Scholar] [CrossRef] [PubMed] [Green Version]
  75. Andersson, S.; Nilsson, S.I.; Saetre, P. Leaching of dissolved organic carbon (DOC) and dissolved organic nitrogen (DON) in mor humus as affected by temperature and pH. Soil Biol. Biochem. 2000, 32, 1–10. [Google Scholar] [CrossRef]
  76. Fröberg, M.; Berggren, D.; Bergkvist, B.; Bryant, C.; Mulder, J. Concentration and fluxes of dissolved organic carbon (DOC) in three Norway spruce stands along a climatic gradient in Sweden. Biogeochemistry 2006, 77, 1–23. [Google Scholar] [CrossRef]
  77. Kalbitz, K.; Schmerwitz, J.; Schwesig, D.; Matzner, E. Biodegradation of soil-derived dissolved organic matter as related to its properties. Geoderma 2003, 113, 273–291. [Google Scholar] [CrossRef]
  78. Solinger, S.; Kalbitz, K.; Matzner, E. Controls on the dynamics of dissolved organic carbon and nitrogen in a Central European deciduous forest. Biogeochemistry 2001, 327–349. [Google Scholar] [CrossRef]
  79. Kaiser, K.; Guggenberger, G.; Haumaier, L.; Zech, W. The composition of dissolved organic matter in forest soil solutions: Changes induced by seasons and passage through the mineral soil. Org. Geochem. 2002, 33, 307–318. [Google Scholar] [CrossRef]
  80. Butterbach-Bahl, K.; Baggs, E.M.; Dannenmann, M.; Kiese, R.; Zechmeister-Boltenstern, S. Nitrous oxide emissions from soils: How well do we understand the processes and their controls? Philos. Trans. R. Soc. Lond. B Biol. Sci. 2013, 368, 20130122. [Google Scholar] [CrossRef]
  81. Haynes, R.J. Nitrification. In Mineral Nitrogen in the Plant-Soil System; Haynes, R.J., Ed.; Academic Press: New York, NY, USA, 1986; pp. 127–165. [Google Scholar]
  82. De Boer, W.; Kowalchuk, G.A. Nitrification in acid soils: Micro-organisms and mechanisms. Soil Biol. Biochem. 2001, 33, 853–866. [Google Scholar] [CrossRef]
  83. Burns, R.G.; DeForest, J.L.; Marxsen, J.; Sinsabaugh, R.L.; Stromberger, M.E.; Wallenstein, M.D.; Weintraub, M.N.; Zoppini, A. Soil enzymes in a changing environment: Current knowledge and future directions. Soil Biol. Biochem. 2013, 58, 216–234. [Google Scholar] [CrossRef]
  84. Caldwell, B.A. Enzyme activities as a component of soil biodiversity: A review. Pedobiologia 2005, 49, 637–644. [Google Scholar] [CrossRef]
  85. Olivera, N.L.; Prieto, L.; Carrera, A.L.; Cisneros, H.S.; Bertiller, M.B. Do soil enzymes respond to long-term grazing in an arid ecosystem? Plant Soil 2014, 1–14, 35–48. [Google Scholar] [CrossRef]
  86. Prieto, L.H.; Bertiller, M.B.; Carrera, A.L.; Olivera, N.L. Soil enzyme and microbial activities in a grazing ecosystem of Patagonian Monte, Argentina. Geoderma 2011, 162, 281–287. [Google Scholar] [CrossRef]
  87. Sebastià, M.T.; de Bello, F.; Puig, L.; Taull, M. Grazing as a factor structuring grasslands in the Pyrenees. Appl. Veg. Sci. 2008, 11, 215–222. [Google Scholar] [CrossRef]
  88. Tabatabai, M.A. Soil enzymes. In Methods of Soil Analysis: Microbiological and biochemical Properties Part 2; Weaver, R.W., Angle, J.R., Bottomley, P.S., Eds.; Soil Science Society America: Madison, WI, USA, 1994; pp. 775–833. [Google Scholar]
  89. Hao, Y.; He, Z. Effects of grazing patterns on grassland biomass and soil environments in China: A meta-analysis. PLoS ONE 2019, 14, e0215223. [Google Scholar] [CrossRef]
  90. Ding, K.; Zhong, L.; Xin, X.P.; Xu, Z.H.; Kang, X.M.; Liu, W.J.; Rui, Y.C.; Jiang, L.L.; Tang, L.; Wang, Y.F. Effect of grazing on the abundance of functional genes associated with N cycling in three types of grassland in Inner Mongolia. J. Soils Sediments 2015, 15, 683–693. [Google Scholar] [CrossRef]
  91. Klumpp, K.; Fontaine, S.; Attard, E.; Le Roux, X.; Gleixner, G.; Soussana, J.F. Grazing triggers soil carbon loss by altering plant roots and their control on soil microbial community. J. Ecol. 2009, 97, 876–885. [Google Scholar] [CrossRef]
  92. Wardle, D.A.; Yeates, G.W.; Williamson, W.; Bonner, K.I. The response of a three trophic level soil food web to the identity and diversity of plant species and functional groups. Oikos 2003, 102, 45–56. [Google Scholar] [CrossRef]
  93. Cui, H.-J.; Wang, G.-X.; Yang, Y.; Yang, Y.; Chang, R.-Y.; Ran, F. Soil microbial community composition and its driving factors in alpine grasslands along a mountain elevational gradient. J. Mt. Sci. 2016, 13, 1013–1023. [Google Scholar] [CrossRef]
  94. Canals, R.M.; Eviner, V.T.; Herman, D.J.; Chapin, F.S. Plant colonizers shape early N-dynamics in gopher-mounds. Plant Soil 2005, 276, 327–334. [Google Scholar] [CrossRef]
  95. Strecker, T.; Barnard, R.L.; Niklaus, P.A.; Scherer-Lorenzen, M.; Weigelt, A.; Scheu, S.; Eisenhauer, N. Effects of plant diversity, functional group composition, and fertilization on soil microbial properties in experimental grassland. PLoS ONE 2015, 10, e0125678. [Google Scholar] [CrossRef] [PubMed]
  96. Fang, S.; Liu, D.; Tian, Y.; Deng, S.; Shang, X. Tree species composition influences enzyme activities and microbial biomass in the Rhizosphere: A rhizobox approach. PLoS ONE 2013, 8, e61461. [Google Scholar] [CrossRef]
  97. Dijkstra, F.A.; West, J.B.; Hobbie, S.E.; Reich, P.B.; Trost, J. Plant diversity, CO2, and N influence inorganic and organic N leaching in grasslands. Ecology 2007, 88, 490–500. [Google Scholar] [CrossRef]
  98. Eisenhauer, A.N.; Beßler, H.; Engels, C.; Gleixner, G.; Habekost, M.; Milcu, A.; Partsch, S.; Sabais, A.C.W.; Scherber, C.; Steinbeiss, S.; et al. Plant diversity effects on soil microorganisms support the singular hypothesis. Ecology 2010, 91, 485–496. [Google Scholar] [CrossRef]
  99. Roscher, C.; Schumacher, J.; Gubsch, M.; Lipowsky, A.; Weigelt, A.; Buchmann, N.; Schmid, B.; Schulze, E.D. Using plant functional traits to explain diversity-productivity relationships. PLoS ONE 2012, 7, e36760. [Google Scholar] [CrossRef]
  100. Moran-Zuloaga, D.; Dippold, M.; Glaser, B.; Kuzyakov, Y. Organic nitrogen uptake by plants: Reevaluation by position-specific labeling of amino acids: Reevaluation of organic N uptake by plants by position-specific labeling. Biogeochemistry 2015, 125, 359–374. [Google Scholar] [CrossRef]
  101. Nyfeler, D.; Huguenin-Elie, O.; Suter, M.; Frossard, E.; Lüscher, A. Grass-legume mixtures can yield more nitrogen than legume pure stands due to mutual stimulation of nitrogen uptake from symbiotic and non-symbiotic sources. Agric. Ecosyst. Environ. 2011, 140, 155–163. [Google Scholar] [CrossRef]
  102. Suter, M.; Connolly, J.; Finn, J.A.; Loges, R.; Kirwan, L.; Sebastià, M.T.; Lüscher, A. Nitrogen yield advantage from grass-legume mixtures is robust over a wide range of legume proportions and environmental conditions. Glob. Chang. Biol. 2015, 21, 2424–2438. [Google Scholar] [CrossRef] [Green Version]
  103. Oelmann, Y.; Buchmann, N.; Gleixner, G.; Habekost, M.; Roscher, C.; Rosenkranz, S.; Schulze, E.D.; Steinbeiss, S.; Temperton, V.M.; Weigelt, A.; et al. Plant diversity effects on aboveground and belowground N pools in temperate grassland ecosystems: Development in the first 5 years after establishment. Glob. Biogeochem. Cycles 2011, 25, 1–11. [Google Scholar] [CrossRef]
  104. Liang, Y.; Yang, Y.; Yang, C.; Shen, Q.; Zhou, J.; Yang, L. Soil enzymatic activity and growth of rice and barley as influenced by organic manure in an anthropogenic soil. Geoderma 2003, 115, 149–160. [Google Scholar] [CrossRef]
  105. Zhang, T.; Wan, S.; Kang, Y.; Feng, H. Urease activity and its relationships to soil physiochemical properties in a highly saline-sodic soil. J. Soil Sci. Plant Nutr. 2014, 14, 304–315. [Google Scholar] [CrossRef]
Figure 1. Location of the six study sites: MON (Monegrillo), ALG (Alguaire), BES (Besora), BERT (La Bertolina), CAST (Castellar de n’Hug), and NIU (Niu de l’Àliga). The borders in the map represent the limit between Catalonia and Aragón. The spatial scale of the map is 1:2,000,000 and the resolution of the raster surface is 930 m.
Agronomy 10 01291 g001
Figure 2. Distribution of the explained variation of the two sets of variables. Environmental variables (climatic, management and soil variables): mean minimum air temperature (MTmin), Temperature seasonality index of Sebastià (TSIS = mean summer air temperature—mean annual air temperature), pH, moisture, sheep and cattle grazing. Plant functional diversity variables: Forb, Grass, Legume; forb-grass (FG), forb-legume (FL), and grass-legume (GL) pairwise interactions.
Agronomy 10 01291 g002
Figure 3. RDA ordination diagram showing the relationship between soil activity and fertility, and selected environmental factors in six grassland sites in the northern part of the Iberian Peninsula. Bold arrows with an empty arrowhead represent explanatory variables: environmental (climatic, management and soil): Temperature seasonality index of Sebastià (TSIS); mean minimum air temperature (MTmin) and plant functional diversity variables: FG (pairwise interactions between forbs and grasses); FL (pairwise interactions between forbs and legumes); GL (pairwise interactions between grasses and legumes). Thinner arrows and in italics represent soil activity and fertility response variables: dissolved organic carbon (DOC); dissolved organic nitrogen (DON); total nitrogen (Total N), microbial biomass carbon (MBC); microbial biomass nitrogen (MBN). The first (x) and second (y) axes explained 84.75% and 0.54% of the total variance, respectively. The adjusted explained variation (Radj.) of the RDA model was 81.4%. The arrow length and direction correspond to the variance that can be explained by the environmental (climatic, soil and management) variables. The direction of an arrow indicates an increasing magnitude of the variable. The perpendicular distance between orders and environmental variable axes in the plot reflects their correlations. The smaller the distance, the stronger the correlation. Grazer type is a categorical variable so we removed the arrow and substituted it by an X.
Agronomy 10 01291 g003
Figure 4. Contour plots representing the variations of soil activity and fertility functions in relation to the relative proportions of the plant functional types (F = forb; L = legume; G = grass) on soil parameters: total nitrogen (total N), nitrification potential, dissolved organic nitrogen (DON), microbial biomass nitrogen (MBN), urease, and phosphatase activities. Contour plots are normalized and scaled from 0, representing the minimum value of the soil parameter, to a maximum of 1. Color intensity shows a gradient from the minimum (white) to the maximum (black) soil activity/fertility parameter.
Agronomy 10 01291 g004
Table 1. General climatic and management characterization of the six study sites: Alguaire (ALG), Monegrillo (MON), Besora (BES), La Bertolina (BERT); Niu de l’Àliga (NIU).
VariablesALGMONBESBERTCASTNIU
Latitude41°43′46,60″41°39′45,62″42°1′13,07″42°5′57,33″42°18′18,84″42°19′18,91″
Longitude0°31′30″−1°37′22,15″1°36′23,48″1°39′48,63″2°1′57,58″1°54′4,47″
Altitude (m)334657712127618502479
MAP (mm)421.4225.2720.5954.811991302
MAT (°C)13.912.611.78.75.42.4
Lang’s index30.3217.8761.58109.75222.04542.5
MST (°C)22.8232018.215.313.8
MSP (mm)95.793.8237.5465.2319.1278.8
MTmin (°C)010−1−5−7
MTmax (°C)282825242322
TSIS8.78.68.27.87.37.4
pH8.57 ± 0.18.46 ± 0.016.77 ± 0.196.87 ± 0.066.02 ± 0.326.1 ± 0.15
Soil moisture (%)5 ± 118 ± 217 ± 211 ± 142 ± 234 ± 2
Grazer typeSheepSheepCattleCattleCattle, sheepCattle, horses
Grasses (%)12–987–9918–756–9537–9716.3–86
Forbs (%)0.2–880–9319–790–772.6–626.5–81
Legumes (%)0–0.40–0.20.1–481.2–740–450–44
MAP = mean annual precipitation; MAT = mean annual air temperature; Lang’s rain factor index (1920) to determine the aridity of a site (arid, humid, and wet): the lower the index the more arid the site; MST = mean summer air temperature (average daily air temperature of the 3 meteorological months of the summer: June, July, and August), MSP = mean summer precipitation; MTmin = mean annual minimum air temperature; MTmax = mean annual maximum air temperature; TSIS = Temperature Seasonality Index of Sebastià (TSIS = MST − MAT) as in Rodríguez et al. 2020 [45], informing about how high summer temperatures are compared with those throughout the year; high TSIS values include both extreme continental climates with cold winters and hot summers, as well as high mountain alpine climates with very chilly winters, and mild summers. Values of TSIS and pH refer to mean ± standard deviation. The presented values for grasses, forbs, and legumes refer to minimum and maximum values.
Table 2. Conditional and simple term effects of the Redundancy Analysis (RDA) analyses. The % explained shows the percentage of variability explained by each variable. The explanatory variables include environmental (climatic, management and soil) and plant functional diversity variables: FG = pairwise interactions of forbs and grasses; FL = pairwise interactions of forbs and legumes; GL = pairwise interactions of grasses and legumes; MTmin = mean annual minimum air temperature. Conditional term effects refer to the unique effects of each set of variables unlike the simple effects, which refer to the simple marginal effects of each set of variables.
VariableConditional Term EffectsSimple Term Effects
% ExplainedFPadj% ExplainedFPadj
Large-scale climatic and management factors
MTmin0.30.7n.s.57.963.2<0.001
TSIS0.41n.s.69.3104<0.001
Sheep grazing24.90.060.50.2n.s.
Cattle grazing0.10.3n.s.34.624.3<0.001
Site-specific soil factors
Moisture731240.00173124<0.001
pH2.86.4<0.0558.565<0.001
PFT main effects
Grass0.82.1n.s.0.40.2n.s.
Forb0.71.7n.s.1.40.6n.s.
Legume0.20.4n.s.0.80.4n.s.
PFT interactions
FG4.910<0.018.94.50.08
FL0.61.5n.s.0.60.3n.s.
GL0.20.6n.s.5.22.5n.s.
Table 3. Best fitted Generalized diversity-interaction models for soil activity and fertility parameters (response variables). The explanatory variables include climatic variables: MTmax = mean annual maximum air temperature; MAP = mean annual precipitation; MTmin = mean annual minimum air temperature; MST = mean summer air temperature; management variables: Cattle and sheep grazers; and plant functional type diversity variables: G = Grass, L = Legume, F = Forb; FG = forb-grass, GL = grass-legume and FL = forb-legume pairwise interactions; Ek = evenness. For more information on the coefficients of the explanatory variables, see Table S1 in Supplementary Materials.
Soil ParameterModelAdjusted r2p-Value
Model 1. Only environmental variables included
Nitrate(+) MTmax *** (+) Cattle **0.38<0.001
Ammonium(−) MTmax *** (−) MAP+ (+) Sheep *** (+) Cattle0.84<0.001
DOC(+) MTmax ** (−) MTmin *** (+) MAP ** + (1) Sheep *** (+) Cattle ***0.79<0.001
MBC(−) MTmax *** (+) MTmin * (−) MAP * (+) Sheep ***0.75<0.001
Glucosidase(+) MTmax * (−) MTmin (+) MAP+ (+) Cattle+0.17<0.05
Model 3. Environmental variables + PFT identity effects + PFT pairwise interactions
MBN(+) MTmin *** (−) MTmax *** (−) MAP ** (+) Sheep *** (−) G (−) F (−) L (+) FG *(−) GL (+) FL (−) MTmin:G * (−) MTmin:F+ (−) MTmin:L0.88<0.001
DON(+) MTmin *** (−) MST ** (+) Sheep *** (−) G (−) F+ (−) L (+) FG (+) GL ** (+) FL0.60<0.001
Phosphatase(−) MTmin *** (+) Sheep ** (−) G (−) F+ (−) L (+) FG *** (−) GL (+) FL0.63<0.001
Model 4. Environmental variables + PFT identity effects + evenness
Total N(−) MTmin *** (−) MST ** (+) Sheep *** (−) G (−) F (−) L (+) Ek *0.84<0.001
Urease(+) MTmin ** (+) MTmax *** (−) MST+ (−) Sheep *** (+) Cattle *** (−) G (−) F ** (+) L (+) Ek **0.79<0.001
Nitrification Potential(+) MTmin *** (+) MTmax *** (−) Sheep *** (−) G+ (−) F (−) L (+) Ek+0.78<0.001
*** p < 0.001; ** p < 0.01; * p < 0.05.

