Article

Resistance of Maize Hybrids to Fusarium graminearum, F. culmorum, and F. verticillioides Ear Rots with Toothpick and Silk Channel Inoculation, as Well as Their Toxin Production

1
Cereal Research non-profit Ltd., P.O. Box 391, 6701 Szeged, Hungary
2
Department of Microbiology, Faculty of Science and Informatics, University of Szeged, 6726 Szeged, Hungary
3
Department of Field Crops Research, NAIK, 6726 Szeged, Hungary
*
Author to whom correspondence should be addressed.
Agronomy 2020, 10(9), 1283; https://doi.org/10.3390/agronomy10091283
Submission received: 2 August 2020 / Revised: 16 August 2020 / Accepted: 22 August 2020 / Published: 29 August 2020
(This article belongs to the Special Issue Genetics and Genomics for Plant Resistance to Biotic Stresses)

Abstract

:
Testing Fusarium resistance to ear rots in maize requires a well-supported methodology and tests for toxin responses. In this study, commercial hybrids were tested for resistance to Fusarium graminearum, Fusarium culmorum, and Fusarium verticillioides (kernel and silk channel), as well as their toxin response. One third of the hybrids tested showed a similar resistance or susceptibility to the three pathogens and their toxin response, but there is no proof for their genetic background being the same or different. The performance of the remaining hybrids was highly variable and supports the idea of different genetic regulation. The mean ear rot severity of the kernel resistance was doubled compared with the silk channel resistance data. The ear rot and toxin tests displayed significant positive correlations, verifying the decisive role of resistance in toxin regulation. Several hybrids, termed toxigenic hybrids, showed significant extra toxin production, indicating an additional food safety risk. The toothpick method gave more reliable results and a better differentiation of genotypes. The resistance to different Fusarium spp. in a specific growing region should be analyzed separately in independent resistance tests. Through this, the food safety risks could be better identified. Susceptible hybrids should not be used for commercial production.

1. Introduction

Toxigenic fungal species occur across the globe, wherever maize is grown. Most of the papers on this subject deal with direct breeding for resistance to one pathogen. As most toxin contamination is due to susceptible hybrids, the issue revolves around how susceptible hybrids could be excluded from commercial production. Often, more than ten Fusarium species contaminate maize, with differing ecological needs and toxin profiles [1]. Fusarium graminearum and F. verticillioides are the dominant Fusarium species in Hungary. Fusarium graminearum causes severe epidemics for a period of 1–2 years every decade. Fusarium culmorum occurs rarely in ears, but it is highly aggressive, and its heat demand is lower, therefore, it functions better in cooler seasons. Fusarium verticillioides causes an epidemic nearly every year [2], which should be treated in the future [3]. In 2014, a national epidemic was recorded, resulting in a loss of about 300 million USD in crop and animal husbandry. All three species participated in the damage, and of them, deoxynivalenol (DON) was the most severe. For this reason, we need to find approaches to develop resistance to all three Fusarium species mentioned. It is known that natural infection and species mixtures do not provide an alternative [1]. Therefore, artificial inoculation should support breeding work. The variation in F. graminearum is high in terms of aggressiveness and toxin production [4]. This is also true for F. culmorum [5,6,7]. The ear rot and toxin relations are severely influenced by the ecological conditions [8]. In spite of the significance of breeding [1], progress has been slow [9]. Our question is whether the resistance to different toxigenic fungi is connected to or follows different patterns.
Two components of resistance have been described in maize resistance to ear rot fungi [9,10]: Kernel resistance, KR (Type I), which occurs after inoculation in the middle of the ear, and silk channel resistance, SR (Type II), which occurs after inoculation of the silk or silk channel. Munkvold and Dejardins [11] concluded that kernel infection via silk mediation is more important than kernel infection through seeds, stalks, crowns, and roots. Therefore, silk inoculation is considered the best approach for artificial inoculation.
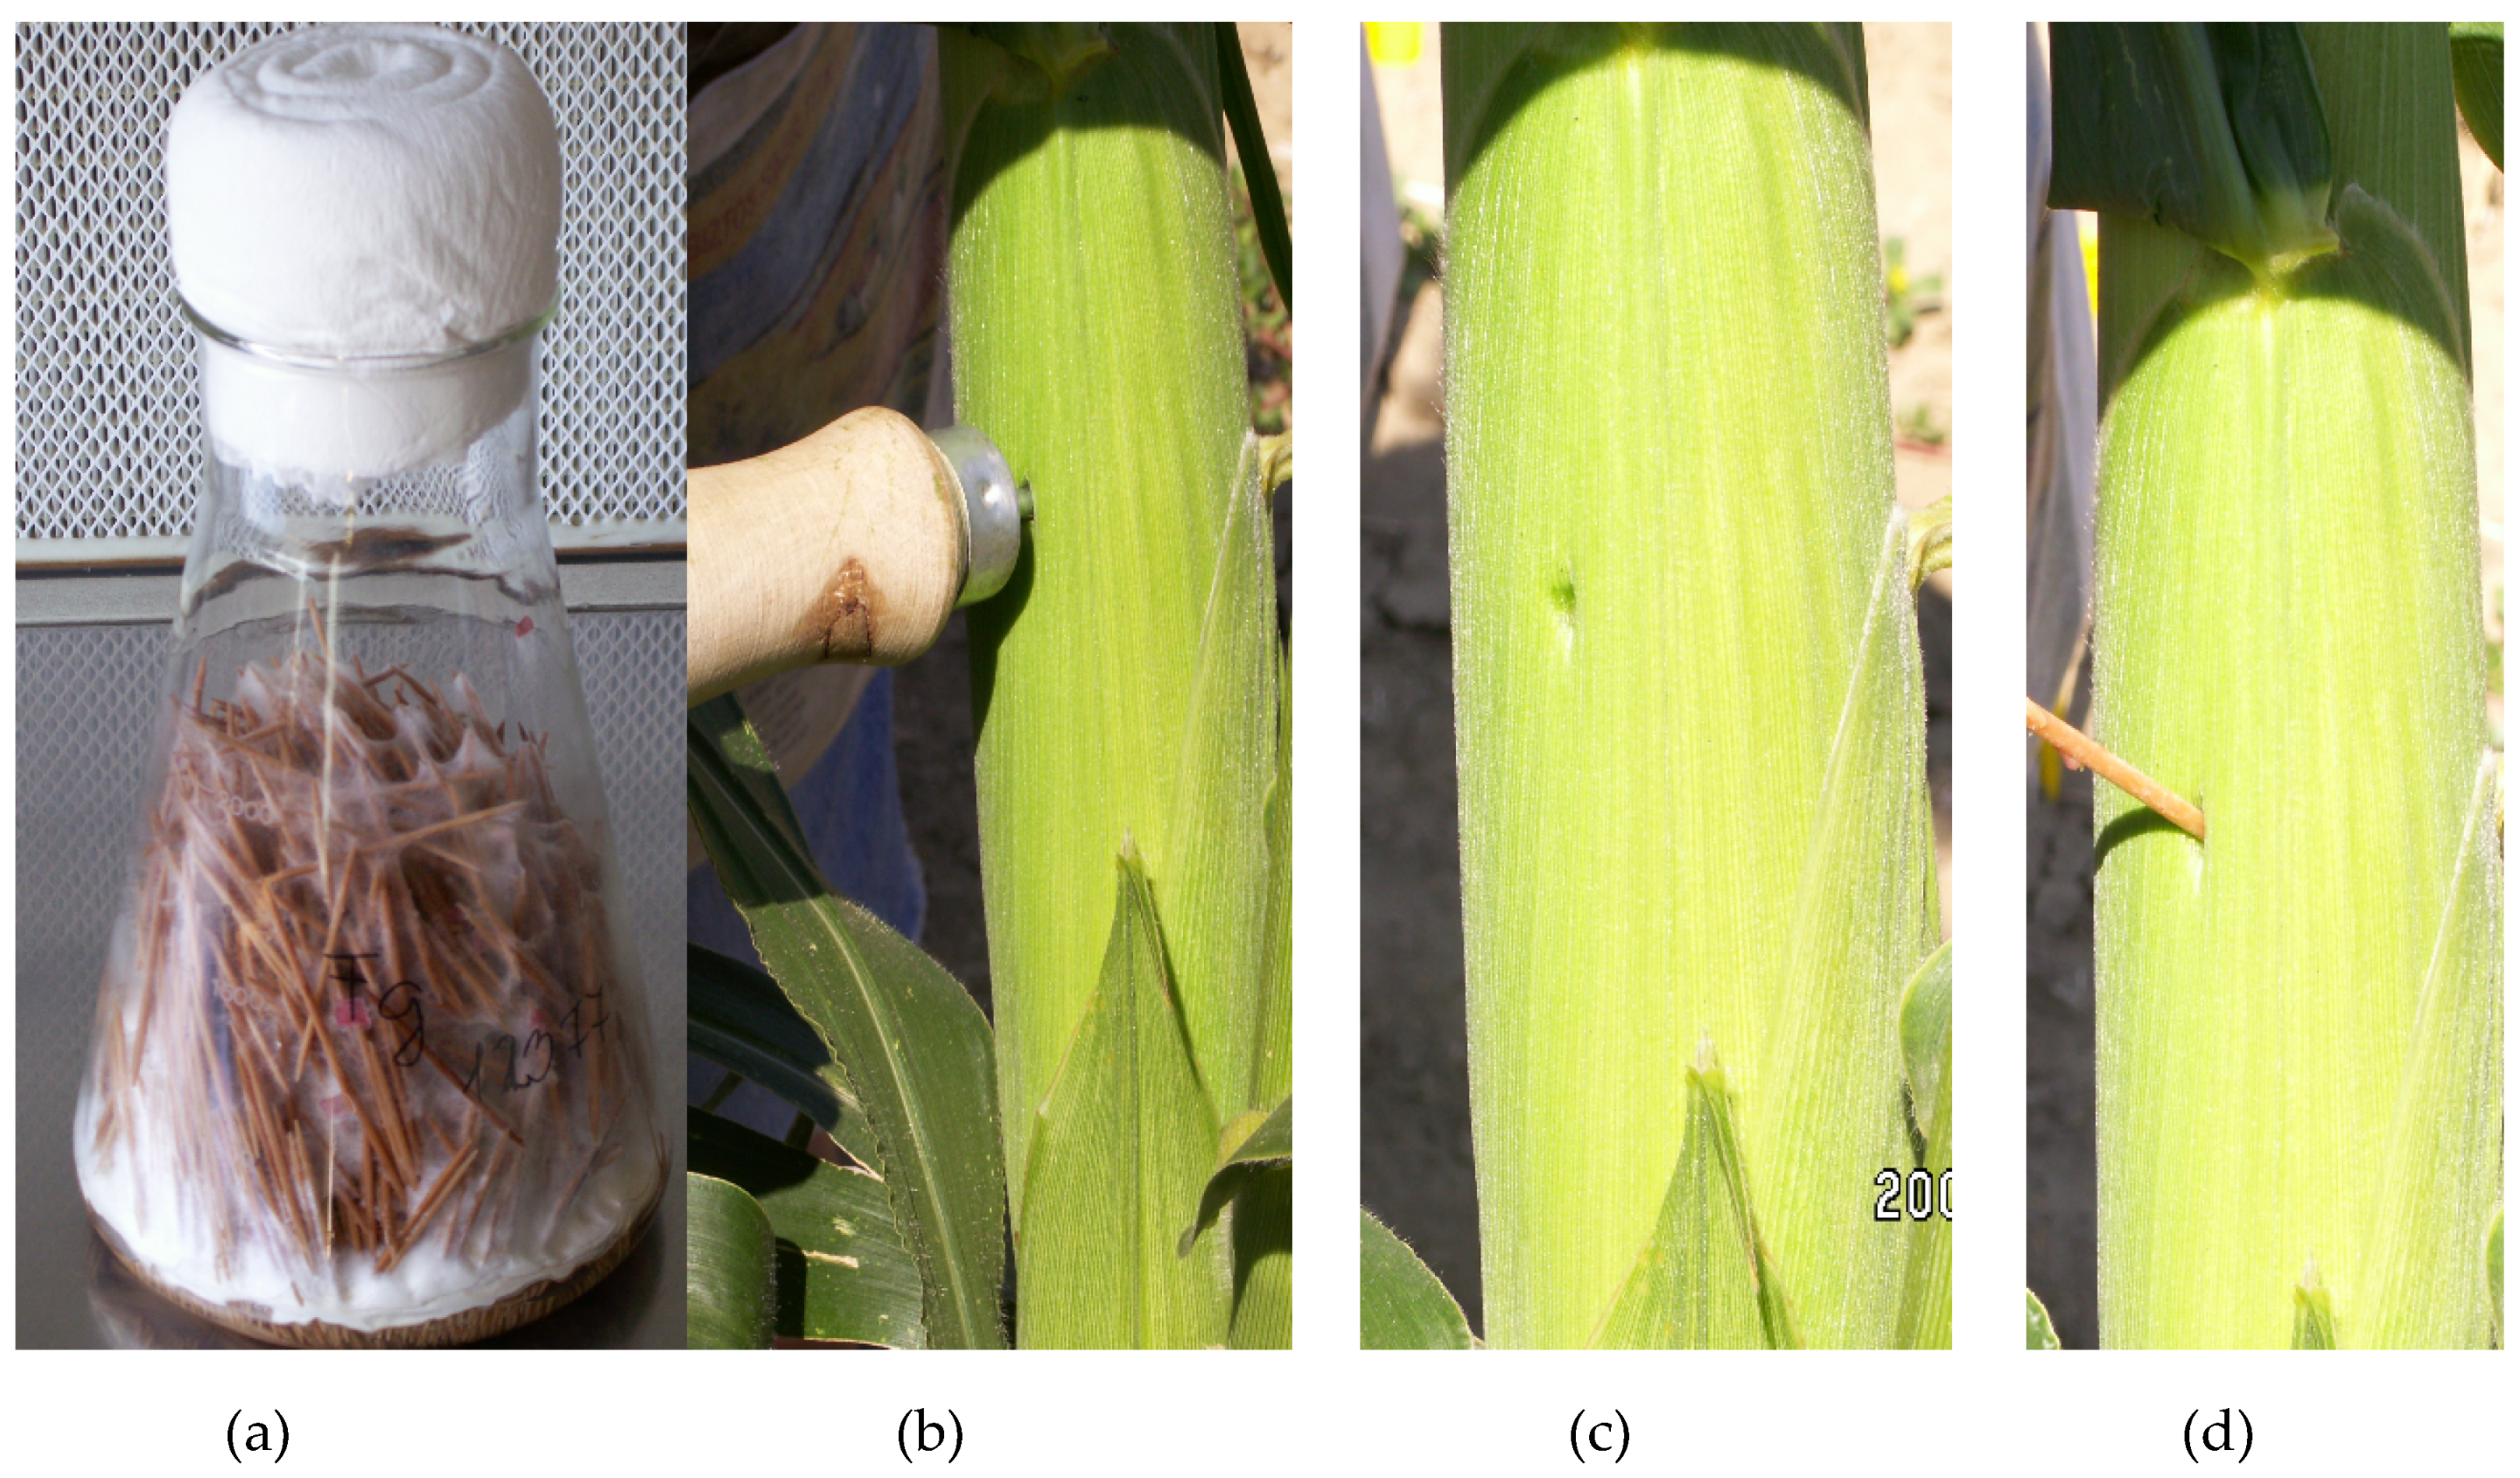
The toothpick method is very good at differentiating genotypes for KR by inserting infested toothpicks into the middle of the ear through husk leaves [5,12]. Clements et al. [13] obtained the highest infection severity, with a side injection of the ears with 5 mL inoculum, representing a method for KR testing, but with suspension. For inoculation, Reid et al. [10] used four stainless steel pins inserted into the suspension of the given fungal species before inoculation and four grains were inoculated at the same time. The possible infection severity was over 75% for susceptible hybrids in Gibberella ear rot GER. Robertson-Hoyt et al. [14] found that carrying out inoculation by penetrating husk leaves with F. verticillioides gave a much higher infection severity and toxin contamination than silk channel inoculation. It seems that KR testing has a higher stability and reproducibility. Stalk rot strongly reduces GER ear rot development [14], so genetically valid ear data need healthy stalks (irrigation and a lower plant density).
Lanubile et al. [12] reported that different techniques for silk inoculation are not equally effective. Clements et al. [13] found that spraying the silks was ineffective, and the toothpicks inserted into the silk channel were also poor. The Szeged unpublished results support this view. Silk channel inoculation for SR is generally performed on the 6–7th day after midsilking [15]. Miller et al. [16] analyzed silk resistance to F. graminearum, and broad differences were found. In susceptible genotypes, 7–9 days were required for the pathogen to reach the cob, and the resistant genotypes needed 12–15 days. For kernel inoculation, 10–15 days were suggested after midsilking [17]. Morales et al. [18] used toothpicks infested by F. verticillioides, where the conidium concentration was irrelevant. Robertson-Hoyt et al. [14] used an inoculation time of 10 days after midsilking, and another 7 days later, they applied 10 mL inoculum per primary ear. Therefore, the time required to reach the grain on the cob is about two weeks for both methods. However, the efficacy of the two methods significantly differs. The silk channel method has several setbacks. Husk leaves may be too short or too long, and they can remain closed or open early by influencing ear tip infection. At the injection of fungal suspension into a silk channel, the suspension may spread between rows. By using 2 mL of inoculum, in most cases, a part of the suspension dropped to the ground and could lead to different disease severities. Reid et al. [10] reached GER by silk mediation with only a 5–7% GER severity. Reid et al. [10] and Presello [19] used 2 mL inoculum. Loeffler [20] only applied 1 mL—there is no standard in this field.
Lemmens [21,22] found a low correlation (r = 0.12) between the two resistance types. In KR, the maximum value was 90%, and for silk channel inoculation, it was only 8%. However, Loeffler et al. [20] reported a much closer correlation (r = 0.66). Chungu et al. [23] also found a higher correlation between the two traits (r = 0.77–0.89). Reid et al. [24] stressed that few genotypes have a good resistance to both resistance types. Loeffler et al. [25] reported significant genotypic variance for both kernel and silk channel resistance. The correlation between silk and kernel resistance was moderate (r = 0.66), but there were genotypes with very diverging resistance levels with both methods. Therefore, the authors suggest the use of both inoculation methods. The rather close correlations between the results of the two inoculation methods seem to support the idea that most of the hybrids show overlapping results for the two resistance types. On the other hand, an inoculation method that reaches a higher disease severity is better. It should be added that stalk rot can significantly decrease the ear rot (pseudo resistance). Therefore, genetically valid ear rot results need plants with healthy stalks [26]. This can be enhanced by irrigation and a lower plant density.
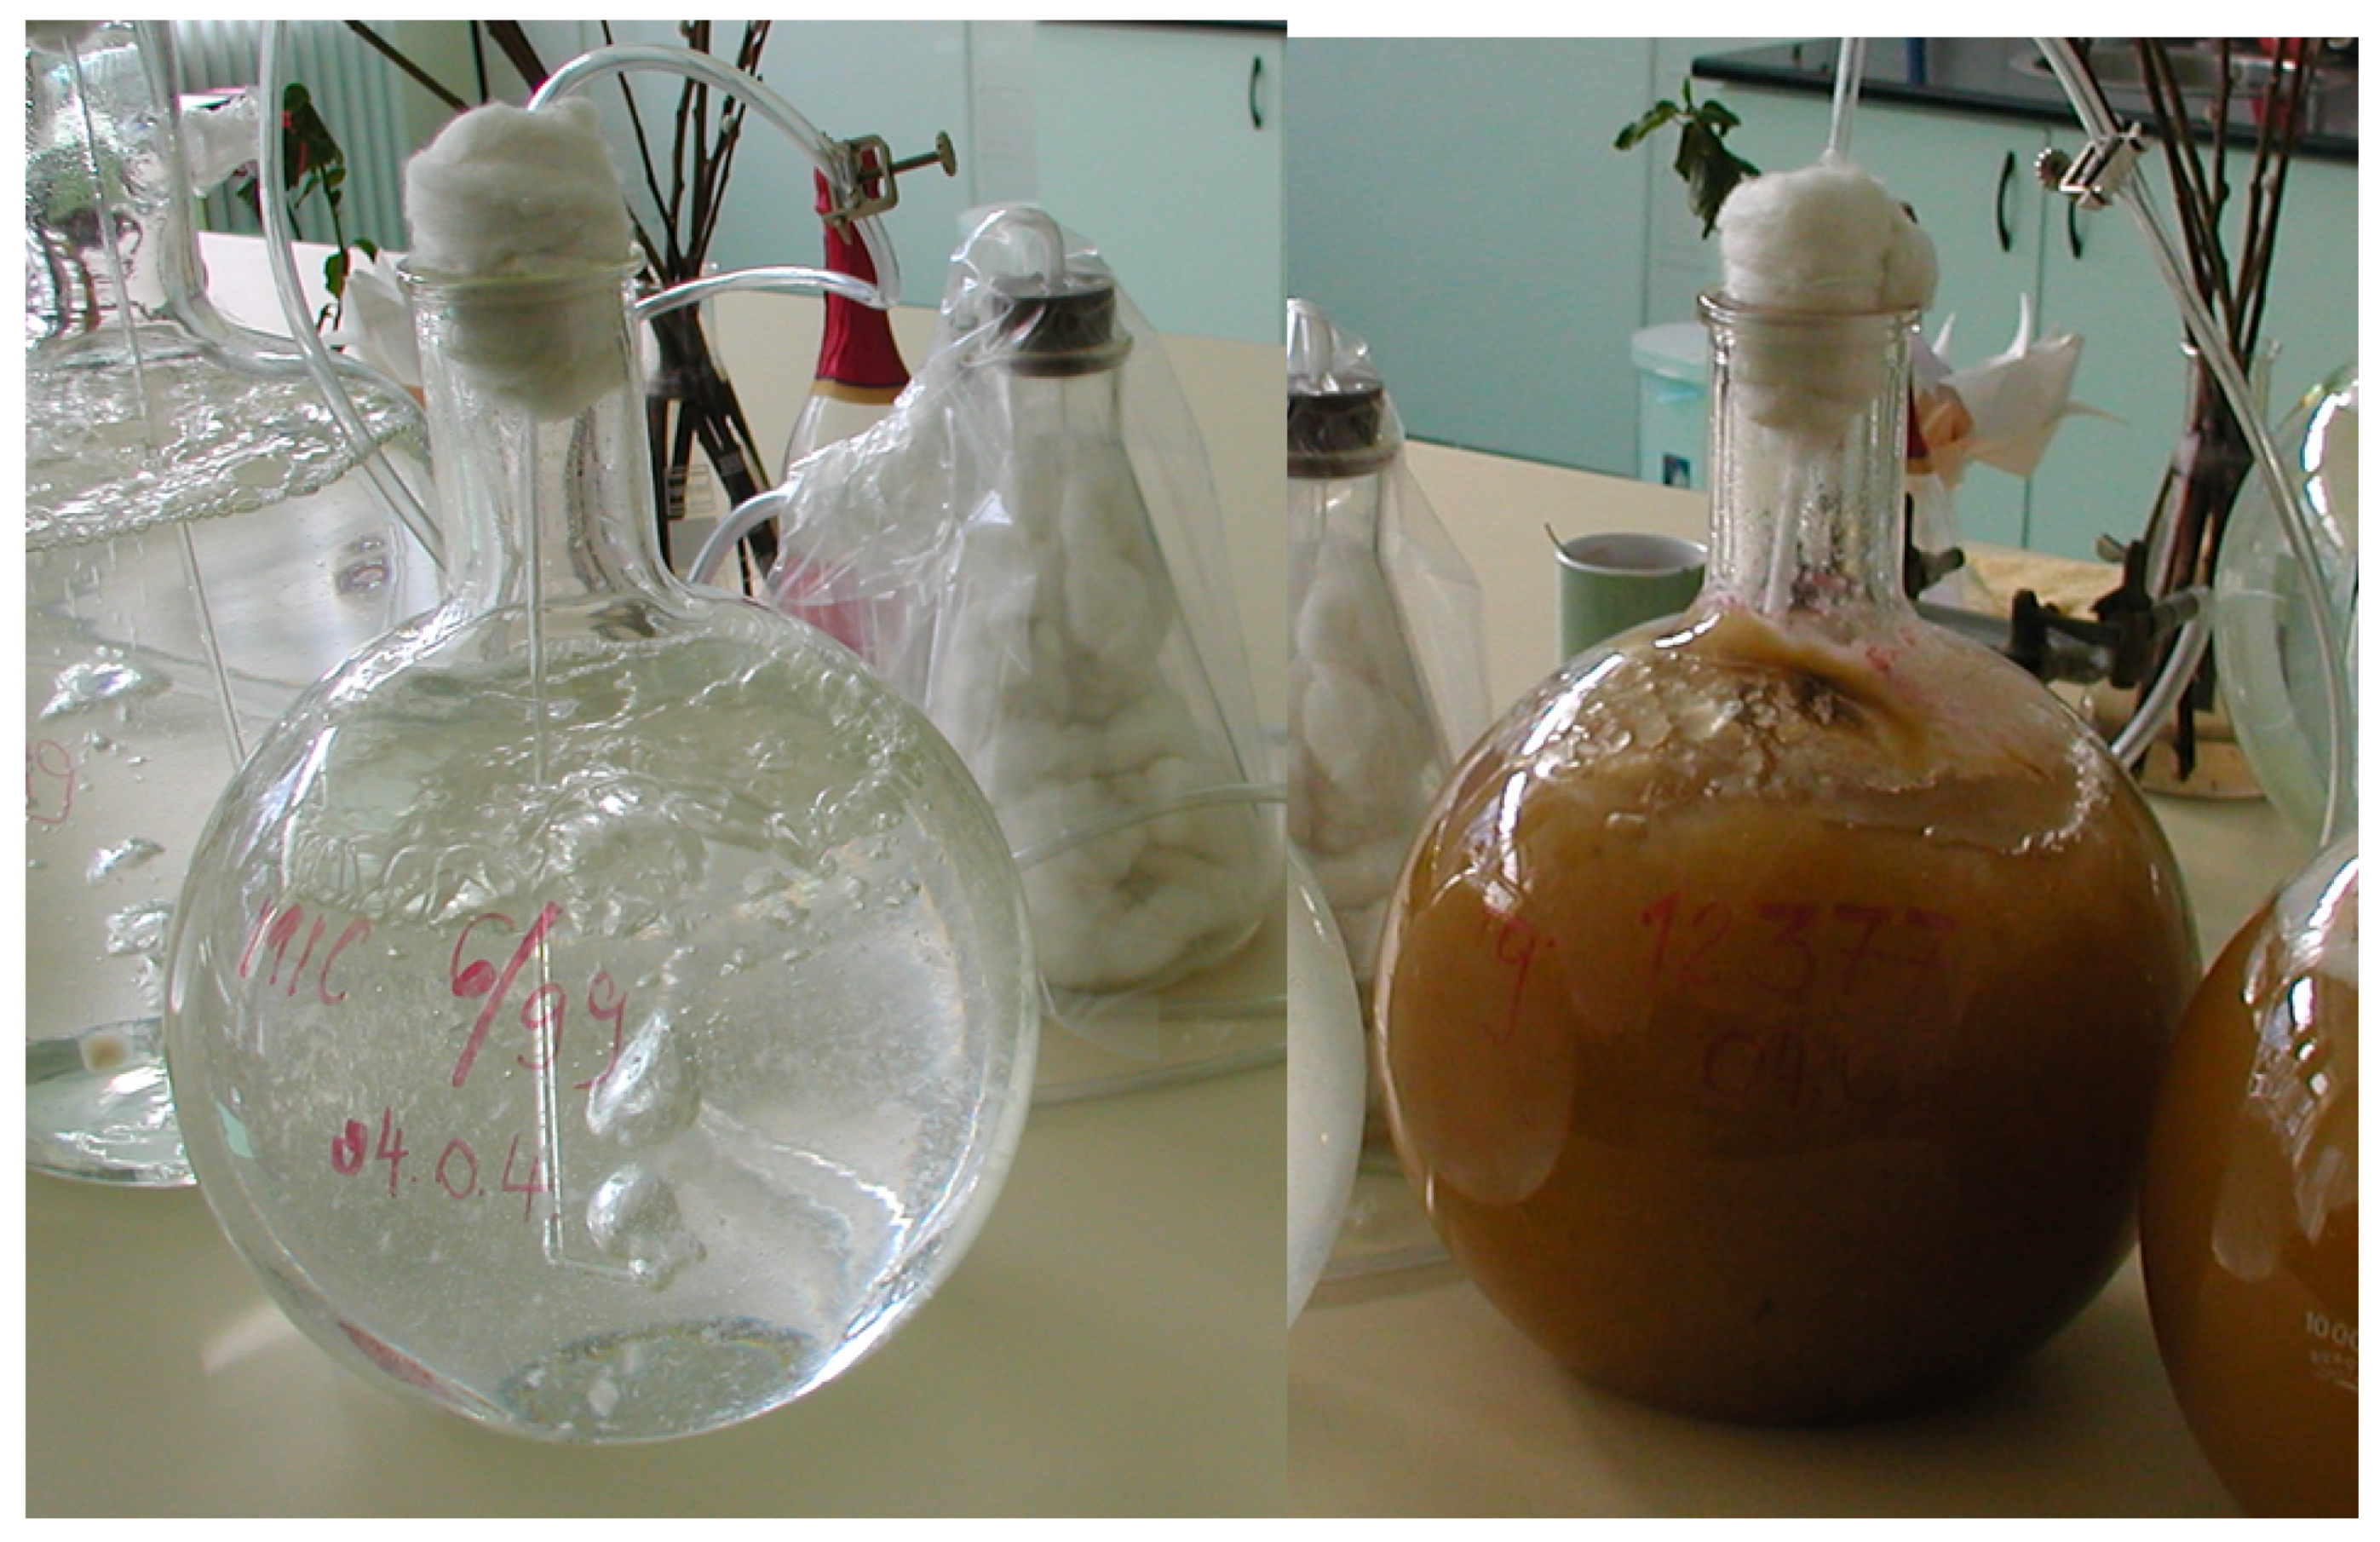
The conidium concentration only has a role in the silk channel method, as toothpicks do not need suspension. Very different concentrations were used from 5 × 10⁵–106. For Fusarium ear rot (FER), the concentration is usually 106 conidia/mL [13,22,26,27,28,29], and for GER, 2.5–5 × 10⁵ conidia concentrations were used [21,28,29]. In another case [30], no conidium concentration was given, and 106 conidia were also used [31]. It seems that no standard conidium concentration exists, and no aggressiveness test has been developed. As significant aggressiveness differences occur between isolates, a given concentration might not secure the aggressiveness that is desired. For aggressiveness tests, susceptible hybrids should be used, as the symptom severity depends also on resistance level.
Some breeders select for toxin resistance, whilst others select for disease resistance, and some even select for both. However, the data proving the effectiveness of such approaches do not have a solid basis. Robertson-Hoyt et al. [14] found strong genetic correlations between ear rot and the fumonisin concentration. Eller et al. [32] selected lines with a good resistance to FER and fumonisin. Hung et al. [33] analyzed the general and specific combining ability in a genetic study on F. verticillioides. Hybrids had 27% less ear rot and a 30% lower fumonisin content than their inbred parents, demonstrating the importance of hybrid vigor in disease resistance. Eller et al. [17] identified sources for both disease resistance and toxin contamination in FER. Lanubile et al. [12] concluded that screening for resistance to FER seems to be good enough, and toxin control is not regularly needed. Henry et al. [34] identified a correlation between the FER severity and fumonisin content (r = 0.74) (p = 0.0002), and between Aspergillus flavus and aflatoxin production (r = 0.61) (p = 0.004). They identified a genotype with a high resistance to both pathogens. Robertson-Hoyt et al. [35] found a genotypic correlation between FER and the fumonisin content (r = 0.87), and phenotypic correlation between FER and the fumonisin content (r = 0.87 and r = 0.64, respectively). They concluded that ear rot should have priority over expensive toxin measurements. Szabó et al. [2] found a high correlation between GER and DON contamination (Fg r = 0.95 and Fc = 0.82, both p = 0.001), but for FER and fumonisin, only r = 0.45 (p = 0.05) could be demonstrated. The data support the hypothesis that, at a higher rate of the tested hybrids, the resistance to disease and toxin overlap and a part of the genotypes behave differently.
Loeffler [25] found strong correlations between F. graminearum and F. verticillioides test results. Schaafsma et al. [31] tested two hybrids against F. graminearum; then, resistance tests on F. verticillioides and F. subglutinans were also conducted. Ear rot was the most severe for F. graminearum, and the least severe for F. subglutinans. The hybrid with a higher resistance to F. graminearum also exhibited a higher resistance to the two other Fusarium species. Other authors [5,7] found significant correlations between the resistance to F. graminearum and F. culmorum. Robertson-Hoyt et al. [36] found a medium level of correlation between F. verticillioides and A. flavus resistance. Presello et al. [37,38] demonstrated resistance relationships between F. graminearum and F. verticillioides ear rots. Even though most papers have dealt with one pathogen, the possibility of multiple resistances is often mentioned. The genetic background is unknown, but in regions where more toxigenic species occur, this is a highly important breeding task that should be studied.
The objectives of the study are as follows: (1) Compare kernel and silk channel resistance data; (2) analyze resistance relations of maize hybrids to F. graminearum, F. culmorum, and F. verticillioides; (3) identify hybrids with a low toxin and ear rot severity for the three major pathogens; and (4) suggest better methodological approaches to identify hybrids with increased food and feed safety.

2. Materials and Methods

2.1. Plant Material and Experimental Design

Forty-four hybrids (19 Austrian, 17 Szeged, and 8 international) were tested for the three years of 2010–2012. The test was carried out in the Kiszombor Experimental Station of the Szeged Cereal Research non-profit Ltd. Kiszombor is located in South-East Hungary (25 km from Szeged to East), in the Maros River Valley, where the alluvial soil has a high clay ratio. In dry summers, 5–7 cm wide splits are normal (GPS coordinates 46°12′49.0′′ N, 20°09′57.9′′ E). The humus content is 3%, with some variation in the field. The mean yearly precipitation was 600 mm, varying between 350 mm in 2011 and 2012 to 1100 mm in 2010. In 2010, only one irrigation was necessary after sowing to enable uniform germination and early growth. The precipitation in 2011 was similar to 2012, but the number of hot days was significantly lower. Therefore, three irrigation procedures (40 mm each) were given in both years by a linear irrigation system. The previous crop was wheat, with fertilization optimized to 10 t/ha. The sowing dates were 28 April 2010, 2 May 2011, and 30 April 2012. The spacing was 75 cm per row and 20 cm between plants (67,000 germs/ha).
The experiment was conducted in a triplicate randomized block design. A distance of 1 m was left between blocks. A plot consisted of four rows that were 4 m long, with about 20 plants per row. Three of them were exposed to artificial inoculation; one inoculum was used for a single pathogen, according to international guidelines. One raw sample was inoculated with the strain F. graminearum 13.38, a DON producer isolated from wheat kernels in 2010; one raw sample was inoculated with F. culmorum 12375, a DON producer isolated in 1978 from crown rot infected wheat; and the third raw sample was inoculated with F. verticillioides 18, a fumonisin B1 + B2 producer isolated in 2006. The same isolates were used for all years. Identification of the fungi was conducted following the Booth manual [39], and validation was conducted by PCR species specific markers, by amplifying the internal transcribed spacer (ITS) region of the conserved ribosomal DNA, using primers ITS1 and ITS4, and the translation elongation factor (EF) 1α coding region. Moreover, introns were also amplified with primers EF-1 and EF-2 [40,41].

2.2. Inoculum Production, Inoculation, and Evaluation of the Disease

According to general experience [1], wounds help infections develop. It is clear that a 1.5 mm wide and 15 mm deep hole made by an awl is a wound, and a silk channel inoculation also creates a wound. This is true for susceptible genotypes. In a highly resistant hybrid, no or minimal infection will develop, and the highly susceptible hybrid will suffer from an 80–100% ear rot severity. Therefore, the significance of these wounds in a breeding program is close to negligible.
Two inoculation methods were used. The first was the toothpick method [42], described in detail by Szabo et al. [2], and shown in Figure 1. The isolates used had been previously tested for aggressiveness, and stored in single spore cultures in a lyophilized form at −80 °C. The toothpicks were boiled three times to wash out the tannins and other antifungal compounds from the wood. Then, they were air-dried. Next, depending on the needed toothpicks, a smaller or larger Erlenmeyer flask was filled with the air dried toothpicks, with 10% plus as reserve. Then, liquid Czapek-Dox medium (1 L distilled water, 30 g cane sugar, 1 g monopotassium phosphate, 0.5 g magnesium sulfate, 0.5 g potassium chloride, and 0.01 g iron sulfate) was given to the toothpicks, and kept for about one h at room temperature. The medium, except for 5 mm, was poured off and closed by a cotton plug. The sample was then autoclaved for an hour at 120 °C, and when cooled, the fungus was placed in the flask by an inoculation needle. Following the inoculation of toothpicks, a three week interval was required for the fungus to grow throughout the toothpicks and be ready for inoculation (Figure 1). At inoculation, a hole was made with an awl in the middle of the ear (15 mm long and 1.5 mm wide), six days after midsilking. Following this, an infested toothpick was inserted into the ear and remained there until harvest. Therefore, identification of the inoculated ears remained clear. Only ears that contained the toothpicks were harvested.
For the silk channel inoculation, a suspension was needed. As the inocula from the same test tube may change their aggressiveness [43], two flasks were made following the bubble breeding method developed [44,45]. The Czapek-Dox liquid medium was freshly prepared in the laboratory, and sterilized in the autoclave in 10 L heat stable glass balloons for two hours at 120 °C [44], supported by a glass tube that directed the sterile air to the bottom of the flask. After sterilization of the medium (one hour in an autoclave at 1.20 bar pressure) and cooling, a small piece of inoculum was transferred to the medium by an inoculation needle. The sterile air kept the medium in motion, and after a week, the suspension was ready for use (Figure 2). Thereafter, the suspension was kept in the refrigerator at 4 °C. The rows for the inoculations were identified on the previous day, and the appropriate quantity of inoculum needed was taken out (+10% reserve) for the given inoculation day. In this way, the identity of the inoculum throughout the inoculation period could be secured. The inoculation time was 6–7 days after midsilking, following the international standard. An aggressiveness test was performed on the isolates by Mesterhazy [44] in the silk channel inoculation, in a Petri dish test. Inoculation was conducted at six days after 50% silking. An approximately 2 mL suspension (shaken before use) was injected into the silk channel of the upper ear (about 2 cm above the cob tip) by an injector.
The severity of ear rot was expressed as a percentage of the whole cob surface. In an average size hybrid, 700–800 grains grow. One infected grain represents 0.15%, seven-eight infected grains will produce 1%, and forty grains give 5%. As it was important to find correlations with the toxin content, the low infected ears had to be estimated precisely. Reid et al. [10] suggested the 1–7 scale (1–7). For an aggressive fungus, such as F. graminearum, the coverage can be between 60 and 70% or higher, so finding correlations with toxin contamination is normally not a problem. In F. verticillioides, the pathogenicity is much lower, where even 10% is an unusual amount; this is not sensitive enough. As a result, the same evaluation method was used for all fungal species. As in less aggressive isolates, F. graminearum may also give a lower infection rate; this helps also in counting relations with toxin contamination.

2.3. Toxin Analysis

When preparing samples for toxin analysis, five mean infected ears from each row (replicates) were collected in Rashel bags and stored under a roof until air-dried (2–3 weeks). After shelling, the whole yield (cc 1 kg) was roughly ground and carefully mixed. From this, 30–40 g was separated for fine milling by a Perten laboratory mill (Type: 3310, Perten Instruments, 126 53 Hagersten, Sweden). Analyses of DON and fumonisin B1 + B2 were carried out by using the grains from toothpick inoculation (34 hybrids in 2010 and 2011 and ten in 2012) and silk channel inoculation (34 in 2010, and 10 in 2011 and 2012).
For DON analysis, 1 g of fine milled maize sample was extracted with 4 mL of acetonitrile/water (84/16, v/v) for 2.5 h, in a vertical shaker. After centrifugation (10,000 rpm, 10 min), 2.5 mL of the extract was passed through an activated charcoal/neutral alumina SPE column at a flow rate of 1 mL/min. Then, 1.5 mL of the clear extract was transferred to a vial and evaporated to dryness at 40 °C under vacuum. The residue was dissolved in 500 µL of acetonitrile/water (20/80, v/v).
Liquid chromatographic separation and quantification was conducted on an Agilent 1260 HPLC system (Agilent Technologies, Santa Clara, CA, USA), equipped with a membrane degasser, a binary pump, a standard autosampler, a thermostated column compartment, and a diode array detector. DON was separated on a Zorbax SB-Aq (4.6 × 50 × 3.5 µm) column (Agilent) equipped with a Zorbax SB-Aq guard column (4.6 × 12.5 × 5 µm) thermostated at 40 °C. The mobile phase A was water, while mobile phase B was acetonitrile. The gradient elution was performed as follows: 0 min, 5% B; 5 min, 15% B; 8 min, 15% B; 10 min, 5% B; 12 min, 5% B. The flow rate was set to 1 mL/min. The injection volume was 5 µL. DON was monitored at 219 nm.
The methodology of Szecsi et al. [46] was modified as follows. The extraction of fumonisins was performed by a vertical shaker with a methanol/water (8/2, v/v) mixture. One microliter of the filtered extract was introduced into an Agilent 1100 High Performance Liquid Chromatograph, coupled to a Varian 500MS Ion Trap Mass Spectrometer. Chromatographic separation was achieved on a Polaris C-18A column (3 µm, 150 × 3 mm), equipped with a C-18 guard column, at 40 °C, using gradient elution. Mobile phase A consisted of water containing 0.1% acetic acid, while mobile phase B was methanol, also containing 0.1% acetic acid. A linear gradient was applied from 20% B to 100% B in 10 min (holding time: 5 min), and the B content was then lowered to 20% in 5 min, and the column was finally re-equilibrated for 5 min. The flow rate was set to 0.2 mL/min. MS measurements were performed in a positive ionization mode using an electrospray ionization (ESI) source. Capillary and needle voltages were 80 and 5000 V, respectively. RF loading was set at 88%. Nebulizing gas (N2) and drying gas (N2) pressures were maintained at 60 and 20 psi, respectively. The drying gas temperature was held at 300 °C. The mycotoxins were detected in MS/MS mode whilst monitoring the characteristic fragment ions (fumonisin B1: 722.3 > 528.3, fumonisin B2: 706.3 > 512.3) of the protonated molecules.

2.4. Statistical Analysis

To evaluate the results, three-, four-, and five-way analyses were performed, with the help of the functions provided by Sváb [47] and Weber [48]. Beside this, correlation and regression analyses were performed using built-in functions in Excel and the R programming language. Since significant differences exist between pathogenicity and toxin production of the three toxigenic species, ANOVA was performed, not only for the means, but also for each toxigenic species, including the determination of the LSD 5% values. Further evaluation of the main effects and interactions was based on Weber [48]. When the genotype’s main effect differed significantly from the A × B interaction (testing the main effect with its df against the A × B interaction obtained from the main ANOVA table), we saw a rather stable genotype effect on the interaction. When the difference is not significant, the instability is higher, and even the genotypes differ from each other; their performance is more variable in different epidemic situations. As a species was represented by one isolate, the role of the possibly changing aggressiveness could not be determined. In wheat, the ranking of the isolates differs from year to year [45,49,50,51]. This could also be true for maize, but there are not enough data [2] to ascertain this. For correlation evaluation, the Pearson correlation function was used; for setting the limit values, the table from Pearson and Hartley [52] was used.

3. Results

3.1. Kernel Resistance

The mean ear rot data for the 44 hybrids (Table 1) varied between 3.27% and 13.53% in 2010–2012 across all years, and Fusarium spp. Fusarium graminearum (10.80%) was significantly less aggressive than F. culmorum (13.25%). The mean ear rot severity of F. verticillioides was about one third of the F. culmorum value, and the natural infection was one percent less (3.44%). Of the 44 genotypes, 14 hybrids had lower values for all traits than the column means. Four hybrids had higher infection rates compared to all traits (together n = 18, their names are printed bold); all other hybrids (n = 26) exhibited variable resistance to the pathogens. The last column of Table 1 shows the variance of the performance of hybrids for the different fungi and in the naturally infected control. The small differences between data in a line result in mostly low variance, but low variance can also be seen at a high susceptibility (SBL8). The closest correlation (Table 2) was found between F. graminearum and F. culmorum. The close correlation between F. verticillioides ear rot and natural infection is interesting and the background should be clarified. Figure 3, Figure 4, Figure 5 and Figure 6 show hybrids with similar and different resistance to the three Fusarium species tested. Sze 363 shows a low infection severity for F. graminearum and F. culmorum, and medium severity for F. verticillioides (Figure 3). SBL1 has a medium severity for F. graminearum and F. culmorum and high severity for F. verticillioides (Figure 4). SBL19 has very low severity for F. graminearum and F. verticillioides, and has a low-medium severity for F. culmorum (Figure 5). Beym has a medium severity for F. graminearum, high severity for F. culmorum, and excellent resistance to F. verticillioides (Figure 6).
The ANOVA (Table 3) revealed significant differences within genotypes, Fusarium spp., and years, and this was also true for the interactions. The hybrid effect differed significantly from the two-way interactions (A × B and A × C), indicating a relative stability of the resistance expression under different conditions. This was counted using the ANOVA data of Table 1, where the genotype degree of freedom (df) was 43 (nominator) and the df for A × B interaction was 129 (denominator). The middle of squares (MS) value for the genotype’s main effect divided by the MS value for the genotype × Fusarium spp. Interaction, giving 3.89. The limit for the F test at 43/129 df data was 1.54 (p = 0.001). Therefore, the dominance of the genotype effect on Fusarium spp. was indicated. As large differences occurred between fungal means, the LSD 5% values were separately counted for all fungal species and the control. Additionally, the year/Fusarium spp. interaction was highly significant (Table 4). The artificially inoculated treatments and the naturally infected controls presented similar values in 2010. In 2011 (Table 2), the F. graminearum and F. culmorum severity was 30- and 60-fold larger than that of the non-inoculated controls. The numbers for 2012 were between 4 and 8 fold difference compared to the natural infection data. Fusarium verticillioides was lower in ear rot, however, the difference was 2-4-fold higher in 2011 and 2012 than the natural infection severity was. As the ten selected hybrids for toxin tests (2010–2012) are part of Table 1, their separate analysis is not necessary.

3.2. Silk Channel Resistance

The results for the 44 hybrids for the three years are very different (Table 5). The genotype differences across pathogens are significant, varying between 1.08% and 7.56%. However, the mean data for the different pathogens and the controls are similar, and no significant difference between them could be verified. This is also valid for the individual genotype for the different pathogens. The low variances also showed a very similar performance in terms of the stability, with only a few genotypes having a variance value above 2.0. Very similar performances are supported by the high and significant correlations between hybrid responses and toxigenic species, as well as naturally infected controls. Fifteen genotypes were found to be less infected in to all toxigenic species and naturally infected controls then the column means (bold printed names). In total, 13 hybrids were consequently more infected for each fungus (their names are also printed in bold), and the remaining 16 gave variable reactions. The very close correlations (Table 6) between responses to fungal species and the naturally infected controls do not infer resistance similarity to the Fusarium spp. tested, but prove that the five control data sets are at hand following the very low aggressiveness of the inocula used. At the same time, the same isolates had a considerable or high aggressiveness when using the toothpick method. The ANOVA (Table 7) showed highly significant genotype differences, where the mean data on the toxigenic species did not differ. However, the year effect was highly significant. The year × Fusarium spp. interaction was not significant, indicating a similar ranking that is the opposite of what was found for the toothpick method. The yearly means for the toxigenic fungi and their controls (Table 8) exhibit a similar performance for inoculated versions that do not significantly differ from the means of the non-inoculated controls. A slight increase in the un-inoculated control was only found in 2011.
The data of the ten genotypes (n = 10) that were tested for toxins are not shown in detail. The correlations are closer than those in Table 3, for F. graminearum/F. culmorum, r = 0.8155 and p = 0.01; F. graminearum/F. verticillioides, r = 0.9531 and p = 0.001; and F. culmorum/F. verticillioides, r = 0.9487 and p = 0.001.
The means of ear rot data (n = 34) show a moderate closeness, with a highly significant correlation (r = 0.5441, p = 0.001) between kernel resistance (KR) and the natural infection severity. For the individual fungal species, this was different, at F. graminearum (r = 0.3464, p = 0.05), F. culmorum (r = 0.3218, p = 0.05), and F. verticillioides (r = 0.7790, p = 0.001) were found. A close correlation was found between F. verticillioides and the non-inoculated control data of the toothpick test (r = 0.6417, p = 0.001).

3.3. Toxin Responses for Kernel Resistance

Thirty-four out of 44 hybrids were tested for mycotoxin contamination (Table 9). The mean of DON contamination in naturally infected hybrids was 0.85 mg/kg (2010 and 2011). In the toothpick method, they were 3.48 and 4.84 mg/kg for F. culmorum and F. graminearum, respectively. Similarly, fumonisin B1 + B2 contamination was 6.35 mg/kg in the control and 8.23 mg/kg in artificially inoculated hybrids. Several hybrids were found to be much more naturally contaminated by fumonisins compared to artificial inoculation.
Considering that the general performance of the eight hybrids had lower ear rot data than the mean of the hybrid data for all fungi and the control, only one hybrid produced higher ear rot severities than the mean column values, in all cases. The remaining 25 produced variable results. This strongly supports the view that we cannot speak about a general resistance to the Fusarium species tested, and in toxin relations, the situation is even worse. However, those hybrids are the most important, having a stable lower toxin performance compared to all fungi, including also the natural infection severity. The correlations (Table 10) were very different from what was found for visual symptoms. The only significant positive correlation was found between F. graminearum and F. culmorum, but at a lower level. However, even in this case, correlation breaking genotypes were found, such as GK Boglar and SBL8, with very high DON contamination for F. graminearum and very low DON contamination caused by F. culmorum. The correlations between toxin data of F. graminearum or F. culmorum and F. verticillioides did not show any significance. The natural and artificial toxin data were not significantly correlated.
Because of the variable correlations and the large differences in means of the fungal species, the ANOVAs were also counted separately for each toxigenic species and the naturally infected controls, including the LSD 5% values (Table 11). They were between 1.57 and 13.60. The ANOVA showed in all traits and in interactions significant effects. It is worth considering that the distance between MS values between the genotype main effect and genotype × Fusarium spp. interaction is close, whereas the genotype effect does not differ significantly from the A × B interaction. The df (degree of freedom) from 33 (numerator) is for genotypes, and for the A × B interaction, the df of denominator is 132. The genotype MS A/MS A × B gives an F value 1.56. The limit at p = 0.05 according to the F test is 1.55, so the genotype effect is just above the limit. Therefore, we cannot speak about a clear dominance of the genotype effect over the interaction. This finding has significance in refuting a toxin forecast based on visual ear rot severity in general.
The DON data obtained from the toothpick method of the ten selected hybrids in 2010–2012 (Table 12) show similar results compared to what we found in Table 5. Significant hybrid differences were found for total toxin contamination, but the data on individual pathogens and the control did not show significant correlations, except between F. culmorum and naturally contaminated control DON (r = 0.75, p = 0.02). In contrast to the close correlation between symptom severities (Table 13), the toxin contaminations correlated much less. In spite of this, the genotype’s main effect was significant in comparison to the Fusarium spp. and year’s main effects, indicating a rather good stability of the genotype reaction (Table 14). As the A × B × C interaction was significant, the variance components were also tested against it. Here, all of the main effects were significant and none of the interactions reached the limit of significance. For the DON control, the situation was the same. In F. graminerarum DON at SLB8, SLB10, and GK Boglar had high values. For F. culmorum DON, only SLB10 produced an extra high amount. The difference in fumonisin contamination was larger than in the case of the 34 hybrids. The yearly means showed 6.37, 6.45, and 9.15 mg/kg toxin means for the years 2010–2012 (Table 15). The artificial inoculation across years increased the DON from 0.54 mg/kg for the naturally infected control, to 1.96 and 5.43 mg/kg for F. culmorum and F. graminearum, respectively. In fumonisin, the naturally infected control gave 3.92 mg/kg and increased to 24.76 mg/kg. The reason for this is the very high fumonisin content in 2012, which was 45 mg/kg, compared to the 14 mg/kg mean value in 2010 and 2011.

3.4. Toxin Response to Silk Channel Resistance

The 34 hybrids could only be tested in 2010 (Supplementary Table S1.) The mean data did not show any significant difference between the un-inoculated control and the artificially inoculated ear rot data in this and the following years, so the trends in the toxin content turned out to be rather interesting. The DON contamination of the naturally infected control was 1.00 mg/kg, whereas the F. graminearum showed 0.95 and F. culmorum 0.81 mg/kg. So, the artificial inoculation could not increase the DON contamination compared to the naturally infected control. The case for F. verticillioides was different, where the artificially inoculated versions contained significantly higher fumonisin B1 + B2 (20.41 mg/kg for the mean), than the naturally infected samples (13.64 mg/kg). The reason is that even an invisible increase of infection can result in a fumonisin increase. According to the ANOVA, the genotype differences were highly significant, and the toxin means were between 0.65 and 22.65 mg/kg.
The ten hybrids tested across the three years (Table 16) showed highly differing mean toxin contamination. For DON producers, no additional increase was found, which corresponded to the visual severity scores and the mean data in Suppl. Table S1. The F. graminearum DON values from artificial inoculation were very low, except for GK Boglar. In F. culmorum, all DON values were lower than the naturally infected control values, but the differences were not significant. In the natural infection regime, the hybrids exhibited lower fumonisin B1 + B2 (5.96 mg/kg) contamination than for the artificial infection (10.56 mg/kg). In four cases, the artificial inoculation fumonisin data were lower than in the control. The correlations (Table 17) were not significant for the toxin contaminations among different Fusarium spp. Five hybrids can be identified, with a low fumonisin content for both inoculation regimes using the experimental mean (SBL1, ISH 303, SBL10, Szegedi 386, and SBL15); this is 50% of the population. For the other four genotypes, the reasons for the variable results are not known. Only SBL8 was very susceptible in both regimes. However, in one or both sets of data, they are above the limit, so will be discarded by the breeders. This is a real help for them. They are aware that an unexpected high toxin contamination signals a food safety risk. The other conclusion is that, without toxin analyses, even though they are expensive, the breeding cannot be successful in decreasing food safety. The ANOVA showed a significant genotype effect across the three years (Table 18). This agrees well with the 2010 results for the 34 genotypes. The genotype × toxin and the genotype × year interactions did not differ significantly from the genotype effect. This means that the genotype data obtained from the silk inoculation method are more dependent on the environment and other factors than the toothpick results. Fungus-specific ANOVA tests were also conducted, and according to these tests, all cases of fungal and toxin columns showed significantly differing genotype differences. The yearly toxin means (Table 19) exhibited rather large deviations between years. The data prove that silk channel inoculation did not add to the natural infection for both F. graminearum and F. culmorum. F. verticillioides showed, in all years, higher fumonisin contamination in the artificial inoculation than the naturally infected treatments did. Further research will be needed to find an answer.

3.5. Correlation between Ear Rot and Mycotoxin Contamination

The two years’ data for F. graminearum correlated (r = 0.5827, p = 0.001) (Figure 7) between ear rot and DON production. Only one correlation breaker (SLB8) was found. This produced a 14.20 mg/kg difference in DON (between the DON contamination measured and the corresponding data point on the regression line). The LSD 5% was 12.00 between genotypes, and this was also applied for the distance between the measured data point and the corresponding point on the regression line that was a more rigorous condition. Without this correlation breaking genotype, the correlation would be r = 0.8056, p = 0.001. The F. culmorum data across the two years (Figure 8) showed similar correlations to what we found for F. graminearum, but at a somewhat diminished level. At up to 20% ear rot, DON data were lower than 5 mg/kg. However, one genotype was found to be higher than 30 mg/kg DON. This was 20.34 mg/kg higher than the LSD 5% value, being 11.65 mg/kg. The correlation for all genotypes was r = 0.5447, p = 0.001. Without the toxigenic hybrid, the correlation remained in the same range (r = 0.5391, p = 0.001). As earlier data showed a close correlation between F. graminearum and F. culmorum responses, the combined data were also correlated. The correlation was not significant, but 11 genotypes displayed good agreement between resistances to the two species. The F. verticillioides ear rot data and the corresponding fumonisin B1 + B2 content for toothpick data showed no significant correlation (r = 0.21) (Figure 9). However, two genotypes displayed a moderate and low infection severity, and very high fumonisin production ability. Performing regression without these two genotypes, the correlation increased to r = 0.6115 (p = 0.001), indicating the positive role of resistance in decreasing the toxin contamination. As several hybrids produced very diverse reactions in F. verticillioides to both artificial and natural infection, their means were compared for toxin and ear rot data of 2010 and 2011 (Figure 10). Three hybrids were proven toxigenic for fumonisin production or they can be called as fumonisin overproducer. Without them, the correlation would be r = 0.4747, p = 0.01, and with them, it is only 0.1352 ns. To determine the risks, it is better to consider both data sets. Most of the hybrids fit into the proportional correspondence of the resistance and toxin level, e.g., the most important toxin regulating agent is the resistance.
A comparison of the toothpick and silk channel toxin data from the ten hybrid sets (Figure 11) shows that the toothpick method is much more reliable for testing ear rot resistance and toxin contamination than the silk channel method is, as they cause significantly stronger infection severity and toxin contamination, allowing a better differentiations of the genotypes. To this, a high aggressiveness level is necessary. As the toothpick method provides a significantly higher aggressiveness with the same isolates than the silk channel, it is reasonable to choose the toothpick or another kernel resistance testing method.
For a risk analysis, we need to know four different types of information: resistance data on the different toxigenic species separately, their toxin production and the natural infection in terms of visual scores, and the natural toxin contamination for the three main toxins. This is only shown for the 10 selected hybrids in three year tests (Table 20) for the toothpick method. The data lower than the column means were highlighted. Only one genotype Szegedi 386 was identified with lower data in all cases. Additionally, against F. graminearum, only SBL15 gave lower ear rot and DON contamination, and the others varied. One genotype—GK Boglar—was more susceptible to both traits than the experimental means. This could also be important information. In F. culmorum, four further hybrids could be identified with a low ear rot severity and toxin contamination; in the others, variable responses were noted. For F. verticillioides, three additional hybrids exhibited better values for both traits than the mean of the genotypes. In three cases, both sets of data were far above the means, and another three gave variable responses. In the naturally infected controls, only one hybrid displayed lower values than the means for all traits. For F. graminearum, the natural infection agreed only in two hybrids for DON. For F. verticillioides, the natural infection severity was lower in three hybrids (including Szegedi 386) than the average data, and the others were variable in terms of their responses. The correlation matrix shows a very variable picture (Table 21). It seems that we have to acknowledge the fact that hybrids often react differently to what was supposed, and we should be careful to draw far reaching conclusions from the presence or absence of significant or non-significant correlations. Instead, we need to identify the low infection hybrids with a low infection severity and low toxin contamination in both artificial and natural infection regimes.

4. Discussion

Considering the role of resistance types, Munkvold and Desjardins [11] argued that F. verticillioides mostly infects through silks. Therefore, silk inoculation is the proper method for resistance testing, which explains its widespread use. However, several authors found kernel resistance to be more useful, with its higher stability [13,14,15,53,54]. Schaafsma et al. [31] found that inoculation conducted by penetrating husk leaves with F. verticillioides gave a much higher infection severity and toxin contamination than silk channel inoculation. The fumonisin and FER results were more consequential when the kernel resistance was tested. Presello et al. [55] found kernel resistance to be useful, but only a limited number of resistance sources were found. Reid et al. [23] found only a few genotypes that were good for both resistance types. Despite the positive opinion on the role of silk in the infection process, spraying the silks (GER) was not successful [56]. The silk channel infection achieved better results, but exhibited a lower infection severity compared with the kernel resistance test. Our data support this latter view, as we received a much better differentiation of the genotypes.
Several authors have reported parallel tests and comparisons of relations between kernel and silk channel resistance, in which the correlations were moderate or higher [20,23,25]. Löffler et al. [25] suggested applying the two inoculation methods in parallel. In each case, genotypes were found to display large differences in response to the two methodologies. However, most of them provided similar reactions to both methodologies [17]. Kebede et al. [57] tested two lines with both methods, and the ear infection data were very similar. Most of the data confirmed the result that correlations between the two resistance components often overlap, and a large number of the hybrids react similarly [12,20,23,25]. Lemmens [21,22], with his low correlation, seems to be an exception, but this does not mean that such a case could not occur. The securing healthy stalks are also a precondition to lower the mistakes in determining resistance level (pseudoresistance) [26].
The general conclusion is that the kernel resistance for breeding might be more important, especially in dry regions, where silk channel inoculation seems to be much less effective. As two different methods cannot be used in a breeding program, the KR model can be used as the main method and additional control for possible silk channel resistance. The higher consistency of data is understandable, as, in 4–5 weeks; the infection can spread under closed husk leaves in a “humid chamber”, which is not always the case for the silk channel method. We suppose that the application of KR allows less false positive resistance identification. It should be stressed that a lot of information is absent, and future research should answer the open questions, but practical screening can present an improved methodology.
Resistance to different Fusarium spp. has not been a central problem in the past. The F. graminearum isolate was shown to be the most pathogenic, the F. culmorum isolate was seen to be less pathogenic, and the least coverage was recorded for F. verticillioides. This agrees well with earlier findings [31]. In other tests [2], F. culmorum had a higher aggressiveness than F. graminearum. This is not an accident, as one inoculum cannot represent the mean pathogenicity of the species, so any difference is possible. As the two leading Fusarium species (F. graminearum and F. verticillioides) need strongly different conditions, medium or higher correlations were found between two pathogens [5,7,20,31,37,38], and our data support the fact that a smaller part of the genotype responses is similar to different pathogens. Butron et al. [58] also found very large toxin differences for different hybrids with very similar visual ear rot data. This is in agreement with what was found by others [2,12,20,23,25]. This should have a genetic basis. However, nobody can currently say that similar responses regulated by quantitative trait loci (QTLs) with a pleiotropic effect on more pathogens or QTLs with different functions are responsible. As the Fusarium species spectrum can change sharply from year to year [59], the natural infection cannot be the base of the selection. As no paper on QTL analysis simultaneously analyzing the resistance to two or three different Fusarium spp. was found, research on this objective is a task for the future [60]. Zila et al. [61] found that the genome-wide association study for Fusarium ear rot resistance resulted in SNP variants explaining 1–3% of the variation found. Butron et al. [58] found two genotypes with a good resistance of ten (20%). In this study, we demonstrated that about 10–15% of the hybrids had a good phenotypic resistance to more toxigenic species. We can say that around 20% of hybrids can have a good or higher resistance to the different Fusarium spp., and in about 80%, the resistance to different species varies. Additionally, several are highly susceptible to all. What is behind this rather complicated picture? Considering the genetics, several papers have reported different functions of QTL. Lanubile [12] and Lanubile et al. [62] reported QTLs where, in addition to the ear rot value, toxin production was mapped. In another case, maize inbreds showed a high variability in resistance that was very differently expressed [63]. Silks were found with differing resistances to F. verticillioides [62,63]. Other differing functions have also been reported [18,24,60,64,65], which is similar to what has been found in wheat [66]. For this reason, we should test the resistance to the different toxigenic species separately, so that a better evaluation of the resistance evaluation and risk analysis is possible. As we tested large amounts of hybrids, two facts are important. The rate is different in each breeding firm, up to 20–30% of hybrids can be identified with similarly good resistance for the three pathogens, and the vast majority of hybrids vary in their resistance. For this reason, it is necessary to screen hybrids (and inbreds) against all Fusarium species that play a role in the given region. Generally, it seems that F. graminearum and F. verticillioides will be the focus, but other Fusarium species may also have significance. As F. verticillioides dominates under dryer and warmer conditions, F. graminearum prefers warm and humid conditions; both resistances are necessary, and this also means an adaptation to climatic changes.
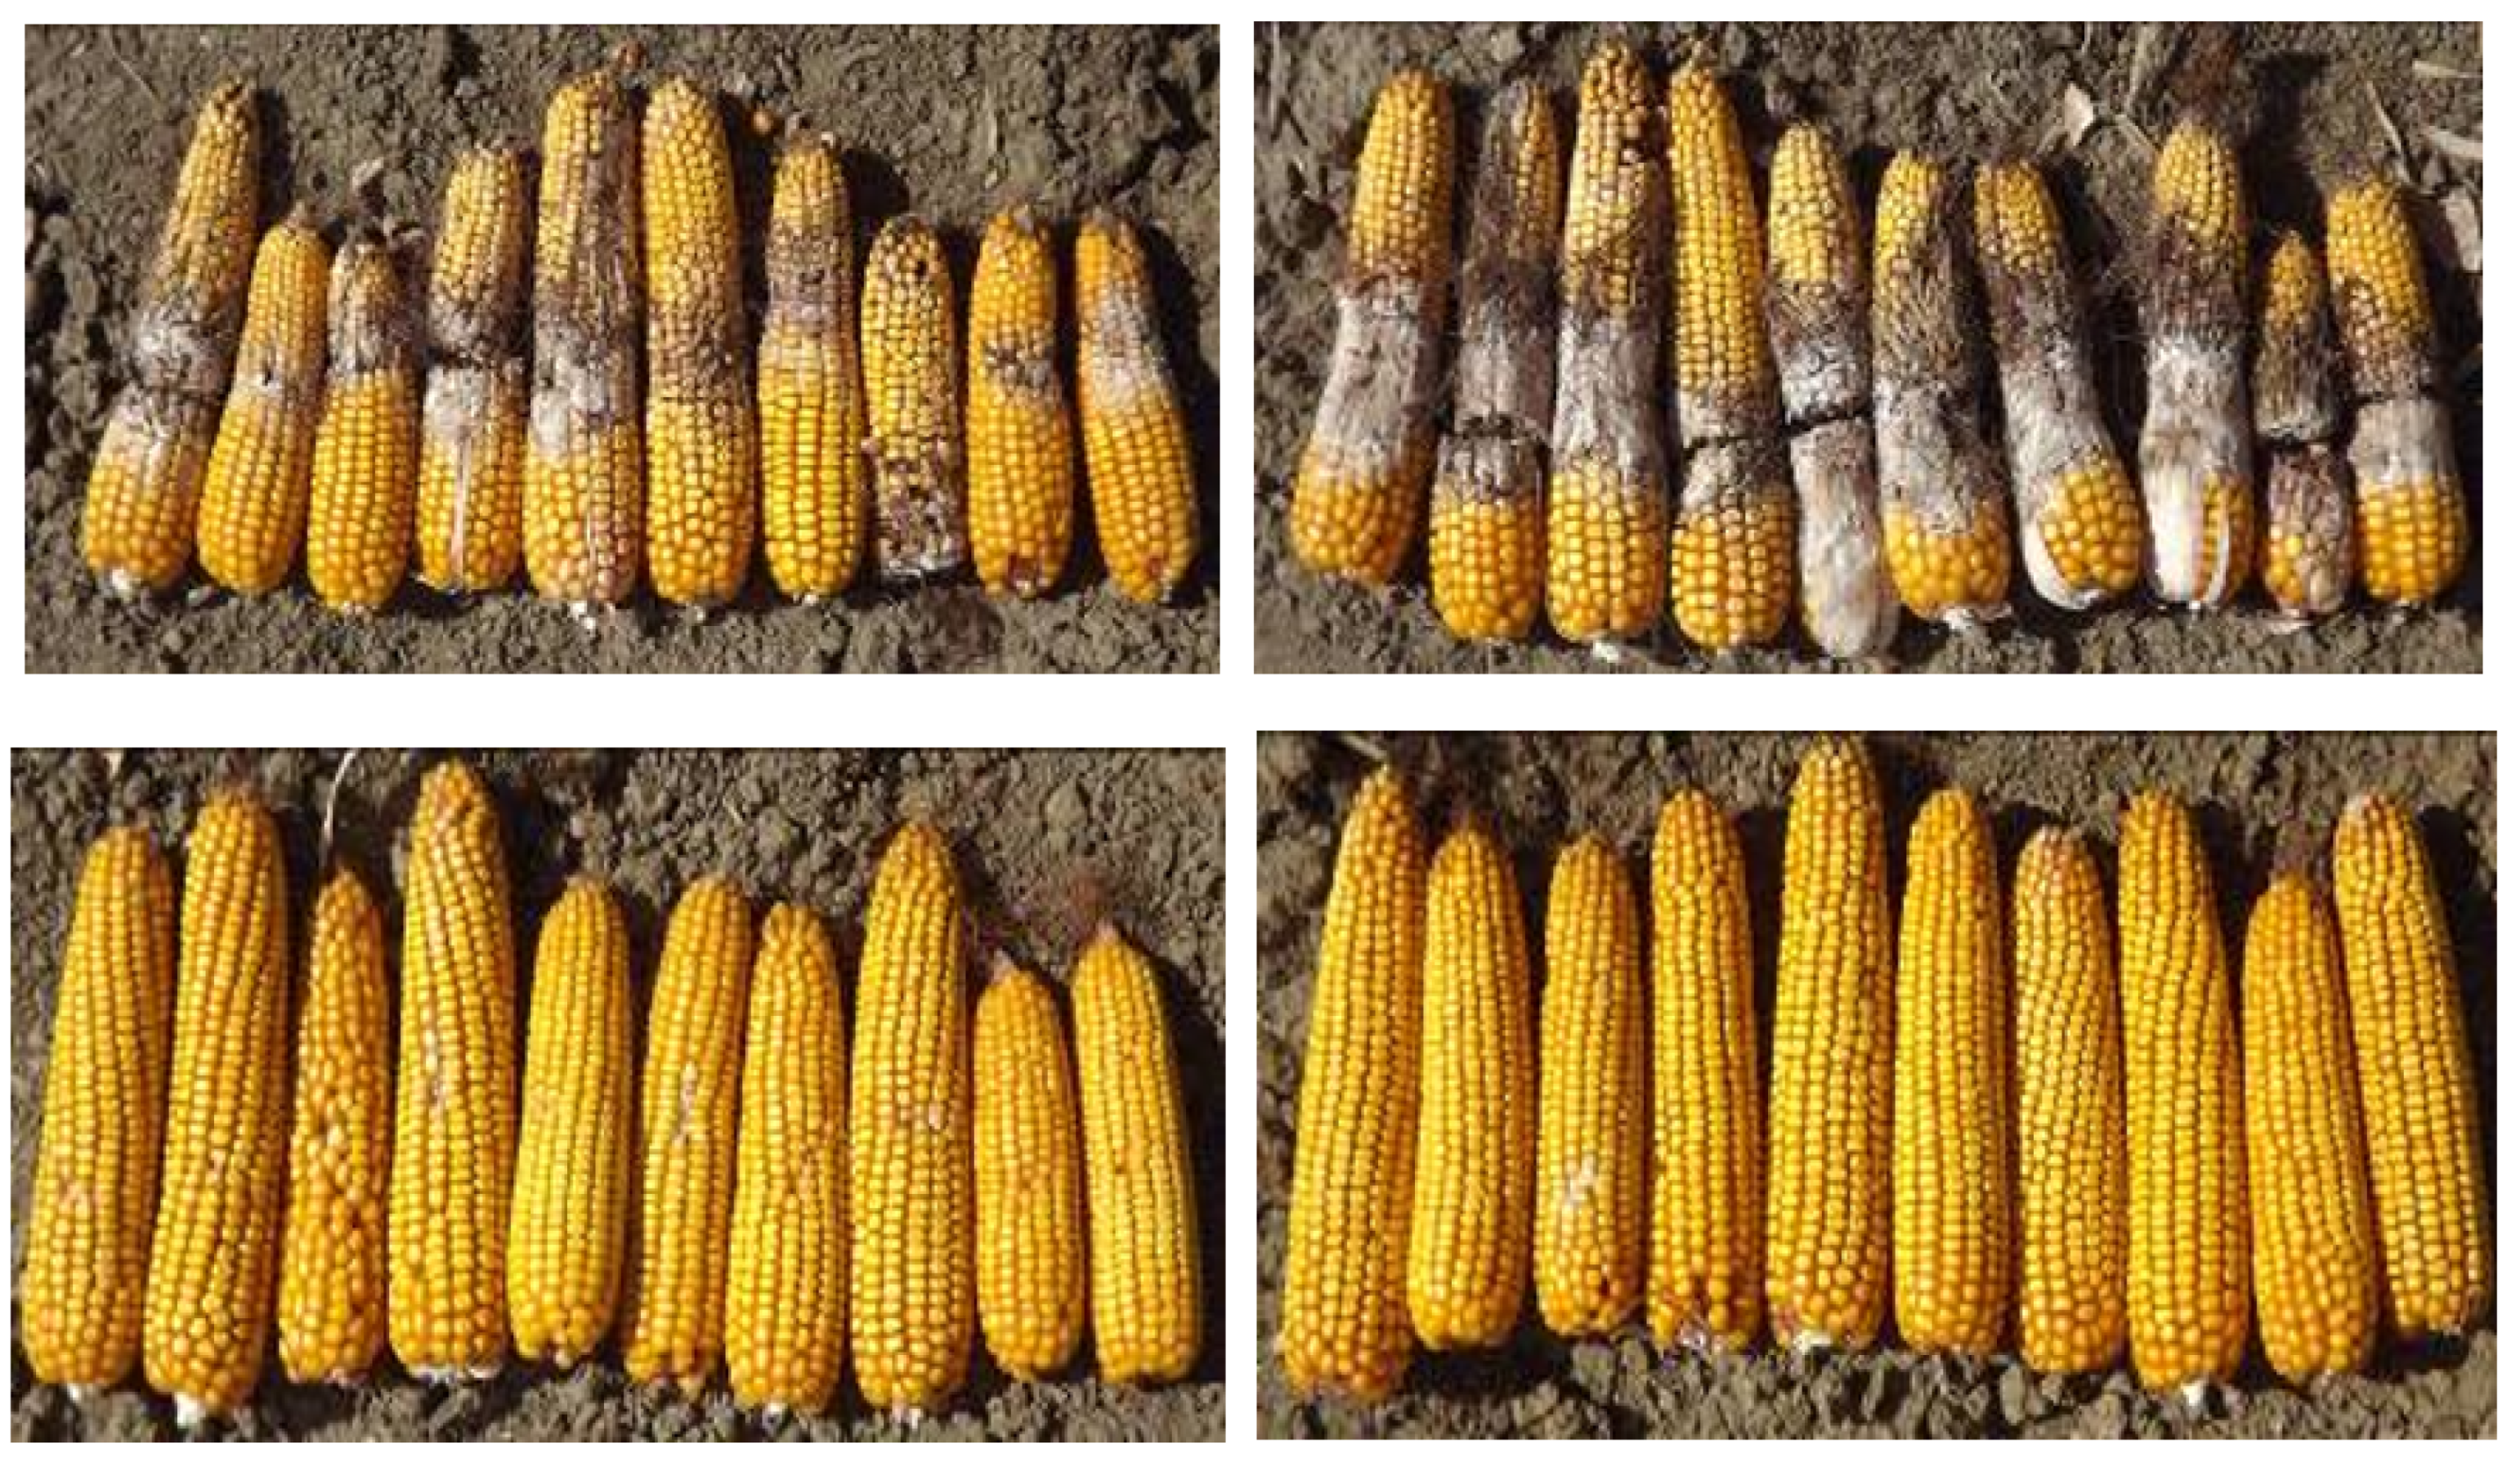
Disease and toxin resistance are often considered to be synonyms. The toxin data from the kernel resistance tests differed, but both were significantly higher than the silk channel data. Schaafsma et al. [67] found the kernel resistance to be better, and other data seem to support the better preciosity of kernel resistance [10,15,54]. The three year toxin test with 10 selected hybrids produced similar results, supporting the conclusions of the larger hybrid set. The extremely high toxin production difference in several genotypes at very similar ear rot values indicates extra toxin production ability that can be called toxigenic hybrid. In the majority, however, the symptoms and toxin data correlate, well. Butron et al. [58] also reported such cases. The term ‘toxigenic’ fungus is a commonly used term. In this case, we employ the term toxigenic genotype, and referring to maize toxigenic hybrid, which is very dangerous from the point of view of food safety. One correlation breaking hybrid with very high DON production could be identified from the 34 genotypes for F. graminearum, one for F. culmorum, and two for F. verticillioides. Whilst, for ear rot symptoms, most of the correlations were significant, in the case of toxins, this was not the case mostly by these correlation breaking hybrids.
As both significantly higher toxin production and underproduction (the latter could not be proved in this paper) can be the case, the disease resistance data alone are not suitable for predicting toxin behavior and also not for variety registration. For this reason, a hybrid without toxin control cannot be allowed for commercial production, and highly susceptible hybrids should be withdrawn from commercial production.
The silk channel data from 2010 and 2010–2012 tell another story. Compared to the natural infection, no significant increase was seen in ear rot severity in the artificially induced inoculation regime. In DON producers, no increase was measured compared to the control. However, in F. verticillioides, a significant toxin increase was recorded, even if the visual data did not show any difference. This means that F. verticillioides can increase fumonisin contamination so that the visual symptom severity does not change. Of course, there are initial infections which are not visible, but toxin production can be identified. There may have been an infection between rows or on the surface of the cob, where grains can be infected from the germ side, but during the evaluation of the surface of ears, this will not be recognized (Mesterhazy unpublished). This is also an argument for the decisive factor being the toxin contamination. For us, the conclusion is that the toxin contamination should be measured, as trade and self-use are determined by toxin contamination, and not by ear rot severity in the field. It seems that toxin contamination and disease spread may need different ecological conditions. As many papers have reported successful SR tests [10,54,68], even though the ear rot severity is mostly moderate, our very dry and hot climatic conditions may be responsible for it.
This would mean that artificial inoculation can really increase the fumonisin level. From the contradictious data on natural and artificial toxin levels, further research is needed to explain the results.
Visual rating and toxin contamination represent an old problem. Henry et al. [34] found a correlation for FER (r = 0.74), and Robertson–Hoyt et al. [14] and Robertson–Hoyt et al. [35] found r = 0.29, and in another study, r = 0.69 [36]. This is lower than the value found by Bolduan [28] (r = 0.94, p = 0.001). Szabo et al. [2] also found acceptable correlation values between them. Santiago et al. [69] found enough variability for FER in terms of resistance to select more resistant genotypes. Balconi et al. [27] also found very high resistance differences for FER; in 2010, 0.56 and 240 mg/kg, and in 2009, 0.09 and 190 mg/kg, fumonisins were the maximum and minimum values, respectively. The data presented here fit well with the general experience. Therefore, the ear rot is the most powerful toxin regulating factor. In the cited papers, genotypes with unusually high toxin contamination were presented, but we realized that the toxin overproduction is an important feature when significant differences can be shown. The vast majority of hybrids have proportional toxin contamination to ear infection severity. Therefore, resistance is the most powerful regulation agent. As there are toxin overproducers for each ear rot pathogen, without a toxin control, we cannot secure food or feed safety. In wheat, we could identify genotypes with relative toxin resistance, meaning that they produced significantly less toxin than would have been supposed on the symptom severity. In this hybrid set, we could not identify such hybrids. For this, a significantly improved testing methodology will be needed.
Several studies have found agreements between resistances to two toxigenic fungi. For F. graminearum and F. verticilliodes, Presello [37,38] found similar results. Löffler et al. [20] found a good agreement for flint and dent groups. Presello et al. [70] selected inbreds from F2 populations for F. proliferatum resistance, and their hybrids were also tested with F. graminearum and F. verticillioides. The selection was also effective for these two species. Rose et al. [71] identified, in FER and Aspergillus, ear rot resistant genotypes, showing that breeding is an effective way to reduce toxin contamination.
It seems that we should adapt to the fact that, based on a visual evaluation of resistance, the forecast of toxin data is problematic. It also seems that resistance to a Fusarium species does not automatically mean resistance to another one and resistance to toxins. By comparing the data with a much larger population, it is clear that a larger data basis allows more profound conclusions to be drawn. The correlations between traits are seldom significant and there are surprising data.
In this study, the resistance to three toxigenic species was tested. It is clear that a smaller proportion of the hybrids have a similar resistance, whilst the others show a variable resistance structure. As for KR, reasonable correlations were found for symptom severity; this was not true for toxin production. For this reason, an automatic correspondence between ear rot severity and toxin contamination is not granted. As for relatively low ear rot severity, very high toxin amounts can be yielded, and without toxin control, successful breeding is not possible. For this reason, we need to identify hybrids that have low ear rot values with low toxin contamination against the most important toxigenic species in the region. By using more isolates and locations, the reliability of the data can be higher, and smaller toxin differences are enough to present clear proof for correlation breaking genotypes, as we have seen in wheat [72]. We also need many cheaper toxin analytic methods besides the improving of phenotyping. We agree with the remark of Gaikpa and Miedaner [59], that an improved methodology on a wider experimental basis would be needed to improve the usefulness of experimental results.

5. Conclusions

The toothpick method gave a significantly higher infection severity than the silk channel inoculation. The latter did not increase the visually estimated ear infection compared to the non-inoculated control. Of the 44 hybrids, 18 produced similar results to the different species and 26 hybrids reacted very differently; no general resistance to them exists. The genetic background of these widely presented differences is unknown. In toxin contamination, the toxin correlations between responses to the causing agents were low and not significant. However, in about 80% of the genotypes, the visual scores and toxin contamination correlated well. Therefore, the most important toxin reducing trait is the resistance level. For this reason, independent tests are needed for each pathogen, and both ear rot severity and toxin data are of vital importance. Considering this, the disease resistance and toxin resistance are not synonyms, but may often overlap. Toxin producers with an extremely high toxin producing ability were identified. We can call them toxin overproducers or toxigenic genotypes. As we, at present, do not have fungicide technology to deal with maize ear rots, resistance is the most important weapon against toxin contamination. A wider and higher resistance to more toxigenic species will also increase the adaptation to climatic changes, and inhibit toxin accumulation that would develop without a higher resistance level [73].

Supplementary Materials

The following are available online at https://www.mdpi.com/2073-4395/10/9/1283/s1, Table S1: Toxin contamination of maize hybrids following silk channel inoculation n = 34, 2010.

Author Contributions

Conceptualization, A.M., and S.S.; methodology, A.M., E.T.T. and M.V.; software, A.M., B.T., and M.V.; validation, A.M., B.T. and E.T.T.; formal analysis, A.M., and B.T.; investigation, E.T.T., B.T., and M.V.; resources, A.M. and E.T.T., data curation, A.M.; E.T.T.; writing—original draft preparation, A.M.; writing—review and editing, A.M. and B.T.; visualization, A.M.; supervision, A.M. and B.T.; project administration, A.M. and B.T.; funding acquisition, A.M. and B.T. All authors have read and agreed to the published version of the manuscript.

Funding

The authors acknowledge the support of the FP7 MycoRed project (KBBE-2007-2-5-05) led by Dr. Antonio Logrieco, the Hungarian national GOP project 1.1.1-11-2012-0159, co-financed by the European Union, GINOP-2.2.1-15-2016-00021 EU/Hungarian project and the National innovation project TUDFO/51757/2019/ITM and project of Ministry for Innovation and Technology No. 2020-4.1.1-TKP2020.

Acknowledgments

The authors thank Robert Taucher, maize breeder (Saatzucht Donau Linz, At.), for providing the Austrian maize hybrid set. Beáta Tóth would like to give thanks for her János Bolyai Research Scholarship from the Hungarian Academy of Science. For the language correction, we are indebted to Matyas Cserhati, USA. For support, we are indebted to Zoltan Nagy and Balazs Szabo, head and member of the Maize Department.

Conflicts of Interest

The authors declare no conflict of interest.

Abbreviations

DONdeoxynivalenol
FERFusarium verticillioides ear rot
Fumfumonisin B1 + B2
FvF. verticillioides
FgF. graminearum
FcF. culmorum
GERGibberella zeae (F. graminearum) and F. culmorum ear rots
KRkernel resistance
SRsilk channel resistance

References

  1. Mesterházy, A.; Lemmens, M.; Reid, L.M. Breeding for resistance to ear rots caused by Fusarium spp. in maize—A review. Plant Breed. 2011, 131, 1–19. [Google Scholar] [CrossRef]
  2. Szabó, B.; Tóth, B.; Toldiné, É.; Varga, M.; Kovacs, N.; Varga, J.; Kocsubé, S.; Palágyi, A.; Bagi, F.; Budakov, D.; et al. A new concept to secure food safety standards against Fusarium species and Aspergillus flavus and their toxins in maize. Toxins 2018, 10, 372. [Google Scholar] [CrossRef] [Green Version]
  3. Mesterházy, Á.; Tóth, B.; Szieberth, D. A kukorica és őszibúza toxikus gombák okozta megbetegedései. Hazai előfordulásuk bemutatása toxintérképek segítségével 2012–2017 (Toxic diseases of maize and wheat, occurrence of toxins with toxin maps 2012–2017). Magy. Kukorica Klub. 2019, 1, 47. [Google Scholar]
  4. Miedaner, T.; Bolduan, C.; Melchinger, A.E. Aggressiveness and mycotoxin production of eight isolates each of Fusarium graminearum and Fusarium verticillioides for ear rot on susceptible and resistant early maize inbred lines. Eur. J. Plant Pathol. 2010, 127, 113–123. [Google Scholar] [CrossRef]
  5. Mesterházy, Â. Resistance of corn to Fusarium ear rot and its relation to seedling resistance. J. Phytopathol. 1982, 103, 218–231. [Google Scholar] [CrossRef]
  6. Mesterházy, Á.; Kovács, G., Jr.; Kovács, K. Breeding resistance for Fusarium ear rot (FER) in corn. In Proceedings of the 18th Int. Conference on Maize and Sorghum Genetics and Breeding, Eucarpia, Beograd, Yugoslavia, 4–9 June 2000; pp. 495–505. [Google Scholar]
  7. Mesterházy, Á.; Kovács, K. Breeding corn against fusarial stalk rot, ear rot and seedling blight. Acta Phytopathol. Entomol. Hung. 1986, 21, 231–249. [Google Scholar]
  8. Parsons, M.W.; Munkvold, G.P. Effects of planting date and environmental factors on Fusarium ear rot symptoms and fumonisin B1 accumulation in maize grown in six North American locations. Plant Pathol. 2012, 61, 130–142. [Google Scholar] [CrossRef]
  9. Plienegger, J.; Lemmens, M. Kolbenfaule—Gibt es Sortenunterschiede? Ear rot—Are there differences between cultivars?) Mais 2002, 30, 95–97. [Google Scholar]
  10. Reid, L.M.; Hamilton, R.I.; Mather, D.E. Screening Maize for Resistance to Gibberella Ear Rot; Technical Bulletin SE; Research Branch Agriculture and Agri-Food Canada: Ottawa, ON, Canada, 1996. [Google Scholar]
  11. Munkvold, G.P.; Desjardins, A.E. Fumonisins in Maize. Can we reduce their occurrence? Plant Dis. 1997, 81, 556–565. [Google Scholar] [CrossRef] [Green Version]
  12. Lanubile, A.; Maschietto, V.; Marocco, A. Breeding maize for resistance to mycotoxins. In Mycotoxin Reduction in Grain Chains; Leslie, J.F., Logrieco, F., Eds.; Wiley-Blackwell: Ames, IA, USA; Chichester/Oxford, UK, 2014; p. 352. [Google Scholar]
  13. Clements, M.J.; Kleinschmidt, C.E.; Maragos, C.M.; Pataky, J.K.; White, D.G. Evaluation of inoculation techniques for Fusarium ear rot and fumonisin contamination of corn. Plant Dis. 2003, 87, 147–153. [Google Scholar] [CrossRef]
  14. Robertson, L.A.; Kleinschmidt, C.E.; White, D.G.; Payne, G.A.; Maragos, C.M.; Holland, J.B. Heritabilities and correlations of Fusarium ear rot resistance and fumonisin contamination resistance in two maize populations. Crop. Sci. 2006, 46, 353–361. [Google Scholar] [CrossRef]
  15. Reid, L.; Bolton, A.; Hamilton, R.; Woldemariam, T.; Mather, D.E. Effect of silk age on resistance of maize to Fusarium graminearum. Can. J. Plant Pathol. 1992, 14, 293–298. [Google Scholar] [CrossRef]
  16. Miller, S.S.; Reid, L.M.; Harris, L.J. Colonization of maize silks by Fusarium graminearum, the causative organism of Gibberella ear rot. Can. J. Bot. 2007, 85, 369–376. [Google Scholar] [CrossRef]
  17. Eller, M.; Holland, J.B.; Payne, G. Breeding for improved resistance to fumonisin contamination in maize. Toxin Rev. 2008, 27, 371–389. [Google Scholar] [CrossRef]
  18. Morales, L.; Zila, C.T.; Moreta Mejía, D.E.; Arbelaez, M.M.; Balint-Kurti, P.J.; Holland, J.B.; Nelson, R.J. Diverse components of resistance to Fusarium verticillioides infection and fumonisin contamination in four maize recombinant inbred families. Toxins 2019, 11, 86. [Google Scholar] [CrossRef] [Green Version]
  19. Presello, D.A.; Botta, G.; Iglesias, J.; Eyherabide, G.H. Effect of disease severity on yield and grain fumonisin concentration of maize hybrids inoculated with Fusarium verticillioides. Crop. Prot. 2008, 27, 572–576. [Google Scholar] [CrossRef]
  20. Loffler, M.; Kessel, B.; Ouzunova, M.; Miedaner, T. Population parameters for resistance to Fusarium graminearum and Fusarium verticillioides ear rot among large sets of early, mid-late and late maturing European maize (Zea mays L.) inbred lines. Theor. Appl. Genet. 2009, 120, 1053–1062. [Google Scholar] [CrossRef] [PubMed]
  21. Lemmens, M. Anwendung kuenstlicher Inokulationsmethoden zur Kolbenfusariose-Resistenzbestimmung bei Mais. In Proceedings of the 50 Tagung der Vereinigung Österreichischer Pflanzenzuchter, BAL Gumpenstein, Irdning, Austria, 23–25 November 1999; pp. 63–68. [Google Scholar]
  22. Lemmens, M. Fusarium ear rot resistance testing in maize: Natural infection versus artificial inoculation. In Workshop for Variety Registration in Cereals for Fusarium Resistance, 18–20; 23–24 March 2010; Mesterhazy, A., Ed.; Cereal Research Non-Profit Ltd.: Szeged, Hungary, 2010; pp. 18–20. [Google Scholar]
  23. Chungu, C.; Mather, D.E.; Reid, L.M.; Hamilton, R.I. Comparison of techniques for inoculating maize silk, kernel, and cob tissues with Fusarium graminearum. Plant Dis. 1996, 80, 81–84. [Google Scholar] [CrossRef]
  24. Reid, L.M.; McDiarmid, G.; Parker, A.J.; Woldemariam, T. CO441 corn inbred line. Can. J. Plant Sci. 2003, 83, 79–80. [Google Scholar] [CrossRef]
  25. Loffler, M.; Miedaner, T.; Kessel, B.; Ouzunova, M. Mycotoxin accumulation and corresponding ear rot rating in three maturity groups of European maize inoculated by two Fusarium species. Euphytica 2010, 174, 153–164. [Google Scholar] [CrossRef]
  26. Mesterházy, Á. Relationship between resistance to stalk rot and ear rot of corn influenced by rind resistance, premature death and the rate of drying of the ear. Maydica 1983, 28, 425–437. [Google Scholar]
  27. Balconi, C.; Berardo, N.; Locat Elli, S.; Lanzanova, C.; Torri, A.; Redaelli, R. Evaluation of ear rot (Fusarium verticillioides) resistance and fumonisin accumulation in Italian maize inbred lines. Phytopathol. Mediterr. 2014, 53, 14–26. [Google Scholar]
  28. Bolduan, C.; Miedaner, T.; Schipprack, W.; Dhillon, B.S.; Melchinger, A.E. Genetic variation for resistance to ear rots and mycotoxins contamination in early European maize inbred lines. Crop. Sci. 2009, 49, 2019–2028. [Google Scholar] [CrossRef]
  29. Butron, A.; Reid, L.M.; Santiago, R.; Cao, A.; Malvar, R.A. Inheritance of maize resistance to Gibberella and Fusarium ear rots and kernel contamination with deoxynivalenol and fumonisins. Plant Pathol. 2015, 64, 1053–1060. [Google Scholar] [CrossRef]
  30. Campos-Bermudez, V.A.; Fauguel, C.M.; Tronconi, M.A.; Casati, P.; Presello, D.A.; Andreo, C.S. Transcriptional and metabolic changes associated to the infection by Fusarium verticillioides in maize inbreds with contrasting ear rot resistance. PLoS ONE 2013, 8, e61580. [Google Scholar] [CrossRef] [Green Version]
  31. Schaafsma, A.W.; Miller, J.D.; Savard, M.E.; Ewing, R.J. Ear rot development and mycotoxin production in corn in relation to inoculation method, corn hybrid, and species of Fusarium. Can. J. Plant Pathol. 1993, 15, 185–192. [Google Scholar] [CrossRef]
  32. Eller, M.S.; Payne, G.A. Selection for reduced Fusarium ear rot and fumonisin content in advanced backcross maize lines and their topcross hybrids. Crop. Sci. 2010, 50, 2249–2260. [Google Scholar] [CrossRef]
  33. Hung, H.-Y.; Holland, J.B. Diallel Analysis of resistance to Fusarium ear rot and fumonisin contamination in maize. Crop. Sci. 2012, 52, 2173–2181. [Google Scholar] [CrossRef] [Green Version]
  34. Henry, W.B.; Williams, W.P.; Windham, G.L.; Hawkins, L.K. Evaluation of maize inbred lines for resistance to Aspergillus and Fusarium ear rot and mycotoxin accumulation. Agron. J. 2009, 101, 1219–1226. [Google Scholar] [CrossRef] [Green Version]
  35. Robertson-Hoyt, L.A.; Kleinschmidt, C.E.; White, D.G.; Payne, G.A.; Maragos, C.M.; Holland, J.B. Relationships of resistance to Fusarium ear rot and fumonisin contamination with agronomic performance of maize. Crop. Sci. 2007, 47, 1770–1778. [Google Scholar] [CrossRef] [Green Version]
  36. Robertson-Hoyt, L.A.; Betran, J.; Payne, G.A.; White, D.G.; Isakeit, T.; Maragos, C.M.; Molnar, T.L.; Holland, J. Relationships among resistances to Fusarium and Aspergillus ear rots and contamination by fumonisin and aflatoxin in maize. Phytopathology 2007, 97, 311–317. [Google Scholar] [CrossRef] [PubMed] [Green Version]
  37. Presello, D.A.; Reid, L.M.; Mather, D.E. Resistance of Argentine maize germplasm to Gibberella and Fusarium ear rots. Maydica 2004, 49, 73–81. [Google Scholar]
  38. Presello, D.A.; Iglesias, J.; Botta, G.; Reid, L.M.; Lori, G.A.; EyhErabide, G.H. Stability of maize resistance to the ear rots caused by Fusarium graminearum and F. verticillioides in Argentinian and Canadian environments. Euphytica 2006, 147, 403–407. [Google Scholar] [CrossRef]
  39. Booth, C. The Genus Fusarium; Commonwealth Mycological Institute: Surrey, UK, 1971; p. 271. [Google Scholar]
  40. Tóth, B.; Mesterházy, Á.; Horváth, Z.; Bartok, T.; Varga, M.; Varga, J. Genetic variability of central European isolates of the Fusarium graminearum species complex. Eur. J. Plant Pathol. 2005, 113, 35–45. [Google Scholar] [CrossRef]
  41. Tóth, B.; Mesterházy, Á.; Nicholson, P.; Téren, J.; Varga, J. Mycotoxin production and molecular variability of European and American isolates of Fusarium culmorum. Eur. J. Plant Pathol. 2004, 110, 587–599. [Google Scholar] [CrossRef]
  42. Young, H.C. The toothpick method of inoculating corn for ear and stalk rots. Phytopathology 1943, 33, 16. [Google Scholar]
  43. Mesterházy, Á. Breeding for resistance against FHB in wheat. In Mycotoxin Reduction in Grain Chains: A Practical Guide; Logrieco, A.F., Visconti, A., Eds.; Blackwell-Wiley: Ames, IA, USA; Chichester/Oxford, UK, 2014; pp. 189–208. [Google Scholar]
  44. Mesterházy, Á. Effect of seed production area on the seedling resistance of wheat to Fusarium seedling blight. Agronomie 1985, 5, 491–497. [Google Scholar] [CrossRef]
  45. Mesterházy, Á. Types and components of resistance against Fusarium head blight of wheat. Plant Breed. 1995, 114, 377–386. [Google Scholar] [CrossRef]
  46. Szécsi, Á.; Szekeres, A.; Bartók, T.; Oros, G.; Bartók, M.; Mesterházy, Á. Fumonisin B (1-4)-producing capacity of Hungarian F. verticillioides isolates. World Mycotoxin J. 2010, 3, 67–76. [Google Scholar] [CrossRef]
  47. Sváb, J. Biometriai Módszerek a Kutatásban (Methods for Biometrics in Research), 3rd ed.; Mezogazdasagi Kiado (Agr. Publ. House): Budapest, Hungary, 1981; p. 557. [Google Scholar]
  48. Weber, E. Grundriss der Biologischen Statistik. (Fundaments of the Biological Statistics); VEB Fisher Verlag: Jena, Germany, 1967. [Google Scholar]
  49. Mesterházy, Á.; Bartók, T.; Mirocha, C.M.; Komoróczy, R. Nature of resistance of wheat to Fusarium head blight and deoxynivalenol contamination and their consequences for breeding. Plant Breed. 1999, 118, 97–110. [Google Scholar] [CrossRef]
  50. Mesterházy, Á.; Bartok, T.; Kászonyi, G.; Varga, M.; Tóth, B.; Varga, J. Common resistance to different Fusarium spp. causing Fusarium head blight in wheat. Eur. J. Plant Pathol. 2005, 112, 267–281. [Google Scholar] [CrossRef]
  51. Mesterházy, Á.; Varga, M.; György, A.; Lehoczki-Krsjak, S.; Tóth, B. The role of adapted and non-adapted resistance sources in breeding resistance of winter wheat to Fusarium head blight and deoxynivalenol contamination. World Mycotoxin J. 2018, 11, 539–557. [Google Scholar] [CrossRef]
  52. Pearson, E.S.; Hartley, H.O. Biometrica, Tables for Statisticians (Reprint 1952); Cambrigde University Press: Cambrigde, UK, 1962. [Google Scholar]
  53. Reid, L.; Hamilton, R.I. Effects of inoculation position, timing, macroconidial concentration, and irrigation on resistance of maize to Fusarium graminearum infection through kernels. Can. J. Plant Pathol. 1996, 18, 279–285. [Google Scholar] [CrossRef]
  54. Reid, L.M.; Sinha, R.C. Maize maturity and the development of Gibberella ear rot symptoms and deoxynivalenol after inoculation. Eur. J. Plant Pathol. 1998, 104, 147–154. [Google Scholar] [CrossRef]
  55. Presello, D.A.; Reid, L.M.; Butler, G.; Mather, D.E. Pedigree selection for Gibberella ear rot resistance in maize. Euphytica 2005, 143, 1–8. [Google Scholar] [CrossRef]
  56. Papst, C.; Utz, H.F.; Melchinger, A.E.; Eder, J.; Magg, T.; Klein, D.; Bohn, M. Mycotoxins produced by Fusarium spp. in isogenic Bt vs. non-Bt maize hybrids under European corn borer pressure. Agron. J. 2005, 97, 219–224. [Google Scholar]
  57. Kebede, A.Z.; Woldemariam, T.; Reid, L.M.; Harris, L.J. Quantitative trait loci mapping for Gibberella ear rot resistance and associated agronomic traits using genotyping by sequencing in maize. Theor. Appl. Genet. 2015, 129, 17–29. [Google Scholar] [CrossRef]
  58. Butron, A.; Santiago, R.; Mansilla, P.; Pintos-Varela, C.; Ordas, A.; Malvar, R.A. Maize (Zea mays L.) genetic factors for preventing fumonisin contamination. J. Agric. Food Chem. 2006, 54, 6113–6117. [Google Scholar] [CrossRef]
  59. Mesterházy, Á.; Vojtvics, M. A kukorica Fusarium okozta fertőzöttségének vizsgálata 1972–1975-ben. (Investigation of Fusarium infection in corn 1972–1975). Növénytermelés 1977, 26, 367–378. [Google Scholar]
  60. Gaikpa, D.S.; Miedaner, T. Genomics-assisted breeding for ear rot resistances and reduced mycotoxin contamination in maize: Methods, advances and prospects. Theor. Appl. Genet. 2019, 132, 2721–2739. [Google Scholar] [CrossRef]
  61. Zila, C.T.; Ogut, F.; Romay, M.C.; Gardner, C.A.; Buckler, E.S.; Holland, J.B. Genome-wide association study of Fusarium ear rot disease in the U.S.A. maize inbred line collection. BMC Plant Boil. 2014, 14, 372. [Google Scholar] [CrossRef] [PubMed] [Green Version]
  62. Lanubile, A.; Luca, P.; Marocco, A. Differential gene expression in kernels and silks of maize lines with contrasting levels of ear rot resistance after Fusarium verticillioides infection. J. Plant Physiol. 2010, 167, 1398–1406. [Google Scholar] [CrossRef]
  63. Ding, J.-Q.; Wang, X.-M.; Chander, S.; Yan, J.-B.; Li, J.-S. QTL mapping of resistance to Fusarium ear rot using a RIL population in maize. Mol. Breed. 2008, 22, 395–403. [Google Scholar] [CrossRef]
  64. Ju, M.; Zhou, Z.; Mu, C.; Zhang, X.; Gao, J.; Liang, Y.; Chen, J.; Wu, Y.; Li, X.; Wang, S.; et al. Dissecting the genetic architecture of Fusarium verticillioides seed rot resistance in maize by combining QTL mapping and genome-wide association analysis. Sci. Rep. 2017, 7, 46446. [Google Scholar] [CrossRef] [PubMed]
  65. Lanubile, A.; Maschietto, V.; Borrelli, V.M.; Stagnati, L.; Logrieco, A.F.; Marocco, A. Molecular basis of resistance to Fusarium ear rot in maize. Front. Plant Sci. 2017, 8, 1–13. [Google Scholar] [CrossRef] [PubMed]
  66. Szabó-Hevér, Á.; Lehoczki-Krsjak, S.; Varga, M.; Purnhauser, L.; Pauk, J.; Lantos, C.; Mesterházy, Á. Differential influence of QTL linked to Fusarium head blight, Fusarium-damaged kernel, deoxynivalenol contents and associated morphological traits in a Frontana-derived wheat population. Euphytica 2014, 200, 9–26. [Google Scholar] [CrossRef] [Green Version]
  67. Schaafsma, A.W.; Tamburic-Ilincic, L.; Reid, L.M. Fumonisin B1 accumulation and severity of Fusarium ear rot and Gibberella ear rot in food-grade corn hybrids in Ontario after inoculation according to two methods. Can. J. Plant Pathol. 2006, 28, 548–557. [Google Scholar] [CrossRef]
  68. Reid, L.M.; Hamilton, R.I.; Bolton, A.T. Diallel analysis of resistance in maize to Fasarium graminearum infection via the silk. Can. J. Plant Sci. 1992, 72, 915–923. [Google Scholar] [CrossRef] [Green Version]
  69. Santiago, R.; Cao, A.; Butrón, A. Genetic factors involved in fumonisin accumulation in maize kernels and their implications in maize agronomic management and breeding. Toxins 2015, 7, 3267–3296. [Google Scholar] [CrossRef] [Green Version]
  70. Presello, D.A.; Pereyra, A.O.; Iglesias, J.; Fauguel, C.M.; Sampietro, D.A.; Eyhérabide, G.H. Responses to selection of S5 inbreds for broad-based resistance to ear rots and grain mycotoxin contamination caused by Fusarium spp. in maize. Euphytica 2010, 178, 23–29. [Google Scholar] [CrossRef]
  71. Rose, L.J.; Okoth, S.; Beukes, I.; Ouko, A.; Mouton, M.; Flett, B.C.; Makumbi, D.; Viljoen, A. Determining resistance to Fusarium verticillioides and fumonisin accumulation in African maize inbred lines resistant to Aspergillus flavus and aflatoxins. Euphytica 2017, 213, 93. [Google Scholar] [CrossRef]
  72. Mesterházy, A.; Lehoczki-Krsjak, S.; Varga, M.; Szabó-Hevér, Á.; Tóth, B.; Lemmens, M. Breeding for FHB resistance via Fusarium damaged kernels and deoxynivalenol accumulation as well as inoculation methods in winter wheat. Agric. Sci. 2015, 6, 970–1002. [Google Scholar] [CrossRef] [Green Version]
  73. Battilani, P.; Toscano, P.; Van der Fels-Klerx, H.J.; Moretti, A.; Leggieri, M.C.; Brera, C.; Rortais, A.; Goumperis, T.; Robinson, T. Aflatoxin B1 contamination in maize in Europe increases due to climate change. Sci. Rep. 2016, 6, 24328. [Google Scholar] [CrossRef] [PubMed] [Green Version]
Figure 1. Toothpick inoculation by Fusarium spp. in maize cobs 6–7 days after midsilking. From left: (a) Fusarium infested toothpicks. (b) Making a hole by an awl, (c). The hole on the ear, and (d) The toothpick inserted into the hole.
Agronomy 10 01283 g001
Figure 2. Bubble breeding method with Czapek-Dox medium, (left): two days old inoculum with a number of small mycelium fragments, (right): on the 7th day the inoculum is ready. The sterile air mixes the medium and secures oxygen support.
Agronomy 10 01283 g002
Figure 3. Resistance of hybrid Sze 363 against different Fusarium spp. Toothpick method, kernel resistance. (Left upper): F. graminearum, (right upper): F. culmorum, (left lower): F. verticillioides, (right lower): naturally infected control.
Agronomy 10 01283 g003
Figure 4. Resistance of hybrid SBL1 against different Fusarium spp. Toothpick method, kernel resistance. (Left upper): F. graminearum, (right upper): F. culmorum, (left lower): F. verticillioides, (right lower): naturally infected control.
Agronomy 10 01283 g004
Figure 5. Resistance of hybrid SBL19 against different Fusarium spp. Toothpick method, kernel resistance. (Left upper): F. graminearum, a toothpick from inoculation in the 2nd cob from right, (right upper): F. culmorum, (left lower): F. verticillioides, (right lower): naturally infected control.
Agronomy 10 01283 g005
Figure 6. Resistance of hybrid Beym against different Fusarium spp. Toothpick method, kernel resistance. (Left upper): F. graminearum, (right upper): F. culmorum, (left lower): F. verticillioides, (right lower): naturally infected control.
Agronomy 10 01283 g006
Figure 7. Regression between Fusarium culmorum ear rot severity (%) following toothpick inoculation and DON contamination (n = 34), Szeged, 2010–2011, n = 34. LSD 5% DON = 11.65, red highlighted genotype SBL19: Difference between 28.60 and calculated DON by the linear function (8.26) is 20.34 that is higher than LSD 5% 11.65, therefore DON overproduction is proven. Statistical method: Built-in Excel function for regression calculation.
Agronomy 10 01283 g007
Figure 8. Regression between Fusarium verticillioides ear rot severity (%) following toothpick inoculation and fumonisin contamination (n = 34), Szeged, 2010–2011, n = 34. LSD 5% for fumonisin B1 + B2 between genotypes: 13.60. Red highlighted Difference between 50.07 and calculated DON by the linear function (7.95) is 50.42 (hybrid Kenez) 42.12 that is higher than LSD 5% 13.60. For (ISH303) 23.34 mg/kg is the infected fumonisin content, 5.25 mg/kg is the data point on the regression line, the difference is 17.98, higher than the LSD 5% limit is. Therefore, the fumonisin overproduction is proven. Statistical method: Built-in Excel function for regression calculation.
Agronomy 10 01283 g008
Figure 9. Regression between Fusarium verticillioides ear rot and fumonisin B1 + B2 contamination (n = 34), means for natural and artificial infection from toothpick infection, Szeged, 2010–2011. LSD 5% for fumonisin B1 + B2 = 9.44. Red highlight: genotypes with significant fumonisin overproduction. In three hybrids (Szegedi SC 352, Kenez and Szegedi 475), the differences between ear rot and their corresponding data on the linear line were 12.08, 18.89 and 11, respectively, so a toxin overproduction could be verified.
Agronomy 10 01283 g009
Figure 10. Regression between Fusarium verticillioides ear rot and fumonisin contamination (n = 34), combined from toothpick and natural infection without the data of the three hybrids with toxin overproduction, Szeged, 2010–2011. LSD 5% = 9.44. Regression model from Excel built-in function.
Agronomy 10 01283 g010
Figure 11. Comparison of ear rot results from the silk channel and toothpick methods in maize inoculation methods, 2010–2012.
Agronomy 10 01283 g011
Table 1. Resistance of maize hybrids to toxigenic fungi. Toothpick method, ear severity as percentage, Szeged, 2010–2012.
HybridFusarium spp. Ear Rot %NI ControlMeanVariance a
Fc 12551Fg 12377Fv 18
Szegedi 3634.205.242.441.203.271.46
SzegediTC4655.504.933.030.653.531.34
Szegedi 3436.224.863.321.173.891.61
Sarolta8.256.541.711.314.457.95
Szegedi 5218.234.792.652.174.465.42
SBL17.417.051.812.144.606.72
Szegedi 3865.888.492.821.414.655.66
SBL75.675.085.573.554.970.12
SzegediSC 3528.158.562.720.575.007.63
Csanád9.586.022.393.115.288.74
SBL158.548.503.522.175.685.90
Szegedi 3496.868.342.175.625.756.91
SBL413.025.902.652.075.9119.16
Kenéz9.829.583.841.276.138.30
Beym13.326.963.581.276.2817.01
SBL1111.438.653.162.396.4112.26
SzegediTC51314.378.242.631.446.6723.77
ISH302v12.5211.232.131.536.8522.16
SBL87.419.716.134.246.872.38
Narew13.188.034.871.676.9412.48
SBL28.7011.013.215.187.0210.78
SBL1713.108.783.463.577.2315.91
SBL1612.5010.773.472.367.2715.99
SBL310.2211.194.075.437.7310.09
Szegedi 37213.8511.353.672.217.7719.65
ISH40218.048.233.182.618.0238.88
ISH40314.208.744.175.808.2316.96
Szegedi 28817.1510.523.902.008.3930.38
Szegedi 47518.679.283.194.038.7941.14
Kozak17.0110.335.372.808.8823.77
SBL912.9410.326.655.818.936.93
SBL610.8915.036.183.728.9613.85
SBL515.6510.496.844.849.4513.66
SBL1218.2310.127.405.0710.2021.87
SBL1418.7614.514.288.2211.4437.22
SBL1318.7117.846.413.3611.5833.33
SBL1921.2517.586.202.7811.9543.37
ISH30323.9920.091.502.3011.9798.94
SBL1020.4616.175.937.1812.4437.96
SzegediTC36720.3416.677.535.3512.4730.42
Bella16.7025.376.074.3613.1264.43
GK Boglár22.9922.794.193.2313.3080.56
SzegediTC25920.579.539.9113.4313.3626.19
SBL1818.6921.609.154.6813.5330.44
Mean13.2510.804.303.447.9521.36
LSD 5% hybrids6.898.312.112.772.84
LSD 5% Fus. spp. 0.86
Bold names: uniformly lower or higher performance in all traits compared to means: F.g.: F. graminearum, Fc: F. culmorum, Fv: F. verticillioides, NI control: naturally infected control, a Variance for artificial and natural infection.
Table 2. Kernel resistance of maize hybrids to toxigenic fungi, correlations between resistance to them and the naturally infected control from data of Table 1.
ColumnToxigenic Fungi and Control
FcFgFvNI Control
Fg0.7044 ***
Fv0.4643 **0.4458 **
Control0.4192 *0.27910.6417 ***
Mean0.9020 ***0.8629 ***0.6884 ***0.6097 ***
*** p = 0.001, ** p = 1%, * p = 0.05, NI control: naturally infected control.
Table 3. Kernel resistance, ANOVA from the data of Table 1.
Source of VarianceANOVA Traits
SSdfMSF
Genotype A13,813.3843321.248.52 ***
Fusarium spp. B27,695.2439231.75245.00 ***
Year C4433.4622216.7358.83 ***
A × B10,596.7912982.152.18 ***
A × C15,317.6686178.114.72 ***
B × C31,474.4565245.74139.21 ***
A × B × C19,944.1925877.302.05 ***
Within39,791.87105637.68
Total163,067.041583
*** p = 0.001/0.1%.
Table 4. Influence of years on the ear rot contamination (%) caused by toxigenic fungi in maize hybrids, toothpick method and natural infection, Szeged, 2010–2012.
YearFusarium spp.NI ControlMean
Fc 12375Fg 13.38Fv 18
20107.968.097.948.488.12
201112.7424.771.710.399.90
20126.9011.683.241.445.82
Mean9.2014.854.303.447.95
LSD 5% year 0.74
LSD 5% tox. fungi 0.85
F.g.: F. graminearum, Fc: F. culmorum, Fv: F. verticillioides, NI control: naturally infected control.
Table 5. Resistance of maize hybrids to toxigenic fungi. Silk channel method, ear coverage as percentage, (n = 44) Szeged, 2010–2012.
HybridFusarium spp.NI ControlMeana Variance
Fg 13.38Fc 12375Fv 18
SzegediSC 3520.931.541.340.511.080.210
Sarolta1.361.761.081.001.300.117
ISH302v1.221.601.421.061.320.055
SzegediTC5131.081.661.791.551.520.097
Csanád1.341.541.022.481.590.391
ISH3032.591.300.892.331.780.660
Beym2.362.331.931.031.910.384
SzegediTC4652.351.832.870.741.950.830
SBL12.392.401.382.212.100.235
Szegedi 3632.482.072.611.952.280.100
SBL152.452.322.812.282.470.059
SBL162.122.432.772.832.540.107
Szegedi 2881.922.822.662.772.540.179
ISH4021.244.612.712.412.741.950
SBL114.252.861.971.982.761.149
Szegedi 3433.682.283.192.182.830.523
Szegedi 3492.692.081.455.512.933.208
Narew4.063.703.111.463.081.320
SBL43.244.332.532.263.090.853
Szegedi 3724.052.433.492.423.100.659
SBL62.493.454.482.353.190.977
SBL23.312.482.524.693.251.067
Kozak3.143.742.983.373.310.108
GK Boglár3.553.073.953.433.500.131
Kenéz5.293.763.542.683.821.179
Szegedi 5214.253.954.823.484.130.315
Szegedi 3865.383.744.434.434.490.457
SBL193.425.836.113.044.602.539
SBL135.594.404.733.854.640.530
ISH4033.685.093.657.224.912.819
SBL143.753.913.568.514.935.719
SBL174.305.355.415.405.120.295
Szegedi 4754.335.135.675.545.170.365
SBL85.375.216.014.765.340.269
SBL105.824.095.007.165.521.694
SBL35.204.655.476.995.581.003
SBL94.495.806.395.735.600.634
SzegediTC2594.909.037.732.546.058.442
Bella7.106.866.524.586.261.320
SBL55.246.567.156.306.310.634
SzegediTC3676.816.676.535.756.440.225
SBL185.697.188.337.037.061.167
SBL126.748.337.325.907.071.042
SBL77.217.518.606.947.560.534
Mean3.753.953.953.703.841.06
LSD 5% hybrid 1.29
Bold names: uniformly lower or higher performance in all traits compared to means: F.g: F. graminearum, Fc: F. culmorum, Fv: F. verticillioides, NI Control: natural infection, a Variance for artificial and natural infection.
Table 6. Silk channel resistance in maize, correlations between Fusarium spp. and natural infection from Table 5, 2010–2012.
CorrelationsFusarium spp. and Natural Infection
Fg 13.38Fc 12375Fv 18NI Control
Fc0.7784
Fv0.82850.9236
Control0.66810.60730.6442
Mean0.90340.92250.94690.8182
All significant at p = 0.001, NI: naturally infected control.
Table 7. Silk channel resistance in maize against Fusarium spp. ANOVA of the data of Table 5.
Source of Var.ANOVA TraitsLSD 5%
SSdfMSF
Genotype A4936.2443.00114.8015.38 ***1.29
Fusarium spp. B21.233.007.080.94ns
Year C14,836.022.007418.01994.37 ***0.34
A × B1235.67129.009.581.28 *
A × C5024.7386.0058.437.83 **
B × C41.526.006.920.92ns
A × B × C2695.62258.0010.451.40 **
Within8191.501056.007.76
Total36,982.531583.00
*** p = 0.1%, ** p = 1%, * p = 5%.
Table 8. Influence of years on the ear rot contamination caused by toxigenic fungi in maize hybrids, silk channel method, Szeged, 2010–2012.
YearFusarium spp.NI ControlMean
Fg 13.38Fc 12375Fv
20107.968.097.917.737.92
20110.650.680.730.180.56
20122.633.083.223.173.02
Mean3.753.953.953.703.84
LSD 5% 0.34
LSD 5% F. spp. ns
F.g.: F. graminearum, Fc: F. culmorum, Fv: F. verticillioides, NI control: naturally infected control.
Table 9. Toxin contamination following toothpick inoculation in 2010–2011 in maize hybrids (kernel resistance), data in mg/kg, Szeged.
HybridFusarium spp. and Natural Infection mg/kgMeana Variance
Fc 12375Fg 13.38Fv 18NI Control
DONDONFB1 + FB2DONFB1 + FB2
Csanád1.310.090.850.000.160.480.26
SzegediTC4650.250.003.090.200.030.711.42
SBL10.430.941.790.280.780.850.28
Szegedi 2880.172.372.470.000.171.041.28
Sarolta0.470.703.920.301.251.331.78
SBL40.311.275.570.830.091.614.07
SBL31.151.291.922.511.331.640.26
Szegedi 5210.251.060.490.857.021.936.55
Szegedi 3631.204.993.290.000.932.083.27
Szegedi 3860.982.746.350.000.762.175.19
SBL20.362.723.242.772.122.241.02
SBL151.461.562.730.996.652.684.27
SBL90.612.816.310.494.612.975.11
SBL126.790.247.800.000.253.0212.32
Szegedi 3721.839.740.760.972.943.2511.12
SBL112.936.263.380.703.583.373.15
SzegediTC5131.390.009.852.503.813.5111.63
SBL171.124.649.541.231.573.6210.46
Szegedi 3491.211.483.190.5712.463.7819.58
SBL60.745.628.201.045.224.168.20
SBL51.482.444.831.2212.424.4817.39
SBL162.5810.821.520.338.914.8317.75
SBL70.310.4914.690.249.275.0035.44
ISH3035.990.8223.341.191.696.6173.48
GK Boglár2.8516.8411.851.203.877.3236.11
SBL1317.486.8110.920.062.027.4639.42
Szegedi 4751.652.127.960.1927.957.97106.76
SBL1419.017.651.911.5512.038.4343.07
SzegediSC 3520.066.184.310.0031.778.46141.53
Bella1.314.7415.590.6922.008.8671.75
SBL80.7618.6811.290.0015.539.2558.04
SBL1011.3814.0518.192.267.8110.7429.48
Kenéz0.0010.2550.071.190.5612.41368.66
SBL1928.6012.2518.692.384.4213.2792.51
Mean3.484.848.230.856.354.7536.55
LSD 5%12.0011.6513.601.5713.108.76
Bold names: uniformly lower or higher performance in all traits compared to means: Fg: F. graminearum, Fc: F. culmorum, Fv: F. verticillioides, NI control: naturally infected control, a variance for columns 1–5.
Table 10. Toxin contamination in KR tests 2010–2012, correlation analysis of Table 9.
FungiToxinsToxigenic Fungi and Natural Contamination
Fc 12375Fg 13.38Fv18NI Control
DONDONFB1 + FB2DONFB1 + FB2
FgDON0.35*
Fv18FB1 + FB20.170.30
NaturalDON0.310.150.08
NaturalFB1 + FB2−0.080.270.07−0.03
Mean 0.56 ***0.69 ***0.78 ***0.250.38 *
*** p = 0.001, * p = 0.05, NI control: naturally infected control.
Table 11. Toxin contamination in KR, ANOVA of the toxin results from Table 9, 2010–2012, n = 34.
Source of Var.ANOVA Traits
SQdfMSF
Genotype A12,034.1333.00364.673.65 ***
Fus. spp. B6436.574.001609.1416.12 ***
Year C1132.351.001132.3511.34 ***
A × B30,840.80132.00233.642.34 ***
A × C10,228.1133.00309.943.10 ***
B × C10,044.554.002511.1425.16 ***
A × B × C36,455.10132.00276.182.76 ***
Within67,856.24680.0099.79
Total175,027.851019.00
*** p = 0.001.
Table 12. Toxin contamination of the ten selected 10 hybrids against Fusarium spp. after toothpick inoculation (KR), Szeged, 2010–2012.
Hybrid Fusarium spp./Toxins mg/kgMean
Fc DONFg DONFv FB1 + FB2NI Control DONNI Control FB1 + FB2
Szegedi 3860.661.828.500.001.222.44
SBL150.971.047.560.666.503.35
SBL161.727.213.070.225.963.64
SBL80.5112.4510.870.005.615.89
SBL11.430.6333.940.190.527.34
SBL107.599.3720.031.507.139.12
Kenéz0.006.8339.950.790.899.69
ISH3033.990.5446.490.802.1310.79
GK Boglár1.9011.2336.600.803.5510.82
Bella0.873.1640.590.4611.1611.25
Mean1.965.4324.760.544.477.43
LSD 5%6.556.2613.870.784.264.20
Bold printed names: uniformly lower or higher performance in all traits compared to means: Fg: F. graminearum, Fc: F. culmorum, Fv: F. verticillioides, NI control: naturally infected control.
Table 13. Toxin contamination in KR resistance test, (n = 10), 2010–2012, correlations between different toxins, data from Table 12.
ToxinsToxins and Natural Control
Fc DONFg DONFv FB1 + FB2NI Control DON
Fg DON0.14
Fv FB1 + FB20.09−0.17
NI control DON0.75 **0.180.36
NI control FB1 + FB20.180.21−0.180.18
** p = 0.01
Table 14. Toxin contamination in KR resistance test, (n = 10), ANOVA of data from Table 12.
Source of VarianceANOVA Traits
SSdfMSFF A × B × CLSD 5%
Genotype A18,557.9092061.9919.98 ***2.53 *4.20
Fus. spp. B49,031.31412,257.83118.78 ***15.07 ***2.97
Year C14,832.0927416.0571.86 ***9.12 ***2.30
A × B6323.7836175.661.70 *0.22
A × C863.701847.980.460.06
B × C10,468.8681308.6112.68 ***1.61
A × B × C58,543.5172813.107.87 ***
Within20,638.51200103.19
Total179,260.06349
*** p = 0.001, * p = 0.05. Fc = F. culmorum, Fg = F. graminearum, Fv = F. verticillioides.
Table 15. Toxin contamination of the grains of ten selected maize hybrids following toothpick inoculation in different years against Fusarium spp. and control, Szeged, 2010–2012.
YearFusarium spp./ToxinMean
Fc DONFg DONFv FB1 + FB2NI Control DONNI Control FB1 + FB2
20102.202.0914.191.6311.766.37
20113.3514.2014.700.000.006.45
20120.350.0045.390.000.009.15
Mean1.965.4324.760.543.927.32
LSD 5% 2.30
NI control: naturally infected control.
Table 16. Toxin data from the selected set (n = 10) of hybrids from resistance test to Fusarium spp by silk channel inoculation, mg/kg, 2010–2012, Szeged.
HybridFc DONFg DONFv FB1 + FB2NI Control DONNI Control FUM B1 + B2Mean
SBL10.100.232.770.120.920.83
ISH3030.090.003.691.650.881.26
Szegedi 3860.060.459.090.290.902.16
SBL100.320.194.420.965.432.27
SBL150.000.405.900.246.422.59
GK Boglár0.092.467.970.742.482.75
SBL160.090.004.680.7613.283.76
Bella1.050.008.780.4010.354.12
Kenéz0.100.1532.700.432.017.08
SBL80.000.0025.590.0016.908.50
Mean0.190.3910.560.565.963.53
LSD 5% hybrid0.441.1810.970.724.412.39
LSD 5% toxin 1.69
Bold printed names: uniformly lower or higher performance in all traits compared to means: F.g.: F. graminearum, Fc: F. culmorum, Fv: F. verticillioides, Control: natural infection, NI control: naturally infected control.
Table 17. SR resistance test for toxins in maize hybrids, n = 10, 2010–2012, correlation between toxin contamination from data Table 16.
CorrelationsFc DONFg DONFv FB1 + FB2DON Control
Fg DON−0.1889
Fv FB1 + FB2−0.1343−0.1259
DON Control0.01750.0449−0.3844
FUM B1 + B2 Control0.1955−0.32370.2241−0.3091
No significant correlation was found.
Table 18. SR resistance test in maize, ANOVA from the data of Table 16.
Source of VarianceANOVA Traits
SSdfMSFLSD 5%
Genotype A2479.399.00275.498.21 ***2.39
Fusarium spp. B7667.114.001916.7857.16 ***1.69
Year C5565.682.002782.8482.99 ***1.31
A × B8640.7836.00240.027.15 ***
A × C4598.4518.00255.477.61 ***
B × C6056.248.00757.0322.57 ***
A × B × C17,248.8172.00239.577.14 ***
Within10,059.18300.0033.53
Total62,315.63
*** p = 0.001.
Table 19. Toxin contamination across hybrids following silk channel inoculation of ten maize hybrids against Fusarium spp., 2010–2012, Szeged.
YearFc DONFg DONFv FUMNaturally Infected ControlMean
FB1 + FB2DONFUM B1 + B2
mg/kg
20100.571.1622.031.6817.018.49
20110.000.013.480.000.000.70
20120.000.006.180.000.861.41
Mean0.190.3910.560.565.963.53
LSD 5% 1.31
NI control: naturally infected control.
Table 20. Kernel resistance of maize to toxigenic Fusarium ear rots and natural contamination as well as their toxin contamination, 2010–2012.
HybridsArtificial InoculationControl
Fg KR %Fg DONFc KR %Fc DONFv KR %Fv FB1 + FB2Ear Rot %DONFB1 + FB2
Szegedi 3868.491.825.880.662.828.501.410.001.22
SBL158.51.048.540.973.527.562.170.666.50
SBL1610.777.2112.51.723.473.072.360.225.96
SBL89.7112.457.410.516.1310.874.240.005.61
SBL118.659.3711.437.593.1620.032.391.507.13
Kenéz9.586.839.820.003.8439.951.270.790.89
SBL1016.170.6320.461.435.9333.947.180.190.52
ISH30320.090.5423.993.991.546.492.30.802.13
GK Boglár22.7911.2322.991.904.1936.603.230.803.55
Bella25.373.1616.70.876.0740.594.360.4611.16
Mean14.015.4313.971.964.0624.763.090.544.47
LSD 5%8.836.268.866.551.6213.871.620.781.26
Green highlighted: Value is lower than the column mean. NI control: naturally infected control.
Table 21. Kernel resistance to maize ear rots, correlation analysis from data of Table 20.
CorrelationsEar RotToxinEar RotToxinEar RotToxinNI Ear RotNI DON
Fg KR %Fg DONFc KR %Fc DONFv KR %Fv FB1 + FB2%DON
Fg DON−0.13
Fc KR%0.83 ***−0.17
Fc DON−0.030.130.25
Fv KR%0.230.26−0.04−0.44
Fv FB1 + FB20.73 **−0.170.74 *0.090.04
NI Ear rot%0.41−0.090.42−0.110.76 **0.23
NI DON0.060.180.240.75 **−0.410.36−0.33
NI FB1 + FB20.220.21−0.120.180.31−0.180.050.18
*** p = 0.001, ** p = 0.01, * p = 0.05.

