Article

Precise Fertilization by a Mass-Balance of the Seasonal Changes in Nutrient Uptake by Almond Trees

Gilat Research Center, Agriculture Research Organization, Negev 85280, Israel
*
Author to whom correspondence should be addressed.
Agronomy 2020, 10(9), 1277; https://doi.org/10.3390/agronomy10091277
Submission received: 29 June 2020 / Revised: 12 August 2020 / Accepted: 23 August 2020 / Published: 28 August 2020
(This article belongs to the Special Issue Mineral Nutrition of Fruit Trees)

Abstract

:
Mineral fertilization through irrigation (fertigation) could optimize resource allocation and eliminate wastes in agriculture. Nevertheless, the fertigation of almond plantations is currently inefficient (50% nitrogen (N) recovery by yields) due to the limited empirical data to support field applications. For precise fertigation in horticulture, we aimed to determine the trees’ actual mineral uptake. We hypothesized that the mineral requirements depend on physiological development and would vary during the growing season as phenology shifts. To investigate this, we tracked the water, N, phosphorus (P), and potassium (K) mass-balances of almond trees in 1 m3 lysimeters and monitored their physiological performances. By canopy coverage (leaf area index—LAI)) and radial stem growth, we determined that almond trees invest in biomass between April and July (northern hemisphere). Then, for August until November, the almond trees accumulated metabolites and minerals for the succeeding winter dormancy. Annually, almond trees can utilize major N applications (~180 kg h−1) in early summer for vegetative growth, extract P (~50 kg h−1) by mid-summer for metabolic translocations, and accumulate K (>250 kg h−1) in late summer, possibly for osmotic compensations. Converting these realizations for farm conditions requires the further characterization of the mineral availability at the root zone, and the nutritional status of trees, under various field fertigation applications.

1. Introduction

Intensive farming relies on the precise and sustainable use of resources that optimizes productivity and protects the environment. Mineral nutrient application, the hallmark of the ‘green revolution’ and industrialized farming [1] need to adjust to new market demands [2]. Nutrients are becoming expensive, while their residues wash away from the farms and threaten the surrounding natural or urban habitats. This leads to profit losses, alarms communities, and forces regulators to act [3]. However, in industrialized farming regions, nutrient applications are often suboptimal, and therefore maximizing crops while eliminating runoffs is difficult. To achieve it, the applications of water and nutrients should advance and fit the crops’ actual requirements. For that matter, the use of mineral nutrition through irrigation (i.e., fertigation) has great potential to minimize farming contamination and improve yields. Nevertheless, to date, fertigation is not exceptionally efficient or optimized [4]. There is no high-resolution information on crops’ mineral uptake, and the concentration of nutrients in irrigation typically remains constant throughout the growing season, independent of plants’ actual requirements. The technical challenge is that in fertigation, minerals are readily available for the plants, or to wash away, at the time of application. For instance, poplar trees acquire nutrients early in the light period (in growth chambers with artificial light [5]), and later applications may be impractical. On the other hand, tomato plants require more nutrients in the afternoon [6], presumably to reserve osmolytes for early morning stomata apparatus. Seasonally, perennial trees accumulate K and microelements in late fall to support bloom [7]. Fertigation regimes should account for the variability in nutrient uptake, yet the current empirical data might mislead such applications. High P concentrations in roots may infer that P fertilization is critical in late winter when only roots grow, or it could be the mineral’s last resort, and irrelevant to precise fertilization. Hence, there is a need to develop differential fertigation (DF) regimes that account for phenological stages in major crops.
Plants’ mineral requirements depend on developmental phases. There is temporal variability in plants’ nutritional needs, which could guide mineral applications in multiple crops (e.g., vegetables [8] or cotton [9]). The variability is probably related to shifts in tissue development. Plant tissues have 0.5–4% nitrogen (N; per dry mass, DM) constituting the nuclei material and functional proteins. Specifically, plants incorporate minerals into biomass according to their functionality. N concentrations in almond leaves remain above 1.3% at low N conditions [10], probably because plants downregulate photosynthesis or cease growth in N deficiency. However, roots extend to extract residual minerals at <0.5% N to mitigate mineral deficiency [11]. P is prominent in nucleic acids, yet in low concentrations that accumulate to just ~0.5% of the DM [12]. Otherwise, P-esters make the available energy for cellular metabolism, regulating numerous enzymatic processes. Therefore, P levels are high in expanding tissues with fast metabolism and high turnover rates. P can accumulate to 85% of the vacuoles’ volume, and then buffer the extreme demands of phosphorylated intermediates of photosynthesis [12]. K is the most abundant cation in the cytosol, and it facilitates osmoregulation and hydraulic imbalances inside plants [13]. K is also critical in cellular carbohydrate management through enzyme synthesis and activation or sugar transport in phloem [14], and therefore its concentrations can fluctuate markedly throughout the growing season [7]. Hence, the potential of trees’ nutrients uptake depends on the growth phenology. Accordingly, there are indirect seasonal demand curves for nutrient uptake that rely on the mineral composition of the reproductive and vegetative growth of apple [15], pistachio [16], and citrus trees [17].
Transpiration governs plants’ actual mineral uptake. Primarily, water availability determines trees’ daily productivity. For instance, infrequent irrigations or rare rain events result in periodic droughts and low water potential in plants [18]. In such conditions, plants shut stomata, reduce photosynthesis, and inhibit development. It implies that they do not require nutrients either. On the seasonal scale, a short irrigation period limits fall photosynthesis and mineral acquisition, rendering trees to rely solely on spring mineral uptake. High humidity limits the transpiration, lowers productivity and therefore reduces the plants’ nutrient uptake. Temperature also affects transpiration, photosynthesis, and carbohydrate transport, limiting development at both the cold and warm ends of the spectrum [19]. Finally, atmospheric conditions interact with soil conditions, e.g., precipitation changes the soil properties and its mineral distribution in the root zone [20]. This makes the soil–plant–atmosphere continuum a challenging system to characterize and yet emphasizes that linking nutrient uptake to water uptake could set an empirical framework for a precise mineral application through irrigation.
Mass balances are a useful tool to study plants’ resource uptake. Lysimeters (weighing potted plants, or only their drainage) is a common mass-balance application to determine transpiration. More advanced and precise systems can also measure daily biomass accumulation and account for growth [21]. Alternative mass-balance applications monitor the gas composition (often labeled 13C and 17O) surrounding enclosed plants to determine their photosynthesis and respiration rates. However, it is challenging to determine the mass-balances of large perennial plants (e.g., trees) due to the size of the soil–plant system and the duration of their phenological cycles. Occasionally, there are robust initiatives to track the water-balances of trees, e.g., date palms [22], apples [23], and even forest trees (Douglas fir [24]). In the case of citrus trees, there were even measurements of the leakage mineral composition [25], which zero-tension plate lysimeters below the root zone can also determine [26]. Hence, we determined that the mass-balance would be the most effective tool to assess temporal changes in plants’ nutrient uptake.
We postulated that phenology dictates the nutrient requirements of trees and therefore changes the ratio between water, and N, P, or K uptake. We considered almond trees (Prunus dulcis) a model species for domesticated fruit trees due to their economic dominance, nutritional contribution, and historical importance. People found edible almonds by 17,000 BC in Israel [27] and by 2020, intensive almond farming expanded to California (1.5 Million tons in 2014), southern Europe (200,000 tons), and Australia (160,000 tons). Almond cultivation is conventional in arid climates (200–500 mm winter precipitation) by ~1200 mm irrigation. Farmers apply 240 kg N hectare−1 (the majority by July) and 300 kg K hectare−1 (distributed between early summer and a September application) annually [28]. Farmers also adjust the multiannual fertilization regimes, and consider P or microelement applications, through July leaf mineral analyses [29]. Hence, we aimed to study almond trees and establish precise fertilization in tree-crops by (1) directly characterizing the temporal changes in nutrient uptake by trees and (2) associating fertilization efficiency to phenology shifts and transpiration activity.

2. Methods

2.1. Big Lysimeters

In March 2017, 72 1 year-old almond trees of the Israeli commercial variety (Um-El-Fahem grafted on a commercial almond and peach hybrid-GN) were planted in 1 m3 containers (105 cm high and 55 cm in radius) filled with inert soilless media (4–6 mm perlite) that drained through a single 20 mm outlet. Commercial 16 mm irrigation lines reached each container and supplied water at 16 L h−1 through four pressure-compensated drippers. The trees were fertigated with 6 N concentrations (2, 10, 30, 60, 100, and 150 mg N L−1 by a 9:1 ratio between NO3 and NH4+) with 10 mg P L−1 and 60 mg K L−1, 6 P concentrations (0, 1, 3, 6, 10, and 15 mg P L−1) with 60 mg N L−1 and 60 mg K L−1, or 6 K concentrations (2, 10, 30, 60, 100, and 150 mg K L−1) with 60 mg N L−1 and 10 mg P L−1. Otherwise, all trees received the remaining macroelements and essential microelements similarly. Each treatment consisted of 4 trees randomly distributed in a 2500 m2 field at the Gilat Research Center (31°34′ N, 34°67′ E). The climatic conditions at the research site were semi-arid, with a dry and hot summer (August is the warmest with mean temperatures of 33 °C, 40% relative humidity at noon, and no precipitation between May and October) and mild winter (January is the coldest with 11 °C mean, 50% relative humidity at noon, and up to 250 mm between November and April). Fertigation electrical conductivity and pH were similar in all the treatments through designated stoichiometry computations for soluble fertilization by commercial-grade salts (KH2PO4, H2PO4NH4, NH4NO3, KNO3, MgNO3, MgSO4, and NaNO3).

2.2. Tracking Phenology

For two consecutive growing seasons, 2018–2019, light penetration (LP−80, Decagon, Pullman, WA, USA) was measured monthly for the south, west, north, and east faces of the canopy, and averaged for the leaf area index (LAI). Additionally, in 2019, the stem circumference of the trees was measured monthly at 10 and 40 cm from the perlite surface, averaged, and subtracted from the preceding month’s measurement to determine the vegetative growth rate.

2.3. Laboratory Analyses

Leaves (5th leaf from apical meristem) and roots (25 cm deep and 5 mm in diameter) were sampled monthly between April and October 2019 from the 2 to 100 mg N L−1, 0 to 15 mg P L−1, and 2 to 100 mg K L−1 treatments. Samples were washed in deionized water (DI), dried for 48 h at 70 °C to the residual water content, and mill-ground into a fine powder (particle size around 0.5 mm). Then, 100 mg of each sample was digested in 2 mL sulfuric acid and hydrogen peroxide [30]. Liquidized N and P were detected by an automated photometric analyzer (Gallery152 Plus, Thermo-Scientific, Waltham, MA, USA), while K was measured by atomic absorption (PinAAcle500, PerkinElmer, Waltham, MA, USA).
Monthly roots samples were also flash-frozen in liquid N, lyophilized, and stored at −80 °C. The dried samples were later ground to a fine powder in a mini bead-beater (Biospec, Bartlesville, OK, USA) and analyzed for non-structural carbohydrate (NSC) concentrations by an updated enzymatic and colorimetric method [4]. In short, to remove the soluble carbohydrates (SC), 25 mg of a powdered sample was suspended in 1 mL DI for 15 min at 72 °C, centrifuged at 17,000× g for 10 min, and separated from the supernatant. Then, to digest starch, the tissue was incubated in 500 µL of a sodium acetate buffer (0.2 M, pH 5.6), 100 µL of amyloglucosidase (70 units mL−1, Sigma-Aldrich, St. Louis, MI, USA), and 100 µL of amylase (7 units mL−1, Sigma-Aldrich, St. Louis, MI, USA) for 4 h at 37 °C. After vortex and centrifuge, another 50 µL supernatant (now consisting of SC that originated from starch) was extracted. Finally, the samples were diluted in 1000 µL deionized water, and the glucose-equivalent starch concentrations were determined by the anthrone reaction and an absorption reading at 620 nm (Multiskan GO, Thermo-Scientific, Waltham, MA, USA).

2.4. Mass-Balance Computations

To complete the hydraulic and mineral mass-balances during the period March–October 2019, 24 h of drainage (D) were collected weekly. Drainage was quantified and sampled for mineral analysis ([D]) by an automated photometric analyzer (N and P; Gallery152 Plus, Thermo-Scientific, Waltham, MA, USA) and atomic absorption (K; PinAAcle500, PerkinElmer, Waltham MA, USA). Then, the irrigation amounts (I) were updated to account for a 0.3 leaching fraction (LF; Equation (1)). Additionally, the actual evapotranspiration was computed (ET; Equation (2)), and the seasonal irrigation factor was determined (IF) by the potential evapotranspiration (ETp; Equation (3)). The mineral composition of the irrigation water, while predetermined by the experimental design, was verified monthly ([I]), and the mineral (N, P, or K) uptake (MU) was computed independently (Equation (4)). Finally, the fertigation efficiency (MUR) was calculated from the mineral uptake (ΔNPK) and availability (Equation (5)).
L F = D I
E T = I D
I F = E T E T P
M U = I · I D · D
M U R = M U I · I

2.5. Data Processing and Statistics

Data were processed in an open-source R (version 3.5.2) RStudio environment (version 1.1.463) with the plyr, reshape2, and lubridate packages. One-way ANOVA, two-way ANOVA, Tukey HSD, and Student t-tests were performed by the agricole package in RStudio (specific analyses are elaborated in the results). Data and statistical visualizations were produced by the ggplot2 and cowplot packages in RStudio.

3. Results

3.1. Seasonal Changes in Resource Uptake

We quantified drainage during the period March–October 2019 to characterize the temporal changes in the evapotranspiration (ET) of almond trees under various fertigation applications. ET of almond trees fertigated with 30 mg N L−1, 6 mg P L−1, or 60 mg K L−1 (reference concentrations) increased from 13 L tree−1 day−1 in March (bloom) to 157 L tree−1 day−1 by June (Figure 1A). Almond trees maintained >150 L tree−1 day−1 ET through July and August, then decreased the ET to 121 L tree−1 day−1 in September, and 71 L tree−1 day−1 in late October (senescence). Generally, higher fertigation concentrations (60 mg N L−1, 15 mg P L−1, or 150 mg K L−1) did not affect the seasonal ET of almond trees. Individually, a higher N concentration (60 mg N L−1) did not change the ET of almond trees at any time during the growing season. We did not consider fertigation more concentrated than 60 mg N L−1 (a ~600 Kg N hectare−1 which is double the current recommendations) at this point, because we previously found that 100 mg N L−1 is excessive and suppresses almond trees’ development [4]. Higher P (15 mg P L−1) marginally decreased (Student t-test, p < 0.05) ET to 104 L tree−1 day−1 in May. Higher K fertigation (150 mg K L−1) increased (Student t-test, p < 0.05) ET to 196 L tree−1 day−1 by July, and maintained 175 and 136 L tree−1 day−1 ET rates in August and September, respectively.
To deduce the seasonal changes in the mineral uptake (MU) of the almond trees, we analyzed the irrigation and drainage mineral composition monthly between June and October 2019. We computed the cumulative seasonal uptake presuming that the daily uptake was constant throughout each month. The MU of almond trees fertigated with reference concentrations (30 mg N L−1, 6 mg P L−1, or 60 mg K L−1) increased linearly from 276 g N tree−1, 62 g P tree−1, and 380 g K tree−1 in July to 879 g N tree−1, 150 g P tree−1 and 1105 g K tree−1 by October (Figure 1B), respectively. A higher N fertigation (60 mg N L−1) increased the N uptake by ~80% to 492 g N tree−1 in July and 1402 g N tree−1 in October. Higher P fertigation (15 mg P L−1) increased the P uptake by 67% to 102 g P tree−1 in July, and by 150% to 353 g P tree−1 by October. Higher K fertigation (150 mg K L−1) increased the K uptake by 155% to 950 g K tree−1 in July, and 2787 g K tree−1 by October.

3.2. Phenology and Fertigation Effects

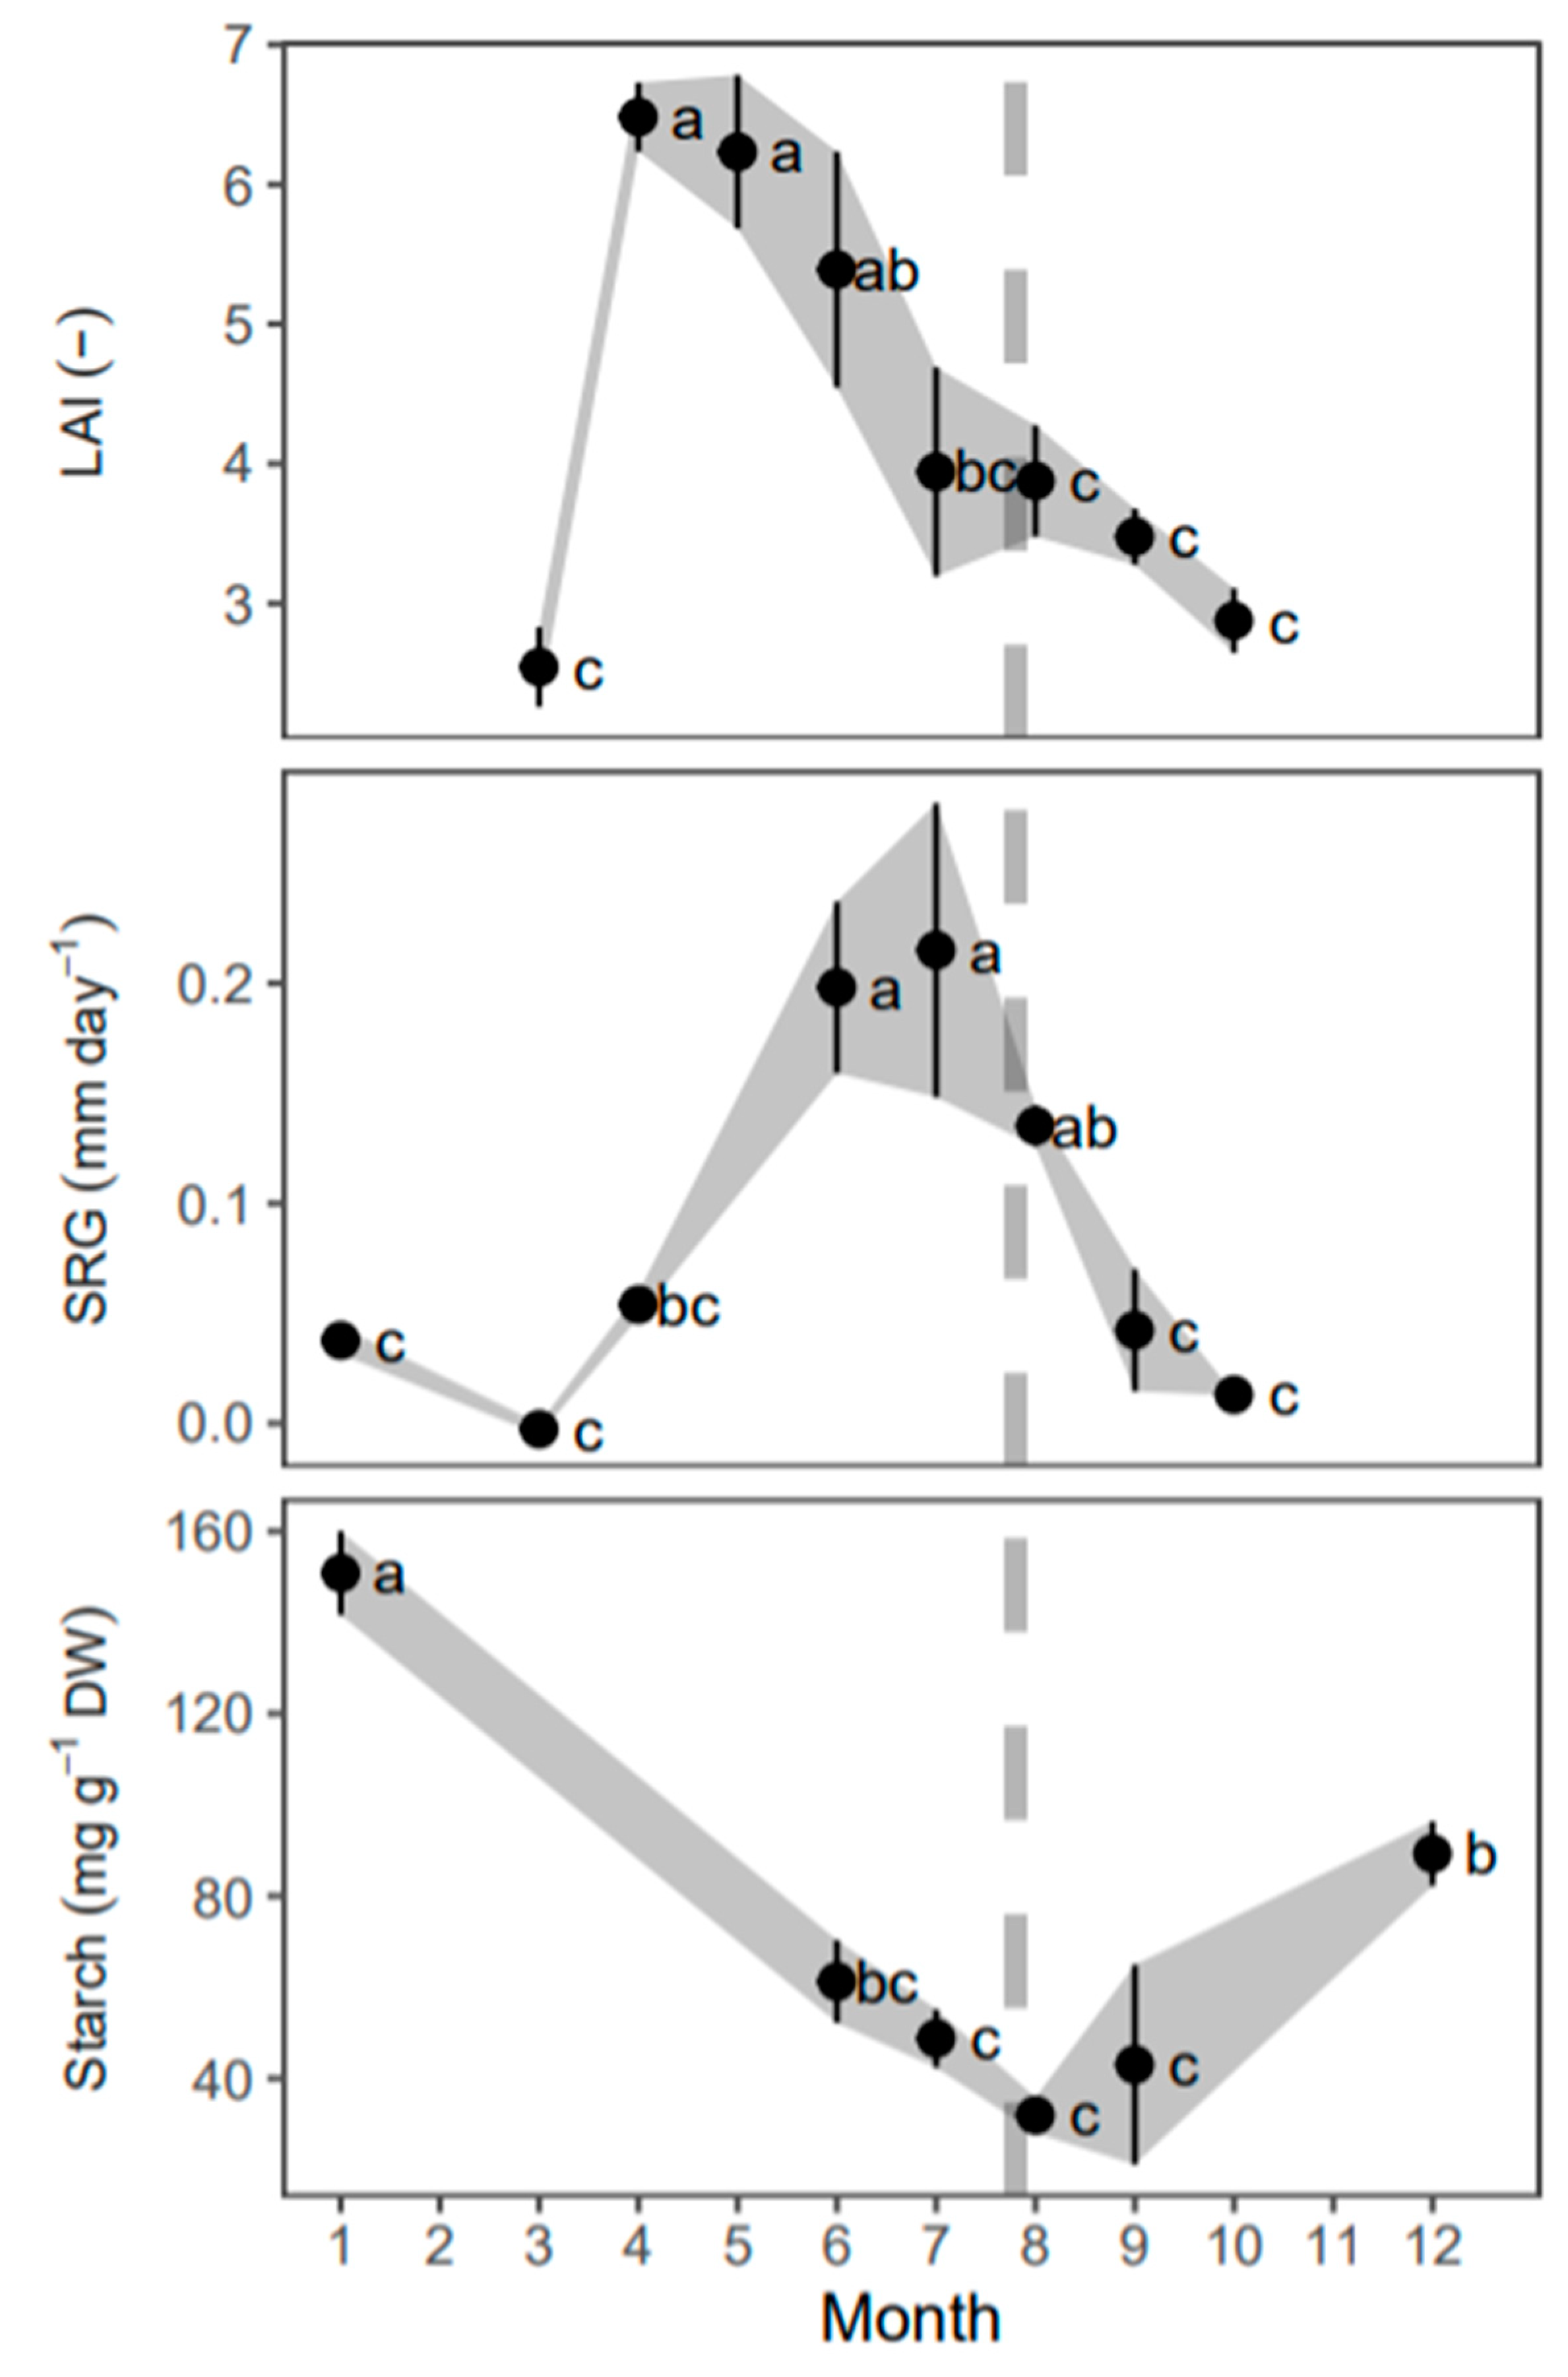
We tracked the canopy cover and stem growth in almond trees fertigated with 30 mg N L−1, 10 mg P L−1, and 60 mg K L−1 throughout 2019 to time the developmental phenological stage within the growing season. These almond trees increased their leaf area index (LAI) from 2.5 in March (post-bloom) to 6.5 by April (Figure 2). Throughout May and June, almond trees maintained an >5 LAI, henceforth referred to as the growth stage. Then, the almond trees reduced their LAI to 3.9 by fruit ripening in late July, gradually lowering it to 2.9 by October. Concurrently, almond trees increased their stem radial growth rate (SRG) from 0 in March to 0.2 mm day−1 by June and July. In August, the SRG decreased to 0.13 mm day−1, and by September, it dropped to 0.04 mm day−1, before zeroing in October. To determine the phenology stage of resource accumulation for dormancy, we measured the starch concentrations in the roots of almond trees in January and throughout the growing season. Root starch reserves decreased from 151 mg g−1 DW in January 2019 (dormancy) to 61 mg g−1 DW in May, and reached a minimum of 32 mg g−1 DW in August. Then, the starch in roots increased to 43 mg g−1 DW in September and surged back to 89 mg g−1 DW by December, associating this stage with storage.
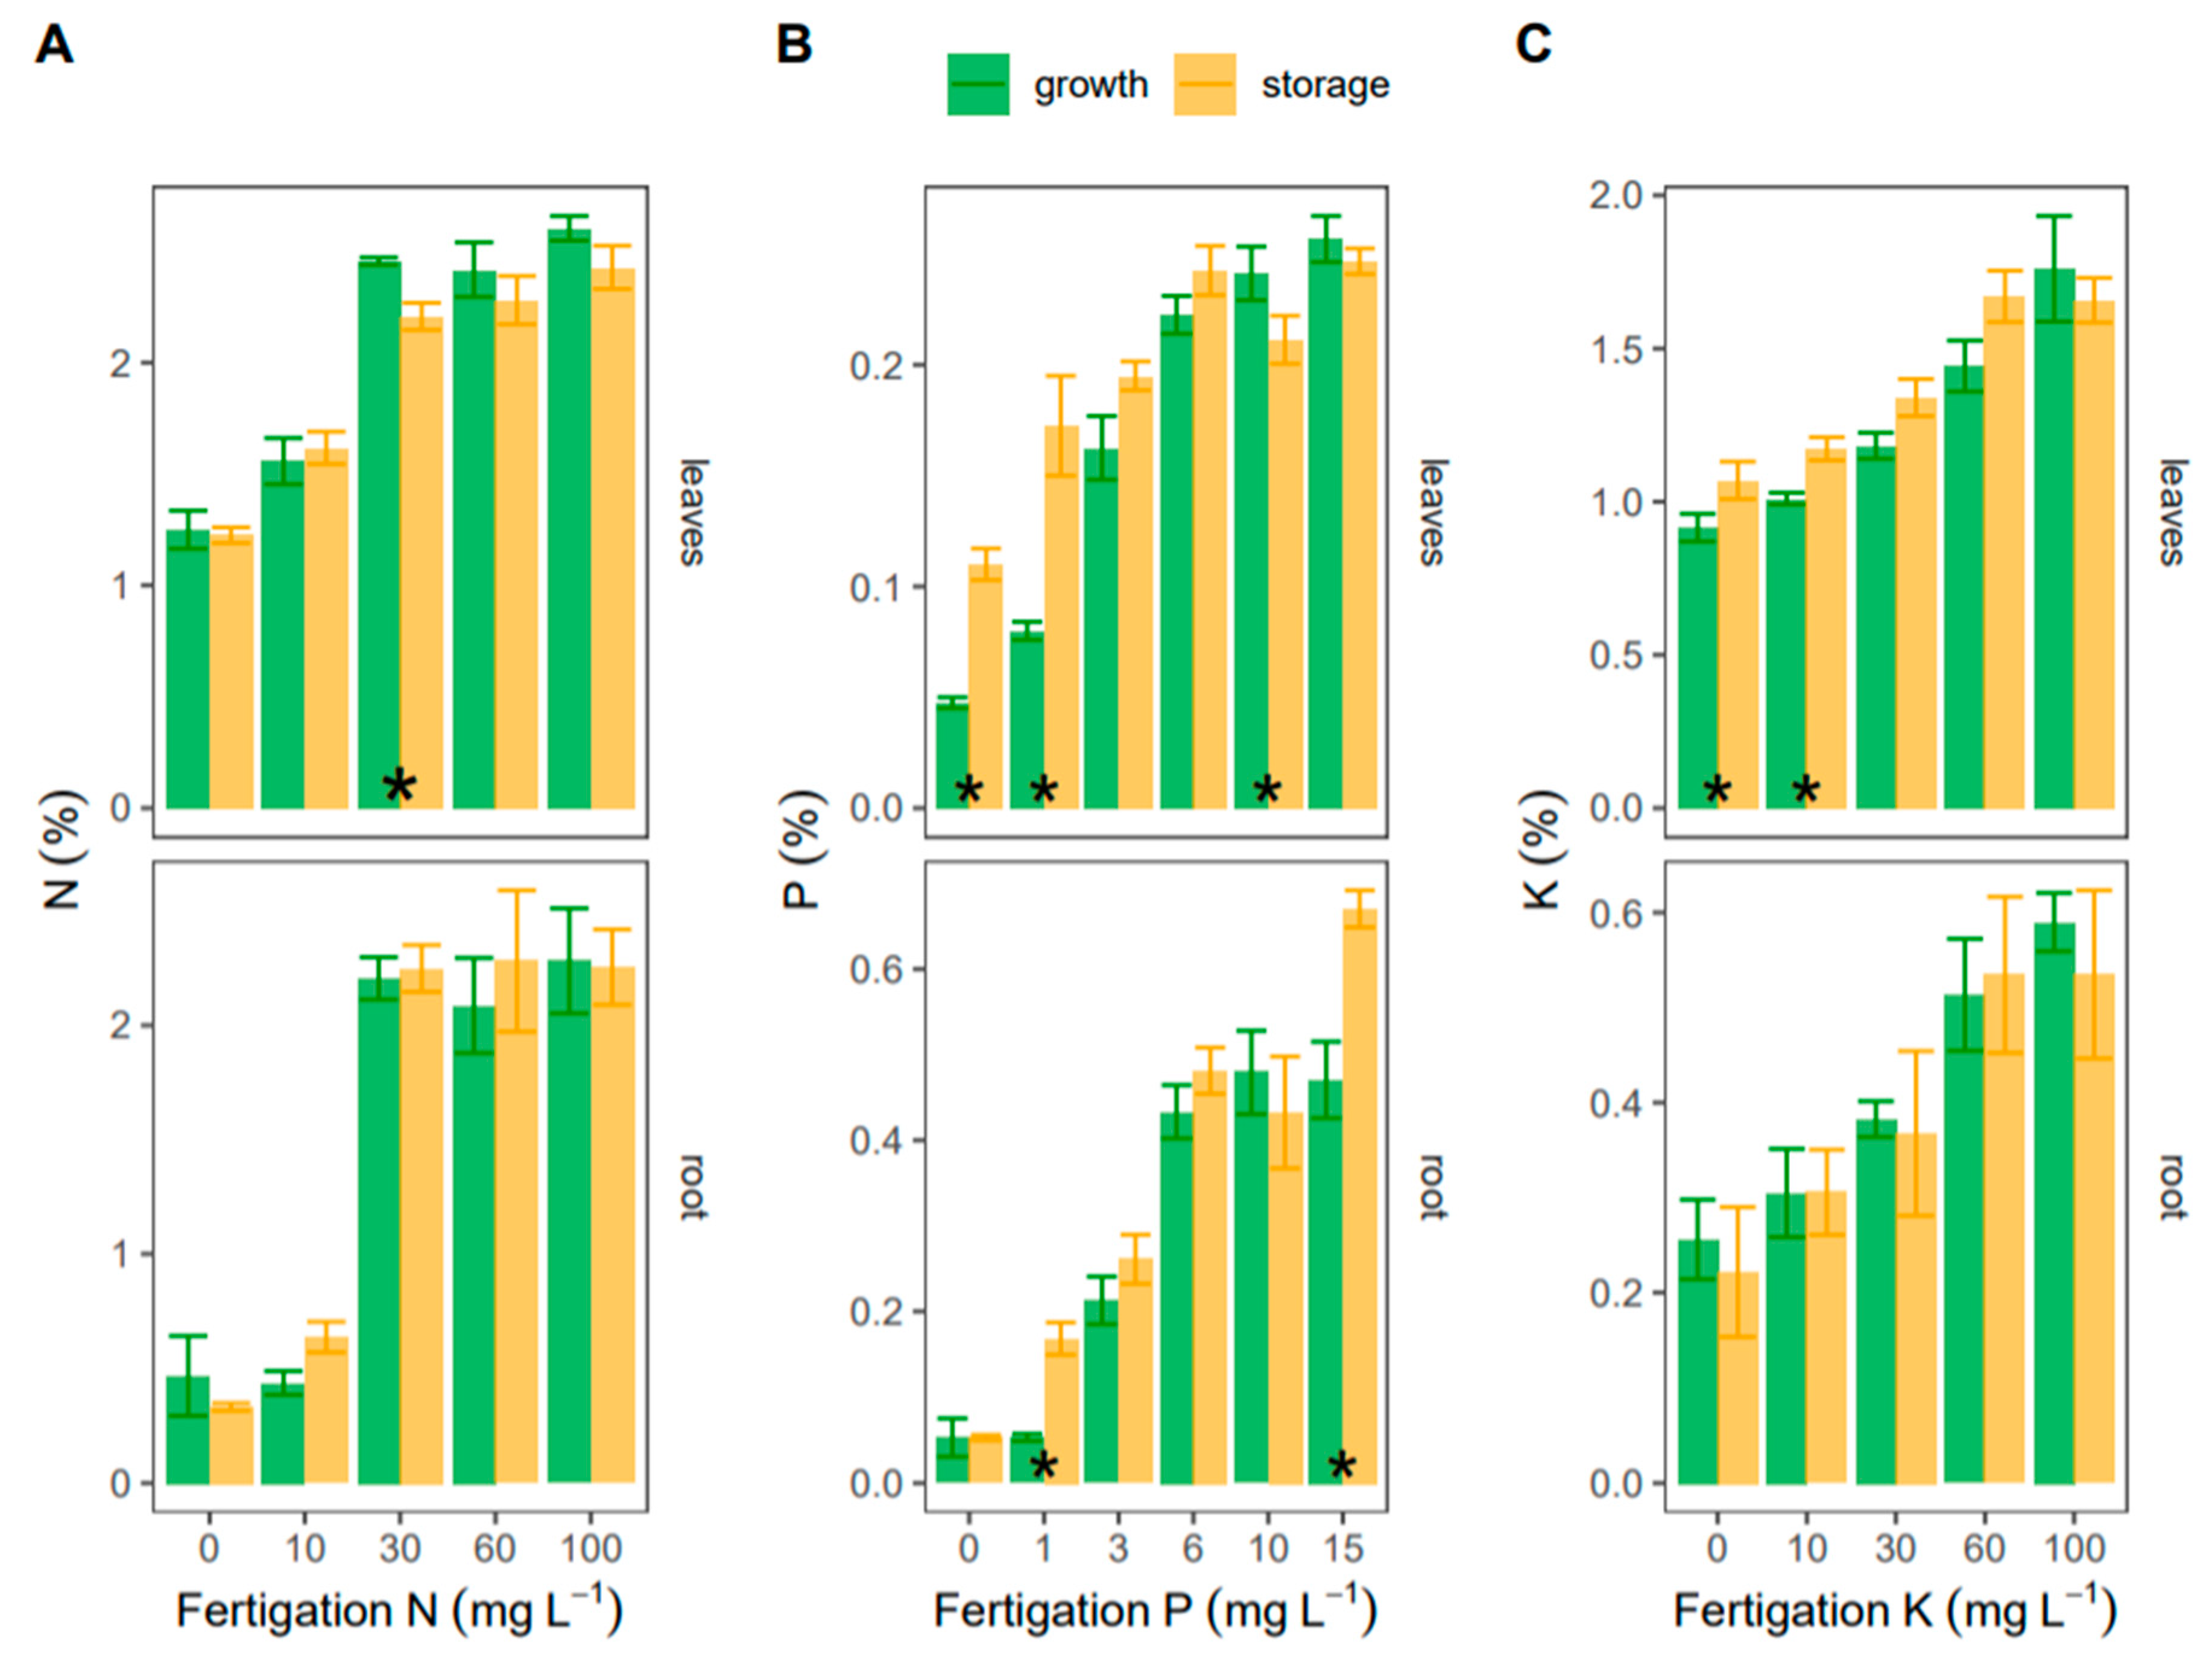
To evaluate whether almond trees change their mineral composition between the growth and storage phenological stages, we measured the mineral concentrations in their leaves and roots. Almond leaves’ N concentrations increased from 1.2% in a 2 mg N L−1 fertigation to 2.5% in the 30, 60, or 100 mg N L−1 concentrations, in both the growth and storage phenological stages (Figure 3A). N concentrations in roots were 0.5% at the 2 and 10 mg N L−1 concentrations, and 2.1% in the 30, 60, and 100 mg N L−1 concentrations, independent of phenology. Leaves’ P concentrations increased from 0.05% at 0 mg P L−1 fertigation to 0.26% at 15 mg P L−1 in the growth stage. In the storage stage, the 0 and 1 mg P L−1 fertigated almond trees increased their leaves P concentrations by 120% to 0.11% and 0.17%, respectively. In high P concentrations, the almond leaves did not accumulate more P during the storage stage, and in 10 mg P L−1, they had 10% higher P during the growth stage. Almond roots increased P concentrations from 0.02% in 0 and 1 mg P L−1 fertigation, to 0.2% in 3 mg P L−1, 0.42% in 6, 10, and 15 mg P L−1 during the growing phenological stage, respectively. During storage (September 2019), the roots’ P increased by 300% to 0.18 in 1 mg P L−1 fertigation, and by 30% to 0.65% in 15 mg P L−1 (Figure 3B). K concentrations in almond leaves increased from 0.9% in 2 mg K L−1 fertigation to 1.8% in 100 mg K L−1 during the growth stage (Figure 3C). At 2 mg K L−1, the almond leaves had 20% higher K concentrations (1.1%), and at 10 mg K L−1, they had 15% higher concentrations (1.2%) than in the growth stage. K concentrations in roots increased from 0.25% at 2 mg K L−1 fertigation, to 0.59% at 100 mg K L−1, independent of phenology.

3.3. Seasonal Changes in Fertigation Efficiency

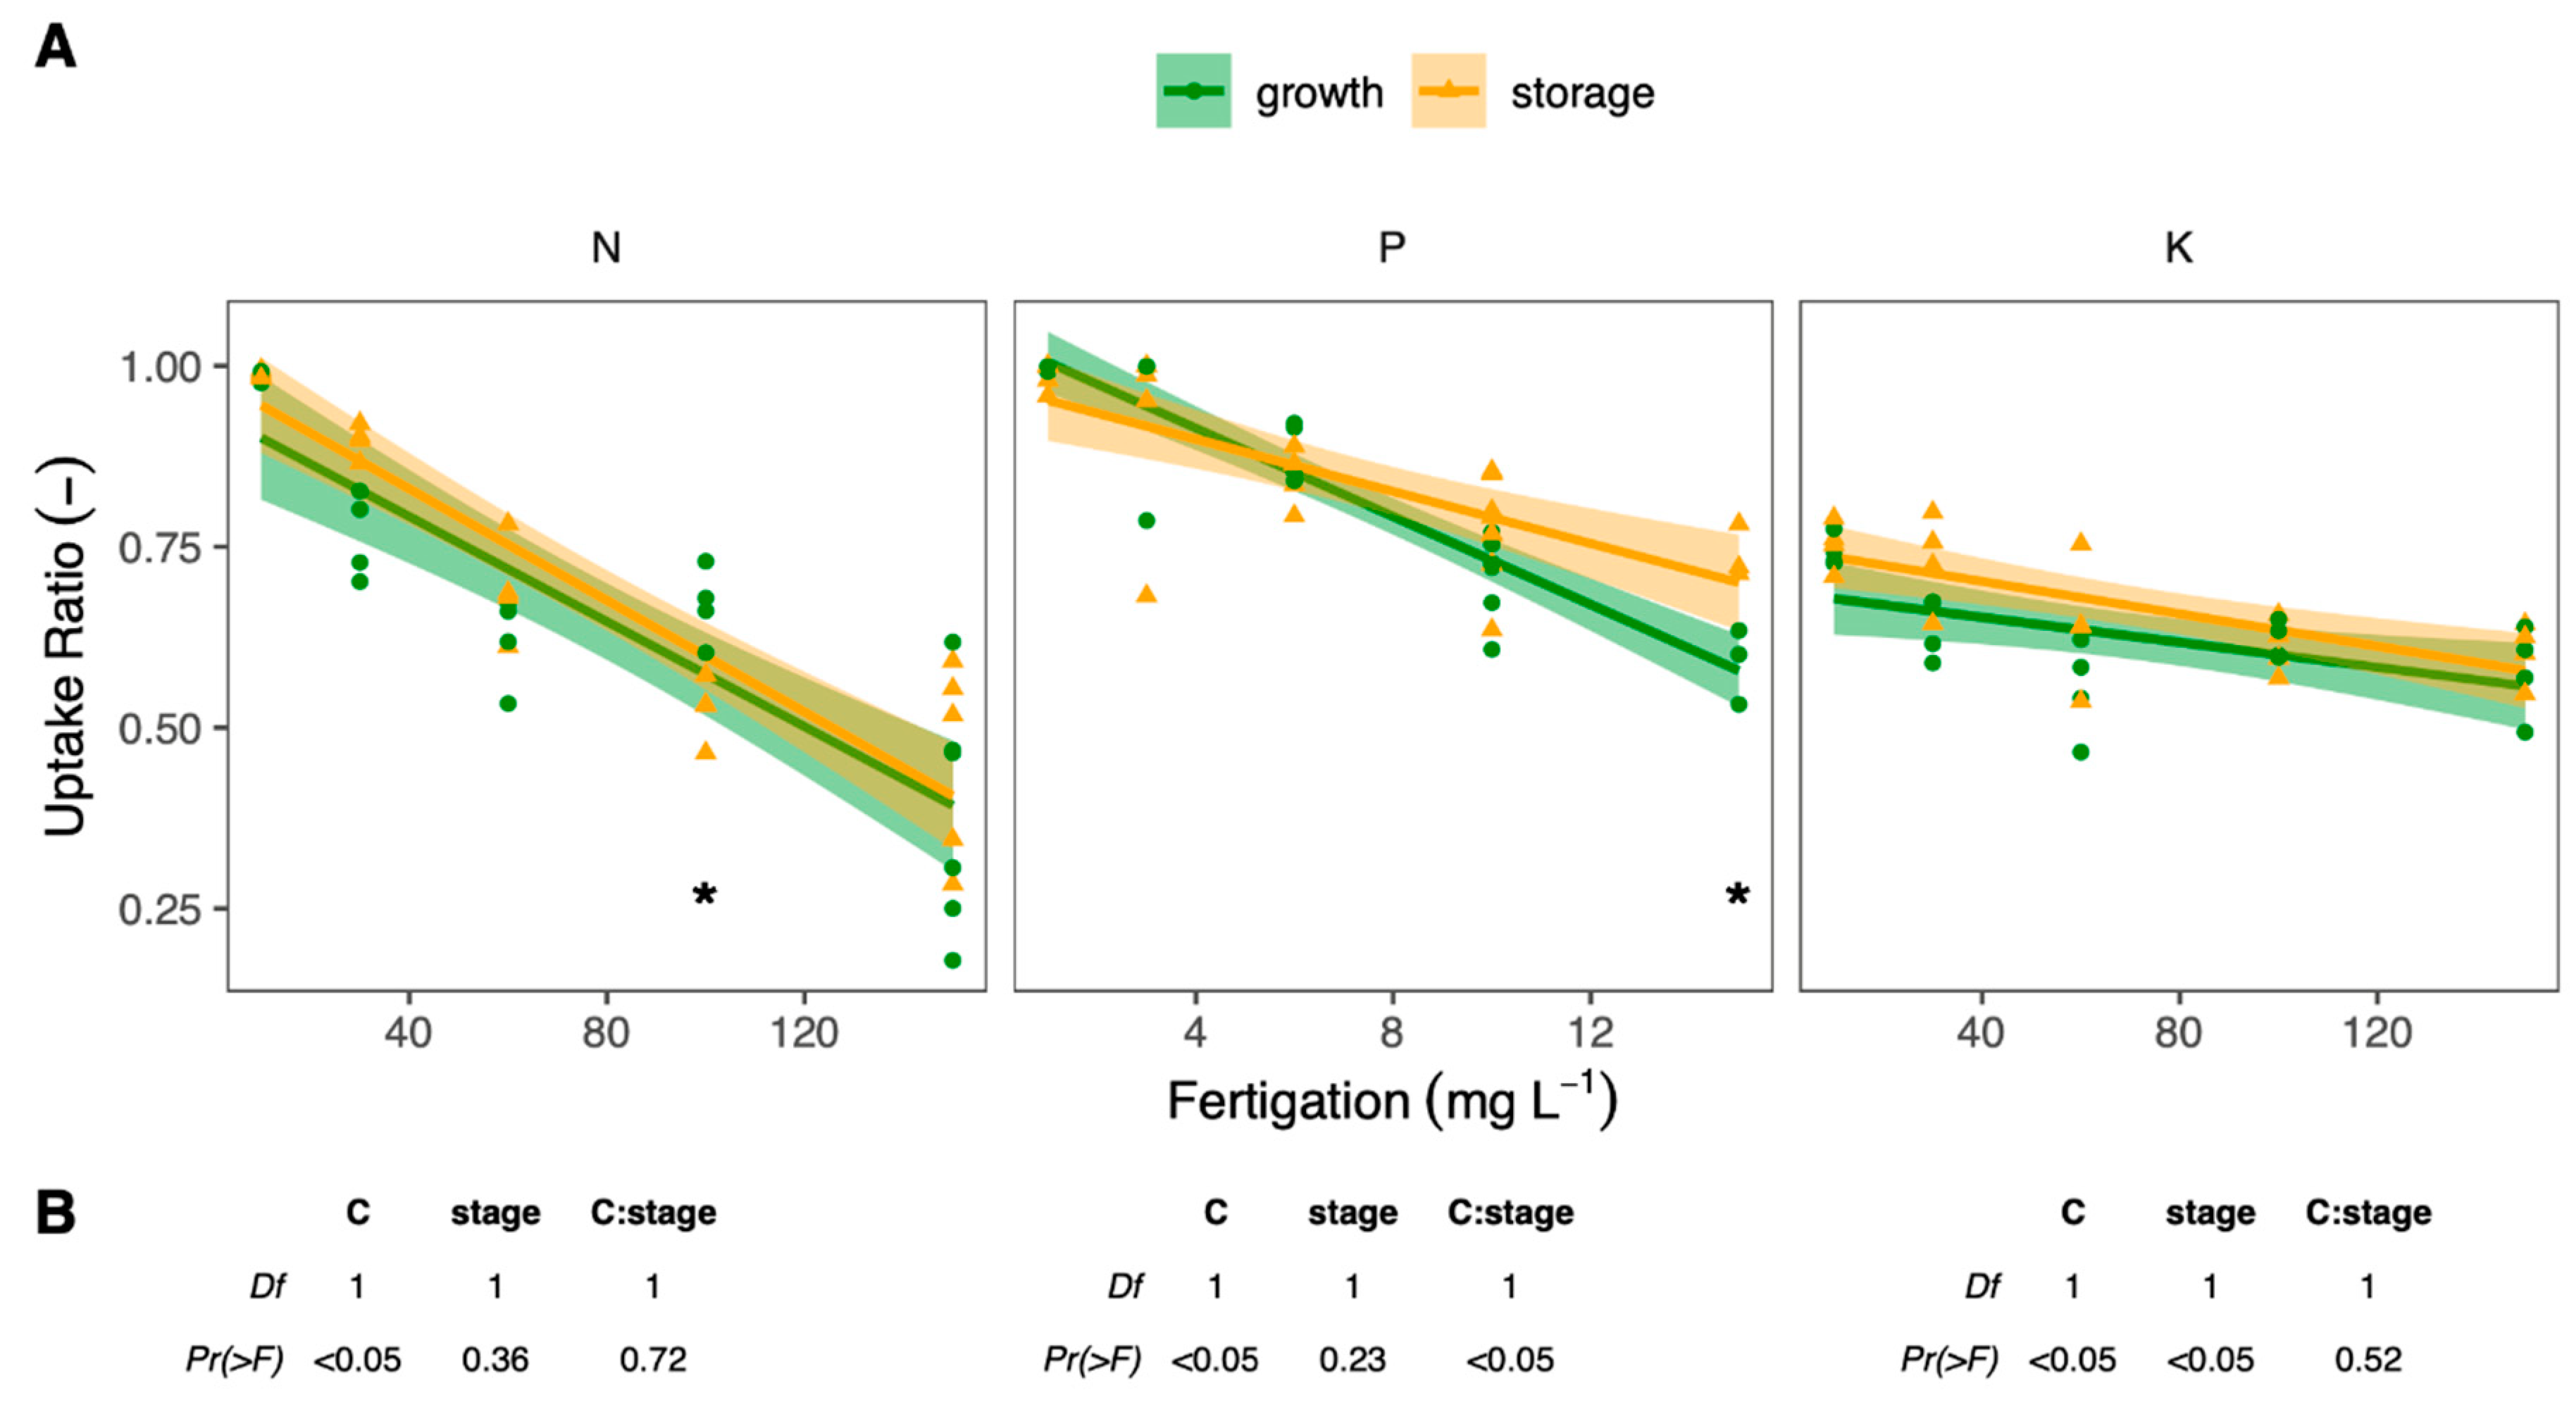
To evaluate the potential of efficient mineral applications, we compared the mineral concentration in irrigation to the mineral uptake ratio (MUR; Equation (5)) of almond trees. N MUR declined linearly from 0.98 at 2 g N L−1 fertigation to 0.41 at 150 mg N L−1, independent of the phenological stage (Figure 4A). P MUR also declined linearly from 0.99 at 0 mg P L−1 to 0.59 at 15 mg P L−1. Phenology did not affect P MUR, but it did change its correlation to fertigation P concentration (Figure 4B), rendering it 20% higher (0.74) at 15 mg P L−1 during the phenological storage stage (p < 0.05). The reverse linear correlation was repeated for K MUR, but moderately, reducing from 0.74 in 2 mg K L−1 to 0.58 in 150 mg K L−1 during the growth stage (Figure 4C). K MUR responded similarly to fertigation K concentration in the phenological storage stage, yet it was 14% higher, predominantly at the 10 and 30 mg K L−1 concentrations.
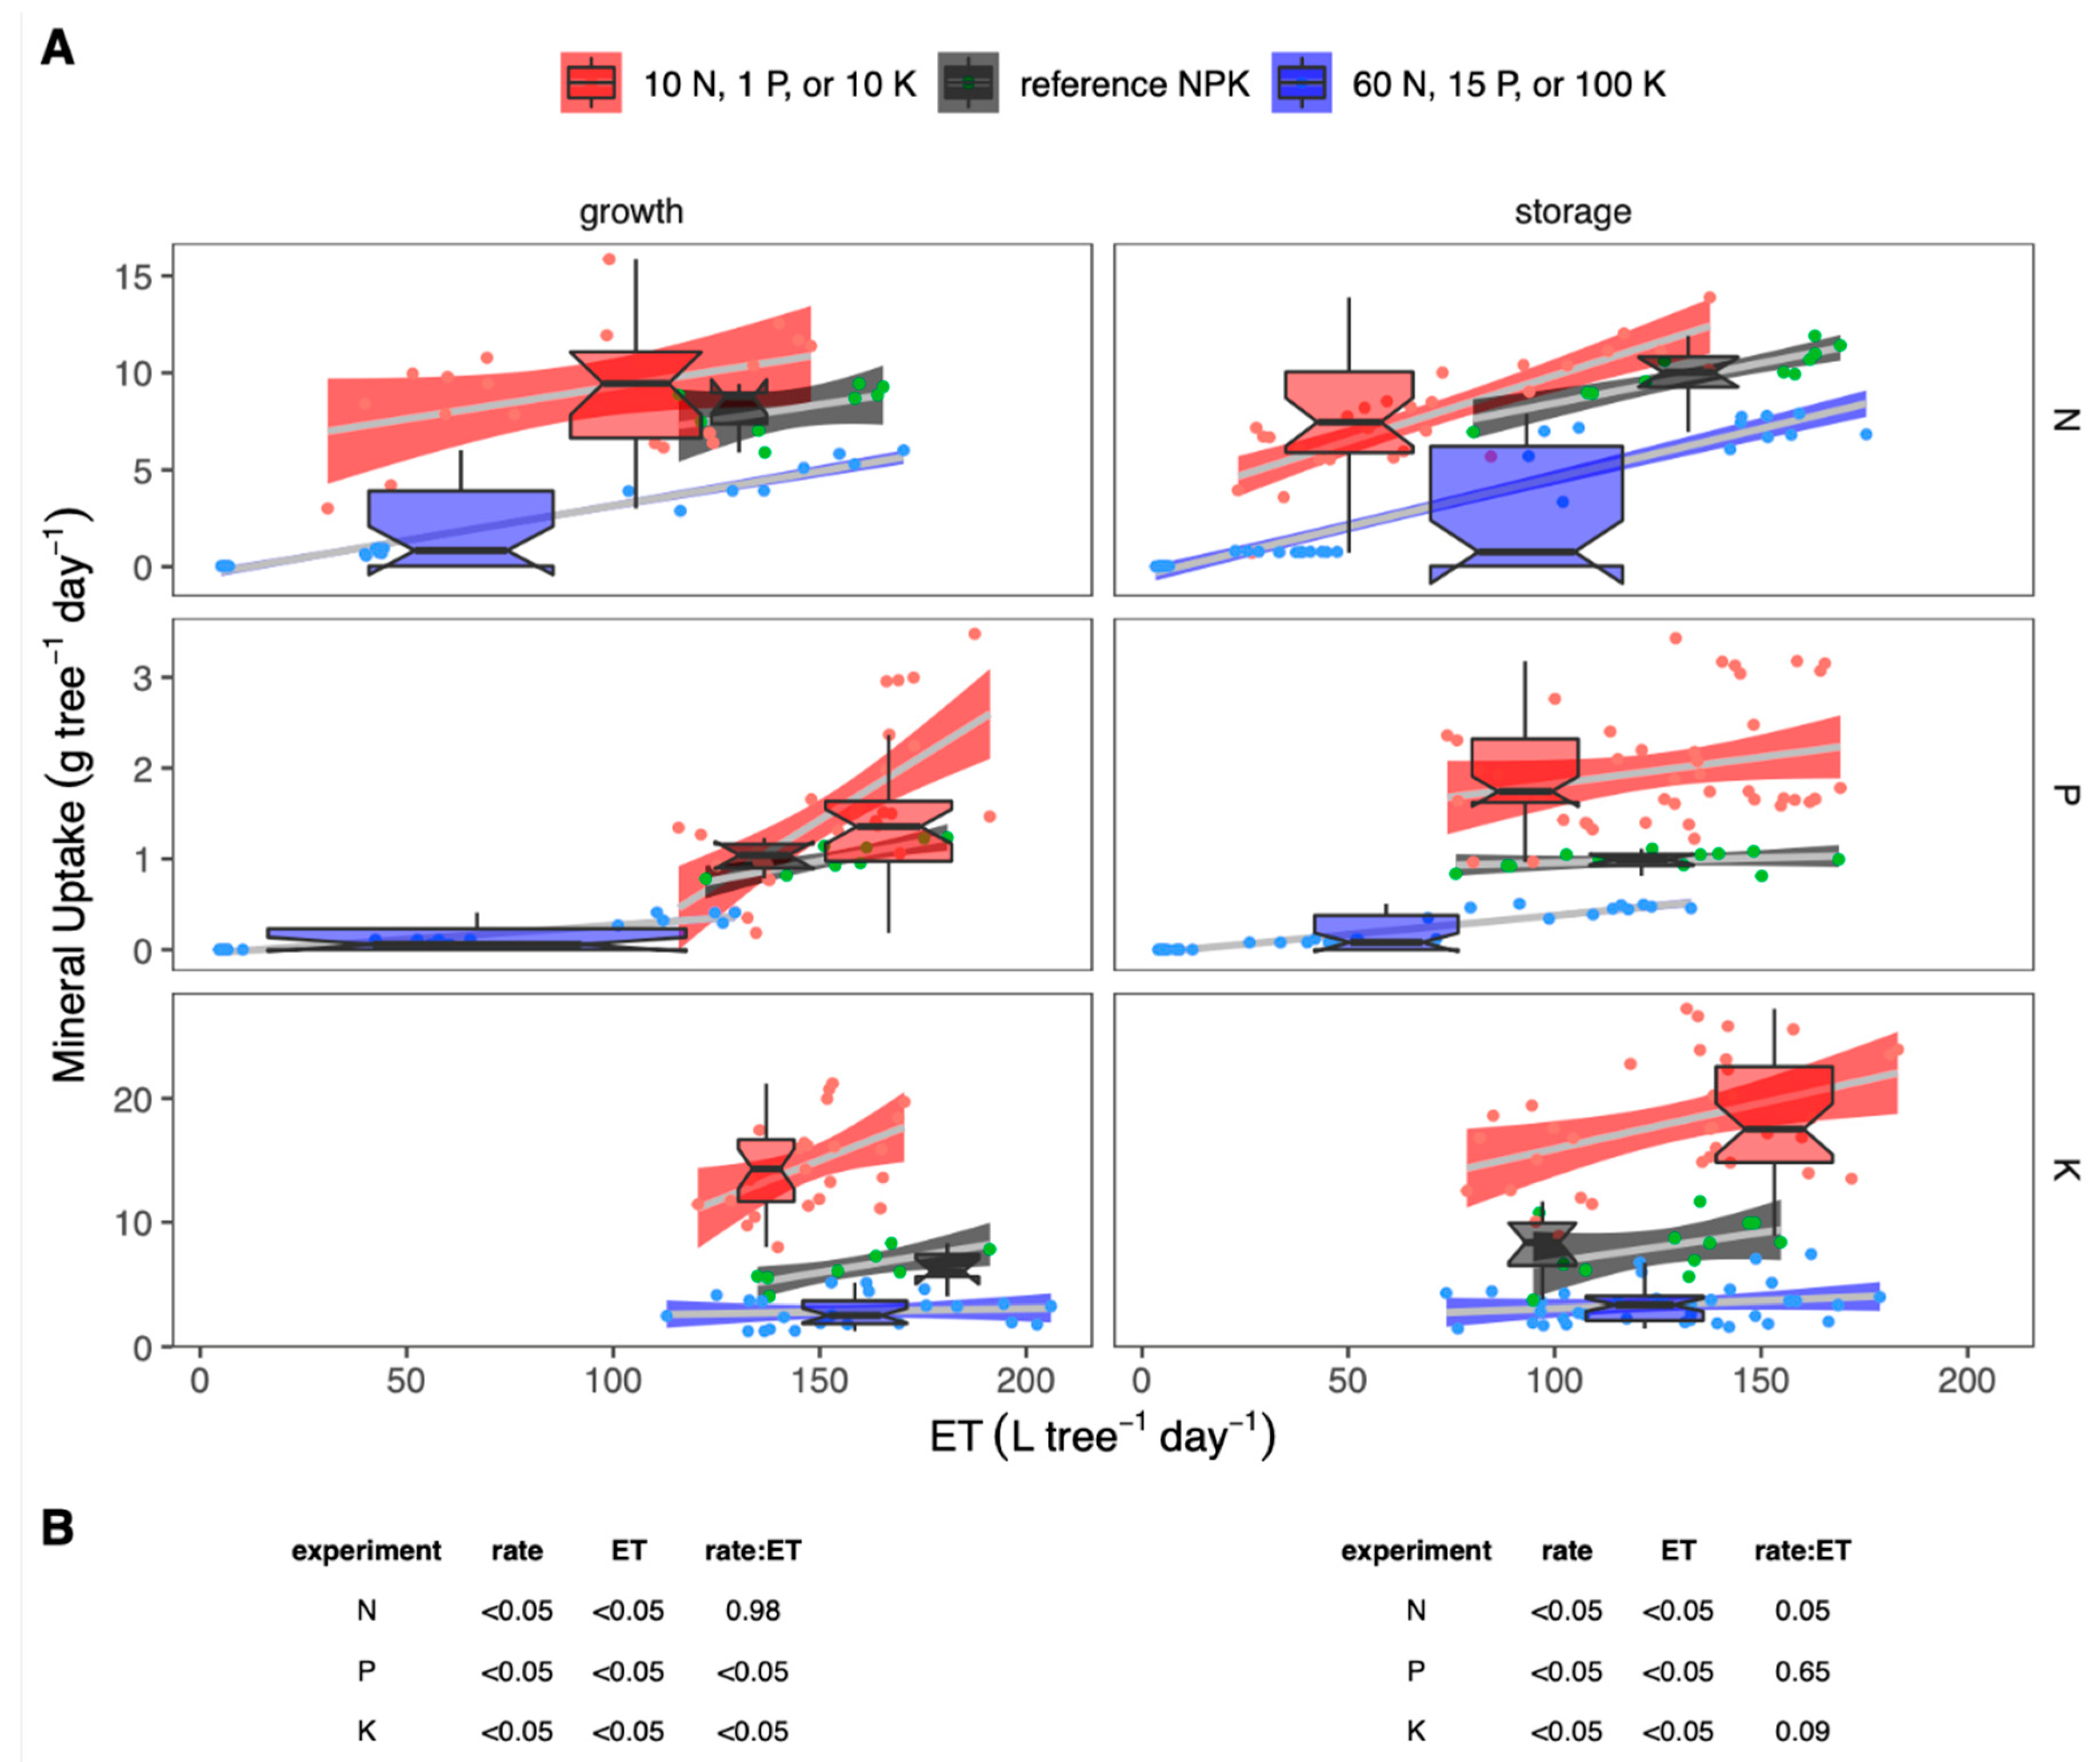
Finally, to determine the transpiration’s effect on mineral uptake by almond trees, we compared daily ET and MU independently in the growth and storage phenological stages. Almond trees fertigated with 30 mg N L−1 (reference) transpired 100–180 L tree−1 day−1, lower N (10 mg L−1) almond trees transpired between 5 and 150 L tree−1 day−1, and higher N fertigated (60 mg L−1) transpired 40–160 L tree−1 day−1, in both the growth and storage phenology stages (Figure 5). N uptake linearly correlated to ET in all the concentrations, ranging between 0 and 5 g tree−1 day−1 in low N, 6–8 mg tree−1 day−1 in regular N, and 5–11 in 60 mg N L−1 fertigation. Fertigation concentration affected the regression between ET and N uptake only during the growth stage. Reference (6 mg P L−1) and higher (15 mg P L−1) trees transpired between 100 and 190 L tree−1 day−1, while 1 mg P L−1 trees transpired between 0 and 145 L tree−1 day−1 at both the growth and storage phenology stages. P uptake had a strong linear response to ET during the growth stage, ranging 0.5–1.1 g P tree−1 day−1 in reference P, 0–1 g P tree−1 day−1 in lower P, and 0.5–3 g P tree−1 day−1 in higher P concentrations. During the storage stage, fertigation P mainly affected the P uptake rather than ET, ranging 0.9–1 g P tree−1 day−1 in reference P, 0–0.5 g P tree−1 day−1 in lower P, and 1.3–1.8 g P tree−1 day−1 in higher P concentrations. During the growth stage, almond trees ET ranged 110–210, 140–190, and 120–160 L tree−1 day−1 in 10 mg K L−1, reference (60 mg K L−1), or 100 mg K L−1, respectively. Then, ET ranged 70–170, 100–150, and 80–180 L tree−1 day−1 in 10 mg K L−1, 60 mg K L−1, or 100 mg K L−1, respectively, during the storage stage. In 10 and 60 mg K L−1, K uptake was linearly correlated to ET, ranging 0.5–1 g K tree−1 day−1, and 3–6 g K tree−1 day−1, respectively, during the growth and storage stages. In 100 mg K L−1, K uptake ranged 10–20 g K tree−1 day−1 during growth, and 10–23 g K tree−1 day−1, while the high K uptake was more frequent during the phenological storage stage.

4. Discussion and Conclusions

In this study, we supported our notion that nutrient uptake varies during the growing season and that precise mineral application needs to account for phenological shifts. To that end, we characterized the seasonal nutrient uptake of Prunus dulcis (almond trees) by an advanced mineral mass-balance approach. We used lysimeters to study fertilization by characterizing the mineral composition of the irrigation and drainage. Then, we determined the interactions between evapotranspiration and mineral uptake across the phenological shift from vegetative development to metabolic conservation in almond trees.
Mass-balances are a sound and direct approach to characterize mineral uptake and discharge in crop systems. Growing mature almond trees in large containers, and periodically collecting their drainage for mineral analyses, produced a series of mineral mass-balance records. The initial output of this application is the seasonal changes in ET under a regular fertigation composition, and under high concentrations of N, P, or K. Neither high concentrations of N or P exhibited the potential to increase the ET of almond trees throughout summer. It could be that these trees were at their optimal nutritional status (this was the rationale of the regular fertigation treatment) and that an additional mineral application cannot benefit any physiological activity. Higher mineral concentrations could even carry adverse osmotic or toxic effects that would inhibit productivity [11], ultimately risking the trees’ physiological integrity [4]. Alternatively, higher mineral concentrations could support physiological activities that are not directly related to ET, as nucleic protein expression in the case of N, or carbohydrate phosphorylation for P [12]. Such conditions would show later, perhaps through abiotic resilience in stress [31], or a predisposition for reproduction in the following year [32]. Nevertheless, a high K availability did induce ET by ~30% in the second part of the growing season. This implies that the K contribution is critical to physiological processes that occur in late summer after the vegetative stage is concluded [33]. The second output of the irrigation and drainage collections was a mineral mass-balance. In this case, high concentrations of either N, P, or K dramatically increased each mineral’s uptake. The capacity to extract more N seemed limited, though, as it increased by a mere 50% while its concentrations in fertigation doubled. The N soluble formation could explain the N uptake limitations [34]. However, it is unlikely in this research case, where 90% of the total N was delivered as NO3. Probably, the energetic costs of N uptake and nitrification [12], or the possible hazards of N toxicity [35], constrained the N uptake. A concentrated mineral application (150% of the reference concentrations) tripled the P and K uptake by the end of the growing season, mainly due to amplified P and K uptake in August through October. Possibly, the mechanisms that require high P or K are more dominant in the second part of the growing season, after the primary vegetative and reproductive growth concluded. Otherwise, the past year’s P and K storages could still be sufficient at this time. Alternatively, the P and K uptake could be inhibited at the beginning of the growing season by a stronger affinity to N assimilation in new growth. However, interpreting these findings in a physiological context calls for a temporal study of resource allocation in plants.
A phenological shift from resource utilization for growth to metabolic conservation, alters mineral uptake by trees. Almond trees dedicate spring and early summer (March to June) to obtain a maximal canopy cover and peak growth rates. Such behavior could be characteristic of perennial species from colder semi-arid environments where water, sunshine, and moderate temperatures are primarily available in early summer [36]. Winter in these environments is typically cold and windy, probably favoring deciduous tree species. Summer is hot and dry, possibly forcing many of these species to bloom early and yield by mid-summer. By the time almond trees yield in late July, many leaves senesce and canopy cover reduces by 60%. There was no stress involved, and presumably, this early-season senescence is a natural condition of an aging canopy. Importantly, almond trees did not limit ET at this time, implying that the leaves that senesced were older and nonproductive, or from the shaded lower canopy. The decrease in stem growth shifted by a month, to 30% by August, and 90% by September, which implies that the limitations for growth were not environmental but phenological. Moreover, as the sinks for carbohydrates curtailed, the roots of almond trees began to accumulate starch, probably to support metabolism in winter and bloom in spring [37]. Hence, there is a blunt phenological shift in August from vegetative and reproductive growth, to metabolic conservation to support the buds that set [38]. Such a transition could determine the mineral uptake, allocation, and composition of trees [39]. N concentrations in the roots or leaves of almond trees did not change, though, which is reasonable considering that N mainly constitutes organic biomolecules [12]. Almond trees did change N concentrations in leaves and root at N deficiency, which implies that tissues inherently shifted their biochemical composition to biomolecules that do not require N (e.g., structural cellulose or soluble sugars) [4] or translocated N to support critical biological processes [40]. P concentrations can change between the growth and storage stages, as almond trees’ leaves and roots accumulate P as esters in a carbon chain, or as nucleic acids in structural elements. Interestingly, high P concentrations can occur in P deficiency, as growth pauses and photosynthates have no utility, or in high P conditions when it accumulates as inorganic phosphate [41]. K concentrations increased in the storage stage, yet only in leaves and at low K conditions, which may imply that there are fewer K sinks, as new chlorophyll, in late summer. Notably, at this time, root development tends to accelerate [42], and almond roots have significantly less K than the leaves, which raises the question of which are the K sinks. Conclusively, the effectiveness of mineral applications varies by mineral. Almond trees extract N on application according to ET rates, and N effectiveness declines dramatically at high irrigation concentrations. P uptake, which is associated with carbohydrate metabolism, depends on ET in the growth stage. Then, when trees recharge their carbohydrates storages in late summer, P uptake intensifies, independent of ET. Finally, K uptake is highly effective in a wide range of irrigation concentrations, maintaining an uptake ratio of 0.6 to 0.8 at nearly any ET, and elevating by 10% in late summer.
Recommendations for almond fertigation can account for changes in mineral uptake capacity. Farmers can adequately suffice the mineral uptake capacity of trees through mineral application in irrigation. For that matter, a constant N application throughout the growing season will do. Nevertheless, constraining N fertilization to spring and early-summer could better support the trees’ phenological requirements because N is associated with vegetative growth [43]. Almond trees extracted more P (350 g tree−1 year−1, which is ~200 P2O5 kg hectare−1) than most current field recommendations, especially in July–October. This does not imply that existing almond plantations are P deficient, as many farm soils initially contain P [44], as do low-quality irrigation water [45] (be it effluents or reservoirs exposed to runoffs) and composts [46]. However, it is essential to reassess P applications in cultivated soils (possibly depleted of minerals), or in farms where the source to nutrients is limited to soluble minerals. Almond trees can also extract up to ~900 kg K2O hectare−1, and K uptake is most effective after the harvest (August through September), which corresponds to current fertilization recommendations for California almond growers [47]. While this study lays the empirical foundations for precise mineral applications, translating these realizations to field applications is not straightforward. Trees will not experience the exact mineral composition of the irrigation. Mainly, soil properties such as chemical composition, acidity, hydraulic or electric conductance, and biological conditions buffer and alter the soil solution [12]. Fungi and microbes could transform N between NH4+ and NO3 [48], practically determining its nutrition benefits or toxicity. Then, soils can absorb or release P and K, introducing spatial and temporal irregularity to the mineral concentrations in the soil solution [48]. Climate also affects mineral availability, as precipitation washes nutrients away from the root zone, while heat and cold reduce nitrification by microbial communities [49]. Hence, this study calls for subsequent field-work to link between the irrigation’s mineral composition and the mineral availability to trees in various soils and environmental conditions.

Author Contributions

Conceptualization, O.S. and U.Y.; data curation, O.S.; formal analysis, O.S.; funding acquisition, O.S. and U.Y.; investigation, O.S. and R.K.; methodology, O.S., R.K. and U.Y.; project administration, R.K.; resources, O.S. and U.Y.; supervision, O.S.; validation, O.S. and U.Y.; visualization, O.S.; writing—original draft, O.S.; writing—review and editing, O.S., R.K. and U.Y. All authors have read and agreed to the published version of the manuscript.

Funding

This research received external funding from the Israeli Almond Research Board, the Israeli Ministry of Agriculture, and the Center for Fertilization and Plant Nutrition (CFPN).

Acknowledgments

We thank Kristina Tavrizov for managing the experimental facility, and Ina Finegold for supervising the laboratory analyses.

Conflicts of Interest

The authors declare no conflict of interest.

References

  1. Melillo, E.D. The First Green Revolution: Debt Peonage and the Making of the Nitrogen Fertilizer Trade, 1840–1930. Am. Hist. Rev. 2012, 117, 1028–1060. [Google Scholar] [CrossRef]
  2. Stefanelli, D.; Goodwin, I.; Jones, R. Minimal nitrogen and water use in horticulture: Effects on quality and content of selected nutrients. Food Res. Int. 2010, 43, 1833–1843. [Google Scholar] [CrossRef]
  3. Loop, T. The Facts about Nutrient Pollution; Environmental Protecting Agency (EPA): Washington, DC, USA, 2012. [Google Scholar]
  4. Sperling, O.; K, R.; Erel, R.; Yasuor, H.; Klipcan, L.; Yermiyahu, U.; Karuanakaran, R. Excessive nitrogen impairs hydraulics, limits photosynthesis, and alters the metabolic composition of almond trees. Plant Physiol. Biochem. 2019, 143, 265–274. [Google Scholar] [CrossRef] [PubMed]
  5. Siebrecht, S.; Herdel, K.; Schurr, U.; Tischner, R. Nutrient translocation in the xylem of poplar—Diurnal variations and spatial distribution along the shoot axis. Planta 2003, 217, 783–793. [Google Scholar] [CrossRef]
  6. Le Bot, J.; Kirkby, E.A. Diurnal uptake of nitrate and potassium during the vegetative growth of tomato plants. J. Plant Nutr. 1992, 15, 247–264. [Google Scholar] [CrossRef]
  7. Muhammad, S.; Sanden, B.L.; Lampinen, B.D.; Saa, S.; Siddiqui, M.I.; Smart, D.R.; Olivos, A.; Shackel, K.A.; DeJong, T.; Brown, P.H. Seasonal changes in nutrient content and concentrations in a mature deciduous tree species: Studies in almond (Prunus dulcis (Mill.) D. A. Webb). Eur. J. Agron. 2015, 65, 52–68. [Google Scholar] [CrossRef]
  8. Geraldson, C.M.; Tyler, K.B. Plant Analysis as an Aid in Fertilizing Vegetable Crops. In Soil Testing and Plant Analysis; John Wiley & Sons, Ltd.: Hoboken, NJ, USA, 2018; pp. 549–562. [Google Scholar] [CrossRef]
  9. Sabbe, W.E.; Zelinski, L.J.; Westerman, R. Plant Analysis as an Aid in Fertilizing Cotton. In Soil Testing and Plant Analysis; John Wiley & Sons, Ltd.: Hoboken, NJ, USA, 2018; pp. 469–493. [Google Scholar] [CrossRef]
  10. Heerema, R.J.; Weinbaum, S.A.; Lampinen, B.D.; DeJong, T.M. Is nitrogen stress more apparent in shaded, fruiting almond spurs than in exposed, non-fruiting spurs? J. Hortic. Sci. Biotechnol. 2009, 84, 355–359. [Google Scholar] [CrossRef]
  11. Hermans, C.; Hammond, J.P.; White, P.J.; Verbruggen, N. How do plants respond to nutrient shortage by biomass allocation? Trends Plant Sci. 2006, 11, 610–617. [Google Scholar] [CrossRef]
  12. Marschner, H. Mineral Nutrition of Higher Plants; Academic Press: Cambridge, MA, USA, 2011. [Google Scholar]
  13. Ben-Hayyim, G.; Kafkafi, U.; Ganmore-Neumann, R. Role of Internal Potassium in Maintaining Growth of Cultured Citrus Cells on Increasing NaCl and CaCl2 Concentrations. Plant Physiol. 1987, 85, 434–439. [Google Scholar] [CrossRef] [Green Version]
  14. Thompson, M.V.; Zwieniecki, M.A. The Role of Potassium in Long Distance Transport in Plants. In Vascular Transport in Plants; Holbrook, N.M., Zwieniecki, M.A., Eds.; Academic Press: Cambridge, MA, USA, 2005; pp. 221–240. [Google Scholar] [CrossRef]
  15. Cheng, L.; Fuchigami, L.H. 615 Growth Performance of Transplanted Young Apple Trees in Relation to Reserve Nitrogen and Carbohydrates. HortScience 1999, 34, 553. [Google Scholar] [CrossRef]
  16. Rosecrance, R.C.; Weinbaum, S.A.; Brown, P.H. Alternate Bearing Affects Nitrogen, Phosphorus, Potassium and Starch Storage Pools in Mature Pistachio Trees. Ann. Bot. 1998, 82, 463–470. [Google Scholar] [CrossRef]
  17. Alva, A.; Paramasivam, S.; Fares, A.; Obreza, T.; Schumann, A. Nitrogen best management practice for citrus trees. Sci. Hortic. 2006, 109, 223–233. [Google Scholar] [CrossRef]
  18. Collatz, G.; Ball, J.; Grivet, C.; A Berry, J. Physiological and environmental regulation of stomatal conductance, photosynthesis and transpiration: A model that includes a laminar boundary layer. Agric. For. Meteorol. 1991, 54, 107–136. [Google Scholar] [CrossRef]
  19. D’Ambrosio, N.; Arena, C.; De Santo, A.V. Temperature response of photosynthesis, excitation energy dissipation and alternative electron sinks to carbon assimilation in Beta vulgaris L. Environ. Exp. Bot. 2006, 55, 248–257. [Google Scholar] [CrossRef]
  20. Isidoro, D.; Grattan, S.R. Predicting soil salinity in response to different irrigation practices, soil types and rainfall scenarios. Irrig. Sci. 2010, 29, 197–211. [Google Scholar] [CrossRef] [Green Version]
  21. Halperin, O.; Gebremedhin, A.; Wallach, R.; Moshelion, M. High-throughput physiological phenotyping and screening system for the characterization of plant-environment interactions. Plant J. 2017, 89, 839–850. [Google Scholar] [CrossRef]
  22. Sperling, O.; Shapira, O.; Schwartz, A.; Lazarovitch, N. Direct in vivo evidence of immense stem water exploitation in irrigated date palms. J. Exp. Bot. 2014, 66, 333–338. [Google Scholar] [CrossRef]
  23. Mpelasoka, B.; Behboudian, M.; Green, S. Water use, yield and fruit quality of lysimeter-grown apple trees: Responses to deficit irrigation and to crop load. Irrig. Sci. 2001, 20, 107–113. [Google Scholar] [CrossRef]
  24. Fritschen, L.J.; Cox, L.; Kinerson, R. A 28-Meter Douglas-fir in a Weighing Lysimeter. For. Sci. 1973, 19, 256–261. [Google Scholar]
  25. Syvertsen, J.; Smith, M. Nitrogen Uptake Efficiency and Leaching Losses from Lysimeter-grown Citrus Trees Fertilized at Three Nitrogen Rates. J. Am. Soc. Hortic. Sci. 1996, 121, 57–62. [Google Scholar] [CrossRef] [Green Version]
  26. Peters, A.; Durner, W. Large zero-tension plate lysimeters for soil water and solute collection in undisturbed soils. Hydrol. Earth Syst. Sci. 2009, 13, 1671–1683. [Google Scholar] [CrossRef] [Green Version]
  27. Kislev, M.; Nadel, D.; Carmi, I. Epipalaeolithic (19,000 BP) cereal and fruit diet at Ohalo II, Sea of Galilee, Israel. Rev. Palaeobot. Palynol. 1992, 73, 161–166. [Google Scholar] [CrossRef]
  28. Doll, D. Almond Nutrients & Fertilization. 1996. Available online: http://fruitsandnuts.ucdavis.edu/almondpages/AlmondNutrientsFertilization/ (accessed on 25 March 2019).
  29. Saa, S.; Brown, P.H.; Muhammad, S.; Rio, A.O.-D.; Sanden, B.L.; Laca, E.A. Prediction of leaf nitrogen from early season samples and development of field sampling protocols for nitrogen management in Almond (Prunus dulcis [Mill.] DA Webb). Plant Soil 2014, 380, 153–163. [Google Scholar] [CrossRef]
  30. Neilsen, D.; Neilsen, G.; Forge, T. Building resilience: Future directions in mineral nutrition of woody perennial crops. Acta Hortic. 2018, 1–12. [Google Scholar] [CrossRef]
  31. Haberman, A.; Dag, A.; Zipori, I.; Erel, R.; Ben-Gal, A.; Yermiyahu, U. Significance of proper nitrogen fertilization for olive productivity in T intensive cultivation. Sci. Hortic. 2019, 246, 710–717. [Google Scholar] [CrossRef]
  32. Basile, B.; Reidel, E.; Weinbaum, S.; DeJong, T. Leaf potassium concentration, CO2 exchange and light interception in almond trees (Prunus dulcis (Mill) D.A. Webb). Sci. Hortic. 2003, 98, 185–194. [Google Scholar] [CrossRef]
  33. Wolff, M.W.; Hopmans, J.W.; Stockert, C.M.; Burger, M.; Sanden, B.L.; Smart, D.R. Effects of drip fertigation frequency and N-source on soil N2O production in almonds. Agric. Ecosyst. Environ. 2017, 238, 67–77. [Google Scholar] [CrossRef]
  34. Goyal, S.S.; Huffaker, R.C.; Hauck, R.D. Nitrogen Toxicity in Plants. In Nitrogen in Crop Production 97–118; John Wiley & Sons, Ltd.: Hoboken, NJ, USA, 2015. [Google Scholar] [CrossRef]
  35. Woodward, F.I.; Lomas, M.R.; Kelly, C.K. Global climate and the distribution of plant biomes. Philos. Trans. R. Soc. B Boil. Sci. 2004, 359, 1465–1476. [Google Scholar] [CrossRef] [Green Version]
  36. Tixier, A.; Gambetta, G.A.; Godfrey, J.; Orozco, J.; Zwieniecki, M.A. Non-structural Carbohydrates in Dormant Woody Perennials; The Tale of Winter Survival and Spring Arrival. Front. For. Glob. Chang. 2019, 2. [Google Scholar] [CrossRef] [Green Version]
  37. McKown, A.; Guy, R.D.; Quamme, L.K. Impacts of bud set and lammas phenology on root:shoot biomass partitioning and carbon gain physiology in poplar. Trees 2016, 30, 2131–2141. [Google Scholar] [CrossRef]
  38. Mason, A.C.; Whitfield, A.B. Seasonal Changes in the Uptake and Distribution of Mineral Elements in Apple Trees. J. Hortic. Sci. 1960, 35, 34–55. [Google Scholar] [CrossRef]
  39. Millard, P.; Wendler, R.; Grassi, G.; Grelet, G.-A.; Tagliavini, M. Translocation of nitrogen in the xylem of field-grown cherry and poplar trees during remobilization. Tree Physiol. 2006, 26, 527–536. [Google Scholar] [CrossRef] [PubMed] [Green Version]
  40. Shane, M.W.; McCully, M.E.; Lambers, H. Tissue and cellular phosphorus storage during development of phosphorus toxicity in Hakea prostrata (Proteaceae). J. Exp. Bot. 2004, 55, 1033–1044. [Google Scholar] [CrossRef] [PubMed] [Green Version]
  41. Head, G.C. Effects of Seasonal Changes in Shoot Growth on the Amount of Unsuberized Root on Apple and Plum Trees. J. Hortic. Sci. 1967, 42, 169–180. [Google Scholar] [CrossRef]
  42. Rufat, J.; DeJong, T.M. Estimating seasonal nitrogen dynamics in peach trees in response to nitrogen availability. Tree Physiol. 2001, 21, 1133–1140. [Google Scholar] [CrossRef] [PubMed]
  43. Peñuelas, J.; Poulter, B.; Sardans, J.; Ciais, P.; Van Der Velde, M.; Bopp, L.; Boucher, O.; Godderis, Y.; Hinsinger, P.; Llusià, J.; et al. Human-induced nitrogen–phosphorus imbalances alter natural and managed ecosystems across the globe. Nat. Commun. 2013, 4, 2934. [Google Scholar] [CrossRef] [Green Version]
  44. Falkiner, R.A.; Polglase, P.J. Transport of phosphorus through soil in an effluent-irrigated tree plantation. Soil Res. 1997, 35, 385. [Google Scholar] [CrossRef]
  45. Sharpley, A.; Moyer, B. Phosphorus Forms in Manure and Compost and Their Release during Simulated Rainfall. J. Environ. Qual. 2000, 29, 1462–1469. [Google Scholar] [CrossRef]
  46. Micke, W.C. Almond Production Manual; UCANR Publications: Davis, CA, USA, 1996. [Google Scholar]
  47. Hayatsu, M.; Tago, K.; Saito, M. Various players in the nitrogen cycle: Diversity and functions of the microorganisms involved in nitrification and denitrification. Soil Sci. Plant Nutr. 2008, 54, 33–45. [Google Scholar] [CrossRef]
  48. Mallarino, A.P. Spatial Variability Patterns of Phosphorus and Potassium in No-Tilled Soils for Two Sampling Scales. Soil Sci. Soc. Am. J. 1996, 60, 1473–1481. [Google Scholar] [CrossRef]
  49. Mooshammer, M.; Hofhansl, F.; Frank, A.H.; Wanek, W.; Hämmerle, I.; Leitner, S.; Schnecker, J.; Wild, B.; Watzka, M.; Keiblinger, K.M.; et al. Decoupling of microbial carbon, nitrogen, and phosphorus cycling in response to extreme temperature events. Sci. Adv. 2017, 3, e1602781. [Google Scholar] [CrossRef] [PubMed] [Green Version]
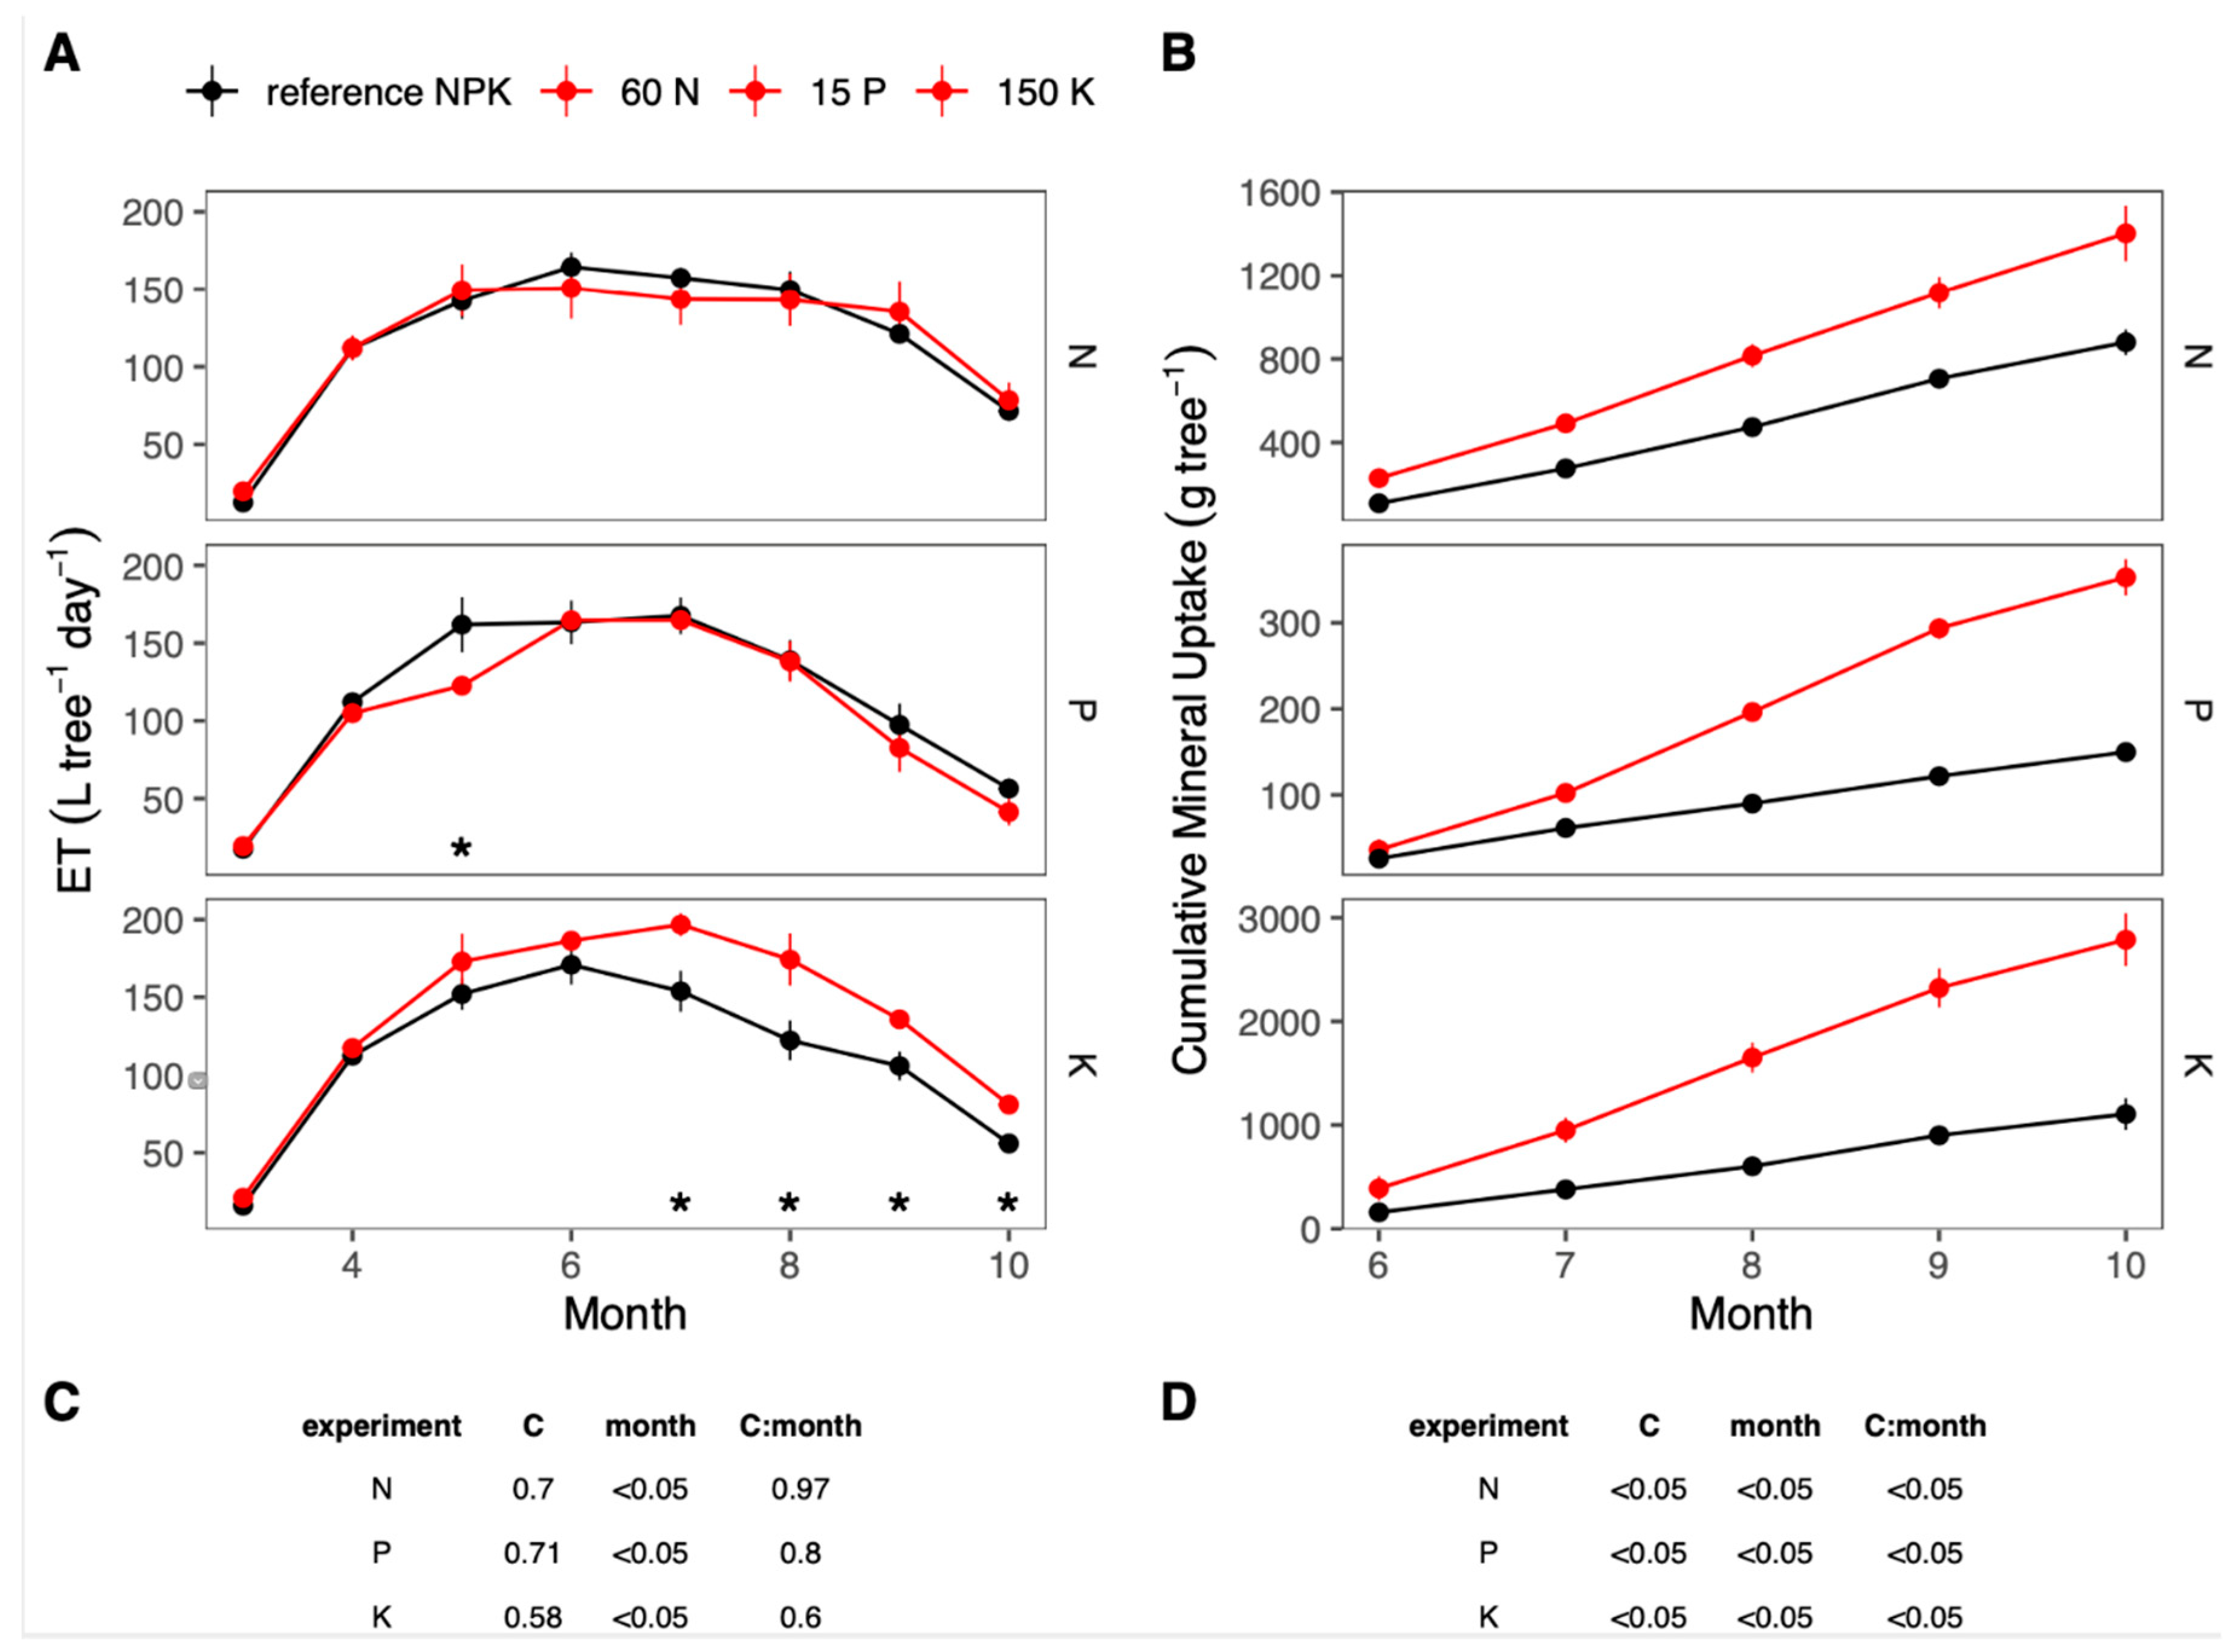
Figure 1. Seasonal changes in resource uptake. (A) Evapotranspiration (ET) between March and October of the almond trees fertigated at 30 (reference) and 60 mg N L−1, 6 (reference) and 15 mg P L−1, or 60 (reference) and 150 mg K L−1. (B) Cumulative mineral uptake by almond trees fertigated with a reference concentration or higher concentrations of N, P, or K. *—denote statistical differences (Student t-test, p < 0.05) between fertigation treatments in a specific month. (C,D) A two-way ANOVA analysis for the effects of time and fertigation concentrations on the observations.
Agronomy 10 01277 g001
Figure 2. Phenological shifts. Seasonal changes in the leaf area index (LAI, bloom through senescence), stem radial growth (SRG), and the roots’ starch reserves in almond trees fertigated with reference N (30 mg L−1), P (6 mg L−1), or K (60 mg L−1) concentrations that differentiate between the growth and the phenological storage stages. Letters denote the HSD levels (p < 0.05) of a one-way ANOVA analysis, the vertical dashed line marks the time of fruit ripening, and background hues illustrate the growth and storage phenological stages.
Agronomy 10 01277 g002
Figure 3. Mineral storages at two phenological stages. (A) N concentrations in the leaves and roots of almond trees fertigated with 2, 10, 30, 60, or 100 mg N L−1 in May (growth phenology) and September (storage phenology). (B) P concentrations in leaves and roots of trees fertigated with 0, 1, 3, 6, 10, or 15 mg P L−1 in May and September. (C) K concentrations in the leaves and roots of trees were fertigated with 2, 10, 30, 60, or 100 mg K L−1 in May and September. *—denote significant differences between mineral concentrations at the growth and storage phenological stages.
Agronomy 10 01277 g003
Figure 4. Phenological effects on fertigation efficiency. (A) The correlations between N, P, or K fertigation efficiencies for almond trees and N, P, or K concentrations in fertigation in May (growth phenology) and September (storage phenology). (B) A two-way ANOVA analysis for the effects of fertigation concentration and phenology on the observations. *—denote statistical differences (Student t-test, p < 0.05) between fertigation treatments in a specific month.
Agronomy 10 01277 g004
Figure 5. Physiological and phenological effects on mineral uptake. (A) The correlation between the N uptake and evapotranspiration (ET) of almond trees fertigated with 10, 30 (reference), or 60 mg N L−1 in April through July (growth phenology) or August through October (storage phenology). The correlation between P uptake and the ET of trees fertigated with 1, 6 (reference), or 15 mg P L−1 at growth phenology. The correlation between the K uptake and ET of trees fertigated with 10, 60 (reference), or 100 mg K L−1 during growth. The lines denote linear regressions, the ribbons mark the 95% confidence levels of a linear fit, the black horizontal lines indicate the medians, and the boxes signify the deviation at the x and y axes. (B) A two-way ANOVA analysis for the effects of ET and fertigation concentrations on the observations.
Agronomy 10 01277 g005