Article

Change in the Length of the Vegetation Period of Tomato (Solanum lycopersicum L.), White Cabbage (Brassica oleracea L. var. capitata) and Carrot (Daucus carota L.) Due to Climate Change in Slovakia

1
Department of Biometeorology and Hydrology, Faculty of Horticulture and Landscape Engineering, Slovak University of Agriculture, Hospodárska 7, 949 76 Nitra, Slovakia
2
Department of Landscape Planning and Land Consolidation, Faculty of Horticulture and Landscape Engineering, Slovak University of Agriculture, Hospodárska 7, 949 76 Nitra, Slovakia
3
Department of Water Resources and Environmental Engineering, Faculty of Horticulture and Landscape Engineering, Slovak University of Agriculture, Hospodárska 7, 949 76 Nitra, Slovakia
*
Authors to whom correspondence should be addressed.
Agronomy 2020, 10(8), 1110; https://doi.org/10.3390/agronomy10081110
Submission received: 19 June 2020 / Revised: 26 July 2020 / Accepted: 28 July 2020 / Published: 31 July 2020

Abstract

:
Climate change is affecting all sectors of human activities worldwide, including crop production. The aim of the paper was to evaluate the average daily air temperatures measured at one hundred meteorological stations across Slovakia in 1961–2010 and calculate the maximum length of the vegetation period for Solanum lycopersicum L., Brassica oleracea L. var. capitata and Daucus carota L. Future trends predictions of the temporal and spatial development across the duration of the vegetation period in Slovakia were elaborated for decades 2011–2020, 2041–2050, 2071–2080 and 2091–2100. Our results show that there was an earlier start to the vegetation period in spring and a later termination in autumn for past 30 years. There is a predicted trend of prolongation of the maximum duration of the vegetation period up to 20 days (Solanum lycopersicum L., Brassica oleracea L. var. capitata) and 15 days (Daucus carota L.) in comparison with the refence decade 2001–2010. The maximum vegetation period duration will extend from the south of Slovakia towards the north of the country. The predicted potential increase in crop vegetation periods will be limited by other constraints such as the availability of arable land and soil water availability.

1. Introduction

Climate change plays an important role in landscape changes, biological diversity and ecological stability [1]. It affects all sectors of human activities, including crop production. Regarding the general climate change effect in Europe, the temperature of the European continent has risen on average by 1.2 °C over the last century and 0.45 °C over the last three decades [2]. The trend in the rise of average temperature has been around 0.1 °C per 10 years across Europe over the last century; however, it has more than doubled in the last thirty years [3]. The Central European region also shows general signs of climate change [4,5,6]. Global warming manifests itself in all locations and climatic areas of this region [5,6,7]. As there is a sufficiently dense network of long-term measuring stations in the European region, supplemented by a series of distance measurements, analysis of trend changes to individual meteorological parameters is significantly more accurate than similar global analysis [8]. However, the trends in atmospheric precipitation are not so unambiguously defined. This is due to the general, large variability of precipitation, as well as the distribution of total precipitation in windy and leeward locations.
The trend of an increase in average temperature until 2030, regardless of the choice of the standardized reference emission scenarios (SRES), is assumed to be slightly higher than the global estimate, i.e., slightly above 0.2 °C per 10 years [4,5,9]. According to Intergovernmental Panel on Climate Change (IPCC) [5], the SRES were developed as alternative predictions of how the future might unfold. Four different narrative projections were developed to describe the relationships between driving forces such as population and economic growth, and their effects on greenhouse gas emissions. The SRES projection for the 2100 period shows an increase in the range of 1.0 to 5.5 °C (the lower and upper estimate, respectively) when compared with the period of 1961–1990 [10,11,12].
To date, several changes in the weather patterns have been observed in Slovakia. Lapin [13] listed the following facts for the time period of 1881–2017:
  • an increase in the average annual air temperature by about 1.73 °C,
  • a decrease in annual totals of atmospheric precipitation on average by about 0.5% (this decrease was more than 10% in some places in the south of Slovakia, and the total precipitation rarely increased to 3% in the north and northeast),
  • a decrease in relative humidity (by 5% in the south of Slovakia since 1900 and less in other areas),
  • a decrease in all characteristics of snow cover up to altitude of 1000 m a. s. l. in almost the entire territory of Slovakia (an increase was recorded at the higher altitudes).
Long periods of relatively warm weather accompanied by low total precipitation led to a more frequent occurrence of local or regional droughts [14] during growing seasons in the period of 1989–2017, in comparison with past observations. The droughts were particularly substantial in the years 1990–1994, 2000, 2002, 2003 and 2007. Other events also occurred in some regions in the west of Slovakia in 2015, 2017, 2018 and 2019.
In general, the climate conditions of Europe are characterized by significant regional variability, due to the continent’s location in the Northern Hemisphere and the influence of surrounding seas and oceans. At the same time, the proximity to an adjacent Asian continent and the Arctic also play an important role. Atmospheric circulation and its temporal and spatial changes influence most of the European climate [10,15]. Air and soil temperature are basic characteristics of the energy component of the ecosystem. In terms of landscape scale, air temperature is the most affected by geographical location—latitude (determines insolation conditions), altitude, orographic conditions, the distance from the sea, etc. [16,17]. In Slovakia, the temporal and spatial distribution of air temperature is mainly influenced by rather complex orographic conditions. Slovak mountains belonging to the Carpathian Arch (such as Beskids, High and Low Tatras) create natural climatic barriers. Further, wind conditions have a significant impact on the temporal and spatial character of temperatures in Slovakia.
Air and soil temperatures impact the environmental conditions and life processes of plants such as photosynthesis, respiration, nutrient intake, and transpiration. These processes determine the production of organic matter—the crop yield [18,19]. Therefore, temperature ranks among the agroclimatic factors of agricultural and vegetable production [20,21]. Plant requirements for agroclimatic environmental factors are expressed numerically as “agroclimatic indicators”. Using their synthesis, the agroclimatic conditions of the landscape are evaluated by means of agroclimatic zoning. From complex agroclimatic factors, the sum of average daily air temperatures during the crop growing season is especially considered [19].
Increasing the air and soil temperatures brings a range of complex of effects to agroclimatic conditions [22]. The course of both temperatures determines the development of crops and thus the timing of most agrotechnical operations. With a rising temperature, the beginning of a main growing season will shift [23]. The length of vegetation periods and their geographical distribution are an indicator for delimitations of crops and various agricultural activities in the Slovak Republic [24]. The zoning of crops, varieties and farming operations (e.g., tillage) are based on the production areas and climate regions and will need to be updated more frequently. The length of the growing season, together with other indicators, determines which species of more heat-intensive crops it will be possible to grow in the future [25]. The prolongation of growing season duration suggests the possibility of growing two crops (or gaining two harvests) per year, but this potential will be fundamentally limited by the amount of water available [26].
The impact of extending growing season on agriculture and forestry has been studied worldwide e.g., [10,19,21,22,27,28] from different perspectives. On the other hand, there is lack of studies examining the impact of changing climate on the crop vegetation season in Slovakia. In the past, several predictions were made within the project on the regionalization of vegetable production in the aspect of climate change in the years 2003–2005. However, at that time, only two meteorological stations were considered. Therefore, the observed trends could only be evaluated locally. Herein, we present a study aiming to provide a quantitative and spatial evaluation of the potential length of the vegetation period under past, present and projected air temperature conditions. For this purpose, data from one hundred meteorological stations were analyzed, and the map outputs were elaborated for the selected field vegetable crops.

2. Materials and Methods
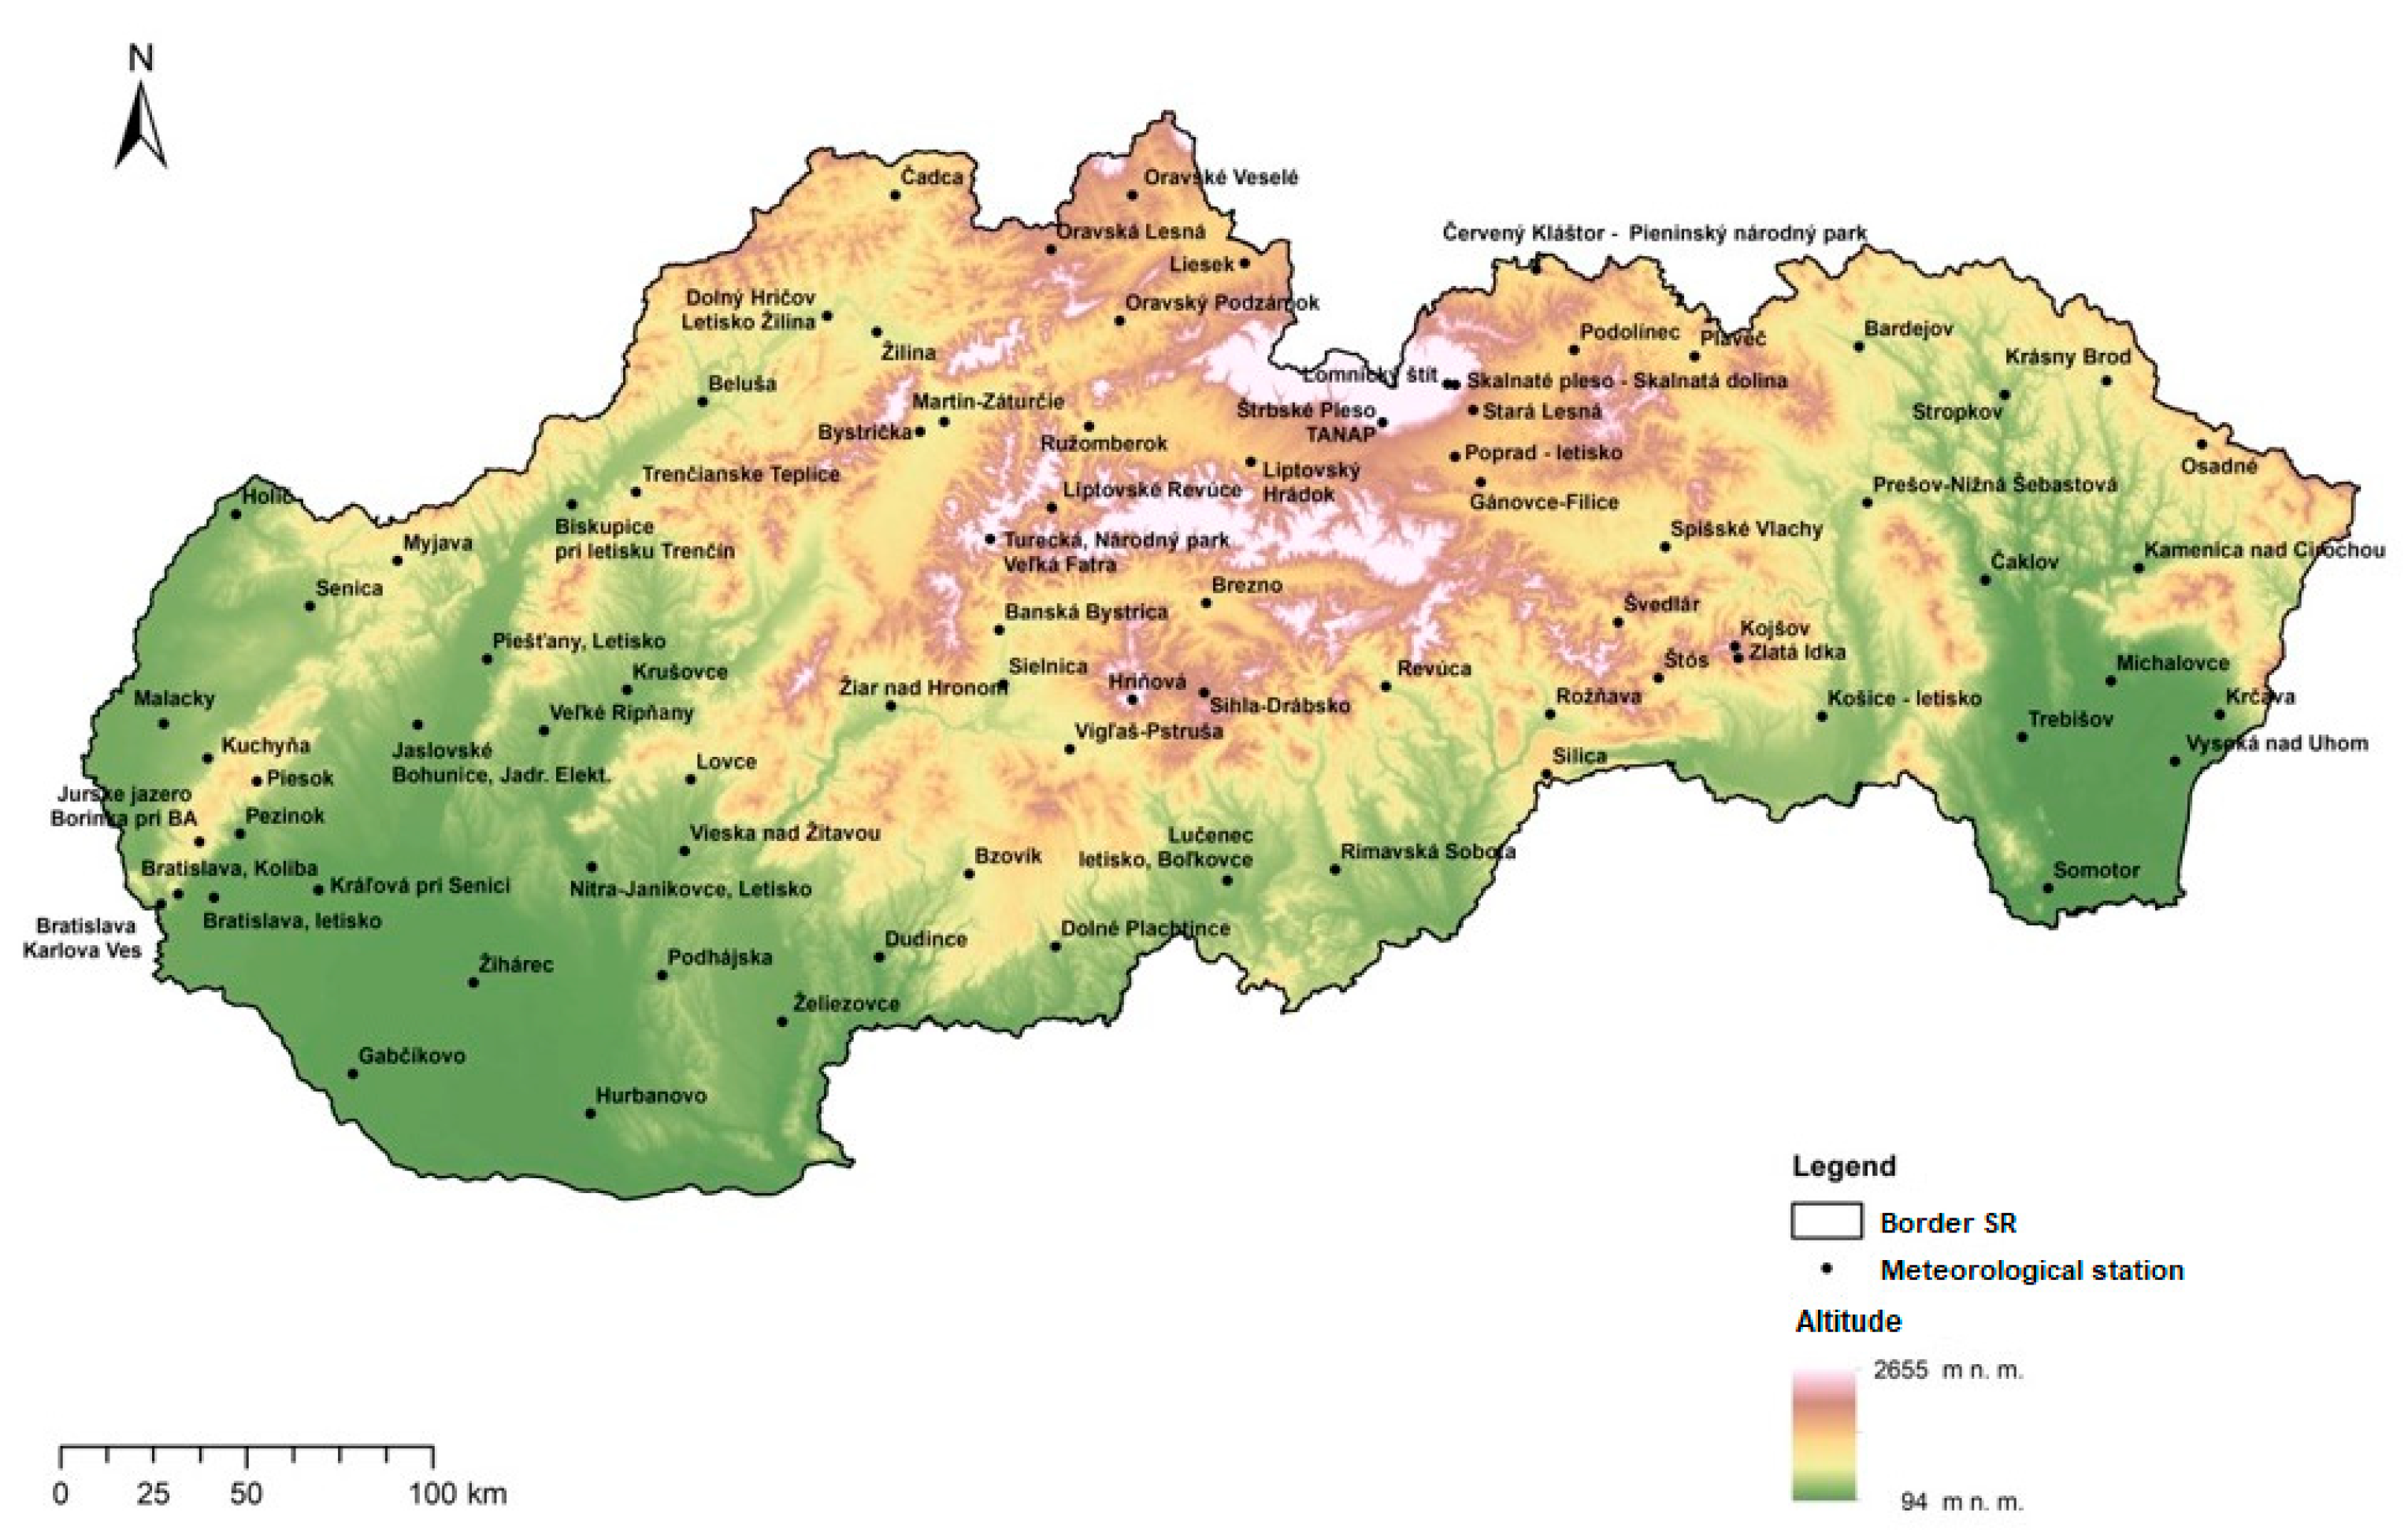
2.1. Study Region

The study region encompasses an area of Slovakia (Figure 1). The country is situated in Central Europe, and it lies within northern latitudes from 47°44’21” up to 49°36’48” and eastern longitudes from 16°50’56” up to 22°33’53”. The average annual vertical temperature gradient in Slovakia is 0.61 °C per 100 m of altitude. This value increases up to 0.76 °C in summer and decreases up to 0.33 °C in winter. To date, the maximum absolute temperature in Slovakia of 40.3 °C was measured in Hurbanovo (20 July 2017) and the absolute minimum of −41.0 °C was measured in Vígľaš–Pstruša (11 February 1929).

2.2. Data

For the purpose of this study, monthly average air temperatures for the period of 1961–2010 were analyzed. This dataset for one hundred meteorological stations in Slovakia (Figure 1) was provided by the Slovak Hydrometeorological Institute in Bratislava. These data are among the most homogeneous in terms of measurements and observations.

2.3. Data Analysis—Calculation of the Vegetation Period

2.3.1. Selected Vegetable Crops

For the purpose of this study, three species representing different groups of field vegetable crops were chosen for agroclimatic analysis:
  • fruit vegetables—tomato (Solanum lycopersicum L.),
  • Brassica vegetables—white cabbage (Brassica oleracea L. var. capitata),
  • root vegetables—carrot (Daucus carota L.).
The air temperatures determining the beginning and end of vegetation periods for crops used in this study are shown in Table 1 [29].

2.3.2. Calculation of the Beginning and End of Crop Vegetation Period

The data analysis was carried out using the software “Meteo Calculator” version 1_0_3 (Slovak University of Agriculture, Nitra, Slovakia), which we created. Firstly, we ran equations 1 and 2 [30] in the software to determine the dates when the beginning and the ending temperature specifying the vegetation period occurred. These calculations were done individually for each crop, year and meteorological station for the whole dataset 1961–2010. Thus, the software output data formed the basis for determining the number of days of the vegetation season for individual vegetables and localities.
Beginning   of   vegetation   period :   r v = R T n T 2 T 1 T 2
End   of   vegetation   period :   r p = R T 1 T u T 1 T 2
where:
  • rv—difference between the middle of month with temperature T2 and date when Tn was reached [days]
  • rp—difference between the middle of month with temperature T1 and date when Tu was reached [days]
  • Tn—the starting temperature [°C]
  • Tu—the ending temperature [°C]
  • T1—the nearest monthly average temperature above Tn or Tu [°C]
  • T2—the nearest monthly average temperature below Tn or Tu [°C],
  • R—difference between the middle of months with average temperature T2 and average temperature T1; it can be expressed as R = 30, [days].

2.3.3. Prediction of the Vegetation Period Length in the Future

Using the observed trends for the length of the vegetation periods for each evaluated year during 1961–2010, the mathematical function (linear trend) was used to make predictions for the maximum duration of the vegetation period. Probable trends in the length of vegetation periods were estimated individually for each crop, year and location for the horizons of 2041–2050, 2071–2080 and 2091–2100 in the conditions of changing climate. These data formed the input database for the processing of map outputs.

2.4. Procedure of Creating Map Outputs in GIS

Software package ArcGIS Desktop v.10.6 (ESRI, Redlands, CA, USA) was used for processing and creating the map outputs in this study. ArcGIS system allows us to collect, process, search and elaborate the outputs of geographic information [31,32]. It finds its applicability in many areas of human activities.

2.4.1. Input Data Preparation

Selected meteorological stations (Figure 1) were defined by XYZ coordinates. These stations were loaded to ArcGIS Desktop environment and transformed to point vector model (*.shp) in the S-JTSK coordinate system. Meteorological data from meteorological stations was processed in a table format for easy import and processing in GIS. The areas above 800 m of altitude were excluded from the processing. There is a significantly poorer spatial layout of meteorological stations in mountainous areas. Moreover, these areas are not used as agricultural soils.

2.4.2. Data Interpolation

Interpolation Method Topo to Raster was chosen from the interpolation methods available in ArcGIS software. This method originates from software ANUDEM version 4.6.3 (Australian National University, Canberra, Australia). Interpolation method Topo to Raster combines the following interpolation methods: Inverse Distance Weighing (IDW), Spline and Kriging. It is optimized for calculation effectiveness of local interpolation methods such as IDW, without losing surface connection as it does in the case of Spline or Kriging methods [31].
A point vector shapefile of meteorological stations with meteorological data as attributes and a vector shapefile of the state boundary of Slovakia (spatial limit for interpolation) were used as the input data for interpolation. The resolution of output raster was selected as 250 m, with consideration of the spatial layout of the meteorological stations and the range of interpolation.

2.4.3. Map Layouts

In general, outputs from interpolation show a spatial distribution of the selected element. The output layers for nine time periods and each crop were reclassified into classes depending on the value histogram. The fundamental features of maps—legend, north arrow and scale were added in an output module before the final export of map layouts.

3. Results

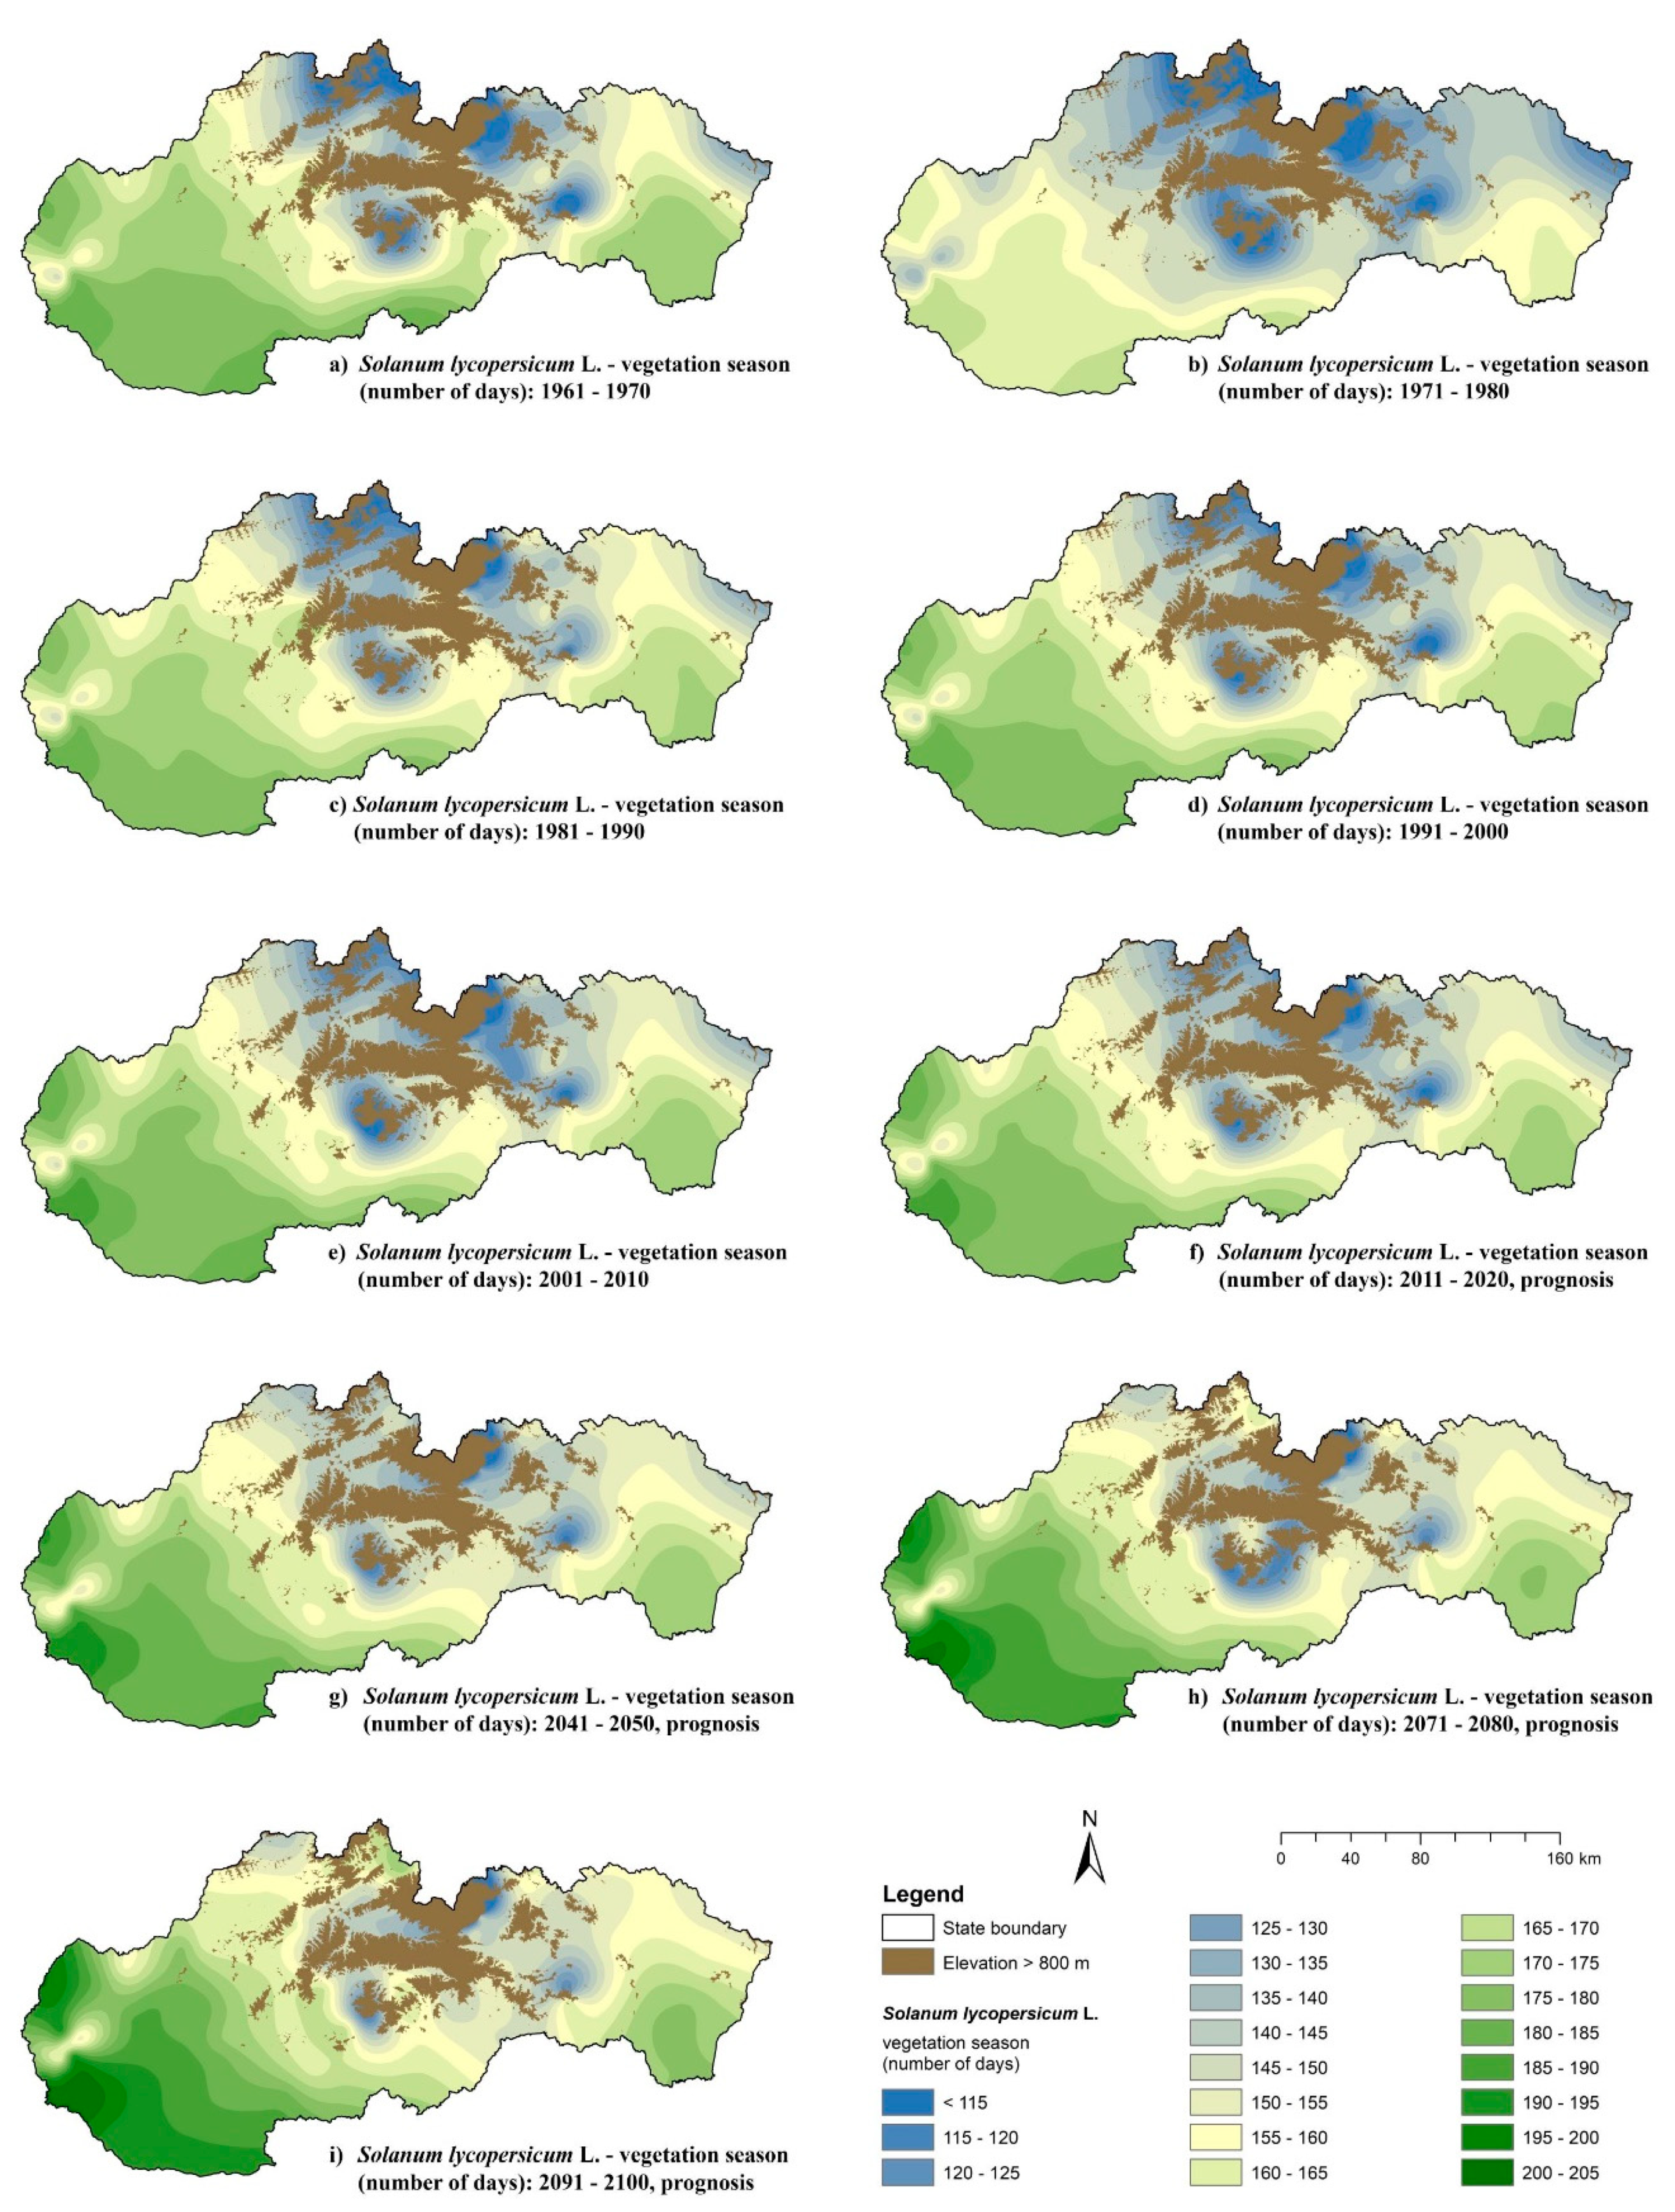
3.1. Vegetation Period of Solanum lycopersicum L.

The length of the vegetation period for Solanum lycopersicum L. and its spatial distribution in Slovakia are shown in Figure 2. Analysis of the average air temperatures over the period 1961–2010 (Figure 2a–e) showed that, except the decade 1971–1980, there was only a mild change observed in the length of the vegetation period. In general, the maximum amount of days suitable for growing Solanum lycopersicum L. in Slovakia reached 180–185 days in the warmest southwestern part of the country. During the cold decade 1971–1980, the duration of the vegetation period in the warmest areas dropped to only 165–170 days (Figure S1). This was about 20 days less in comparison with the other decades in 1961–2000. The vegetation period was prolonged by 5 days up to 185–190 days in the decade 2001–2010.
The prognosis for the maximum amount of days suitable for growing Solanum lycopersicum L. shows the extension of the vegetation period up to 10 days, 15 days and 20 days in the decades 2041–2050, 2071–2080 and 2091–2100, respectively, when compared with a decade 2001–2010 (Figure 2f–i; Figure S1). It is predicted that the vegetation period will reach up to 205 days in the period 2071–2080. This means an increase in the length of the vegetation period of Solanum lycopersicum L. by about 40 days in the Danubian Lowland in the years 2071–2100 in comparison with the coldest evaluated decade 1971–1980. Further, it is predicted that there will be less areas in which the vegetation period duration is below 140 days. These categories of vegetation period length were represented the most during the cold decade 1971–1980, and their representation will decrease gradually after the decade 20141–2050 (Figure S1).

3.2. Vegetation Period of Brassica oleracea L. var. Capitata

The length of the vegetation period of Brassica oleracea L. var. capitata is limited by the occurrence of days when the average temperature is above 9.5 °C (starting temperature) and 6.5 °C (ending temperature). The decades 1961–1970 and 2001–2010 had the same maximum length of the vegetation period (215–220 days) (Figure S2). However, there was a change observed regarding the spatial boundary of this vegetation period zone. The zone of 215–220 days of the vegetation period was located in the southeastern part of the Danubian Lowland in the decade 1961–1970 (Figure 3a), but it was shifted to the southwestern part of Slovakia in the decade 2001–2010 (Figure 3e). According to analysis of average air temperatures over the period 1961–2010 (Figure 3a–e Figure S2), it seems that the maximum vegetation period length for this crop was affected by the cold decade 1971–1980 more than in the case of Solanum lycopersicum L. During the decade 1971–1980, the duration of the vegetation period in the warmest areas of Slovakia was 195–200 days. In comparison with other decades in 1961–2010, it was about 10–15 days less on average. The maximum length of the vegetation period rose gradually up to 215–220 days in the decade 2001–2010. The prognosis on the maximum amount of days suitable for growing Brassica oleracea L. var. capitata shows further extension of the vegetation period up to 10 days, 15 days and 20 days in decades 2041–2050, 2071–2080 and 2091–2100, respectively, when compared with the decade 2001–2010 (Figure 3f–i; Figure S2). Our predictions for decades 2071–2080 and 2091–2100 also show that the length of the vegetation period for Brassica oleracea L. var. capitate will be at least 120 days (Figure S2). It is also predicted that in the decade 2091–2100, the areas with vegetation periods spanning from 215 up to 235 days will be more represented than the areas below 180 days (Figure S2).

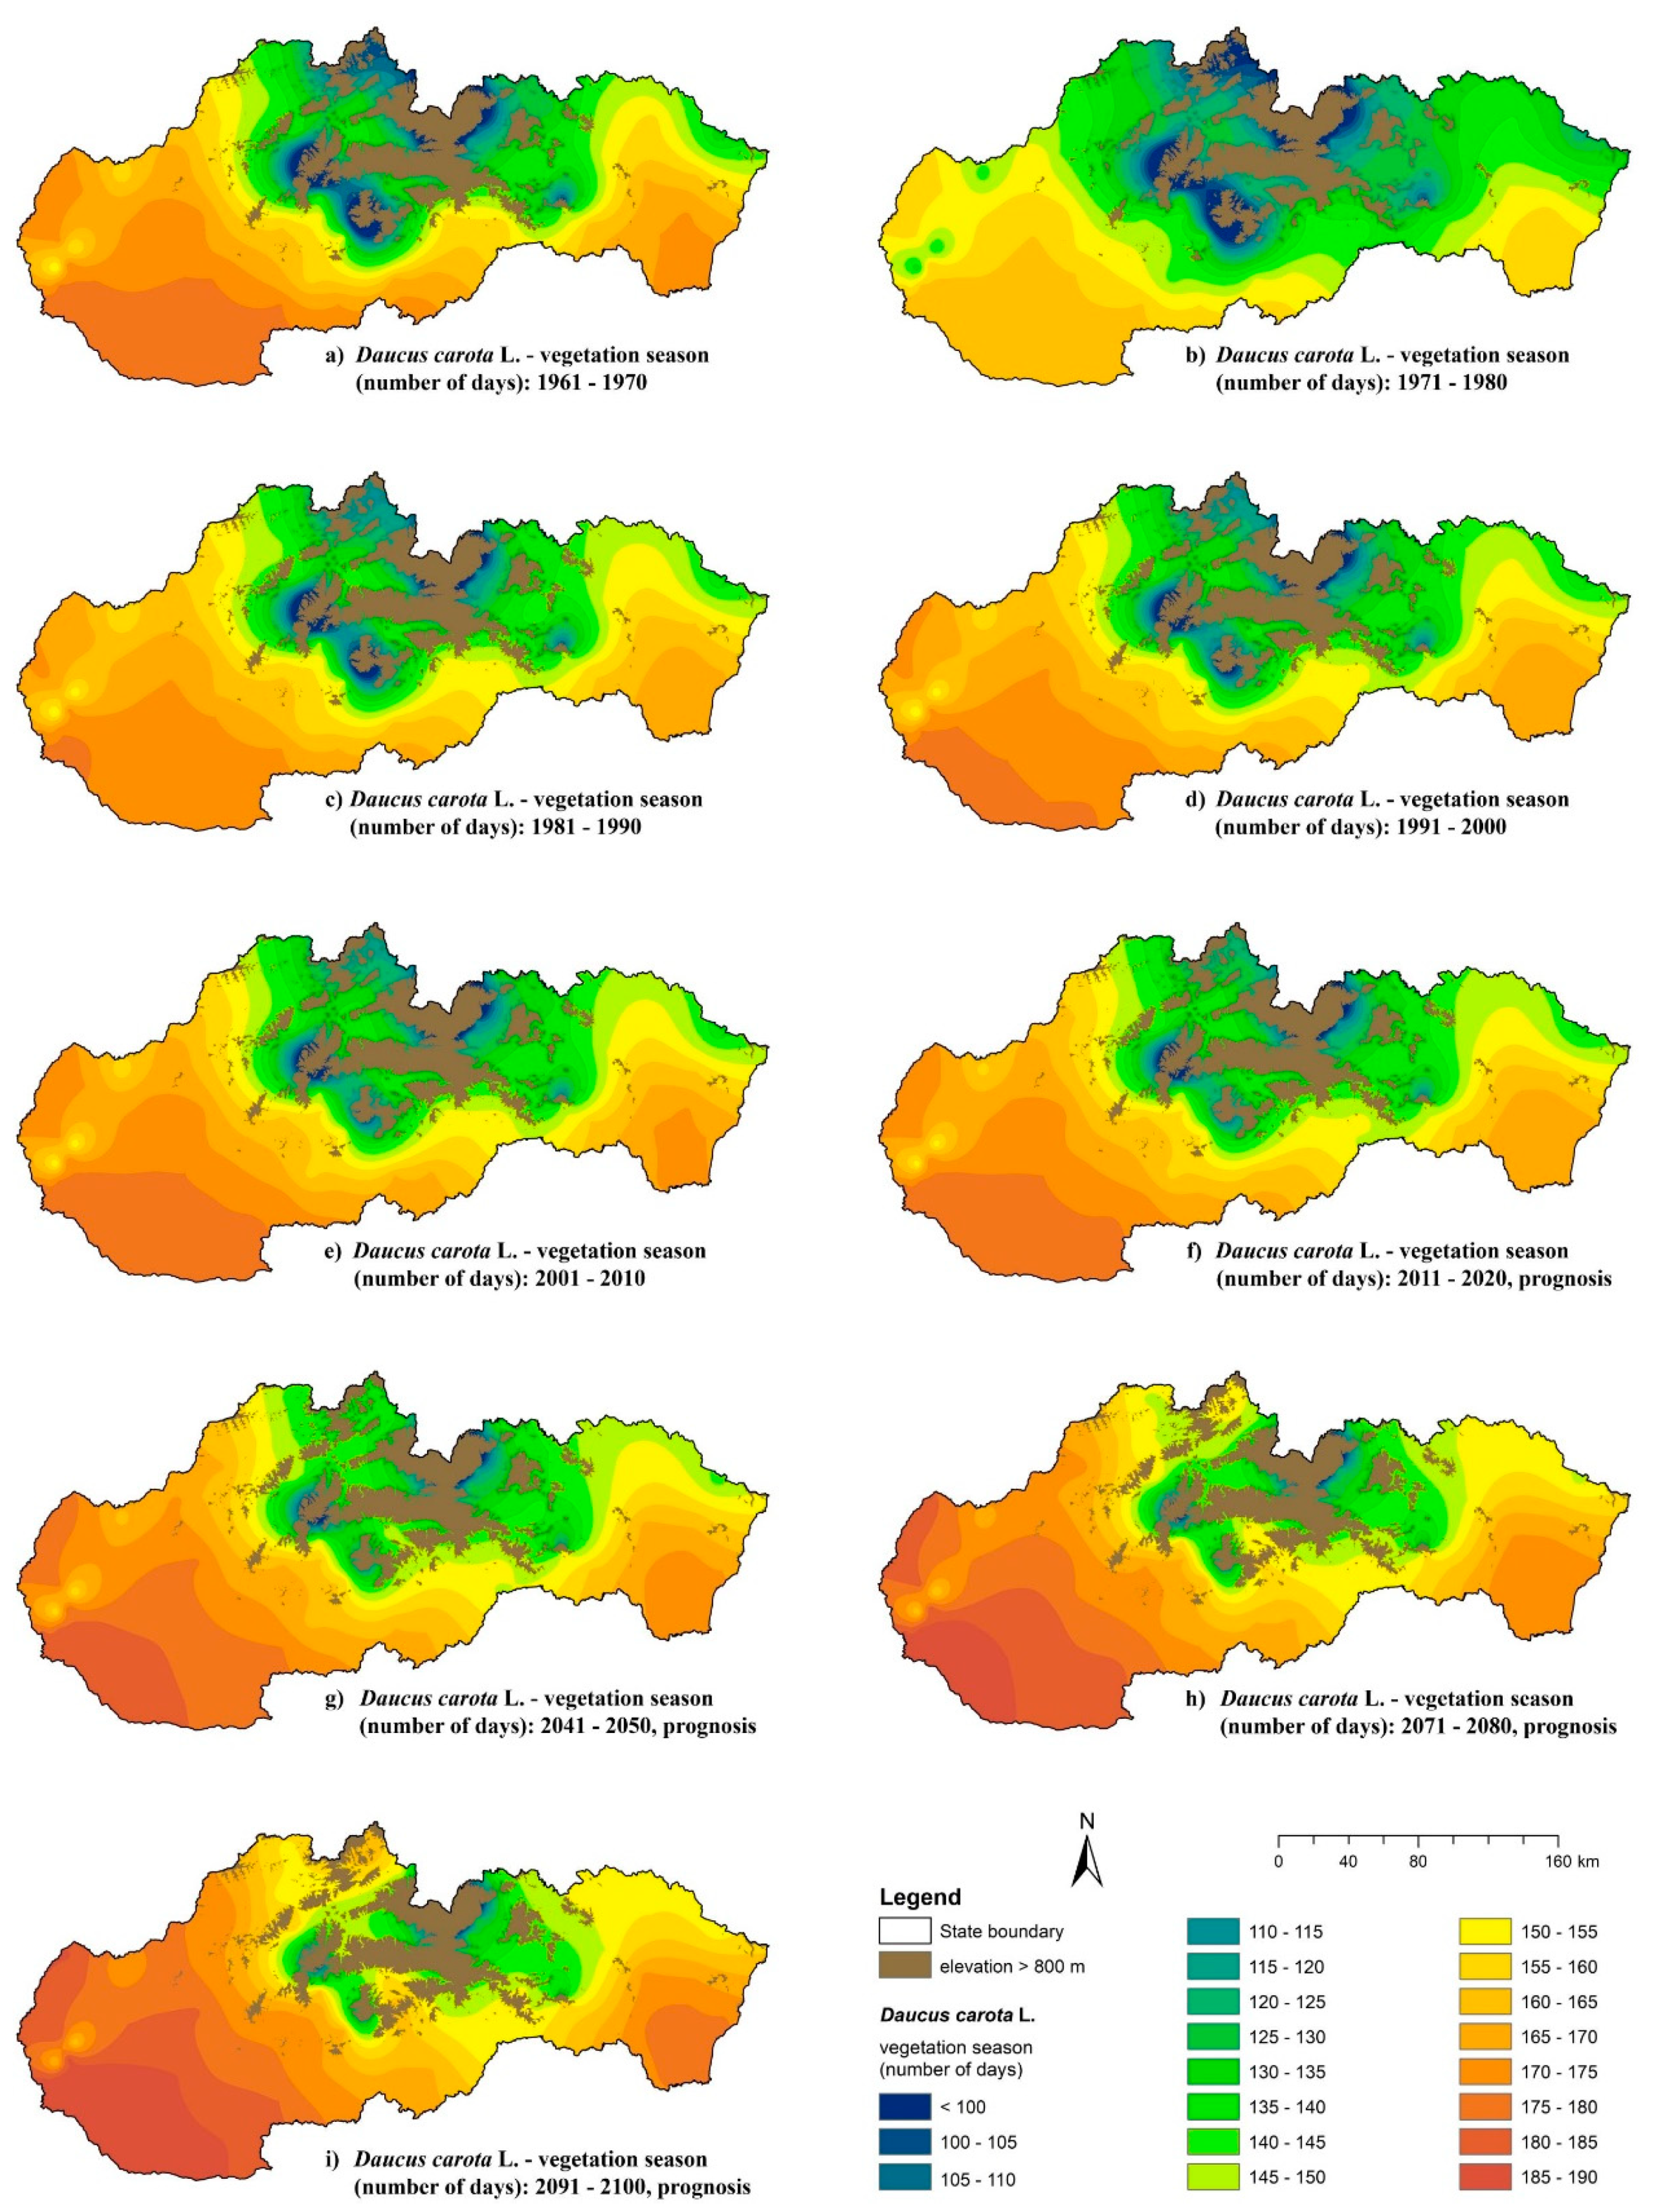
3.3. Vegetation Period of Daucus carota L.

The vegetation period of Daucus carota L. is limited by the occurrence of days with an average air temperature above 3 °C (starting temperature) and 7.5 °C (ending temperature). Our analysis shows similarities in the maximum length of the vegetation period of Daucus carota L. in the decades 1961–2020 (Figure 4a–f). The only exception was the decade 1971–1980, when the vegetation period was shorter by 15–20 days. The prognosis for the decade 2041–2050 (Figure 4g and Figure S3) shows prolongation of the vegetation period by 5 days up to 180–185 days of maximum vegetation period in the most fertile parts of Slovakia, in comparison with the decade 1961–2010. Further it is estimated that the maximum length of the vegetation period will extend up to 190 days during the decade 2071–2080 (Figure 4h and Figure S3) in the Danubian Lowland. This means that in the warmest parts of Slovakia, the maximum vegetation period of Daucus carota L. will be about 25–30 days longer when compared with the coldest decade 1971–1980.

4. Discussion

4.1. The Effect of Changing Air Temperature on Vegetation Period Duration

The effect of changing trends in air temperature as a result of the warming climate of Slovakia was analyzed for individual decades in the period of 1961–2010. Predictions for the length of the vegetation period were made for the selected decades 2011–2020, 2041–2050, 2071–2080 and 2091–2100.
Spatial analysis (Figure 2, Figure 3 and Figure 4) and quantitative analysis (Figures S1–S3) of the maximum length of the vegetation period of Solanum lycopersicum L., Brassica oleracea L. var. capitata and Daucus carota L. using past, present and projected air temperature conditions showed that:
  • there was an earlier start to the vegetation period in spring and a later termination in autumn over the past 30 years,
  • the maximum vegetation period duration will extend from the south of Slovakia towards the north of the country,
  • the maximum vegetation period length of all studied crops was affected by low air temperatures in the decade 1971–1980,
  • the categories of the vegetation period length occurring during the decade 1971–1980 had in general the highest spatial distribution over the whole studied period (this trend was especially visible in the case of Daucus carota L.),
  • there is a predicted trend of prolongation of the maximum duration of the vegetation period up to 20 days (Solanum lycopersicum L., Brassica oleracea L. var. capitata) and 15 days (Daucus carota L.) in comparison with the refence decade 2001–2010,
  • there is a general trend of a gradual increase in representation of the areas (zones) with the longest maximum vegetation period after the decade 2011–2020,
  • at the same time, there is a general trend of a gradual decrease in representation of the areas (zones) with the shortest maximum vegetation period after the decade 2011–2020.
The results of our study are in agreement with the conclusions of other published studies focusing on the effect of climate change on the duration of the vegetation period in Slovakia. Valšíková-Frey et al. [33] reported predictions for an earlier date of seeding in Hurbanovo (south of Slovakia) in the year 2075. It is predicted to occur about 25 days earlier in the case of fruit and Brassica vegetables, and about 30 days earlier in the case of root vegetables. At the same time, changes in harvest date were also predicted. The date of harvest is expected to be 15 days later, 10 days later and about 12 days later for fruit vegetables, Brassica vegetables and root vegetables, respectively. Changes to vegetation period duration for fruit, Brassica and root vegetables in field conditions were also reported by Špánik et al. [29]. They used the Canadian Climate Center Model (CCCM 2000)—a global model for general circulation of the atmosphere. The authors predicted the extension of the vegetation period length by about 21–26% for the analyzed species of vegetables in Hurbanovo and Liptovský Hrádok in 2075.
The prolongation of the crop vegetation period was also reported abroad. Sar et al. [27] evaluated the vegetation period according to climate change scenarios in the Inner West Anatolia subregion, Turkey. According to representative concentration pathway (RCP) scenarios RCP 4.5 and RCP 8.5, the vegetation period in Anatolia could increase by 15–20 days and 40 days, respectively. Olszewski and Żmudzka [28] analyzed the data from 9 meteorological stations in Poland for the studied period of 1938–1998. They reported an increase in the length of the general vegetation period at the rate of 1 to 3 days per decade. This was most probably connected with the acceleration of the starting date of the vegetation period by approximately 0.5 to 1.5 days per decade, coupled with the delay of its termination by approximately 0.5 to 1.5 days per decade. According to USDA [34], the changes in temperature over the 20th century varied by season as well as by region. During the most recent decades, the cooling of the Southeast has slowed down and then reversed, particularly in cold seasons. Summer in most areas is warmer but not as pronounced as winter. Spring is also warmer in most regions, which is likely related to the rapid melting of snow. The century-long linear trend for autumn is still largely dominated by the warming in the 1930s and 1940s in a lot of areas of the United States, and therefore the long-term trends remain small, with the Southwest being a notable exception. This overall warming is reflected in the extending of the growing season in the Northern Hemisphere by about 4 to 16 days since 1970 (i.e., 1 to 4 days per decade).

4.2. The Consequences of Changing Air Temperature

Temperature is a primary factor affecting the rate of plant development. Warmer temperatures expected with climate change and the potential for more extreme temperature events will impact plant productivity [35]. Plant response to climate change is dictated by a complex set of interactions with CO2, temperature, solar radiation, and precipitation. Each crop species has a given set of temperature thresholds that define the upper and lower boundaries for growth and reproduction, along with optimum temperatures for each developmental phase [34]. As temperatures increase over the 21st century, shifts may occur in crop production areas because temperatures will no longer occur within the range or during the critical time period for optimal growth and yield of a specific crop [34].
Extreme temperatures can be a limiting factor for the production of agricultural and horticultural crops [36,37]. For vegetables, exposure to temperatures in the range of 1 °C to 4 °C above the optimal temperature for biomass growth moderately reduces yield, and exposure to temperatures more than 5 °C to 7 °C above optimal often leads to severe, if not total, production losses [34]. Plants exposed to warm nighttime temperatures during grain, fiber, or fruit production also experience lower productivity and reduced quality. Increasing temperatures cause plants to mature and complete their stages of development faster, which may alter the feasibility and profitability of regional crop rotations and field management options, including double-cropping and use of cover crops. Faster growth may create smaller plants because soil may not be able to supply water or nutrients at required rates, thereby reducing grain, forage, fruit, or fiber production. Increasing temperatures also increase the rate of water use by plants, causing more water stress in areas with variable precipitation [34]. Observations in controlled environment studies showed that maize grain yield was greatly reduced by above-normal temperatures during the grain-filling period [35]. Hatfield and Prueger [35] reported that warm temperatures increased the rate of phenological development of maize; however, there was no effect on leaf area or vegetative biomass compared to normal temperatures. The major impact of warmer temperatures was during the reproductive stage of development. Grain yield of maize was significantly reduced by as much as 80−90% from a normal temperature regime. The effects of increased temperature exhibited a larger impact on grain yield than on vegetative growth because of increased minimum temperatures. These effects were evident in an increased rate of senescence.
Pollination is one of the stages most sensitive to temperatures, and exposure to high temperatures during this period can greatly reduce crop yields and increase the risk of total crop failure [34]. Mismatches among interacting species such as pollinator-plant species can also be problematic for future crop production and could contribute to extinctions of some species [38]. Takkis, Tcheulin and Petanidou [39] found a significant effect of temperature on nectar secretion, with a negative effect caused by very high temperatures in all studied early- and late-flowering Mediterranean plants. Temperature rise expected by the end of the century will shift the average temperature beyond the optimal range for flower production and sugar produced per plant in late-flowering species. Therefore, the authors [39] expect a future decrease in nectar secretion of late-flowering species, which could reduce the amount of nectar resources available for their pollinators. The early-flowering plants should be less affected (optimal temperatures were not significantly different from future projected temperatures) and may in some cases even benefit from rising temperatures.
The climate zones are projected to move latitudinally towards the poles, particularly in the Northern Hemisphere; they are also expected to move up in altitude in mountainous regions. In the north, winter temperatures are likely to become warmer while precipitation in the south is likely to decrease [38]. Therefore, the changes in the energetic and water balance of Slovakia caused by climate change will continue affecting the beginning of individual phenological stages, their length and the duration of the vegetation period of agricultural crops. Observed changes to the maximum duration of the vegetation periods in our study can be considered as a baseline for shifting crop production areas in Slovakia in the south to the north, towards mountainous areas. This observation is also in agreement with abovementioned study of Sykes [38]. Although the future predictions show favorable conditions for growing Solanum lycopersicum L., Brassica oleracea L. var. capitata and Daucus carota L. in Slovakia and prolonging the maximum duration of the vegetation period, this potential is limited due to other constraints such as the availability of arable land in mountainous areas of Slovakia, soil water availability and functional irrigation systems availability.
Based on the presented results, climate change must be understood comprehensively and in the sense of the “United Nations Framework Convention on Climate Change”. Measures need to be sought to exploit the positive effects on the one hand and to reduce the negative effects of climate change on the other. As temperature effects are increased by water deficits and excess soil water, it is obvious that understanding the interaction of temperature and water will be needed to develop more effective adaptation strategies and offset the impacts of greater temperature extreme events associated with a changing climate [37]. Regarding horticultural production, adaptation strategies are directed mainly at the modification of vegetable growing technologies, agroclimatic zoning of special horticultural crops, crop breeding and water regime regulation, focusing on biological plant protection and integrated protection, management of the horticultural production and dissemination of knowledge on climate change.

5. Conclusions

Spatial and quantitative analysis on the maximum length of the vegetation period of Solanum lycopersicum L., Brassica oleracea L. var. capitata and Daucus carota L. using the past, present and projected air temperatures confirmed that the temperature conditions of Slovakia are changing. The results showed that:
  • the maximum vegetation period duration will extend from the south of Slovakia towards the north of the country,
  • the maximum vegetation period length of all studied crops was affected by the low air temperatures in the decade 1971–1980,
  • there is a predicted trend of prolongation of the maximum duration of the vegetation period up to 20 days (Solanum lycopersicum L., Brassica oleracea L. var. capitata) and 15 days (Daucus carota L.) in comparison with the refence decade 2001–2010,
  • there is a general trend of a gradual increase in representation of the areas (zones) with the longest maximum vegetation period after the decade 2011–2020.
Although the future predictions show favorable conditions for growing Solanum lycopersicum L., Brassica oleracea L. var. capitata and Daucus carota L. in Slovakia and prolonging the maximum duration of the vegetation period, this potential is limited by other constraints such as the availability of arable land in mountainous areas of Slovakia, soil water availability and functional irrigation systems availability. The results and map outputs of this study can be used as background material for updating the crop production areas of Slovakia and in proposals for adaptation strategies against climate change.

Supplementary Materials

The following are available online at https://www.mdpi.com/2073-4395/10/8/1110/s1, Figure S1: The quantitative representation (area in km2) of the vegetation period length for Solanum lycopersicum L., Figure S2: The quantitative representation (area in km2) of the vegetation period length for Brassica oleracea L. var. capitata, Figure S3: The quantitative representation (area in km2) of the vegetation period length for Daucus carota L.

Author Contributions

Conceptualization, J.Č., E.A. and K.Š.; methodology, J.Č., K.Š. and P.H.; software, J.Č and K.Š.; validation, J.Č. and K.Š.; formal analysis, J.Č. and K.Š.; investigation, J.Č.; resources, J.Č., V.K., L.T. and T.K.; data curation, J.Č.; writing—original draft preparation, J.Č.; writing—review and editing, J.Č., V.K., E.A. and A.T.; visualization, K.Š.; supervision, J.Č.; project administration, J.Č.; funding acquisition J.Č. and E.A. All authors have read and agreed to the published version of the manuscript.

Funding

This work was supported by the Cultural and Educational Grant Agency KEGA 026SPU-4/2020, Scientific Grant Agency VEGA 1/0747/20 and by Grant Agency of SUA in Nitra under the contract No. GA SPU 03-GASPU-2018. Further, this publication is the result of the project implementation: „Scientific support of climate change adaptation in agriculture and mitigation of soil degradation” (ITMS2014+ 313011W580) supported by the Integrated Infrastructure Operational Programme funded by the ERDF.

Conflicts of Interest

The authors declare no conflict of interest.

References

  1. Muchová, Z.; Tárniková, M. Land cover change and its influence on the assessment of the ecological stability. Appl. Ecol. Environ. Res. 2018, 16, 2169–2182. [Google Scholar] [CrossRef]
  2. Brázdil, R.; Trnka, M. Sucho v Českých Zemích—Minulost, Současnost, Budoucnost (Drought in the Czech Lands—Past, Present, Future); Centrum Výzkumu Globální Změny: Brno, Czech Republic, 2015. (In Czech) [Google Scholar]
  3. Qiu, X.; Tang, L.; Zhu, Y.; Cao, W.; Liu, L. Quantification of cultivar change in double rice regions under a warming climate during 1981–2009 in China. Agronomy 2019, 9, 794. [Google Scholar] [CrossRef] [Green Version]
  4. OECD. The Climate Challenge: Achieving Zero Emissions. 2013. Available online: http://www.oecd.org/env/the-climatechallenge-achieving-zero-emissions.htm (accessed on 20 February 2020).
  5. IPCC. Climate Change: Impacts, Adaptation and Vulnerability; Cambridge University Press: New York, NY, USA, 2007. [Google Scholar]
  6. Van Vuuren, D.P.; Meinshause, M.; Plattner, G.K.; Joos, F.; Strassmann, K.M.; Smith, S.J.; Wigley, T.M.L.; Raper, S.C.B.; Riahi, K.; de la Chesnaye, F.; et al. Temperature increase of 21st century mitigation scenarios. Proc. Natl. Acad. Sci. USA 2008, 105, 15258–15262. [Google Scholar] [CrossRef] [PubMed] [Green Version]
  7. Thomas, R.K.; Zhang, R.; Horowitz, L.W. Prospects for a prolonged slowdown in global warming in the early 21st century. Nat. Communities 2016, 7, 1–12. [Google Scholar]
  8. Bakkenes, M.; Alkemade, R.M.; Ihle, F.; Leemans, R.; Latour, J.B. Assessing effects of forecasted climate change on the diversity and distribution of European higher plants for 2050. Glob. Chang. Biol. 2020, 8, 390–407. [Google Scholar] [CrossRef]
  9. IPCC. Climate Change. In The Fifth Assessment Report (AR5) of the United Nations Intergovernmental Panel Science Basis of Climate Change; IPCC: Geneva, Switzerland, 2014. [Google Scholar]
  10. Fraga, H.; Guimarães, N.; Santos, J.A. Future Changes in rice bioclimatic growing conditions in Portugal. Agronomy 2019, 9, 674. [Google Scholar] [CrossRef] [Green Version]
  11. Detraz, N.; Betsill, M.M. Climate change and environmental security: For whom the discourse shifts. Int. Stud. Perspect. 2009, 10, 303–320. [Google Scholar] [CrossRef]
  12. Sabella, E.; Aprile, A.; Negro, C.; Nicoli, F.; Nutricati, E.; Vergine, M.; Luvisi, A.; De Bellis, L. Impact of climate change on durum wheat yield. Agronomy 2020, 10, 793. [Google Scholar] [CrossRef]
  13. Lapin, M. Niekoľko Poznámok k Trendom Globálnej A Hemisférickej Teploty Vzduchu (Several Notes to Trends of Global and Hemispheric Air Temperature). Available online: http://www.akademickyrepozitar.sk/Milan-Lapin/Niekolko-poznamok-k-trendom-globalnej-a-hemisferickej-teploty-vzduchu (accessed on 5 May 2020). (In Slovak).
  14. Pachauri, R.K. Climate and humanity. Glob. Environ. Chang. 2004, 14, 101–103. [Google Scholar] [CrossRef]
  15. Sánchez-Sastre, L.F.; Alte da Veiga, N.M.S.; Ruiz-Potosme, N.M.; Hernández-Navarro, S.; Marcos-Robles, J.L.; Martín-Gil, J.; Martín-Ramos, P. Sugar beet agronomic performance evolution in NW Spain in future scenarios of climate change. Agronomy 2020, 10, 91. [Google Scholar] [CrossRef] [Green Version]
  16. Magugu, J.W.; Feng, S.; Huang, Q.; Zhang, Y.; West, G.H. Analysis of future climate scenarios and their impact on agriculture in eastern Arkansas, United States. J. Water Land Dev. 2018, 37, 97–112. [Google Scholar] [CrossRef]
  17. Kovalenko, P.; Rokochinskiy, A.; Jeznach, J.; Koptyuk, R.; Volk, P.; Prykhodko, N.; Tykhenko, R. Evaluation of climate change in Ukrainian part of Polissia region and ways of adaptation to it. J. Water Land Dev. 2019, 41, 77–82. [Google Scholar] [CrossRef] [Green Version]
  18. Dow, K.; Downing, T.E. The Atlas of Climate Change: Mapping the World’s Greatest Challenge; University of California Press: Oakland, CA, USA, 2016. [Google Scholar]
  19. Wegren, S.K. Food security in the Russian Federation. Eur. Geogr. Econ. 2013, 54, 22–41. [Google Scholar] [CrossRef]
  20. Olesen, J.E.; Bindi, M. Consequences of climate change for European agricultural productivity, land use and policy. Eur. J. Agron. 2002, 16, 239–262. [Google Scholar] [CrossRef]
  21. Trnka, M.; Rötter, R.P.; Ruiz-Ramos, M.; Kersebaum, K.C.; Olesen, J.E.; Žalud, Z.; Semenov, M.A. Adverse weather conditions for European wheat production will become more frequent with climate change. Nat. Clim. Chang. 2014, 4, 637–643. [Google Scholar] [CrossRef]
  22. Mirgol, B.; Nazari, M.; Eteghadipour, M. Modelling climate change impact on irrigation water requirement and yield of winter wheat (Triticum aestivum L.), barley (Hordeum vulgare L.), and fodder maize (Zea mays L.) in the semi-arid Qazvin Plateau, Iran. Agriculture 2020, 10, 60. [Google Scholar] [CrossRef] [Green Version]
  23. Lobell, D.B.; Schlenker, W.; Costa-Roberts, J. Climate trends and global crop production since 1980. Science 2011, 333, 616–620. [Google Scholar] [CrossRef] [Green Version]
  24. Minďaš, J.; Páleník, V.; Nejedlík, P. Dôsledky Klimatickej Zmeny a Možné Adaptačné Opatrenia v Jednotlivých Sektoroch (The Impacts of Climate Change and Possible Adaptation Measures in the Individual Sectors); EFRA-Vedecká agantúra pre lesníctvo a ekológiu: Zvolen, Slovakia, 2011. (In Slovak) [Google Scholar]
  25. Rosenzweig, C.; Tubiello, F.N. Adaptation and mitigation strategies in agriculture: An analysis of potential synergies. Mitig. Adapt. Strateg. Glob. Chang. 2007, 12, 855–873. [Google Scholar] [CrossRef] [Green Version]
  26. Pretel, J.; Metelka, L.; Novický, O.; Daňhelka, J.; Rožnovský, J.; Janouš, D. Zpřesnění Dosavadních Odhadů Dopadů Klimatické Změny v Sektorech Vodního Hospodářství, Zemědělství a Lesnictví a Návrhy Adaptačních Opatření. (Závěrečná Zpráva o Řešení Projektu VaV SP/1a6/108/07 v Letech 2007–2011) (Refinement of Existing Estimates of Climate Change Impacts in the Water Management, Agriculture and Forestry Sectors and Proposals for Adaptation Measures. (Final Report on the Solution of the R&D Project SP/1a6/108/07 in the Years 2007–2011)); ČHMÚ: Praha, Czech Republic, 2011. [Google Scholar]
  27. Sar, T.; Avci, S.; Avci, M. Evaluation of the vegetation period according to climate change scenarios: A case study in the inner west Anatolia subregion of Turkey. J. Geogr. 2019, 39, 29–39. [Google Scholar] [CrossRef] [Green Version]
  28. Olszewski, K.; Żmudzka, E. Variability of the vegetative period in Poland. Misc. Geogr. 2000, 9, 59–70. [Google Scholar] [CrossRef] [Green Version]
  29. Špánik, F.; Valšíková-Frey, M.; Čimo, J. Zmena teplotnej zabezpečenosti základných druhov zelenín v podmienkach klimatickej zmeny (Changes of the Temperature Security of Basic Species of Vegetables under Climate Change Conditions). Acta Hortic. Regiotect. 2007, 10, 42–45. (In Slovak) [Google Scholar]
  30. Čimo, J.; Špánik, F.; Antal, J.; Tomlain, J. Biometeorológia (Biometeorology); Slovenská Poľnohospodárska Univerzita: Nitra, Slovakia, 2014. (In Slovak) [Google Scholar]
  31. Rozpondek, R.; Wancisiewicz, K.; Kacprzak, M. GIS in the studies of soil and water environment. J. Ecol. Eng. 2016, 17, 134–142. [Google Scholar] [CrossRef]
  32. Halva, J.; Kisová, A. The effect of input parameters in the modelling of DMR. Sci. Youth 2018, 13, 56–63. [Google Scholar]
  33. Valšíková-Frey, M.; Čimo, J.; Špánik, F. Zeleninártvo v podmienkach zmeny klímy (Horticulture in the Conditions of Climate Change). Meteorol. J. 2011, 14, 69–72. (In Slovak) [Google Scholar]
  34. USDA. Climate Change and Agriculture in the United States: Effects and Adaptation; USDA Technical Bulletin 1935; USDA: Washington, DC, USA, 2013. [Google Scholar]
  35. Hatfield, J.L.; Prueger, J.H. Temperature extremes: Effect on plant growth and development. Weather Clim. Extrem. 2015, 10 Pt A, 4–10. [Google Scholar] [CrossRef] [Green Version]
  36. Trnka, M.; Olesen, J.E.; Kersebaum, K.C.; Skjelvĺg, A.O.; Eitzinger, J.; Seguin, B.; Peltonen-Sainio, P.; Rötter, R.; Iglesias, A.; Orlandini, S.; et al. Agroclimatic conditions in Europe under climate change. Glob. Chang. Biol. 2011, 17, 2298–2318. [Google Scholar] [CrossRef] [Green Version]
  37. Porter, J.R.; Xie, L.; Challinor, A.J.; Cochrane, K.; Howden, M.S.; Iqbal, M.M.; Lobell, D.B.; Travasso, M.I. Food Security and Food Production Systems. In Climate Change 2014: Impacts, Adaptation, and Vulnerability. Part A: Global and Sectoral Aspects. Contribution of Working Group II to the Fifth Assessment Report of the Intergovernmental Panel on Climate Change; Field, C.B., Barros, V.R., Dokken, D.J., Mach, K.J., Mastrandrea, M.D., Bilir, T.E., Chatterjee, M., Ebi, K.L., Estrada, Y.O., Genova, R.C., et al., Eds.; Cambridge University Press: Cambridge, UK; New York, NY, USA, 2014; pp. 485–533. [Google Scholar]
  38. Sykes, M.T. Climate Change Impacts: Vegetation. Encyclopedia of Life Sciences (ELS); John Wiley & Sons, Ltd.: Chichester, UK, 2009. [Google Scholar]
  39. Takkis, K.; Tscheulin, T.; Petanidou, T. Differential effects of climate warming on the nectar secretion of early- and late-flowering Mediterranean plants. Front. Plant Sci. 2018, 9, 874. [Google Scholar] [CrossRef] [Green Version]
Figure 1. The position of meteorological stations in Slovakia used in this study.
Agronomy 10 01110 g001
Figure 2. Vegetation period of Solanum lycopersicum L. in the decades from 1961–2100: (a) 1961–1970, (b) 1971–1980, (c) 1981–1990, (d) 1991–2000, (e) 2001–2010, (f) 2011–2020, (g) 2041–2050, (h) 2071–2080, (i) 2091–2100.
Agronomy 10 01110 g002
Figure 3. Vegetation period of Brassica oleracea L. var. capitata in the decades from 1961–2100: (a) 1961–1970, (b) 1971–1980, (c) 1981–1990, (d) 1991–2000, (e) 2001–2010, (f) 2011–2020, (g) 2041–2050, (h) 2071–2080, (i) 2091–2100.
Agronomy 10 01110 g003
Figure 4. Vegetation period of Daucus carota L. in the decades from 1961–2100: (a) 1961–1970, (b) 1971–1980, (c) 1981–1990, (d) 1991–2000, (e) 2001–2010, (f) 2011–2020, (g) 2041–2050, (h) 2071–2080, (i) 2091–2100.
Agronomy 10 01110 g004
Table 1. Air temperatures delineating the beginning and end of the crop vegetation period [29].
Vegetable SpeciesStarting Temperature (°C)Ending Temperature (°C)
Solanum lycopersicum L.9.512.6
Brassica oleracea L. var. capitata9.56.5
Daucus carota L.3.07.5

