Abstract
The main goal of the study was to determine the biodiversity of bacteria and their metabolic profile in the rhizosphere of four winter wheat (Triticum aestivum L.) varieties (Hondia, Nordkap, Rotax, Tytanika) cultivated in Haplic Podzol soil in a no-tillage system. Two techniques, i.e., next generation sequencing (NGS, meta-barcoding of 16S rRNA community) and community level physiological profiling (CLPP), were applied to obtain a holistic picture of biodiversity. The basic soil chemical parameters (acidity, redox potential, carbon content, forms of nitrogen, and phosphorus) were also determined. It was found that the rhizospheric microbiome (at the genus level) of cv. Hondia and Rotax were significantly different from that present in the other cultivars studied. The CLPP technique demonstrated that microbial metabolic activity depended on both the type of substrate and wheat cultivars. Carbohydrates and carboxylic acids were the most easily utilized compounds in all rhizospheric soils. The principal component analysis (PCA) evidenced that the rhizospheric soils of Rotax and Nordkap were characterized by a higher functional activity (strong correlation with the Shannon-Wiener index, the Richness index, and utilization of hydrocarbons) than those of Hondia and Tytanika.
1. Introduction
Soils are enormous and very important reservoirs for microbial populations. The number of bacterial species per gram of uncultivated soil is estimated to range between 2000 and 8.3 million [1]. However, it is known that the highest number of microorganisms is found in the rhizosphere [2,3,4,5,6], which is defined as the soil fraction affected by the root system [2,7]. The rhizosphere is presumed to extend to 2–10 mm from the root surface [2,8]. It has been estimated that the abundance of bacterial populations in the rhizosphere may be even 10–100 times higher than in bulk soil [3]. Similarly, the microbial activity, determined by measurement of dehydrogenases or phosphatases, was usually found to be higher in the rhizosphere than in bulk soil [4,9,10]. Functional diversity in the rhizosphere was confirmed to be dependent on wheat cultivars [4,10]. Gałązka et al. [4] revealed that carbohydrates and amines/amides were the most effectively metabolized carbon sources in wheat rhizospheres, while the lowest metabolism was determined for polymers.
As shown by the number of studies, individual plant species can determine the unique microbial biodiversity and structure, especially in the rhizosphere [2,7,11,12]. Importantly, Murphy et al. [2] have indicated that rhizospheric diversity depends both on the plant species and on the time of sampling (which corresponds to the plant development phase). Therefore, in order to compare the rhizospheric biodiversity in different soils and plants properly, it is essential to choose the same plant developmental state, since fluctuations of the microbiota structure depend on this factor [2,7,13].
In general, soil bacteria play a vital role in proper soil functioning, plant productivity, and soil health [6]. Culturable and unculturable bacterial and fungal representatives contribute to the biodiversity in the rhizosphere [14], and both these forms are important for agriculture. The following bacterial genera are examples of well-recognized dominants in the rhizosphere: Acetobacter, Alcaligenes, Arthrobacter, Acinetobacter, Azotobacter, Bacillus, Burkholderia, Enterobacter, Klebsiella, Pseudomonas, Rhodococcus, Serratia, and Stenotrophomonas [15,16]. Some of them (i.e., Bacillus, Pseudomonas) are known as plant growth promoting bacteria (PGPB) [3,6,14,16,17,18]. Other bacterial representatives with a PGP effect commonly found in the soil rhizosphere include Flavobacterium, Erwinia, Chromobacterium, Micrococcus, Caulobacter, Bradyrhizobium, Mesorhizobium, Pantoea, Methylobacterium, Paenibacillus, Streptomyces, and Micromonospora, etc. [19,20,21,22].
However, most studies investigating rhizospheric biodiversity were concentrated only on determination of bacterial abundance and population structure [2,3,4,5,6,10,23]. In turn, in addition to the presentation of the microbial structure, the aim of the present study is to determine the metabolic profile and functional biodiversity providing a snapshot of the metabolic composition at a given time [6]. Next generation sequencing (NGS) ensures better understanding of both the abundance and spatial distribution of the unculturable rhizospheric community [24]. Simultaneously, recognition of catabolic fingerprinting in the rhizosphere will be extremely important, as the majority of metabolites are low-molecular-weight compounds synthesized by plants for essential functions, i.e., growth and development [6]. In this context, determination of both genetic and catabolic fingerprinting in the rhizospheres of selected T. aestivum L. cultivars is justified and needed.
Wheat (T. aestivum L.) is one of the most important food crops worldwide [25,26]. This trend was commonly known in the past and will continue in the future, because wheat is used for manufacturing of a majority of food products such as bread, cakes, noodles, or cookies [4,25,26,27]. The global importance of wheat is the best justification for undertaking studies related to recognition of the rhizospheric microbiome of the most popular wheat cultivars. The selection of best-quality cultivars is a key element of agrotechnics, as it creates a possibility of cultivation of high-quality wheat varieties in a specific field and climatic zone [4,28]. In order to restore natural soil fertility, solutions are increasingly being sought to limit chemization and, in consequence, to restore soil biodiversity [28]. The no-tillage system is a form of cropping that does not use mechanical tillage of the soil for crop establishment [29,30]. What is more, no-tillage is considered as a permanent feature allowing soil life to establish in the soil profile to its full potential and diversity [29]. In the no-tillage system, external inputs such as agrochemicals and plant nutrients of mineral or organic origin are applied optimally so that the modes of application and quantities of the chemicals cannot interfere or disrupt the biological processes [29,30]. Consequently, no-tillage facilitates good agronomy, such as timely operations, and improves overall land husbandry for rainfed and irrigated production [29]. Hence, we focused on T. aestivum cultivation in the no-tillage system in the present study. The selection of winter wheat cultivars (Hondia, Nordkap, Rotax, Tytanika) was not accidental either, as approximately 80% of the wheat-grown area in Poland vs. the 20% of spring wheat area. Moreover, each of these cultivars is characterized by a high quality of grain and the possibility of cultivation in poorer localities (less fertile soils corresponding to lower soil quality classes) and at delayed sowing terms.
We hypothesized that the diversity of rhizospheric bacteria and their metabolic activity depend on both the wheat cultivars and on soil chemistry. Thus, the main goal of the study was to recognize the biodiversity of bacteria and their metabolic profile in the rhizosphere of the four most popular Polish winter wheat varieties (Hondia, Nordkap, Rotax, Tytanika) cultivated in Haplic Podzol soil in the no-tillage system. The novelty of the paper is a combination of the two techniques (NGS, CLPP) in order to obtain a holistic picture of biodiversity in the rhizosphere soils of the four winter wheat cultivars. The knowledge possessed in this context could be important for improvements in yield, food security, soil health, and/or agricultural practices.
2. Materials and Methods
2.1. Soil Sampling and Site Description
Soil materials (according to the Food and Agriculture Organization of the United Nations—FAO classification: Haplic Podzol) were collected in October 2019 from experimental fields belonging to the Lublin Agricultural Advisory Center (LAAC) in Końskowola (Figure 1), Poland (51°24′33″ N, 22°03′06″ E).
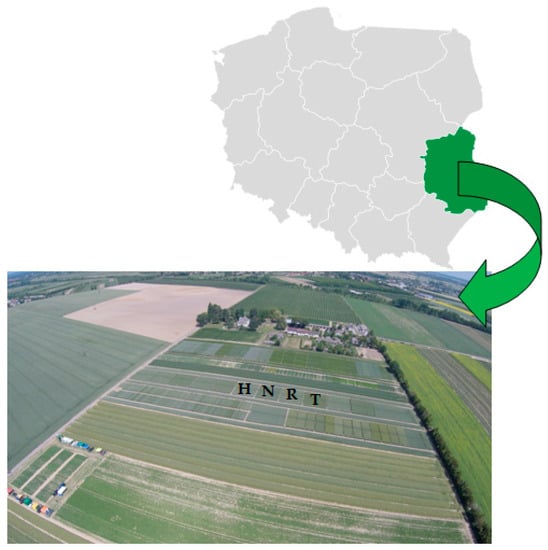
Figure 1.
Location of the study site in Lubelskie Voivodeship in Poland with an aerial view on the experimental Lublin Agricultural Advisory Center (LAAC) plots (H—Hondia; N—Nordkap; R—Rotax; T—Tytanika).
The LAAC region is characterized by a moderately continental climate with an average annual temperature of 7.6 °C and rainfall of approx. 600 mm. The study site represented the good wheat complex classified into class III A. In 2019, four commercial winter wheat (Triticum aestivum L.) cultivars were grown in the LAAC experimental fields: Hondia, Nordkap, Rotax, and Tytanika. The plot size amounted to 130 m2. All cultivars were grown in the no-tillage system. The following crops are rotated at this site: Root crops–spring cereals–legumes–winter crops–rapeseed.
Soil samples were taken from the rhizosphere (adjacent to the plant, with care so that the soil was root-free) of plants (at the BBCH 13 wheat growth stage—a stage with three leaves unfolded; the BBCH-scale describes the phenological development of wheat), pooled in individual plastic bags, and transferred into a portable refrigerator (4 °C). The wheat reached this stage at days 30–35 after sowing to the soil. The BBCH 13 stage is critical for wheat, because wheat plants usually begin wintering after this stage. From each of the four fields (layer of 0–20 cm), 25 subsamples were prepared and combined from one (biological replicate). In this way, four biological samples (each composed of 25 subsamples) were obtained. This sampling method is consistent with those proposed by Gałązka et al. [4] and Praeg et al. [31] and dedicated for rhizospheric soils. In laboratory conditions, the fresh soil samples were immediately sieved through a 2-mm sieve, and shortly (max. 24 h) stored at 4 °C in sterile tubes until DNA extraction and community level physiological profiling (CLPP) analysis.
In the laboratory conditions, three independent repetitions of each biological sample were separated and each repetition was analyzed separately.
For soil sampling prior to the planting, we followed the recommendations and sampling pattern included in the Polish Norm Rules dedicated to soil sampling for chemical and biological purposes [32]. Briefly, 10 × 10 m squares were chosen in each of the four investigated study sites (the same from which the rhizosphere soil was collected during the BBCH 13 wheat growth stage), and 25 random soil samples were taken from the top layer (0–20 cm) using a 2.5-cm-diameter auger. Single samples were combined and homogenized into one sample to obtain the most representative soil material for each of the four investigated sites.
2.2. Soil Chemical Properties
The soil acidity (pH) and redox potential (Eh) were determined in triplicate from a 2:1 soil suspension [33] in distilled water using a multifunctional potential meter (Hach Lange, Poland). The concentrations of nitrogen forms (NH4-N, NO3-N, NO2-N) were measured colorimetrically [33] using an Auto Analyzer 3 System (Bran+Luebbe, Germany). Prior to the analysis, examined nutrients were extracted using zwater (35 g fresh soil and 100 mL water). PO4-P was analysed with ammonium molybdate [34]. NH4-N and NO3-N were measured using, respectively, hydrazine sulphate and salicylate as a colour marker. The NO2-N analysis were based on the latter method excluding hydrazine sulphate. Obtained results have been corrected for the amount of soil sample and expressed as mg per kg of fresh soil. Total organic carbon (TOC) was determined using an automatic carbon analyzer TOC-VCSH SSM 5000A (Shimadzu, Kyoto, Japan). Soil samples (150 mg) were pulverized, dried prior to analysis, and then combusted at 900 °C in a column containing a platinum and cobalt oxide catalyst [35]. Under these conditions, all carbon compounds were converted into carbon dioxide and detected by an infrared detector (NDIR). Each TOC recording was realized in triplicate.
2.3. Isolation of DNA and Next Generation Sequencing
DNA was extracted (in triplicate) from the four biological samples of rhizospheric soils within 24 h after soil sampling. To this end, a DNeasy Power Lyzer Power Soil commercial kit was applied (Qiagen Group, Germantown, MD, USA). Shortly, 0.25 g of each rhizospheric soil was used and each step was carried out according to the manufacturer’s Quick-Start Protocol (Qiagen Group, Germantown, MD, USA).
Meta-barcoding or 16S rRNA community profiling analysis was performed based on the hypervariable V3–V4 region of the 16S rRNA gene. Primers 341F and 785R were applied for amplification of the selected region and preparation of the library [36]. The PCR reaction was carried out using a Q5 Hot Start High-Fidelity 2X Master Mix (New England Biolabs Inc., Ipswich, MA, USA). The PCR conditions were as follows: 95 °C for 3 min, 30 cycles of 95 °C for 30 s, 53 °C for 30 s, and 72 °C for 1 min, with a final extension at 72 °C for 7 min [33]. Next generation sequencing was performed by Genomed S.A. (Warsaw, Poland) on a MiSeq sequencer (Illumina, San Diego, CA, USA) in paired-end (PE) technology, 2 × 250 nt, using an Illumina v2 kit (San Diego, CA, USA).
The preliminary analysis of the data obtained was carried out with a MiSeq Reporter (MSR) v2.6 software (Illumina, San Diego, CA, USA). It consisted of two steps: (1) Automatic demultiplexing of samples, and (2) generating fastq files containing raw read. Bioinformatic analysis ensuring classification of the readings at the taxonomic genus level was carried out with the QIIME software package [37] based on the GreenGenes v13_8 reference sequence database [38]. The analysis consisted of the following stages: (1) Deletion of adapter sequences followed by removal of low quality sequences (quality < 20, minimum length 30)—cutadapt software [39], (2) combination of paired sequences with the use of the fastq-join algorithm [40], (3) clustering based on the selected base of the reference sequences with application of the uclust algorithm [41], (4) removal of chimeras with the ChimeraSlayer algorithm, (5) removal of cross-sample singletons and doubletons defined as sequences that occurred only once (singletons) or twice (doubletons) among all samples [40,41], and (6) assigning the taxonomy to the selected base of reference sequences with the uclust algorithm [38,41]. The sequences were clustered based on a 97% similarity threshold.
The identified sequences are available under accession number PRJNA622671 in the GenBank database (NCBI, https://www.ncbi.nlm.nih.gov/sra/PRJNA622671).
2.4. Community Level Physiological Profiling (CLPP) Analysis Using Biolog EcoPlates
The community level physiological profiling (CLPP) analysis expressing the catabolic fingerprinting of soil microbial communities was performed using Biolog EcoPlates (Biolog Inc., Hayward, CA, USA). The metabolic potential of soil microbial communities was determined with the use of 31 different carbon sources representing five groups (amines and amides, amino acids, carbohydrates, carboxylic acids, and polymers) [42]. Briefly, 1 g of soil was weighed, transferred into conical flasks holding 99 mL of sterile 0.9% NaCl each, and vortexed for 30 min at 150 rpm (25 °C). Afterwards, the samples were cooled (30 min, 4 °C), transferred into each of the wells in the EcoPlate, and incubated in the dark (28 °C for 144 h). The experiment was carried out in three replications for each soil sample.
The most intensive metabolic activity was observed after 120 h of incubation; therefore, the results obtained at this time are presented. The results were read every 24 h on the MicroStation ID system. Reduction of colorless tetrazolium chloride to red formazan (λ = 590 nm) was applied as a method for determination of the extent to which carbon sources were utilized by the soil microbial communities. The activities of soil microorganisms are based both on all carbon sources and on grouped sources defined as amines and amides, amino acids, carbohydrate, carboxylic acid, and polymers. The results are presented as a percentage of utilization of individual compounds divided into these groups. The results are also presented as a heat map of carbon utilization patterns of 31 different substrates located on the Biolog EcoPlates incubated for 120 h from rhizospheric soil samples. They are also expressed in terms of the functional diversity of rhizosphere soils as average well-color development (AWCD) and the Shannon-Wiener (H’), Simpson (D), Richness (R), and Evenness (E) indices [43].
2.5. Statistical Analyses
Statistical analyses were performed using the STATISTICA.PL package (10) (Stat. Soft. Inc., Tulsa, OK, USA). The collected data were subjected to analysis of variance (ANOVA) for comparison of means, and significant differences were calculated using the post-hoc Tukey’s honest significant difference (HSD) test at a p < 0.05 significance level. The results were also subjected to principal component analysis (PCA) to determine the relationship between the biodiversity indices, carbon sources, and rhizospheric soils originating from the different winter wheat cultivars.
3. Results
3.1. Chemical Properties of Rhizospheric Soils
The chemical features of the rhizospheric soils are shown in Table 1. Although all wheat varieties were cultivated on the same soil type (Haplic Podzol), in the same no-tillage system, and on adjacent experimental plots, their chemical properties varied.

Table 1.
Chemical composition of rhizospheric soils from four wheat cultivars. Small letters in the upper index mean significant differences in the parameters between the wheat cultivars (Tukey’s mean separation test, p < 0.05), (n = 3).
For better recognition of the effect of the wheat rhizosphere on soil chemistry, the same variables were determined before seeding the wheat in the four field plots (time 0). These results are summarized in Appendix A (Table A1). The comparison of the tested factors clearly shows the largest impact of the wheat cultivars on pH. The other parameters rather remained at similar levels both before and after seeding (Table A1, Table 1).
Soil acidity (pH) was close to neutral (6.48–7.23) in the rhizospheres of Nordkap, Rotax, and Tytanika cv., but acidic in the Hondia rhizosphere. A similar trend was observed in soil before seeding, where pH ranged from 5.20 to 7.36 (Table A1). The redox potential (Eh) oscillated from 348.73 to 403.30 mV for the Hondia and Tytanika rhizospheric soils, respectively.
Before seeding, the soil Eh was at the level from 341.21 to 399.40 mV (Table A1). However, in each of the analyzed experimental variants, Eh was above 300 mV, which indicates that the studied soils are well oxygenated. The total organic carbon (TOC) content had the highest value in the rhizospheric soils of Hondia cv. (1.13%), a similar level (0.71–0.79%) in the rhizospheres of Rotax and Nordkap, and the lowest level in the Tytanika rhizosphere (Table 1). An analogical trend was confirmed in the analyzed soils before seeding when the TOC content ranged from 0.60 to 1.09% (Table A1).
Nitrate nitrogen (NO3-N) was the dominant biogenic form of nitrogen, with a concentration ranging from 3.11 to 4.73 mg/kg (Table 1) and 3.07–4.83 mg/kg (Table A1). Ammonium nitrogen (NH4-N) subdominated with the level of 0.49–1.64 mg/kg and 0.45–1.59 mg/kg (Table 1 and Table A1, respectively), whereas the lowest content (0.09–0.24 mg/kg) was found in respect to nitrite nitrogen (NO2-N) and in the rhizosphere and soil before seeding (0.08–0.11 mg/kg). The rhizospheric soils were rich in phosphorus (P-OLSEN), with a concentration of 3.75–5.49 mg/kg and 3.79–5.38 mg/kg in the soil before seeding (Table 1, Table A1).
3.2. Biodiversity in the T. aestivum Rhizosphere—Taxonomic Phylum and Classes Level
A total of 875,513 sequences were obtained in this study. After filtering for analysis, 450,911 remained, meaning that ca. 48% did not meet the assumed criteria and were removed during restrictive bioinformatic data processing (Table A2). The rarefaction curves for the analyzed samples are illustrated in Figure A1. The rarefaction curves plateaued for each sample studied, indicating that the sequencing depth was adequate to capture the entire bacterial rhizospheric community.
Based on the NGS results, the dominant bacterial phyla in the selected cultivars of the T. aestivum L. rhizosphere were recognized (Figure 2).

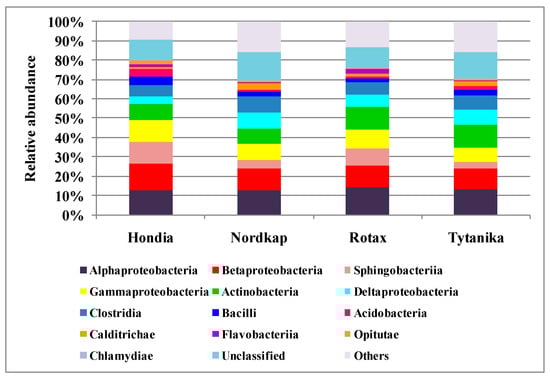
Figure 2.
Main phyla and classes of bacteria identified in the rhizospheric soil of the four cultivars of Triticum aestivum L.
Proteobacteria (38–42% of all sequences) dominated in the rhizsopheric soil, irrespective of the wheat variety (Figure 2). Bacteroidetes (ca. 4–13% of the sequences), Firmicutes (ca. 8–11% of the sequences), and Actinobacteria (ca. 9–15% of the sequences) were the subdominants. The relative abundance of Proteobacteria in the rhizosphere was similar, regardless of the wheat cultivar. In regard to the subdominants, a typological differentiation was noted depending on the cultivated variety. The highest number of Bacteroidetes was detected in the rhizospheres of Hondia and Rotax (13.14 and 10.86%, respectively), while much lower levels were determined in the Nordkap (4.77%) and Tytanika (3.79%) rhizospheres. The relative abundance of Firmicutes was the lowest in the Rotax rhizosphere (8.7%), whilst their similar level was noted in the soils collected from the other three wheat varieties (10–11%). Similarly, the number of Actinobacteria was dependent on the wheat variety (Figure 2). It was shown that Actinobacteria preferred the rhizospheres of Rotax (13.85%) and Tytanika (15.14%) rather than Hondia (9.04%) or Nordkap (9.44%). The relative abundance of the other bacterial phyla shown in Figure 2 was significantly lower than those discussed above and, as a rule, did not exceed 5% of the identified sequences, but often reached much lower values. For example, the number of Verrucomicrobia was at the level of 5% of the identified sequences in the Nordkap and Rotax rhizospheres. It reached a lower threshold in the other two cultivars: 3.74% (Hondia) and 4.35% (Tytanika). The levels of Acidobacteria ranged from 1.8% (Rotax rhizosphere) to 4.64% (Hondia rhizosphere), while Nitrosospirae representatives preferred the Hondia rhizosphere (3.87%) and were the least abundant in the Rotax rhizospheric soils (0.67%).
Moreover, significant variations in the relative abundances at the taxonomic phylum level between the wheat cultivars were tested (see Figure A2 in Appendix A). We found that the relative abundances of dominating phyla mostly depended significantly on the wheat cultivars. In the rhizosphere of Hondia, a significantly higher abundance of the following phyla was evidenced: Bacteroidetes, Acidobacteria, Chloroflexi, Armatimonadetes, and Crenarchaeota (Figure A2). Representatives of Calditrichaeota and Tenericutes more frequently inhabited the rhizosphere of Nordkap than that of the other studied cultivars. A significantly higher abundance of Proteobacteria, Verrucomicrobia, and Planctomycetes was noted in the Nordkap rhizosphere, whereas the rhizosphere soil of Tytanika promoted the presence of Actinobacteria, Firmicutes, Gemmatimonadetes, Cyanobacteria, and Defferibacteres (Figure A2). No significant differences in the abundances in the aforementioned cultivars were confirmed only in the case of Verrucomicrobia (Nordkap, Rotax cv.), Armatimonadetes and Planctomycetes (Rotax, Tytanika cv.), Crenarchaeota and Defferibacteres (Nordkap, Rotax, Tytanika), Cyanobacteria (all cultivars), and Tenericutes (Nordkap, Rotax cv.) (Figure A2).
At the lower taxonomic level, it was shown that the structure of the winter wheat rhizospheric bacteria was dominated by two classes: Alphaproteobacteria and Betaproteobacteria, accounting for 12–14% and 8–11% of all detected sequences, respectively (Figure 2).
Bacterial representatives of the Sphingobacteriia class turned out to be subdominants. Their highest relative abundance was found in the Hondia (11.49%) and Rotax (8.4%) rhizospheres, while substantially lower numbers were detected in Nordkap (4.12%) and Tytanika (3.29%). The rhizosphere of Hondia exhibited a high level of Gammaproteobacteria (11.13%). In turn, their numbers in the rhizospheres of the three other wheat cultivars did not exceed 10%, amounting to 9.85% (Rotax), 8.67% (Nordkap), and 7.28% (Tytanika).
The Actinobacteria class dominated in the Rotax and Tytanika rhizospheres (11.98–12.11%). The size of Deltaproteobacteria and Clostridia varied as well depending on the wheat variety. The representatives of the former class most often inhabited the rhizospheres of Nordkap and Tytanika (8.38 and 7.46% of the sequences, respectively), while the latter class prevailed in the Nordkap (8.24%) and Tytanika (7.59%) rhizospheres. The relative abundance of the other classes (Bacilli, Acidobacteria, Calditrichae, Flavobacteriia, Opitutae, and Chlamydiae) presented in Figure 2 did not exceed 5% of the identified sequences.
As in the case of the phyla, the significant variations in the relative abundances at the taxonomic class level between the wheat cultivars were verified (see Figure A3, Appendix A). A significant effect of the wheat cultivar on the identified class abundances was evidenced (Figure A3), with two exceptions only: Alphaproteobacteria (Hondia, Nordkap cv.) and Opitutae (Nordkap, Tytanika cv.). Furthermore, the rhizosphere of Hondia was found to induce an increase in the abundance of the following classes: Betaproteobacteria, Sphingobacteriia, Gammaproteobacteria, Bacilli, Acidobacteria, and Opitutae (Figure A3). Alphaproteobacteria dominated in the Rotax rhizosphere, whereas the Nordkap rhizosphere seemed to be an optimal niche for Deltaproteobacteria, Clostridia, and Calditrichae. Actinobacteria and Chlamydiae displayed the highest abundance in the rhizosphere of Tytanika (Figure A3).
3.3. Biodiversity in the T. aestivum Rhizosphere—Taxonomic Genus Level
At the genus level, 600 representatives of bacteria were identified. Since the abundance of most of them was low (below 3.5% of the detected sequences), Table 2 lists the top 20 of the 600 classified genera. Genera classified at the top represented over 10% of the sequences.
Table 2.
Variability of the top genera detected in the rhizospheric soils of the four T. aestivum L. cultivars (+ means the presence of the genus, − means the absence of the genus).
Most of the top genera were identified in the rhizospheres of Rotax and Tytanika (8), seven genera were detected in the Hondia rhizosphere, and six were present in Nordkap. As demonstrated by the data in Table 2, the community structure was determined by the wheat variety. Both common and unique genera were detected in the rhizospheres of the studied wheat cultivars. It was found that the Hondia rhizospheric microbiome was significantly different from the other analyzed varieties. It comprised the genera Aquicella, Chitinophaga, Legionella, Nitrosospira, and Segetibacter, whose presence was not detected in the rhizospheres of the other varieties. Only two genera: Edaphobacter and Vogesella proved to be common in the rhizospheres of Hondia and Tytanika.
Two unique bacterial genera Desulfovibrio and Pedosphaera were noted in the Nordkap rhizosphere (not found in the other varieties), while the other top genera were also characteristic for the Rotax and Tytanika rhizospheres (Table 2).
Three genera, i.e., Cellvibrio, Flavobacterium, and Pedobacter were considered characteristic of the Rotax rhizosphere, whilst Gemmatimonas, Rhodoplanes, and Saccharopolysphora were common in the Tytanika rhizosphere.
The genera Chondromyces and Cuthonobacter were classified as common, as their presence was shown in the rhizospheres of as many as three wheat varieties: Nordkap, Rotax, and Tytanika, similar to the genus Vogesella, which was present in the rhizospheres of all analyzed wheat varieties.
3.4. Beta-Diversity in the T. aestivum Rhizosphere—Taxonomic Species Level
The NGS analysis helped identify the prevailing bacterial species in the rhizospheres of the tested wheat cultivars (Figure 3).
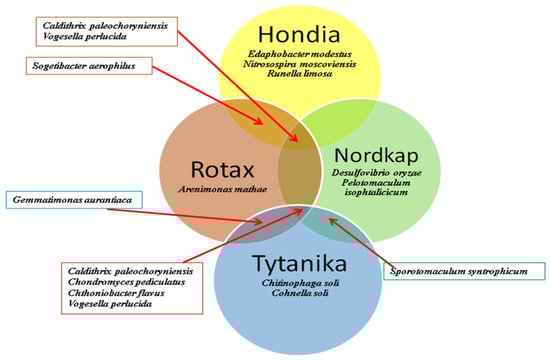
Figure 3.
Beta-diversity of common and specific bacterial species detected in the rhizospheric soils of the four T. aestivum L. cultivars.
The beta-diversity analysis demonstrated that the rhizosphere soil of each variety was characterized by unique bacterial species, but it was also possible to select common species. The main criteria of selection included the abundance of sequences (as in the case of Table 2 presented top 20 genera; in Figure 3, we only showed the species with a sequence abundance over 10%). Consequently, three unique species were assigned to the Hondia rhizosphere (Edaphobacter modestus, Nitrosospira moscoviensis, and Runella limosa). Two were found in the Tytanika (Chitinophaga soli, Cohnella soli) and Nordkap (Desulfovibrio oryzae, Pelotomaculum isophtalicicum) rhizospheres, and one was unique to the Rotax rhizosphere (Arenimonas mathae).
Calditrix paleochoryniensis turned out to be a common species in the Hondia, Rotax, and Nordkap rhizospheres, while Sogetibacter aerophilus was abundant in the Hondia and Rotax rhizospheres (Figure 3). Similarly, the presence of Sporotomaculum syntrophicum was confirmed in the rhizospheric soils of the Nordkap and Tytanika cultivars, while Gemmatimonas aurantiaca inhabited soils around the roots of both Rotax and Tytanika. Three common species were also found in the Tytanika, Nordkap, and Rotax rhizospheres (Chondromyces pediculatus, Chthoniobacter flavus, Caldithrix paleochoryniensis). In turn, Vogesella perlucida was the only species identified in the rhizospheres of each of the examined wheat varieties.
3.5. Catabolic Activity in the Rhizosphere of Four Selected T. aestivum Cultivars—Community Level Physiological Profiling (CLPP)
Since the highest activity in the utilization of different carbon compounds in all analyzed soils was found after 120 h of incubation, we focused on the presentation of data from this time point. The microbial community catabolic diversity (functional diversity) evaluated by substrate utilization in the Biolog EcoPlate incubated for 120 h is presented in Figure 4.
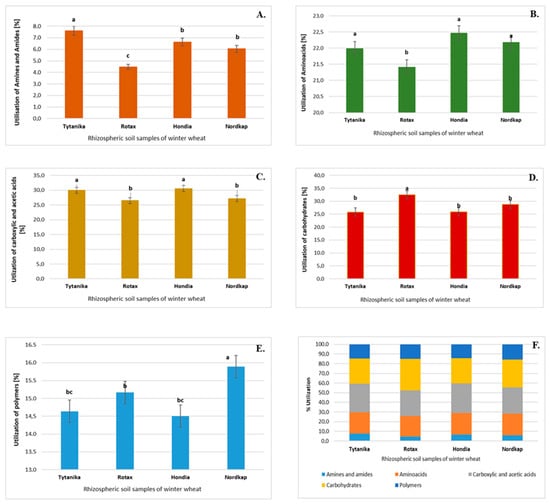
Figure 4.
Total carbon source utilization response (%) in the rhizospheric soils of the Hondia, Nordkap, Rotax, and Tytanika cultivars for the different carbon substrate groups after 120-h incubation. Treatment means separated by different letters are significantly different (Tukey’s mean separation test, p < 0.05), (n = 3). (A) Amines and amides, (B) amino acids, (C) carboxylic and acetic acids, (D) carbohydrates, (E) polymers, (F) percent of total carbon source utilization in soil.
The rhizospheric soil of Tytanika was characterized by the highest utilization of amines and amides (Figure 4A). This difference was statistically significant compared to the other rhizospheric soils of the T. aestivum varieties. In contrast, amines and amides were the least utilized by microorganisms present in the rhizosphere soil of Rotax.
The highest and significant utilization of amino acids was found in the rhizosphere soil of Hondia and Nordkap (Figure 4B), whereas the lowest level of utilization (as in the case of amines and amides) was detected in the Rotax rhizosphere.
The carboxylic acid utilization reached maximal values in the rhizosphere soil of the Hondia and Tytanika cultivars (Figure 4C), whereas the highest and significant percentage of the use of carbohydrates was found in the Rotax rhizosphere (Figure 4D).
Finally, it was indicated that bacteria inhabiting the Nordkap rhizospheric soils were characterized by the highest percentage of utilization of polymers (Figure 4E).
It is possible to conclude that carbohydrates, carboxylic acids, and amino acids were the most easily utilized compounds of all the 31 carbon sources in all rhizosphere soils, whilst the utilization of polymers with amines and amides was the least efficient (Figure 4F).
Based on the results obtained with the Biolog EcoPlate method at 120 h of the experiment, a heat map was constructed (Figure 5). As shown below, the heat map also facilitated identification of differences in the preferences of the microorganisms for the utilization of the carbon sources.
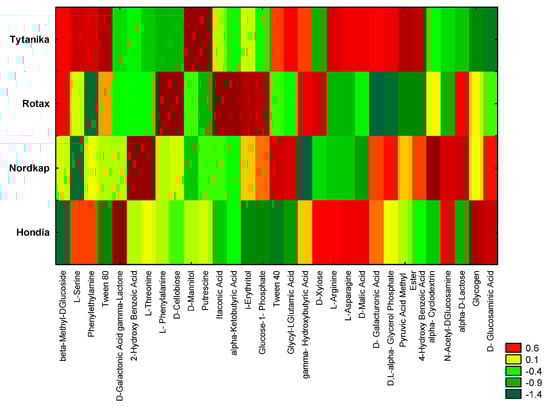
Figure 5.
Heat map of carbon utilization patterns of 31 substrates from the Biolog EcoPlates incubated for 120 h from rhizospheric soil samples. The results are shown as standardized data of absorbance measurement at a wavelength of 590 nm (higher value means higher functional activity).
The highest metabolic activity at 120 h was observed in the rhizospheric soils from the Tytanika and Rotax cultivation, whereas a slightly lower catabolic activity was noted in the Nordkap and Hondia rhizospheres (Figure 5).
Nevertheless, these differences depended on the type of metabolized substrate and the wheat cultivars. L-Serine, beta-Methyl-DGlucoside, phenylethylamine, D-Mannitol, Putrescine, and Pyrulic Acid Methyl Ester were characterized by the highest utilization rate in the rhizoshere soil of Tytanika. In turn, Glycogen and D-Glucosaminic Acid were used in the rhizoshere soil of Tytanika in the lowest degree (Figure 5).
Based on the use of 31 carbon sources in the Biolog EcoPlate method after 120 h of incubation, soil functional diversity indicators were calculated (Table 3). The soils originating from the Rotax (H’ = 3.287) and Nordkap (H’ = 3.300) wheat rhizospheres were characterized by the highest Shannon-Wiener functional diversity indicator values in contrast to the Hondia rhizosphere, where the lowest functional diversity index (H’ = 3.247) was recorded. Similarly, the richness (R) index reached maximal values in the Rotax and Nordkap rhizosphere, where it amounted to 28.87 and 29.00, respectively. However, the evenness (E) index achieved the highest level in the Tytanika (E = 0.984) and Nordkap (E = 0.980) rhizospheres. In the case of the AWCD indicator, there were no statistically significant differences between the cultivars.
Table 3.
Functional diversity indices evaluated by substrate utilization at 120 h in the Biolog EcoPlate calculated on data from all the 31 carbon sources (±SD). Different letters indicate significant differences between the cultivars (p < 0.05, n = 3).
The selected indicators of the soil microbial functional community accounted for 88.73% of the biological variability in the soils (Figure 6).
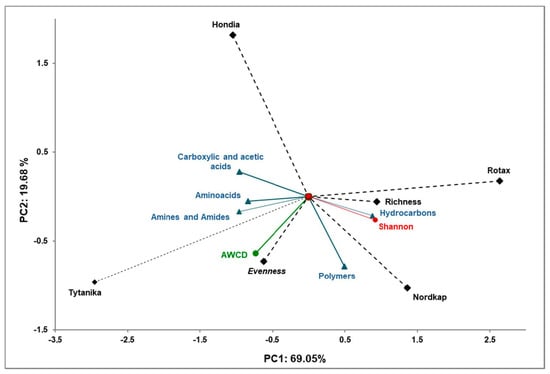
Figure 6.
Principal component analysis of the functional biodiversity indices of Biolog EcoPlates incubated for 120 h from the rhizospheric soil samples and the four winter wheat cultivars.
The principal component of the PCA analysis showed strong correlations between the selected indicators obtained from Biolog EcoPlates methods (amino acids, amines and amides, carboxylic and acetic acids, hydrocarbons, polymers, AWCD, Shannon-Wiener index, Richness and Evenness indices). Positive correlations have been shown between the analyzed indicators of soil functional diversity and the main groups of compounds in the Biolog EcoPlate analysis.
The correlations of the carbon source with the first (PCA1) and second (PCA2) components are shown in Table A3. The carbon sources that exhibit statistically significant correlations could be biochemical markers characteristic for the rhizospheric soil of the different winter wheat cultivars. A similar division was obtained in the analysis for the carbon utilization patterns of the substrates located on the Biolog EcoPlates.
The PCA evidenced that the soils collected from the rhizospheres of Rotax and Nordkap were characterized by higher functional activity (strong correlation with the Shannon-Wiener index, the Richness index, and utilization of hydrocarbons). In turn, the soil samples collected from the rhizosphere of Hondia and Tytanika were characterized by lower metabolic activity in comparison to Rotax and Nordkap. However, in this case, a strong correlation of amino acids, amines and amides, and carboxylic and acetic acids was found.
3.6. Correlations between Chemical Factors and Dominant Bacterial Phyla Identified in Rhizospheres of Four Wheat Cultivars
In order to verify the effect of rhizospheric soil chemistry on the microbial community structure, correlations between chemical factors and dominant (representing more than 5% of sequences) bacterial phyla were determined (Table 4). It was found that pH was the most important soil factor affecting the bacterial phyla structure, as its significant impact was confirmed in five identified phyla: Proteobacteria and Actinobacteria (positive correlations) as well as Bacteroidetes, Acidobacteria, and Verrucomocrobia (negative correlations, Table 4).
Table 4.
Relationships between chemical factors and dominant bacterial phyla (p < 0.05, n = 3; *, **, *** indicate significance at 5, 1, and 0.1% levels, respectively).
Secondly, a significant effect was evidenced in relation to the TOC content and its impact on the abundance of four bacterial phyla: Bacteroidetes and Acidobacteria (positive correlations) as well as Actinobacteria and Verrucomicrobia (negative correlations). Thirdly, the NH4-N content seemed to be an important factor affecting the abundance of three phyla: Proteobacteria, Bacteroidetes (positive correlations), and Firmicutes (negative relationship). Redox potential and nitrite nitrogen influenced the abundances of two phyla: Bacteroidetes and Firmicutes as well as Proteobacteria and Firmicutes, respectively (Table 4). The lowest (but significant) effect was noted in respect to NO3-N, and P-Olsen positively influenced the abundance of Actinobacteria (Table 4).
4. Discussion
The biodiversity and metabolic profile of bacteria inhabiting the rhizospheres of four most popular Polish winter wheat varieties (Hondia, Nordkap, Rotax, Tytanika) cultivated in Haplic Podzol soil in the no-tillage system were investigated in this study.
In the first stage of the experiment, chemical soil characteristics were determined to find differences in soil chemistry between the rhizospheric soils of four winter wheat cultivars. It has commonly been reported that soil chemical conditions are strong determinants of the composition of the soil microbial community [2,4,34,44,45].
Soil acidity (pH) and carbon content are known to be the most crucial factors modifying the number of soil microbial populations and nutrient availability [4,6,23,33,46,47]. In the present study, pH was close to neutral in the rhizosphere soils of Nordkap, Rotax, and Tytanika. Noteworthy, neutral pH is considered optimal for the growth and development of a majority of soil bacteria [23,33,34,35,45,46,47]. However, the rhizospheric soil in the Hondia cultivation seemed to be acidic (pH = 3.87), which may have limited the functional diversity [33,34,35,46]. Nevertheless, the highest carbon content was detected in this variant. Additionally, the lowest functional diversity index (Table 3) was recorded in the Hondia rhizosphere, which may be connected with the low pH value. A significant effect of pH on the structure of rhizospheric bacterial phyla was evidenced in this study (Table 4). It should be also emphasized that in the Hondia rhizosphere a reduction in soil pH of ~2 units, not seen in other wheat species were stated. This fact could be treated as an additional driver altering on community structure.
Nitrogen (N) is an essential element for microbial and plant life [37,48,49]. Nitrate (NO3-N) and ammonium (NH4-N) were the dominant forms in all the studied soil samples, regardless of the wheat variety (Table 1). This is in agreement with other findings, which demonstrated predominance of these forms in agriculturally exploited soils [33,50,51] resulting from fertilization. However, the statistical analysis performed in this study revealed a significant effect of nitrite nitrogen on the representatives of the bacterial phyla (Proteobacteria, Bacteroidetes, Firmicutes, Acidobacteria), as well as ammonium nitrogen (Proteobacteria, Bacteroidetes, Firmicutes, Table 4). Phosphorus (P) is a life-supporting nutrient often applied in fertilizers, and its supplementation in soil is extremely important for enhancement of agricultural production [52]. The P content in the studied soils ranged from 3.75 to 5.49 in the Nordkap and Tytanika rhizospheres, respectively (Table 1). However, the significant effect of the presence of P in the rhizospheric soil was related only to the abundance of Actinobacteria (Table 4).
The second stage of the experiment was concentrated on genetic fingerprinting determination via NGS tools in the rhizospheric soils sampled from the different winter wheat cultivars. The NGS technique provided new knowledge of a rhizospheric bacterial group called viable but not cultivable (VBNC), i.e., those in the state of very low metabolic activity and not dividing, but alive and having the ability to become culturable once resuscitated [53]. However, it should be emphasized that, besides advantages, NGS has many limitations, and some of the cultivable bacteria cannot be recognized based on primer mismatches, or diversity may sometimes be overestimated. In the current study, we used well-known universal and recommended primers for identification of soil bacteria [36]. We found that the wheat cultivar (and mostly soil pH) influenced the microbial structure (at all taxonomic levels), with one exception, i.e., the abundance of Proteobacteria seemed to be independent of the wheat variety, as these bacteria were dominant in each of the studied rhizospheric soils (Figure 2). The dominance of Proteobacteria in the soil environment was also confirmed by other researchers [33,34,35,54,55]. A similar trend (dependence of the abundance on wheat variety) was observed at the class level (Figure 2). Wood et al. [56] found that Actinobacteria, Bacteroidetes, and Alphaproteobacteria were dominants in the rhizosphere of Carpobrotus rossii (Haw.) Schwantes. This is in agreement with our findings, as these bacterial representatives were also abundant in the T. aestivum rhizosphere (Figure 2). However, the highest biodiversity in the current study was found at the taxonomic genus level, where 600 bacterial representatives were metagenomically identified. Due to the multitude of the results, we focused on the numbers of the top 20 genera that reached a sequence abundance over 10%. The findings on the biodiversity at the genus level allow a conclusion that rhizospheric biodiversity is determined by the wheat cultivar (Table 2).
We have evidenced that the Hondia rhizospheric microbiome is significantly different from the other analyzed varieties. This may be connected with the acidic pH. We want to emphasize that the soil on which Hondia was grown was the most acidic before the planting of Hondia (Table A1); consequently, the active bacterial community in this soil most likely differed strongly from the others beforehand. Gałązka et al. [4], who also studied the Hondia microbiome with conventional methods, noted the lowest number of bacteria in the rhizosphere of this cultivar in comparison to other wheat varieties: Bellisa, Pokusa, Fidelius, Estivus, Arktis, Rokosz, Markiza, Linus, and Jantarka. This observation [4] indicates the microbiological distinctness of the Hondia wheat rhizosphere, which is in agreement with the NGS analysis performed in the present work. However, it is difficult to compare our results with reports of other researchers, as no similar studies on Hondia, Rotax, Nordkap, and Tytanika rhizospheric soils have been carried out.
Generally, the presence of Flavobacterium, Pedobacter, and Cellvibrio (here found as characteristic genera for the Rotax rhizosphere) has been reported in the soil rhizospheres of different plants [3,5,6,57]. The presence of Aquicella identified in the Hondia rhizosphere was also detected in the rhizosphere of potato [58], whilst Chitinophaga and Legionella were identified in the rhizospheres of rice and banana, respectively [59,60,61]. The presence of Nitrosospira and Segetibacter was confirmed by Kavamura et al. [60] in the rhizospheric soil of T. aestivum cv. Cadenza, which is consistent with our results, i.e., the identification of these genera in the Hondia rhizosphere. Edaphobacter, mainly associated with alpine and forest soils [62], was identified in soils taken from the Hondia and Tytanika rhizospheres. In the rhizospheric soils of Nordkap, Desulfovibrio and Pedosphaera were identified as unique bacterial genera. According to the literature database, Desulfovibrio is a characteristic bacterial genus in paddy field soils where it is responsible for oxidation of typical fermentation products and is detected in wetland environments as a predominant rhizoplane bacterial genus [63]. Pedosphaera was identified in Poa annua putting green soil together with Gemmatimonas and Rhodoplanes [64], which occurred in the Tytanika rhizospheres examined in our study. Saccharopolysphora was found to be present in wheat-field soils [65], which is consistent with our observations. In the present study, Vogesella seemed to be the most common bacterial genus, as it was present in all four rhizospheric soils studied. Interestingly, we have not found confirmation of the presence of this genus in the rhizosphere of wheat, except the confirmation of its presence in the rhizosphere of saline tolerant pokkali rice [66]. The NGS identification of the genera in the rhizosphere of the studied wheat varieties indicates their origin from soil. In our previous paper, we examined the structure of endophytic bacteria inhabiting different parts (endosperm, germ, roots, coleoptiles, and leaves) of Hondia [67]. A comparison of the results from the present and previous studies shows that none of the identified genera detected in the rhizosphere of Hondia was present in any of the analyzed parts of plants. This indicates that the soil microbiome inhabiting the Hondia rhizosphere and its core endophytic microbiome differ.
The community level physiological profile (CLPP), i.e., a rapid screening method for detecting differences among different treatments, was applied for metabolic characterization of the microbial communities [43,68] in the four rhizospheric habitats. There were differences in the metabolism of carbon sources depending on the wheat variety, which confirms the diversity of the structure of bacteria inhabiting the rhizosphere of wheat (evidenced by the NGS analysis) and, consequently, their other metabolic activity. It was found that carboxylic acids and carbohydrates were the most preferred carbon sources used by the microorganisms present in all studied soil samples (Figure 4). In turn, the highest efficiency of utilization of amines and amides was noted in the Tytanika rhizosphere, amino acids were most efficiently metabolized by microorganisms inhabiting the Hondia rhizosphere, whereas the highest level of utilization of polymers was recorded in the Nordkap rhizospheric soil. The highest metabolic activity in respect to carbohydrate utilization was also confirmed by Gałązka et al. [4] in rhizospheric soils of different wheat cultivars. It is often assumed that soil microbial communities are shifted by agricultural management practices and seasons [10,23]. Additionally, wheat cultivars modify both the microbial structure and the catabolic activity in the rhizosphere.
5. Conclusions
The combination of the two techniques: NGS and CLPP resulted in comprehensive (genetic and catabolic) identification of bacterial biodiversity in the rhizospheric soil of the selected T. aestivum L. cultivars. New knowledge acquired in this study could be important in the aspects of improvements in yield, food security, soil health, and/or performing agricultural practices.
It was evidenced that the changes observed in the soil microbial community were a consequence of a combined effect of both the wheat cultivar and rhizospheric soil chemistry. Generally, it was found that the Hondia and Rotax rhizospheric microbiomes (at the taxonomic genus level) were significantly different from the other cultivars, as five unique genera (not present in the rhizospheric soils of Nordkap and Tytanika): Aquicella, Chitinophaga, Legionella, Nitrosospira, and Segetibacter as well as Cellvibrio, Flavobacterium, Janthinobacterium, Kaistobacter, and Pedobacter were detected for the Hondia and Rotax rhizospheres, respectively. It should be emphasized that some of the underlying taxonomic variation would have arisen due to the fact that the rhizospheric soil of Hondia had a significantly lower (acidic) initial pH, whereas the rhizospheric soil of Rotax had a higher (neutral) initial pH value than the other soils. Therefore, the total uniqueness of these rhizospheres cannot be attributed to the plant effect alone but also to soil chemistry (pH). Three unique genera were identified in the Tytanika rhizosphere: Gemmatimonas, Rhodoplanes, and Saccharopolyspora, whereas two unique genera were present in the Nordkap rhizosphere: Desulfovibrio and Pedobacter. Among the other top-identified genera, only one bacterial genus Vogesella seemed to be common for all the soils.
The community level physiological profile analysis allowed recognition of microbial preferences for the intensity of carbon substrate utilization (catabolic fingerprinting). CLPP evidenced that the metabolic activity depended on both the type of substrate and wheat cultivars. The most easily utilized group of compounds for all rhizospheric soils were carbohydrates > carboxylic acids > amino acids > polymers > amines and amides. The highest metabolic activity (confirmed by the H’ index and PCA analysis) was found in the Rotax and Nordkap rhizospheric soils.
Summarizing, the combination of the CLPP method with the NGS technique provided new knowledge of the genetic and functional bacterial fingerprinting of rhizospheric soils from the selected T. aestivum L. cultivars. Furthermore, the hypothesis that rhizospheric bacterial diversity and bacterial metabolic activity depend both on the wheat cultivars and on soil chemistry (pH particularly) was verified.
Author Contributions
Conceptualization, A.W.; methodology, A.K. and A.G.; software, A.G.; investigation, A.K. and A.G.; writing—original draft preparation, A.W.; visualization, A.W. and A.G.; supervision, A.G.; funding acquisition, A.K. All authors have read and agreed to the published version of the manuscript.
Funding
The project was partly supported by the National Centre for Research and Development under the LIDER IX programme (0024/L-9/2017).
Acknowledgments
The authors thank Anna Sochaczewska in the technical staff for her help in the laboratory experiments.
Conflicts of Interest
The authors declare no conflict of interest.
Appendix A
Table A1.
Chemical properties of soils before seeding the wheat cultivars. Small letters in the upper index mean significant differences in the parameters between the wheat cultivars (Tukey’s mean separation test, p < 0.05), (n = 3).
Table A1.
Chemical properties of soils before seeding the wheat cultivars. Small letters in the upper index mean significant differences in the parameters between the wheat cultivars (Tukey’s mean separation test, p < 0.05), (n = 3).
| Soil before Seeding of Cultivars | pH (H2O) | Eh (mV) | TOC (%) | NH4-N | NO3-N | NO2-N | P-OLSEN |
|---|---|---|---|---|---|---|---|
| mg/kg | |||||||
| Hondia | 5.20 a | 341.24 a | 1.09 a | 1.11 a | 4.06 a | 0.11 a | 3.98 a |
| Nordkap | 6.27 b | 381.88 b | 0.74 b | 0.69 b | 3.07 b | 0.09 a | 3.79 a |
| Rotax | 7.36 c | 347.16 a | 0.76 b | 1.59 c | 4.83 c | 0.26 b | 5.11 b |
| Tytanika | 6.19 b | 399.40 c | 0.60 c | 0.45 d | 4.71 c | 0.08 a | 5.38 b |
Table A2.
Sequencing data quality for the analyzed samples.
Table A2.
Sequencing data quality for the analyzed samples.
| Rhizospheric Soil of Cultivars | Total Reads | Reads Passing Quality Filtering | Remaining Paired-End Assembled Reads | Remaining Filtered Sequences |
|---|---|---|---|---|
| Hondia | 145,364 | 128,179 | 102,543 | 87,161 |
| Nordkap | 245,115 | 213,263 | 168,011 | 123,153 |
| Rotax | 247,580 | 215,385 | 169,774 | 123,304 |
| Tytanika | 237,454 | 211,244 | 166,944 | 117,293 |
| TOTAL | 875,513 | 768,044 | 607,272 | 450,911 |
Table A3.
Correlation of the carbon source with the first (PCA1) and second (PCA2) components in soil (significance is bolded).
Table A3.
Correlation of the carbon source with the first (PCA1) and second (PCA2) components in soil (significance is bolded).
| Variables | PC1 (69.05%) | PC2 (19.68%) |
| Amines and Amides | −0.590 | −0.169 |
| Aminoacids | −0.839 | −0.051 |
| Carboxylic and acetic acids | −0.959 | 0.275 |
| Hydrocarbons | 0.876 | −0.215 |
| Polymers | 0.489 | −0.782 |
| AWCD | −0.736 | −0.636 |
| Shannon-Wiener | 0.921 | −0.262 |
| Evenness | −0.626 | −0.729 |
| Tytanika | −2.956 | −0.962 |
| Rotax | 2.637 | 0.174 |
| Hondia | −1.045 | 1.817 |
| Nordkap | 1.364 | −1.029 |
| Richness | 0.940 | −0.056 |
| Variables | PC1 (44.69%) | PC2 (27.89%) |
| beta-Methyl-D-Glucoside | 0.209 | 0.872 |
| D-Galactonic Acid gamma-Lactone | −0.199 | −0.742 |
| L-Arginine | −0.900 | 0.113 |
| Pyruvic Acid Methyl Ester | −0.894 | 0.199 |
| D-Xylose | 0.601 | −0.141 |
| D-Galacturonic Acid | −0.905 | −0.301 |
| L-Asparagine | −0.884 | 0.041 |
| Tween 40 | −0.066 | 0.141 |
| i-Erythritol | 0.771 | 0.545 |
| 2-Hydroxy Benzoic Acid | 0.173 | −0.687 |
| L-Phenylalanine | 0.956 | 0.148 |
| Tween 80 | −0.185 | 0.883 |
| D-Mannitol | −0.685 | 0.727 |
| 4-Hydroxy Benzoic Acid | −0.810 | 0.142 |
| L-Serine | −0.585 | 0.563 |
| Alpha-Cyclodextrin | 0.425 | −0.332 |
| N-Acetyl-D-Glucosamine | −0.188 | −0.975 |
| Gamma-Hydroxybutyric Acid | 0.039 | 0.713 |
| L-Threonine | 0.245 | −0.772 |
| Glycogen | 0.239 | −0.753 |
| D-Glucosaminic Acid | 0.181 | −0.961 |
| Itaconic Acid | 0.815 | 0.577 |
| Glycyl-L-Glutamic Acid | −0.288 | 0.177 |
| D-Cellobiose | 0.966 | 0.157 |
| Glucose-1-Phosphate | 0.858 | 0.348 |
| Alpha-Ketobutyric Acid | 0.827 | 0.520 |
| Phenylethylamine | −0.989 | −0.141 |
| Alpha-D-Lactose | 0.782 | −0.141 |
| D,L-alpha-Glycerol Phosphate | −0.844 | −0.167 |
| D-Malic Acid | −0.772 | 0.208 |
| Putrescine | −0.890 | 0.412 |

Figure A1.
Rarefaction curves for the studied samples. Reads were clustered into OTUs (Operational Taxonomic Units) based on a 97% similarity threshold.


Figure A2.
Significant variations in the phylum relative abundances between the wheat cultivars (n = 3, p < 0.05).


Figure A3.
Significant variations in the class relative abundances between the wheat cultivars (n = 3, p < 0.05).
References
- Roesch, L.F.W.; Fulthorpe, R.R.; Riva, A.; Casella, G.; Hadwin, A.K.M.; Kent, A.D.; Daroub, S.H.; Camargo, F.A.O.; Farmerie, W.G.; Triplett, E.W. Pyrosequencing enumerates and contrasts soil microbial diversity. ISME J. 2007, 1, 283–290. [Google Scholar] [CrossRef] [PubMed]
- Murphy, C.A.; Foster, B.L.; Gao, C. Temporal dynamics in rhizosphere bacterial communities of three perennial grassland species. Agronomy 2016, 6, 17. [Google Scholar] [CrossRef]
- Hassan, M.K.; McInroy, J.A.; Kloepper, J.W. The interactions of rhizodeposits with plant growth-promoting rhizobacteria in the rhizosphere: A review. Agriculture 2019, 9, 142. [Google Scholar] [CrossRef]
- Gałązka, A.; Grzęda, E.; Jończyk, K. Changes of microbial diversity in rhizosphere soils of new quality varieties of winter wheat cultivation in organic farming. Sustainability 2019, 11, 4057. [Google Scholar] [CrossRef]
- Sheirdil, R.A.; Hayat, R.; Zhang, X.X.; Abbasi, N.A.; Ali, S.; Ahmed, M.; Khattak, J.Z.K.; Ahmad, S. Exploring potential soil bacteria for sustainable wheat (Triticum aestivum L.) production. Sustainability 2019, 11, 3361. [Google Scholar] [CrossRef]
- Alawiye, T.T.; Babalola, O.O. Bacterial diversity and community structure in typical plant rhizosphere. Diversity 2019, 11, 179. [Google Scholar] [CrossRef]
- Berg, G.; Smalla, K. Plant species and soil type cooperatively shape the structure and function of microbial communities in the rhizosphere. FEMS Microbiol. Ecol. 2009, 68, 1–13. [Google Scholar] [CrossRef] [PubMed]
- Gregory, P.J. Roots, rhizosphere and soil: The route to a better understanding of soil science? Eur. J. Soil Sci. 2006, 57, 2–12. [Google Scholar] [CrossRef]
- Furtak, K.; Gawryjołek, G.; Gajda, A.M.; Gałązka, A. Effects of maize and winter wheat grown under different cultivation techniques on biological activity of soil. Plant Soil Environ. 2017, 63, 449–454. [Google Scholar] [CrossRef]
- Gałązka, A.; Gawryjołek, K.; Grządziel, J.; Frąc, M.; Księżak, J. Microbial community diversity and the interaction of soil under maize growth in different cultivation techniques. Plant Soil Environ. 2017, 63, 264–270. [Google Scholar] [CrossRef]
- Rosenzweig, N.; Bradeen, J.M.; Tu, Z.J.; McKay, S.J.; Kinkel, L.L. Rhizosphere bacterial communities associated with long-lived perennial prairie plants vary in diversity, composition and structure. Can. J. Microbiol. 2013, 59, 494–502. [Google Scholar] [CrossRef]
- Kowalchuk, G.A.; Buma, D.S.; de Boer, W.; Klinkhamer, P.G.L.; van Veen, J.A. Effects of aboveground plant species composition and diversity on the diversity of soil-borne microorganisms. Antonie Leeuwenhoek 2002, 81, 509–520. [Google Scholar] [CrossRef] [PubMed]
- Hassan, M.K.; McInroy, J.A.; Jones, J.; Shantharaj, D.; Liles, M.R.; Kloepper, J.W. Pectin-rich amendment enhances soybean growth promotion and nodulation mediated by Bacillus velezensis strains. Plants 2019, 8, 120. [Google Scholar] [CrossRef] [PubMed]
- Zhang, X.; Zhang, R.; Gao, J.; Wang, X.; Fan, F.; Ma, X.; Yin, H.; Zhang, C.; Feng, K.; Deng, Y. Thirty-one years of rice-rice-green manure rotations shape the rhizosphere microbial community and enrich beneficial bacteria. Soil Biol. Biochem. 2017, 104, 208–217. [Google Scholar] [CrossRef]
- Babalola, O.O. Beneficial bacteria of agricultural importance. Biotechnol. Lett. 2010, 32, 1559–1570. [Google Scholar] [CrossRef] [PubMed]
- Olanrewaju, O.; Glick, B.; Babalola, O. Mechanisms of action of plant growth promoting bacteria. World J. Microbiol. Biotechnol. 2017, 33, 197. [Google Scholar] [CrossRef] [PubMed]
- Dutta, S.; Surovy, M.Z.; Gupta, D.R.; Mahmud, N.U.; Chanclud, E.; Win, J.; Kamoun, S.; Islam, T. Genomic analyses reveal that biocontrol of wheat blast by Bacillus spp. may be linked with production of antimicrobial compounds and induced systemic resistance in host plants. Figshare 2018. [Google Scholar] [CrossRef]
- Guo, Q.; Li, Y.; Lou, Y.; Shi, M.; Jiang, Y.; Zhou, J.; Sun, Y.; Xue, Q.; Lai, H. Bacillus amyloliquefaciens Ba13 induces plant systemic resistance and improves rhizosphere micro ecology against tomato yellow leaf curlvirus disease. Appl. Soil Ecol. 2019, 137, 154–166. [Google Scholar] [CrossRef]
- Duy, M.; Hoi, N.; Ve, N.; Thuc, L.; Trang, N. Influence of cellulomonas Flavigena, Azospirillum sp. and Pseudomonas sp. on rice growth and yield grown in submerged soil amended in rice straw. Recent Trends PGPR Res. Sustain. Crop Product. 2016, 8, 238–242. [Google Scholar]
- Kumawat, K.; Sharma, P.; Sirari, A.; Singh, I.; Gill, B.; Singh, U.; Saharan, K. Synergism of Pseudomonas aeruginosa (LSE-2) nodule endophyte with Bradyrhizobium sp. (LSBR-3) for improving plant growth, nutrie nt acquisition and soil health in soybean. World J. Microbiol. Biotechnol. 2019, 35, 47. [Google Scholar] [CrossRef]
- Harman, G.E.; Uphoff, N. Symbiotic root-endophytic soil microbes improve crop productivity and provide environmental benefits. Scientifica 2019, 2019, 9106395. [Google Scholar] [CrossRef] [PubMed]
- Periera, L.B.; Andrade, G.S.; Meneghin, S.P.; Vicentini, R.; Ottoboni, L.M.M. Prospecting plant-growth prooting bacteria isolated from the rhizosphere sugarcane under drought stress. Curr. Microbiol. 2019, 76, 1345–1354. [Google Scholar] [CrossRef] [PubMed]
- Grządziel, J.; Gałązka, A. Microplot long-term experiment reveals strong soil type influence on bacteria composition and its functional diversity. Appl. Soil Ecol. 2018, 124, 117–123. [Google Scholar] [CrossRef]
- White, R., III; Rivas-Ubach, A.; Borkum, M.; Köberl, M.; Bilbao, A.; Colby, S.; Hoyt, D.; Bingol, K.; Kim, Y.; Wendler, J. The state of rhizospheric science in the era of multi-omics: A practical guide to omics technologies. Rhizosphere 2017, 3, 212–221. [Google Scholar] [CrossRef]
- Yang, R.; Liang, X.; Torrion, J.A.; Walsh, O.S.; O’Brien, K.; Liu, Q. The influence of water and nitrogen availability on the expression of end-use quality parameters of spring wheat. Agronomy 2019, 8, 257. [Google Scholar] [CrossRef]
- Begcy, K.; Weigert, A.; Ogolla Egesa, A.; Dresselhous, T. Compared to Australian cultivars, European summer wheat (Triticum aestivum) overreacts when moderate heat stress is applied as the pollen development stage. Agronomy 2018, 8, 99. [Google Scholar] [CrossRef]
- Shiferaw, B.; Smale, M.; Braun, H.J.; Duveiller, E.; Reynolds, M.; Muricho, G. Crops that feed the world 10. Past successes and future challenges to the role played by wheat in global food security. Food Secur. 2013, 5, 291–317. [Google Scholar] [CrossRef]
- Nelson, A.G.; Frick, B.; Niziol, D.; Clapperton, J.; Spaner, D.; Quideau, S. Spring wheat genotypes differentially alter soil microbial communities and wheat bread making quality in organic and conventional systems. Can. J. Plant Sci. 2011, 91, 485–495. [Google Scholar] [CrossRef]
- Friedrich, T.; Kassam, A. No-till farming and the environment: Do no-till system require more chemicals? Out. Pest Manag. 2012, 8, 153–157. [Google Scholar] [CrossRef]
- Alarcon, R.; Hernandez-Plaza, E.; Navarette, L.; Sanchez, M.J.; Escudero, A.; Hernanz, J.L.; Sanchez-Giron, V.; Sanchez, A.M. Effects of no-tillage and no-inversion tillage on weed community diversity and crop yield over nine years in a Mediterranean cereal-legume cropland. Soil Till. Res. 2018, 179, 54–62. [Google Scholar] [CrossRef]
- Praeg, N.; Pauli, H.; Illmer, P. Microbial diversity in bulk and rhizosphere soil of Ranunculus glacialis along a high alpine altitudinal gradient. Front. Microbiol. 2019, 10, 1429. [Google Scholar] [CrossRef] [PubMed]
- PNR-0431. Chemical, Biological and Agricultural Soil Analyses; Soil Sampling; PKN: Warsaw, Poland, 1997. (In Polish) [Google Scholar]
- Wolińska, A.; Kuźniar, A.; Zielenkiewicz, U.; Banach, A.; Izak, D.; Stępniewska, Z.; Błaszczyk, M. Metagenomic analysis of some potential nitrogen-fixing bacteria in arable soils at different formation processes. Microb. Ecol. 2017, 73, 162–176. [Google Scholar] [CrossRef] [PubMed]
- Wolińska, A.; Kuźniar, A.; Zielenkiewicz, U.; Izak, D.; Szafranek-Nakonieczna, A.; Banach, A.; Błaszczyk, M. Bacteroidetes as a sensitive indicator of agricultural soil usage revealed by culture-independent approach. Appl. Soil Ecol. 2017, 119, 128–137. [Google Scholar] [CrossRef]
- Wolińska, A.; Kuźniar, A.; Zielenkiewicz, U.; Banach, A.; Błaszczyk, M. Indicators of arable soils fatigue—Bacterial families and genera: A metagenomic approach. Ecol. Ind. 2018, 93, 490–500. [Google Scholar] [CrossRef]
- Thijs, S.; Op De Beeck, M.; Beckers, B.; Truyens, S.; Stevens, V.; Van Hamme, J.D.; Weyens, N.; Vangronsveld, J. Comparative evaluation of four bacteria-specific primer pairs for 16S rRNA gene surveys. Front. Microbiol. 2017, 8, 494. [Google Scholar] [CrossRef] [PubMed]
- Caporaso, J.G.; Kuczyński, J.; Stombaugh, J.; Bittinger, K.; Bushman, F.D.; Costello, E.K.; Fierer, N.; Peña, A.G.; Goodrich, J.K.; Gordon, J.I.; et al. QIIME allows analysis of high-throughput community sequencing data. Nat. Met. 2010, 7, 335–336. [Google Scholar] [CrossRef]
- DeSantis, T.Z.; Hugenholtz, P.; Larsen, N.; Rojas, M.; Brodie, E.L.; Keller, K.; Dalevi, D.; Hu, P.; Andersen, G.L. Greengenes, a chimera-checked 16S rRNA gene database and workbench compatible with ARB. Appl. Environ. Microbiol. 2006, 72, 5069–5072. [Google Scholar] [CrossRef] [PubMed]
- Martin, M. Cutadapt removes adapter sequences from high-throughput sequencing reads. EMBnet J. 2011, 17, 10–12. [Google Scholar] [CrossRef]
- Aronesty, E. ea-Utilis: Command-Line Tools for Processing Biological Sequencing Data. 2011. Available online: http://code.google.com/p/ea-utils (accessed on 4 February 2020).
- Edgar, R.C. Search and clustering orders of magnitude faster than BLAST. Bioinformatics 2010, 26, 2460–2461. [Google Scholar] [CrossRef]
- Pohland, B.; Owen, B. Biolog EcoPlates standard methods. TAS Tech. Biul. Biol. 2009, 1, 1–3. [Google Scholar]
- Frac, M.; Oszust, K.; Lipiec, J. Community level physiological profiles (CLPP), characterization and microbial activity of soil amended with dairy sewage sludge. Sensors 2012, 12, 3253–3268. [Google Scholar] [CrossRef] [PubMed]
- Bucher, R.; Andres, C.; Wedel, M.F.; Entling, M.H.; Nickel, H. Biodiversity in low-intensity pastures, straw meadows, and fallows of a fen area—A multitrophic comparison. Agric. Ecosyst. Environ. 2016, 1, 190–196. [Google Scholar] [CrossRef]
- Wolińska, A.; Frąc, M.; Oszust, K.; Szafranek-Nakonieczna, A.; Zielenkiewicz, U.; Stępniewska, Z. Microbial biodiversity of meadows under different modes of land use: Catabolic and genetic fingerprinting. World J. Microbiol. Biotechnol. 2017, 33, 154. [Google Scholar] [CrossRef] [PubMed]
- Swędrzyńska, D.; Grześ, S. Microbiological parameters of soil under sugar beet as a response to the long term-application of different tillage systems. Pol. J. Environ. Stud. 2015, 24, 285–294. [Google Scholar] [CrossRef]
- Wolińska, A.; Rekosz-Burlaga, H.; Goryluk-Salmonowicz, A.; Błaszczyk, M.; Stępniewska, Z. Bacterial abundance and dehydrogenase activity in selected agricultural soils from Lublin region. Pol. J. Environ. Stud. 2015, 24, 2677–2682. [Google Scholar] [CrossRef]
- Wakelin, S.A.; Gupta, V.V.S.R.; Forrester, S.T. Regional and local factors affecting diversity, abundance and activity of free-living, N2-fixing bacteria in Australian agricultural soils. Pedobiologia 2010, 53, 391–399. [Google Scholar] [CrossRef]
- Simon, Z.; Mtei, K.; Gessesse, A.; Ndakidemi, P.A. Isolation and characterization of nitrogen fixing rhizobia from cultivated and uncultivated soils of northern Tanzania. Am. J. Plant Sci. 2014, 5, 4050–4067. [Google Scholar] [CrossRef]
- Romero, I.C.; Jacobson, M.; Fuhrman, J.A.; Fogel, M.; Capone, D.G. Long-term nitrogen and phosphorus fertilization effects on N2 fixation rates and nifH gene community patterns in mangrove sediments. Mar. Ecol. 2012, 33, 117–127. [Google Scholar] [CrossRef]
- Wolińska, A.; Szafranek-Nakonieczna, A.; Banach, A.; Błaszczyk, M.; Stępniewska, Z. The impact of agricultural soil usage on activity and abundance of ammonifying bacteria in selected soils from Poland. SpringerPlus 2016. [Google Scholar] [CrossRef]
- Banach, A.; Wolińska, A.; Błaszczyk, M.; Stępniewska, Z. The influence of soil properties and land use on the phosphate level in soils from Lubelskie region. Pol. J. Agron. 2015, 22, 3–9. [Google Scholar]
- Robben, C.; Fister, S.; Witte, A.K.; Schoder, D.; Rossmanith, P.; Mester, P. Induction of the viable but non-culturable state in bacterial pathogens by household cleaners and inorganic salts. Sci. Rep. 2018, 8, 15132. [Google Scholar] [CrossRef] [PubMed]
- Deng, J.; Jing, J.; Zhu, W.; Zhou, Y. Variations in soil bacteria community diversity and structures among different revegetation types in the Baishilazi nature reserve. Front. Microbiol. 2018, 9, 2874. [Google Scholar] [CrossRef] [PubMed]
- Fierer, N. Embracing the unknown: Disentangling the complexities of the soil microbiome. Nat. Rev. Microbiol. 2017, 15, 579–590. [Google Scholar] [CrossRef] [PubMed]
- Wood, J.L.; Tang, C.; Franks, A.E. Competitive traits are more important than stress-tolerance traits in a cadmium-contaminated rhizosphere: A role for trait theory in microbial ecology. Front. Microbiol. 2018, 9, 121. [Google Scholar] [CrossRef] [PubMed]
- Suarez, C.; Ratering, S.; Kramer, I.; Schnell, S. Cellvibrio diazotrophicus sp. nov., a nitrogen-fixing bacteria isolated from the rhizosphere of salt meadow plants and emended description of the genus. Cellvibrio. Int. J. Syst. Evol. Microbiol. 2014, 64, 481–486. [Google Scholar] [CrossRef] [PubMed]
- Kobayashi, A.; Kobayashi, Y.O.; Someya, N.; Ikeda, S. Community analysis of root- and tuber-associated bacteria in field-grown potato plants harboring different resistance levels against common scab. Microbes Environ. 2015, 30, 301–309. [Google Scholar] [CrossRef]
- Chung, E.J.; Park, T.S.; Jeon, C.O.; Chung, Y.R. Chitinophaga oryziterrae sp. nov., isolated from the rhizosphere soil of rice (Oryza sativa L.). Int. J. Syst. Evol. Microbiol. 2012, 62, 3030–3035. [Google Scholar] [CrossRef]
- Kavamura, V.N.; Hayat, R.; Clark, I.M.; Rossmann, M.; Mendes, R.; Hirsch, P.R.; Mauchline, T.H. Inorganic nitrogen application affects both taxonomical and predicted functional structure of wheat rhizosphere bacterial communities. Front. Microbiol. 2018, 9, 1074. [Google Scholar] [CrossRef]
- Koberl, M.; Dita, M.; Martinuz, A.; Staver, C.; Berg, G. Members of Gammaproteobacteria as indicator species of healthy banana plants on Fusarium wilt-infested fields in Central America. Sci. Rep. 2017, 7, 45318. [Google Scholar] [CrossRef]
- Koch, I.H.; Gich, F.; Dunfield, P.F.; Overmann, J. Edaphobacter modestus gen. nov., sp. nov., and Edaphobacter aggregans sp. nov., acidobacteria isolated from alpine and forest soils. Int. J. Syst. Evol. Microbiol. 2008, 58, 1114–1122. [Google Scholar] [CrossRef]
- Hong, Y.; Liao, D.; Hu, A.; Wang, H.; Chen, J.; Khan, S.; Su, J.; Li, H. Diversity of endophytic and rhizoplane bacterial communities associated with exotic Spartina alterniflora and native mangrove using Illumina amplicon sequencing. Can. J. Microbiol. 2015, 61, 723–733. [Google Scholar] [CrossRef]
- Beirn, L.A.; Hempfling, J.W.; Schmid, C.J.; Murphy, J.A.; Clarke, B.B.; Crouch, J.O. Differences among soil-inhabiting microbial communities in Poa Anna turf throughout the growing season. Crop Sci. 2017, 57, 262–273. [Google Scholar] [CrossRef]
- Zhang, J.; Wu, D.; Zhang, J.; Liu, Z.; Song, F. Saccharopolyspora shandongensis sp. nov., isolated from wheat-field soil. Int. J. Syst. Evol. Microbiol. 2008, 58, 1094–1099. [Google Scholar] [CrossRef] [PubMed]
- Rameshkumar, N.; Lang, E.; Tanaka, N. Description of Vogesella oryzae sp. nov., isolated from the rhizosphere of saline tolerant pokkali rice. Syst. Appl. Microbiol. 2016, 39, 20–24. [Google Scholar] [CrossRef] [PubMed]
- Kuźniar, A.; Włodarczyk, K.; Grządziel, J.; Goraj, W.; Gałązka, A.; Wolińska, A. Culture-independent analysis of an endophytic core microbiome in two species of wheat: Triticum aestivum L. (cv. ‘Hondia’) and the first report of microbiota in Triticum spelta L. (cv. ‘Rokosz’). Syst. Appl. Microbiol. 2019. [Google Scholar] [CrossRef]
- Si, P.; Shao, W.; Yu, H.; Yang, X.; Gao, D.; Qiao, X.; Wang, Z.; Wu, G. Rhizosphere microenvironments of eight common deciduous fruit trees were shaped by microbes in Northern China. Front. Microbiol. 2018, 9, 3147. [Google Scholar] [CrossRef]
© 2020 by the authors. Licensee MDPI, Basel, Switzerland. This article is an open access article distributed under the terms and conditions of the Creative Commons Attribution (CC BY) license (http://creativecommons.org/licenses/by/4.0/).